Article

Optimal Probabilistic Allocation of Photovoltaic Distributed Generation: Proposing a Scenario-Based Stochastic Programming Model

by
Ali Reza Kheirkhah
1,2,*,
Carlos Frederico Meschini Almeida
2,
Nelson Kagan
2 and
Jonatas Boas Leite
1,*
1
Department of Electrical Engineering, Sao Paulo State University—UNESP, Ilha Solteira 15385-000, SP, Brazil
2
Department of Energy Engineering and Electrical Automation, University of Sao Paulo—USP, Sao Paulo 05508-020, SP, Brazil
*
Authors to whom correspondence should be addressed.
Energies 2023, 16(21), 7261; https://doi.org/10.3390/en16217261
Submission received: 26 August 2023 / Revised: 19 September 2023 / Accepted: 20 September 2023 / Published: 26 October 2023

Abstract

:
The recent developments in the design, planning, and operation of distribution systems indicate the need for a modern integrated infrastructure in which participants are managed through the perceptions of a utility company in an economic network (e.g., energy loss reduction, restoration, etc.). The penetration of distributed generation units in power systems are growing due to their significant influence on the key attributes of power systems. As a result, the placement, type, and size of distributed generations have an essential role in reducing power loss and lowering costs. Power loss minimization, investment and cost reduction, and voltage profile improvement combine to form a conceivable goal function for distributed generation allocation in a constrained optimization problem, and they require a complex procedure to control them in the most appropriate way while satisfying network constraints. Such a complex decision-making procedure can be solved by adjusting the dynamic optimal power flow problem to the associated network. The purpose of the present work is to handle the distributed generation allocation problem for photovoltaic units, attempting to reduce energy and investment costs while accounting for generation unpredictability as well as load fluctuation. The problem is analyzed under various scenarios of solar radiation through a stochastic programming technique because of the intense uncertainty of solar energy resources. The formulation of photovoltaic distributed generation allocation is represented as a mixed-integer second-order conic programming problem. The IEEE 33-bus and real-world 136-bus distribution systems are tested. The findings illustrate the efficacy of the proposed mathematical model and the role of appropriate distributed generation allocation.

Graphical Abstract

1. Introduction

1.1. Background

A distribution network is an essential component in the process of supplying electrical power to individual consumers from the transmission system [1]. In this process, it is vital to provide customers with electrical energy that is both safe and affordable [2]. Because of the radial topology of the distribution system and the larger current-to-voltage ratio, it is responsible for seventy percent of the overall losses [1]. It also has an effect on both the operating cost and the voltage profile, so minimizing distribution losses as much as possible is an essential goal [3].
Distribution losses may be minimized by placing capacitors, allocating distributed generation (DGs) resources, and reconfiguring feeders [4]. Approximately 90 percent of power outages occur in the distribution network [5], which generally provides a single source of energy for each customer; therefore, in the power system, the distribution network plays a crucial role in failures [6].
Biomass, solar photovoltaic (PV), fuel cells, wind turbines, and energy storage systems (ESSs) are just some of several flexible and appropriate power sources available today [7]. Despite the fact that DGs are currently more readily accessible, compacted, and economical, huge power plants are still required for electricity production owing to urbanization and power system reliability. The integration of huge power plants and small, locally installed generators to fulfill peak demand is driven in part by this innovative approach [8].
The objective of the DG allocation problem in distribution systems is to determine the site, size, and type of distributed generators, i.e., the optimized kind of DG with the optimum potential should be deployed at the best network site [9]. In light of this, DG allocation is essential for optimizing the operating conditions of the power grid [10]. Minimization of distribution losses (active and reactive power), power flow over weak lines, and generation expenses are some of the goals of the DG allocation problem (DG installation, operation, and maintenance expenses) [11] in addition to maximum voltage stability, spinning reserve, system security and reliability [12], and DG and line capacities.

1.2. Literature Review

In the literature, DG allocation (DGA) is an optimization problem that can be handled employing conventional and metaheuristic approaches. Conventional optimization approaches have been useful for solving the DGA problem ever since it was first presented. Metaheuristics were later employed in DGA to discover viable alternatives with less processing strain than mathematical approaches. In the following, a review of some articles is explained by two categories conventional and metaheuristic optimization procedures.
In conventional optimization procedures, the DG allocation problem is commonly solved using traditional approaches based on mathematical programming. They are effective strategies for addressing linear optimization issues that provide the best result. However, these strategies may need a significant amount of computing work to solve large-scale optimization problems. Many studies on DG allocation have used mathematical methodologies up to now.
To handle the optimal DG allocation problem, Rueda-Medina et al. [13] suggested a mixed-integer linear programming (MILP) technique. By using this approach, it was possible to determine the most cost-effective configuration of DG units, taking into account a variety of factors such as topologies, loads, and other factors. The network’s steady state, short circuits, and DG capability curves were all represented using linear formulas.
Mahmoud et al. [14] suggested an effective strategy for loss reduction in DGA that takes into account the type of DG. An analytical method was integrated with optimum power flow (OPF). The proposed method was shown to be quicker and more accurate than other traditional methods.
Mena and Garcia [15] provided an effective mixed-integer non-linear programming (MINLP) method for solving the DGA issue, taking into account the network losses and generating costs of both traditional and distributed generators. In this technique, the issue is separated into two sub-problems, the first of which determines the ideal placement for each DG, whereas the second determines the optimal generation capacity for each location.
In addition, Murty and Kumar [16] created a new metric for DGA that they called voltage stability. Its goal was to minimize active and reactive losses while taking into account the potential for future load development with a variety of load factors. The results of the simulation showed that using DGs with a lagged power factor was most effective in reducing power losses.
Konstantelos et al. [17] explored the strategic evaluation of smart grid technology options within distribution networks. Their study delves into the valuation of these technologies, shedding light on their significance in enhancing the efficiency and reliability of distribution networks. By providing a comprehensive overview of strategic valuation approaches, this source significantly contributes to the understanding of the role of smart grid technologies in modernizing and optimizing power distribution systems.
It has recently been stated as a MILP problem in AMPL [18] by Rueda-Medina et al. [13], who used CPLEX to solve the DGA problem. Power loss reduction in radial distribution systems under load and generation uncertainty is addressed by an adaptable genetic algorithm (GA) [19].
Conejo et al. [20] delved into the intricate realm of decision-making within electricity markets under uncertainty. Their work comprehensively explores strategies and models for navigating the challenges presented by dynamic energy markets. By offering valuable insights into the complexities of decision-making under uncertainty, this source contributes significantly to the broader understanding of efficient decision making within the energy sector.
Karimyan et al. [21] used particle swarm optimization (PSO) to address the long-term DGA issue for mitigating line losses and voltage profile while taking into account load changes and the kind of DG. The findings demonstrated that the strategy that was presented is flexible and has high performance. A greedy randomized adaptive search procedure (GRASP) with Tabu search was used to optimize the allocation and dimension of DGs in order to minimize the overall losses in the power distribution feeders [22,23].
Giannelos et al. [24] provided mathematical modeling approaches to describe the operation of key smart grid technologies, aiming to enable network planners to make efficient investment decisions while respecting thermal and voltage network constraints.
In the following, the proposed DGA is presented in the form of a constrained stochastic optimization problem. Within this framework, the components of the objective function as well as the constraints are discussed. Based on the foregoing review, it is clear that scientific research has been conducted to tackle the DG allocation problem. The active power loss mitigation and voltage profile enhancement are the primary goals of DG allocation problem. The majority of the research on the optimal DG allocation tries to keep active losses to a minimum.
In this article, we propose a stochastic programming model for the allocation of solar DGs, aiming to minimize energy and investment costs while taking into account generation unpredictability and load fluctuation. A stochastic programming technique is used to analyze the issue under various solar radiance scenarios due to the significant uncertainty around the solar energy resource. Following this, an optimization problem is developed to optimally allocate the photovoltaic power generation systems, which is expressed as a mixed-integer second-order conic programming (MISOCP) problem. The proposed DGA is presented in the form of a constrained stochastic optimization problem. Within this framework, the components of the objective function as well as the constraints are described.
Our research introduces several novel aspects in the field of DG allocation within distribution networks. Firstly, we emphasize the intricate interplay of factors including site selection, type classification, and quantity determination of PV units as pivotal decision factors. This comprehensive approach offers a up-to-date perspective on optimal DG allocation, acknowledging the complex decision-making involved.
Secondly, our work incorporates stochastic programming to effectively address uncertainties, such as load fluctuations and variable PV generation. This is a noteworthy innovation as it provides a robust framework for real-world application, enhancing the practicality and reliability of DG deployment strategies.
The practical utilization of our research is twofold. Firstly, it provides valuable insights and methodologies for energy engineers and decision makers tasked with optimizing distribution networks. By offering a comprehensive understanding of optimal DG allocation, our work equips practitioners with actionable strategies for achieving substantial cost savings while enhancing network performance. This practical guidance aligns with the ongoing transition toward sustainable and resilient energy systems. Moreover, our approach is transferable to diverse fields beyond electrical engineering. The principles of optimal resource allocation under uncertainty have broad applicability, making our findings relevant in contexts where efficient decision-making is paramount.

1.3. Contributions

The specific contributions of this article are summarized as below:
  • Optimal DG allocation: We underscore the paramount significance of optimal DG allocation within distribution networks. Our exploration involves identifying the optimal site (among grid nodes), type (from three classifications), and quantity (integer variable) of PV units as the problem’s decision factors for optimal DG allocation. Through our research, we illustrate the substantial potential for cost savings, encompassing both investment and operational expenses. This holistic approach directly addresses the imperative for efficient resource allocation in distribution networks.
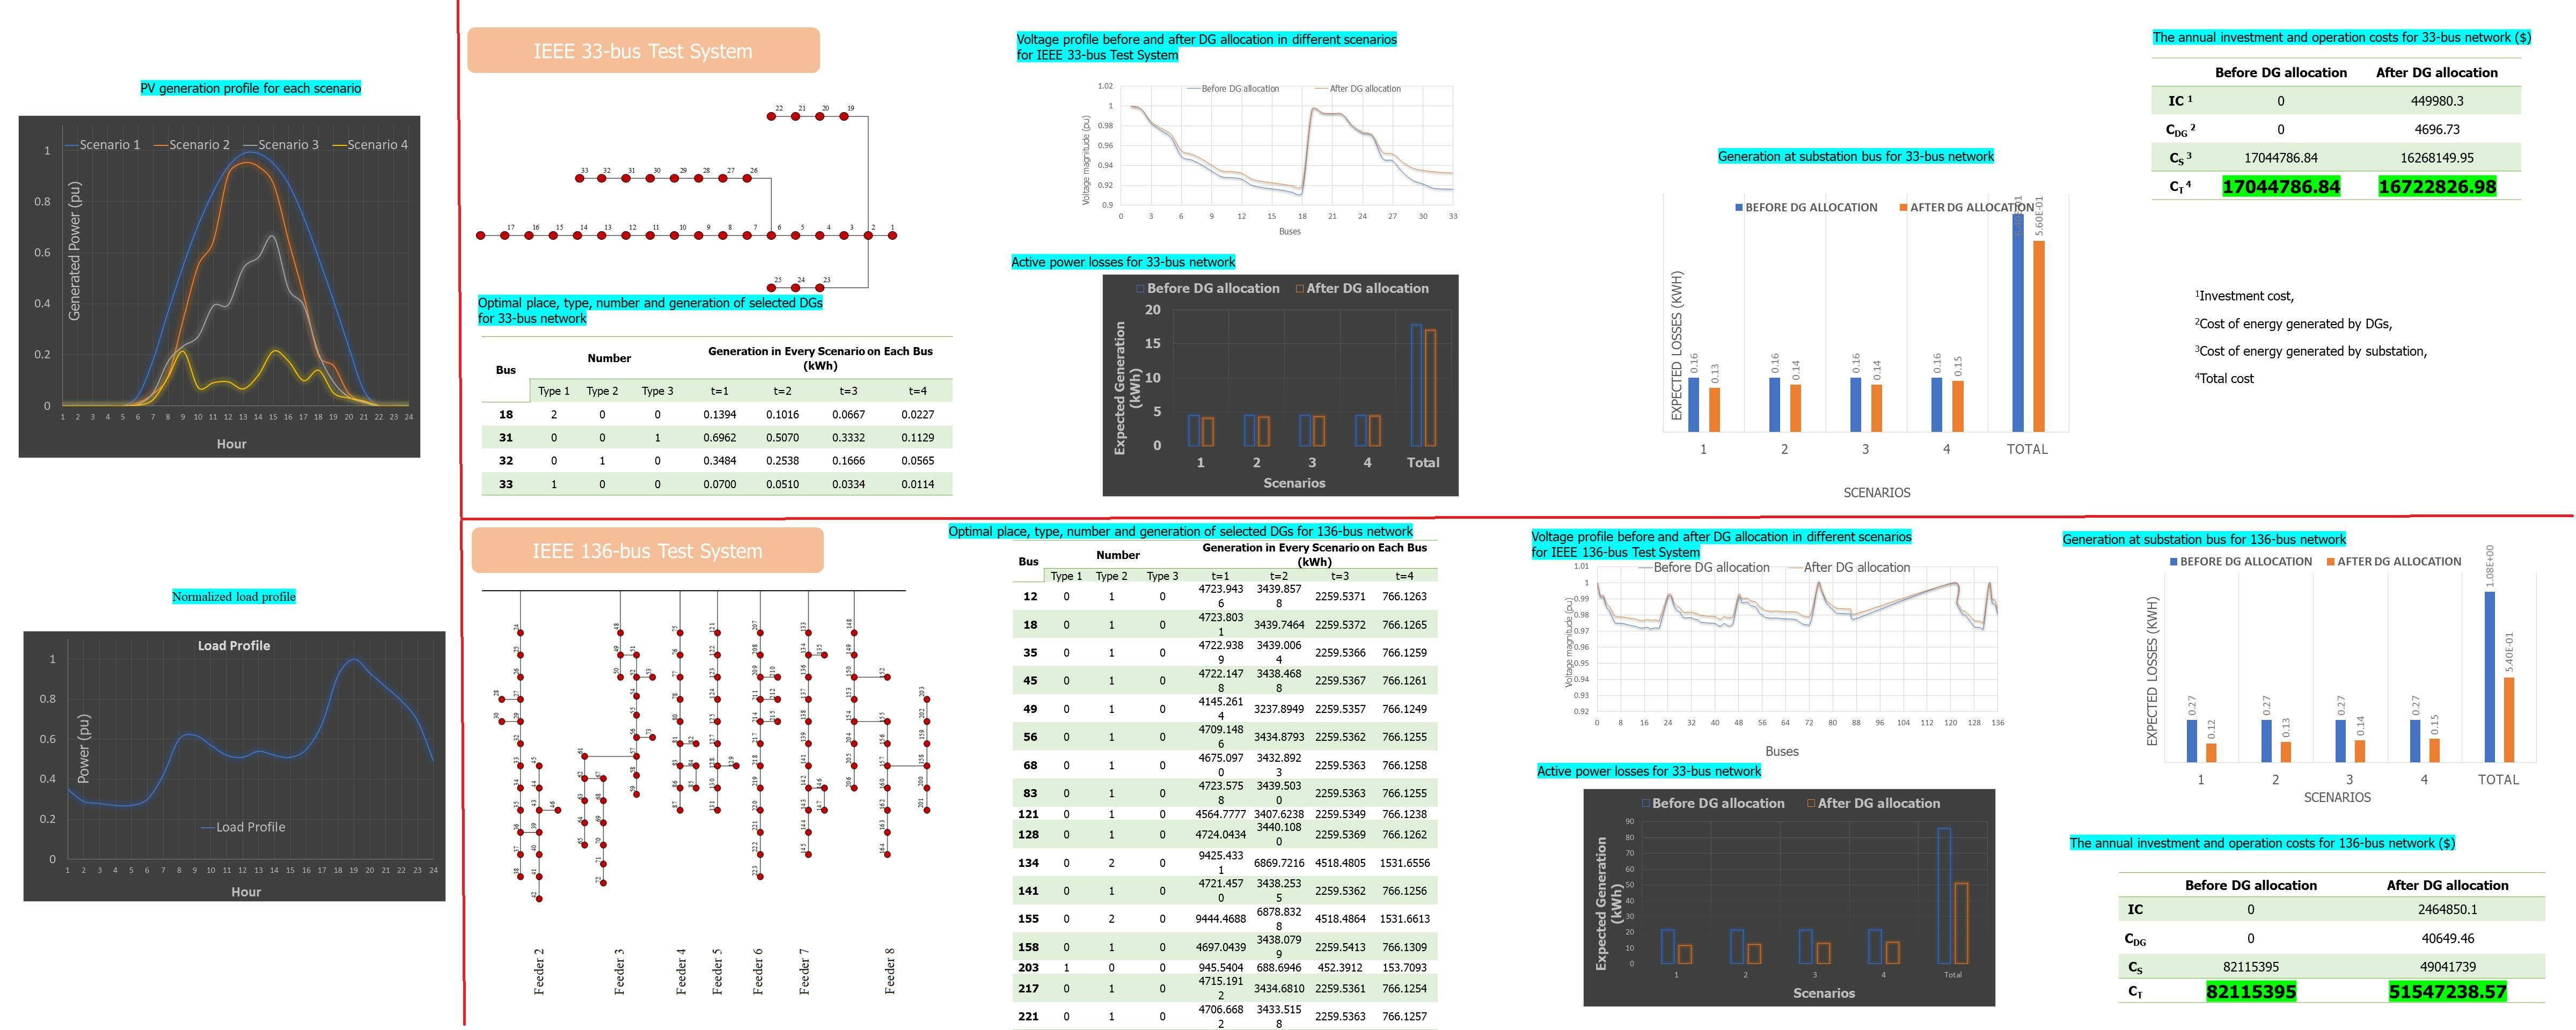
  • Effective uncertainty handling: Our research tackles the challenge of uncertainty management in DG allocation. We incorporate uncertainties such as load fluctuations and variable PV generation into our stochastic formulation. The DGA problem is formulated as a stochastic programming problem because of generation uncertainties (related to solar irradiation) and their occurrence likelihood. In stochastic formulation, varying load levels of the hour-by-hour load profile over the course of a day illustrate load variations. This aspect of our work enhances the practicality and reliability of DG deployment strategies.
  • Holistic cost minimization: Our primary objective is to minimize the overall cost of distribution networks, encompassing not only energy generation costs but also the financial implications of DG units. This comprehensive approach offers valuable insights into cost reduction, reinforcing the practicality of DG integration.
  • Sustainable energy initiatives: We advocate for DG unit integration as a means to bolster the sustainability of distribution networks. By generating power closer to load points, DG units effectively reduce network losses, contributing to a greener and more efficient energy distribution system. Our research aligns with global efforts to transition toward sustainable and resilient energy systems, emphasizing the practical steps required to achieve these objectives.
  • Solver efficiency: We utilize the CPLEX solver within the AMPL framework to tackle the complex mixed-integer conic optimization problem inherent in our model. The decision-making procedure can be solved by adjusting the dynamic optimal power flow (DOPF) problem to the associated network as a MISOCP problem. This choice ensures the derivation of high-quality solutions, a crucial aspect for the practical implementation of optimal DG allocation strategies.
  • Real-world validation: Our research undergoes rigorous validation, first on the IEEE 33-bus distribution system and, subsequently, on a real-world 136-bus distribution network in Três Lagoas, Brazil. This validation encompasses scenarios with and without DG units, addressing daily load variations and PV generation uncertainty.
The remainder of the paper is structured as follows: In Section 2, we elucidate the mathematical problem formulation and outline our solution methodology, accompanied by the presentation of the associated mathematical formulation. Section 3 is dedicated to the description of the case study, the presentation of results, and an in-depth discussion of our findings. Finally, in Section 4, we explore the potential avenues for future research and offer concluding remarks.

2. Problem Formulation

Investing decisions are based on the optimum number of DG units in the most appropriate network buses in order to achieve the lowest possible installation cost. Integer variables y i , g (number, type, and allocation of DG units) and the real variables active and reactive powers of branches ( P i j , d , t and Q i j , d , t ) , branch currents ( I i j , d , t ) , active and reactive power produced by DG units ( P i , d , g , t D G and Q i , d , g , t D G ) and substations ( P i , d , t S and Q i , d , t S ) , as well as nodal voltages ( V i , d , t ) , are used in the decision process.
A set of incoming buses and terminating buses, which are linked via distribution lines, are used to illustrate the network. On each load bus, DG units may be placed. The installation cost, the cost of energy provided by DG units, and the cost of energy supplied by the substation are the three components that make up the objective function. Figure 1 depicts the model for the DGA problem, which is derived from minimizing total costs for various load levels.
min C T = I C + C E D G + C E s
where:
I C = i Ω b g Ω g c g y i , g P g max
C E D G = t Ω t g Ω g d Ω d i Ω b α d , t C D G d , g P i , d , g , t D G P r t
C E s = t Ω t d Ω d i Ω b α d , t C S d P i , d , t s P r t
Subject to:
k i Ω l P k i , d , t i j Ω l ( P i j , d , t + R i j I i j , d , t 2 ) + P i , d , t s + g Ω g P i , d , g , t D G = P i , d D i Ω b , d Ω d , t Ω t
k i Ω l Q k i , d , t i j Ω l ( Q i j , d , t + X i j I i j , d , t 2 ) + Q i , d , t s + g Ω g Q i , d , g , t D G = Q i , d D i Ω b , d Ω d , t Ω t
V i , d , t 2 2 ( R i j P i j , d , t + X i j Q i j , d , t ) ( R i j 2 + X i j 2 ) I i j , d , t 2 V j , d , t 2 = 0 i j Ω l , d Ω d , t Ω t
V i , d , t 2 V i , d , t 2 = P i , d , t 2 + Q i , d , t 2 i j Ω l , d Ω d , t Ω t
V min 2 V i , d , t 2 V max 2 i Ω b , d Ω d , t Ω t
0 I i j , d , t 2 ( I i j max ) 2 i j Ω l , d Ω d , t Ω t r
0 P i , d , g , t D G f t D G P g max y i , g i Ω b , d Ω d , g Ω , t Ω t
Q g min y i , g Q i , d , g , t D G Q g max y i , g i Ω b , d Ω d , g Ω , t Ω t
P i , d , g , t D G tan ( arccos ( p f D G ) ) Q i , d , g , t D G P i , d , g , t D G tan ( arccos ( p f D G ) ) i Ω b , d Ω d , g Ω , t Ω t
P i , d , t s tan ( arccos ( p f min s ) ) Q i , d , t s P i , d , t s tan ( arccos ( p f min s ) ) i Ω b , d Ω d , g Ω , t Ω t
0 i Ω b g Ω g y i , g N D G max
0 y i , g N D G , i , g max i Ω b
i Ω b g Ω g y i , g P g max β max { i Ω b P i , d D }
The first component of objective function (1) specifies the yearly investment in distributed generators. This component involves multiplying the number of DGs on each bus by the generation cost of each DGs on the same bus. In (2), Ω b represents the set of buses, and Ω g represents the set of distributed generators. Additionally, c g is the yearly installation expenses of distributed generation of type g ($), and y i , g is the binary choice variable for the allocation of the DG type g.
In the second component of objective function (1), the expected cost of energy supplied by DGs is calculated (see (3)). This indicates that the entire cost of energy generated by each DG at each load level and duration for each scenario is equal to the cost of energy supplied by each DG multiplied by the likelihood of that scenario occurring. In other words, overall electricity expense of DG units is equal to the cost of energy generated by each DG in each scenario. In (3), Ω t and Ω d each represent a set of different possible scenarios and hourly load levels, respectively. In addition, α d , t is the amount of days in a year that the scenario t occurs at load level d ( h ) , and C D G d , g is the energy cost for DG of type g ($/kWh) expressed in dollars per kilowatt-hour. P r t is the likelihood of scenario t, and P i , d , g , t D G is the active power that is supplied by DG of type g on bus i at load level d in the scenario t (in kW).
The third component of objective function (1) represents the energy that is produced by the substation (see (4)). To put it in other words, the total production cost of substations is equal to the cost of energy supplied by each substation at each load level and length at each scenario multiplied by the likelihood of occurrence of that scenario. In (4), P i , d , t S represents the active power provided by the substation on bus i at load level d in scenario t in kilowatts, while C S d represents the energy cost of the substation in dollars per kilowatt-hour.
In the presence of DG units, the nodal active power balance and nodal reactive power balance are represented by (5) and (6), respectively. They demonstrate that the total active and reactive power inflows from lines, substation, and DG units to each bus equal the total active and reactive power outflows from lines and loads, as well as the active losses that are incurred by lines that are linked to that bus. In (5), the variables Ω l and R i j represent, respectively, the set of all branches and the resistivity of i j (Ohms), I i j , d , t is the current magnitude of branch i j (amps) at load level d in scenario t, and P i j , d , t and P k i , d , t are the active powers of branches i j and k i (kW), respectively. In addition, P i , d D represents the active power required at node i in load level d (kW).
In (6), Q i j , d , t and Q k i , d , t , represent the reactive power of branch i j and branch k i , respectively, at load level d in scenario t. Both values are expressed in kVAr. Furthermore, Q i , d , g , t D G indicates reactive power supplied by a DG of type g and Q i , d , t S represents reactive power supplied by a substation on bus i at load level d in scenario t (in kVAr), correspondingly. The reactive power requested at node i in load level d is represented by Q i , d D (in kVAr).
The Kirchhoff voltage law, also known as the KVL, is denoted by (7) and states that the net summation of voltage magnitudes in each loop must equal zero. In (7), V i , d , t and V j , d , t are the voltage magnitudes on buses i and j at load level d in scenario t (in kV), respectively, and X i j is the reactance of branch i j (Ohms). The link among apparent power and active and reactive parts of each branch is explained by (8). In addition, (9) demonstrates that the voltage magnitude of each bus is constrained by its minimum and maximum values, where V min and V max are the upper and lower limits voltage magnitudes, respectively, (in kV). (10) states that each branch’s current is between zero and its highest value, where I i j max is the branch i j ’s maximum current magnitude (in Amps). Moreover, (11) demonstrates that each DG unit’s the maximum active power capacity multiplied by the generation factor must be less than or equal to active power.
In (11), P g max represents the maximum active power produced by the DG of type g (in kW), and f t D G represents the DG generation factor for scenario t. Equation (12) states that any distributed generator delivers reactive power between its lowest and highest reactive generating capabilities. Reactive power produced by DGs of type g (in kVAr) is represented by Q g min and Q g max (12), and the power factor boundary for DGs is represented by p f D G . The reactive power that is produced by a DG may be found in (13), and the reactive power that is produced by a substation can be found in (14). They are constrained by their active generation as well as their power factors, where p f min S refers for the minimal leading and lagging substation power factor.
Furthermore, due to financial and technological restrictions, (15) and (16) reveal the maximum number of DG that may be placed in a network, ( N D G max ), as well as the maximum number of each DG type that can be placed on each bus ( N D G , i , g max ), respectively. Equation (17) places restrictions on the penetration of DG active power, i.e., the maximum active power supplied by DG, which must be less than or equal to a percentage ( 0 < β 1 ) of the system’s total peak load.
The suggested DGA problem includes the binary variables ( y i , g ) as well as the real variables I i j , d , t ,   V i j , d , t ,   P i j , d , t ,   Q i j , d , t ,   P i , d , t S ,   Q i , d , t S ,   P i , d , g , t D G , and Q i , d , g , t D G , due to the presence of the non-linear components I i j , d , t 2 and V j , d , t 2 , the problem cannot be addressed using convex commercial tools. As a result, the model has to be linearized with the aid of any linear programming approach or changed to a mixed-integer conic formulation with the aid of the variable change methodology that was utilized by [13].
The variable change approach is simpler and more precise than linearization, since linear optimization methods need the consideration of several assumptions and approximations, which may reduce the quality of solutions for large-scale distribution systems. By substituting square variables, I i j , d , t 2 , V j , d , t 2 and V i j , d , t 2 with I i j , d , t s q r V j , d , t s q r and V i , d , t s q r , respectively, the variable change approach is employed to readdress the problem.
min C T = i Ω b g Ω g c g y i , g P g max + t Ω t g Ω g d Ω d i Ω b α d , t C D G d , g P i , d , g , t D G P r t + t Ω t d Ω d i Ω b α d , t C S d P i , d , t s P r t
Subjected to (11)–(17) and:
k i Ω l P k i , d , t i j Ω l ( P i j , d , t + R i j I i j , d , t s q r ) + P i , d , t s t + g Ω g P i , d , g , t D G = P i , d D i Ω b , d Ω d , t Ω t
k i Ω l Q k i , d , t i j Ω l ( Q i j , d , t + X i j I i j , d , t s q r ) + Q i , d , t s + g Ω g Q i , d , g , t D G = Q i , d D i Ω b , d Ω d , t Ω t
V i , d , t s q r 2 ( R i j P i j , d , t + X i j Q i j , d , t ) ( R i j 2 + X i j 2 ) I i j , d , t s q r V j , d , t s q r = 0 i j Ω l , d Ω d , t Ω t
P i j , d , t 2 + Q i j , d , t 2 V j , d , t s q r I i j , d , t s q r i j Ω l , d Ω d , t Ω t
V min 2 V i , d , t s q r V max 2 i Ω b , d Ω d , t Ω t
0 I i j , d , t s q r ( I i j max ) 2 i j Ω l , d Ω d , t Ω t
In contrast, the convex Formula (22) modifies the non-convex Equation (8) into a convex equation so that the optimization problem may be solved in a convex manner. As a result, the previously mentioned MINLP problem is capable of being rebuilt as a MISOCP problem. Because this formulation is convex, it ensures that optimum solutions may be achieved and that it can be solved by commercial solvers such as CPLEX [25].

3. Case Study and Its Results

3.1. Description

To test the efficacy of the proposed model, a computer with a 64-bit CPU and an Intel i7 3.6 GHz processor was utilized to investigate the DGA on the IEEE 33-bus and real-world 136-bus distribution systems. The solution time frames for test systems are, respectively, 10 minutes (min) and 2 days and 9 h. Notably, β , V min , and V max were assumed to be 0.5 ,   0.9 per unit and 1.0 per unit, respectively; the voltage magnitude of substation sites was set at 1.0 per unit; and the power factor restriction was set at 0.85 .
For stochastic DG allocation, a set of generation possibilities are addressed in the stochastic programming model. However, there are several possibilities for photovoltaic DG production profile, and including them all significantly increases the computing time required to solve the DGA problem.
On the other hand, there are numerous comparable scenarios from which to choose a sample to assess the model.
For the production potential to be near to a real-world scenario, we investigate all conceivable sun irradiation profiles in four scenarios. Possibilities with low or comparable likelihoods are excluded from the set of scenarios using this procedure. As illustrated in Figure 2, [26] analyzed four significant generating scenarios for photovoltaic DG units.
As a result, these four generation profiles ( Ω t = { 1 , 2 , 3 , 4 } ) are used in this study to reflect PV generation uncertainty, with each scenario indicating the state of solar irradiation. For example, t = 1 implies that PV generation is at its peak due to intense solar irradiation on a sunny day, but t = 4 indicates that PV is operating at a lesser capacity due to gloomy conditions. As can be seen in Figure 3, the DGA problem is assessed at varying load levels of the hour-by-hour load profile over the course of a day to illustrate load variations.
For both case studies, Table 1 displays the capacity, energy cost, and investment of several DG types. Investment costs ( P ) of DG types 1 , 2, and 3 are 3510 $/kW, 2650 $/kW, and 2040 $/kW, respectively, [27], for an average lifespan ( n ) of 20 years, according to statistics provided in the proposal of [28]. As a result, yearly PV unit installation costs ( A ) are computed by (25) [29] (see Table 1), with an annual interest rate ( i ) of 8 percent.
A = P i ( 1 + i ) n ( 1 + i ) n 1
DG types 1, 2 , and 3 also have energy expenses (operating and maintenance costs) of 19 $/kW-year, 19 $/kW-year, and 16 $/kW-year, respectively, [30]. Moreover, the cost of electricity for a substation is 0.3 $/kWh [31].

3.2. Results and Discussion

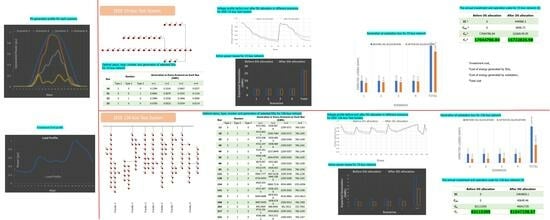
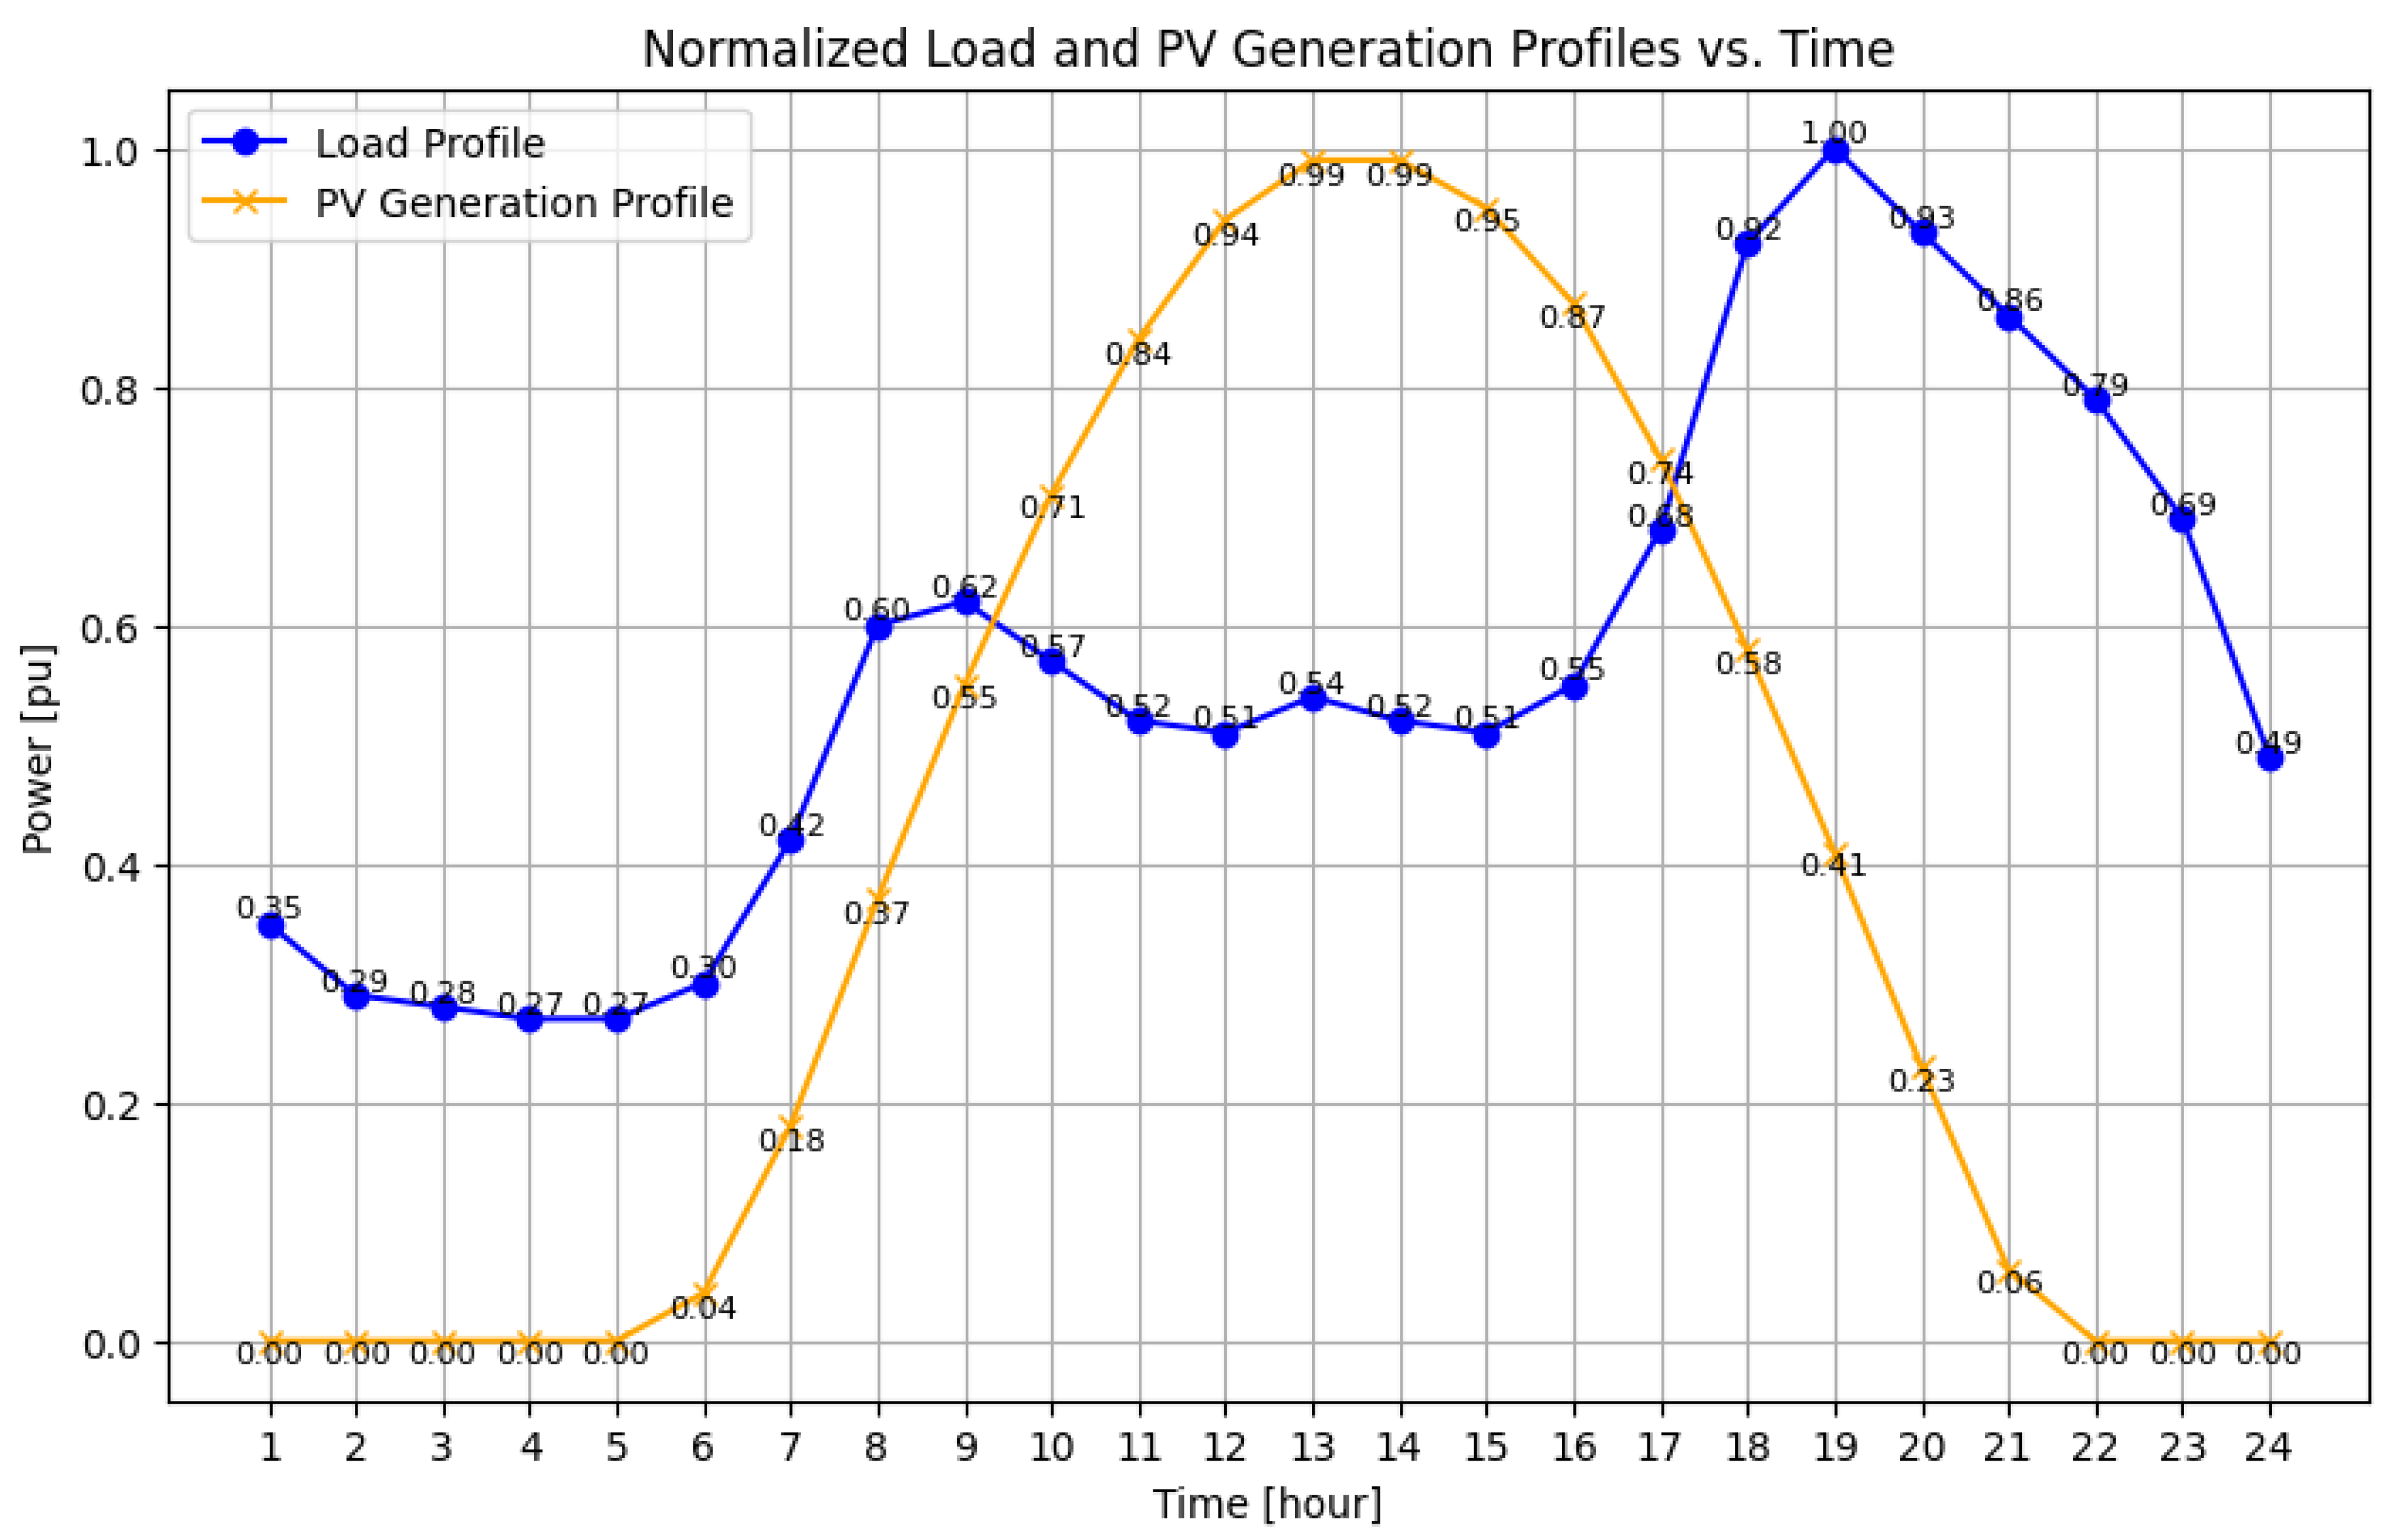
3.2.1. Results of 33-Bus Distribution Network

The proposed DGA problem (set of Equations (11)–(24)) was applied to a 33-bus distribution system, as illustrated in [32], using CPLEX in AMPL under four scenarios and hourly load levels ( Ω d = { 1 , 2 , 3 , , 24 } ) taking allocation of photovoltaic DG units into consideration. It is assumed that the probability of each scenario is equal, in other words, 1 divided by the number of scenarios (25 percent). The nominal voltage and maximum current of the system are, respectively, 12.66 kV and 300 A. Appendix A of [33] includes additional details on the line and load parameters for the 33-bus distribution network.
Figure 4 illustrates the voltage magnitude profile in the 33-bus network both before and after the integration of DG units. Prior to DG allocation, the worst recorded voltage magnitude was 0.912 at bus 18. Subsequently, after DG allocation, the voltage magnitude met 0.918 at the same bus.
Table 2 displays the findings of the buses chosen for installation of each kind of DGs, the quantity of DG units installed, and their generation capacity.
Additionally, Table 3 outlines the investment and cost of energy produced by DGs and substations.
In addition, Figure 5 and Figure 6 compare substation bus generation and network losses before and after DG allocation, respectively.
According to Table 2, it is necessary to install one DG unit and two DG units with a capacity of 100-kW on buses 18 and 33, one 500-kW DG unit on bus 32 and one DG unit with a capacity of 1.00 MW on bus 31. This leads the total estimated network losses in Figure 6 to decrease by 0.08 kWh ( 12.5 percent).
It can be shown in Figure 5 that following DG allocation, the total projected power produced at the substation bus is lowered by 0.81 kWh ( 5.1 percent). As a result, DG units serve to offset the output of the remainder of the generating system. Installing DG units costs $449,980.30 and $ 4696.73 more in investment and operation, according to the data in Table 3. Nevertheless, it may reduce the cost of substation energy production by $776,636.89 ( 4.55 percent) and save $321,959.86 in overall costs. Scenario 1, shown in Figure 4, presented the highest improvements in voltage profile following DG installation.

3.2.2. Results of 136-Bus Distribution Network

On a 136-bus distribution network, the proposed formulations were subjected to different scenarios and hourly load levels with and without PV units. It is a section of the distribution network of Três Lagoas in Brazil. The nominal voltage and maximum current of the system are, respectively, 13.8 kV and 200 A. Appendix B of [33] includes additional details on the line and load parameters for the 136-bus distribution network. Additionally, the likelihood of each scenario occurring is 25 percent. Figure 7 shows that the worst voltage magnitude before DG allocation measured 0.93 at bus 203 and after DG allocation magnitude of voltage met 0.946 at the same bus.
Table 4 also specifies the optimum buses for installing each kind of DGs, as well as the amount of DG units needed and their generation.
Figure 8 and Figure 9 show the generation of substation buses and active losses before and after PV allocation, respectively.
There is a 50 percent reduction in power loss ( 0.54 kWh) in the network due to the installation of eighteen 500-kW and one 100-kW DG units (see Table 4). After PV allocation, the substation bus power is dropped by 34.4693 kW ( 40.26 percent), as shown in Figure 8. It is shown in Table 5 that the investment and operating expenses of PV units increase by $2,464,850.10 and $40,649.46, respectively. Nevertheless, it may save $33,073,656.00 ( 40.27 percent) on substation energy production, resulting in a total savings of $30,568,156.43. Scenario 1, shown in Figure 7, exhibits considerable improvement in voltage profile following DG installation.

4. Conclusions and Future Works

This study contributes valuable insights and methodologies for the optimal allocation of DG units in distribution networks, emphasizing cost savings, sustainability, and robust optimization techniques. The simulation findings demonstrate that although deploying PV units raises the investment and operating costs of distributed generators, the cost of electricity produced by the substation is decreased, hence reducing the overall cost of the network. In other words, although the installation of distributed generators incurs investment and operating expenses for the network, it results in cost savings. PV units may decrease network losses by producing electricity at load sites, hence reducing network expenses. This holistic approach is critical for the efficient and sustainable operation of distribution networks in a rapidly evolving energy landscape.

4.1. Key Conclusions and Novelties

The key conclusions and novelties of this article are outlined herein:
  • Optimal DG allocation: The integration of DG units in distribution networks presents a complex interplay of investment and operational costs. Our research emphasizes the importance of optimal DG allocation. By determining suitable locations, types, and sizes for DG units within the distribution network, we demonstrate the potential for substantial cost savings, considering both investment and operational expenses.
  • Effective handling of uncertainties: Incorporating uncertainties, such as load fluctuations and variable PV generation, into the allocation problem is crucial. Our stochastic formulation accounts for these uncertainties, making it a valuable tool for real-world applications.
  • Holistic cost minimization: The primary objective of our research is to minimize the overall cost of the distribution network. This includes not only the cost of energy generation at the substation but also the financial outlays associated with DG units, thereby providing a holistic perspective on cost reduction.
  • Sustainable energy futures: Our research advocates for the integration of DG units as a means to enhance the sustainability of distribution networks. By generating power closer to the load points, DG units effectively reduce network losses, thereby contributing to a greener and more efficient energy distribution system. This research aligns with global efforts to transition towards sustainable and resilient energy systems. It underscores the role of distribution networks in this transition and highlights the practical steps needed to achieve these goals.
  • Solver efficiency: We employ the CPLEX solver within the AMPL framework for solving the complex mixed-integer conic optimization problem introduced by our model. This optimization technique ensures the derivation of high-quality solutions, which are imperative for the practical implementation of optimal DG allocation strategies.
  • Real-world testing: The proposed model was initially applied to the IEEE 33-bus distribution system to evaluate its performance. To further validate its effectiveness, the model was then tested on a real-world 136-bus distribution network of Três Lagoas located in Brazil [33]. This validation encompassed scenarios both with and without DG units, under scenarios of daily load variations and PV generation uncertainty.
  • Practical insights and transdisciplinary application: This work offers practical insights and guidance for energy engineers and policymakers tasked with optimizing distribution networks. It highlights the dual benefits of cost savings and enhanced network performance achievable through strategic DG deployment. The findings of our research hold relevance not only within the realm of electrical engineering but also in broader energy and infrastructure management contexts. The principles of optimal DG allocation and addressing uncertainties are applicable to diverse fields striving to optimize resource allocation under uncertain conditions.

4.2. Future Research Directions

As we conclude our work on DG allocation within distribution networks, it is imperative to acknowledge the compelling prospects for future research in this evolving field. The following are directions for further exploration and expansion of our understanding:
  • Incorporating demand-side response in DG allocation: Future studies should embrace the challenge of DG allocation while considering the dynamic aspect of demand-side response (DSR). This entails framing the problem as a mixed-integer conic stochastic programming problem, encompassing various forms of DG sources, such as wind and solar generating plants. DSR, characterized by end-user customers’ adjustments in electricity consumption patterns in response to price fluctuations or incentive payments, presents a novel facet of DG allocation. Essentially, DSR can be regarded as a dynamic component akin to virtual DGs or negative load, offering a fresh perspective on the DG allocation challenge.
  • Exploring decision-dependent uncertainty: Endogenous uncertainty pertains to controllable factors influencing decision-making uncertainty. It encompasses variables such as price disclosure, business cycle, and the decision itself. Addressing it empowers decision makers to enhance strategies, manage risk, and optimize outcomes [34]. Decision-dependent uncertainty (DDU) represents a burgeoning area of research. DDU, intricately linked with the decision maker’s strategy, warrants further exploration and application in optimization problems. The existing literature has provided a foundation for understanding DDU [35], but future works should delve deeper into its nuances and implications within the context of DG allocation and distribution network optimization.
  • Incorporating market price uncertainty: Future endeavors should aim to expand the horizons of uncertainty consideration by incorporating additional sources, such as market prices, into the model. This augmentation would enrich the decision-making capabilities of the model, allowing for a more holistic assessment of the problem within the dynamic context of fluctuating market conditions.
  • Advanced solution techniques: The quest for enhanced computational efficiency in addressing larger instances of the problem prompts the exploration of advanced solution techniques. The linearization of optimization formulations, particularly within the realm of Benders decomposition alternating current optimal power flow (ACOPF), offers a fertile ground for future research [36]. By delving into the application of these techniques, researchers can strive to optimize the allocation of resources and expedite the decision-making process, thus accommodating the complexities of large-scale problems more effectively [20,37].
  • Exploring extreme scenarios: In the pursuit of robustness and comprehensive modeling, future research should consider the incorporation of extreme scenarios. These scenarios, based on factors such as extreme climate conditions, can provide valuable insights into the resilience and adaptability of DG allocation models. By investigating how DG systems perform under the most challenging circumstances, we can gain a deeper understanding of their limitations and potential avenues for enhancement.
As a result, the trajectory of research in DG allocation and distribution network optimization is marked by exciting opportunities for exploration and innovation. By embracing these future research directions, we can contribute to the evolution of this field, further informing policymakers, practitioners, and stakeholders in the quest for efficient and sustainable energy distribution systems.

Author Contributions

The authors collaborated closely throughout the research process and all made significant contributions to this work. All author was involved in the conception and design of the study, data analysis, and interpretation of the findings. In addition, all author played a critical role in drafting and revising the manuscript. All authors have read and agreed to the published version of the manuscript.

Funding

This paper was possible thanks to the scholarship granted from the Brazilian Federal Agency for Support and Evaluation of Graduate Education (CAPES)—Finance code 001.

Data Availability Statement

The data used during the current work are available in the Appendixes of [33].

Conflicts of Interest

The authors have no conflict of interest to declare that are relevant to the content of this article.

References

  1. Badran, O.; Mekhilef, S.; Mokhlis, H.; Dahalan, W. Optimal reconfiguration of distribution system connected with distributed generations: A review of different methodologies. Renew. Sustain. Energy Rev. 2017, 73, 854–867. [Google Scholar] [CrossRef]
  2. Mahdavi, M.; Kheirkhah, A.R.; Macedo, L.H.; Romero, R. A genetic algorithm for transmission network expansion planning considering line maintenance. In Proceedings of the 2020 IEEE Congress on Evolutionary Computation (CEC), Glasgow, UK, 19–24 July 2020; pp. 1–6. [Google Scholar]
  3. Rahmani-Andebili, M.; Fotuhi-Firuzabad, M. An adaptive approach for PEVs charging management and reconfiguration of electrical distribution system penetrated by renewables. IEEE Trans. Ind. Inform. 2017, 14, 2001–2010. [Google Scholar] [CrossRef]
  4. Kheirkhah, A.R.; Pozos, A.T.; Zandrazavi, S.F.; Franco, J.F.; Leite, J.B. A Stochastic Programming Model for the Optimal Allocation of Photovoltaic Distributed Generation in Electrical Distribution Systems Considering Load Variations and Generation Uncertainty. Simpósio Bras. De Sist. Elétricos-SBSE 2020, 1. [Google Scholar] [CrossRef]
  5. Poudel, S.; Dubey, A.; Bose, A. Risk-based probabilistic quantification of power distribution system operational resilience. IEEE Syst. J. 2019, 14, 3506–3517. [Google Scholar] [CrossRef]
  6. Sultana, B.; Mustafa, M.; Sultana, U.; Bhatti, A.R. Review on reliability improvement and power loss reduction in distribution system via network reconfiguration. Renew. Sustain. Energy Rev. 2016, 66, 297–310. [Google Scholar] [CrossRef]
  7. Forsten, K. The Integrated Grid: A Benefit-Cost Framework; Electric Power Research Institute (EPRI): Palo Alto, CA, USA, 2015. [Google Scholar]
  8. Owens, B. The rise of distributed power. Gen. Electr. 2014, 47, 11–29. [Google Scholar]
  9. Aman, M.; Jasmon, G.; Bakar, A.; Mokhlis, H. A new approach for optimum DG placement and sizing based on voltage stability maximization and minimization of power losses. Energy Convers. Manag. 2013, 70, 202–210. [Google Scholar] [CrossRef]
  10. Hamidi, M.E.; Chabanloo, R.M. Optimal allocation of distributed generation with optimal sizing of fault current limiter to reduce the impact on distribution networks using NSGA-II. IEEE Syst. J. 2018, 13, 1714–1724. [Google Scholar] [CrossRef]
  11. Biswas, S.; Goswami, S.K.; Chatterjee, A. Optimum distributed generation placement with voltage sag effect minimization. Energy Convers. Manag. 2012, 53, 163–174. [Google Scholar] [CrossRef]
  12. Mahdavi, M.; Kheirkhah, A.R.; Romero, R. Transmission expansion planning considering line failures and maintenance. In Proceedings of the 33rd International Power System Conference, Tehran, Iran, 22–24 October 2018; pp. 1–7. [Google Scholar]
  13. Rueda-Medina, A.C.; Franco, J.F.; Rider, M.J.; Padilha-Feltrin, A.; Romero, R. A mixed-integer linear programming approach for optimal type, size and allocation of distributed generation in radial distribution systems. Electr. Power Syst. Res. 2013, 97, 133–143. [Google Scholar] [CrossRef]
  14. Mahmoud, K.; Yorino, N.; Ahmed, A. Optimal distributed generation allocation in distribution systems for loss minimization. IEEE Trans. Power Syst. 2015, 31, 960–969. [Google Scholar] [CrossRef]
  15. Mena, A.J.G.; García, J.A.M. An efficient approach for the siting and sizing problem of distributed generation. Int. J. Electr. Power Energy Syst. 2015, 69, 167–172. [Google Scholar] [CrossRef]
  16. Murty, V.V.; Kumar, A. Optimal placement of DG in radial distribution systems based on new voltage stability index under load growth. Int. J. Electr. Power Energy Syst. 2015, 69, 246–256. [Google Scholar] [CrossRef]
  17. Konstantelos, I.; Giannelos, S.; Strbac, G. Strategic valuation of smart grid technology options in distribution networks. IEEE Trans. Power Syst. 2016, 32, 1293–1303. [Google Scholar] [CrossRef]
  18. Gay, D.M. The AMPL modeling language: An aid to formulating and solving optimization problems. In Proceedings of the Numerical Analysis and Optimization: NAO-III, Muscat, Oman, 5–9 January 2014; Springer: Berlin/Heidelberg, Germany, 2015; pp. 95–116. [Google Scholar]
  19. Ganguly, S.; Samajpati, D. Distributed generation allocation on radial distribution networks under uncertainties of load and generation using genetic algorithm. IEEE Trans. Sustain. Energy 2015, 6, 688–697. [Google Scholar] [CrossRef]
  20. Conejo, A.J.; Carrión, M.; Morales, J.M. Decision Making under Uncertainty in Electricity Markets; Springer: Berlin/Heidelberg, Germany, 2010; Volume 1. [Google Scholar]
  21. Karimyan, P.; Gharehpetian, G.B.; Abedi, M.; Gavili, A. Long term scheduling for optimal allocation and sizing of DG unit considering load variations and DG type. Int. J. Electr. Power Energy Syst. 2014, 54, 277–287. [Google Scholar] [CrossRef]
  22. Serrano, H.D.O.M.; Leite, J.B. Allocation of Distributed Generation to Minimize Losses in the Distribution Power System. In Proceedings of the 2021 IEEE PES Innovative Smart Grid Technologies Conference-Latin America (ISGT Latin America), Lima, Peru, 15–17 September 2021; pp. 1–5. [Google Scholar]
  23. Mendoza Osorio, D.; Rosero Garcia, J. Convex Stochastic Approaches for the Optimal Allocation of Distributed Energy Resources in AC Distribution Networks with Measurements Fitted to a Continuous Probability Distribution Function. Energies 2023, 16, 5566. [Google Scholar] [CrossRef]
  24. Giannelos, S.; Borozan, S.; Aunedi, M.; Zhang, X.; Ameli, H.; Pudjianto, D.; Konstantelos, I.; Strbac, G. Modelling Smart Grid Technologies in Optimisation Problems for Electricity Grids. Energies 2023, 16, 5088. [Google Scholar] [CrossRef]
  25. Lima, R.; Seminar, E. Ibm ilog cplex-what is inside of the box. In Proceedings of the 2010 EWO Seminar, Pittsburgh, PA, USA, 12 July 2010; Volume 12, pp. 1–72. [Google Scholar]
  26. Franco, J.F.; Ochoa, L.F.; Romero, R. AC OPF for smart distribution networks: An efficient and robust quadratic approach. IEEE Trans. Smart Grid 2017, 9, 4613–4623. [Google Scholar] [CrossRef]
  27. Feldman, D.J.; Zwerling, M.; Margolis, R.M. Q2/Q3 2019 Solar Industry Update; Technical Report; National Renewable Energy Lab. (NREL): Golden, CO, USA, 2019. [Google Scholar]
  28. Ramasamy, V.; Feldman, D.; Desai, J.; Margolis, R. US Solar Photovoltaic System and Energy Storage Cost Benchmarks: Q1; Technical Report; National Renewable Energy Lab. (NREL): Golden, CO, USA, 2021. [Google Scholar]
  29. Newnan, D.G.; Eschenbach, T.G.; Lavelle, J.P. Engineering Economic Analysis; Oxford University Press: Oxford, UK, 2004; Volume 1. [Google Scholar]
  30. Theo, W.L.; Lim, J.S.; Ho, W.S.; Hashim, H.; Lee, C.T. Review of distributed generation (DG) system planning and optimisation techniques: Comparison of numerical and mathematical modelling methods. Renew. Sustain. Energy Rev. 2017, 67, 531–573. [Google Scholar] [CrossRef]
  31. Resener, M.; Venkatesh, B.; Ferraz, B.M.P.; Haffner, S.; Balbinot, A.; Pereira, L.A. MILP Model for Optimal Day-Ahead PDS Scheduling Considering TSO-DSO Interconnection Power Flow Commitment Under Uncertainty. IEEE Trans. Power Syst. 2022, 38, 1934–1947. [Google Scholar] [CrossRef]
  32. Baran, M.E.; Wu, F.F. Network reconfiguration in distribution systems for loss reduction and load balancing. IEEE Power Eng. Rev. 1989, 9, 101–102. [Google Scholar] [CrossRef]
  33. Kheirkhah, A.R. A Stochastic Programming Model for the Optimal Allocation of Distributed Generation in Electrical Distribution Systems Considering Load Variations and Generation Uncertainty. Master’s Thesis, Universidade Estadual Paulista (Unesp), Ilha Solteira, Brazil, 2020. [Google Scholar]
  34. Straub, L.; Ulbricht, R. Endogenous Uncertainty and Credit Crunches. SSRN 2668078. 16 January 2023. Available online: https://scholar.harvard.edu/sites/scholar.harvard.edu/files/straub/files/straub_ulbricht_endog_unc.pdf (accessed on 25 August 2023).
  35. Giannelos, S.; Konstantelos, I.; Strbac, G. Option value of demand-side response schemes under decision-dependent uncertainty. IEEE Trans. Power Syst. 2018, 33, 5103–5113. [Google Scholar] [CrossRef]
  36. Shahidehopour, M.; Fu, Y. Benders decomposition: Applying Benders decomposition to power systems. IEEE Power Energy Mag. 2005, 3, 20–21. [Google Scholar] [CrossRef]
  37. Tarhan, B.; Grossmann, I.E. A multistage stochastic programming approach with strategies for uncertainty reduction in the synthesis of process networks with uncertain yields. Comput. Chem. Eng. 2008, 32, 766–788. [Google Scholar] [CrossRef]
Figure 1. Example network.
Energies 16 07261 g001
Figure 2. PV generation profile for each scenario.
Energies 16 07261 g002
Figure 3. Normalized load and available PV generation profiles.
Energies 16 07261 g003
Figure 4. Voltage profile before and after DG allocation for IEEE 33-bus test system.
Energies 16 07261 g004
Figure 5. Generation at substation bus for 33-bus network.
Energies 16 07261 g005
Figure 6. Active power losses for 33-bus network.
Energies 16 07261 g006
Figure 7. Voltage profile before and after DG allocation for IEEE 136-bus test system.
Energies 16 07261 g007
Figure 8. Generation at substation bus for 136-bus network.
Energies 16 07261 g008
Figure 9. Active power losses for 136-bus network.
Energies 16 07261 g009
Table 1. Capacity and installation and energy costs for different DG types.
TypeMaximum Active Power (kW)Investment Cost ($/kW)Installation Cost ($/kW-yr)Energy Cost ($/kWh)
11003510357.500.0022
25002650269.900.0022
310002040207.780.0018
Table 2. Optimal place, type, number and generation of selected DGs for 33-bus network.
BusNumberGeneration in Every Scenario (kWh)
Type 1Type 2Type 3t = 1t = 2t = 3t = 4
182000.139430.101610.066710.02271
310010.696240.507030.333230.11292
320100.348420.253820.166620.05651
331000.070010.051010.033420.01142
Table 3. The annual investment and operation costs for 33-bus network ($).
Before DG AllocationAfter DG Allocation
IC0449,980.3
C D G 04696.73
C S 17,044,786.8416,268,149.95
C T 17,044,786.8416,722,826.98
Table 4. Optimal place, number, and generation of selected DGs for 136-bus network.
BusNumberGeneration in Every Scenario (kWh)
Type 1Type 2Type 3t = 1t = 2t = 3t = 4
120104723.93439.82259.5766.1
180104723.83439.72259.5766.1
350104722.934392259.5766.1
450104722.13438.42259.5766.1
490104145.23237.82259.5766.1
560104709.13434.82259.5766.1
6801046753432.82259.5766.1
830104723.53439.52259.5766.1
1210104564.73407.62259.5766.1
12801047243440.12259.5766.1
1340209425.46869.74518.41531.6
1410104721.43438.22259.5766.1
1550209444.46878.84518.41531.6
158010469734382259.5766.1
203100945.5688.6452.3153.7
2170104715.13434.62259.5766.1
2210104706.63433.52259.5766.1
Table 5. The annual investment and operation costs for 136-bus network ($).
Before DG AllocationAfter DG Allocation
IC0.002,464,850.10
C D G 0.0040,649.46
C S 82,115,395.0049,041,739.00
C T 82,115,395.0051,547,238.57
Disclaimer/Publisher’s Note: The statements, opinions and data contained in all publications are solely those of the individual author(s) and contributor(s) and not of MDPI and/or the editor(s). MDPI and/or the editor(s) disclaim responsibility for any injury to people or property resulting from any ideas, methods, instructions or products referred to in the content.

