
Convergence of Energy Policies between the EU and Ukraine under the Green Deal Policy

 ,
,  ,
,  ,
,  and
and
Abstract
:1. Introduction
2. Literature Review
2.1. Energy Efficiency: Approaches to Assessment
2.2. Energy Efficiency and Environmental Determinants
2.3. Energy Efficiency and Economic Determinants
2.4. Energy Efficiency and Energy Determinants
3. Materials and Methods
- -
- assessment of σ-convergence of energy efficiency indicators;
- -
- assessment of the β-convergence of energy efficiency indicators;
- -
- distribution of energy efficiency indicators of the national economy according to the concepts of σ- and β-convergence into convergent and divergent.
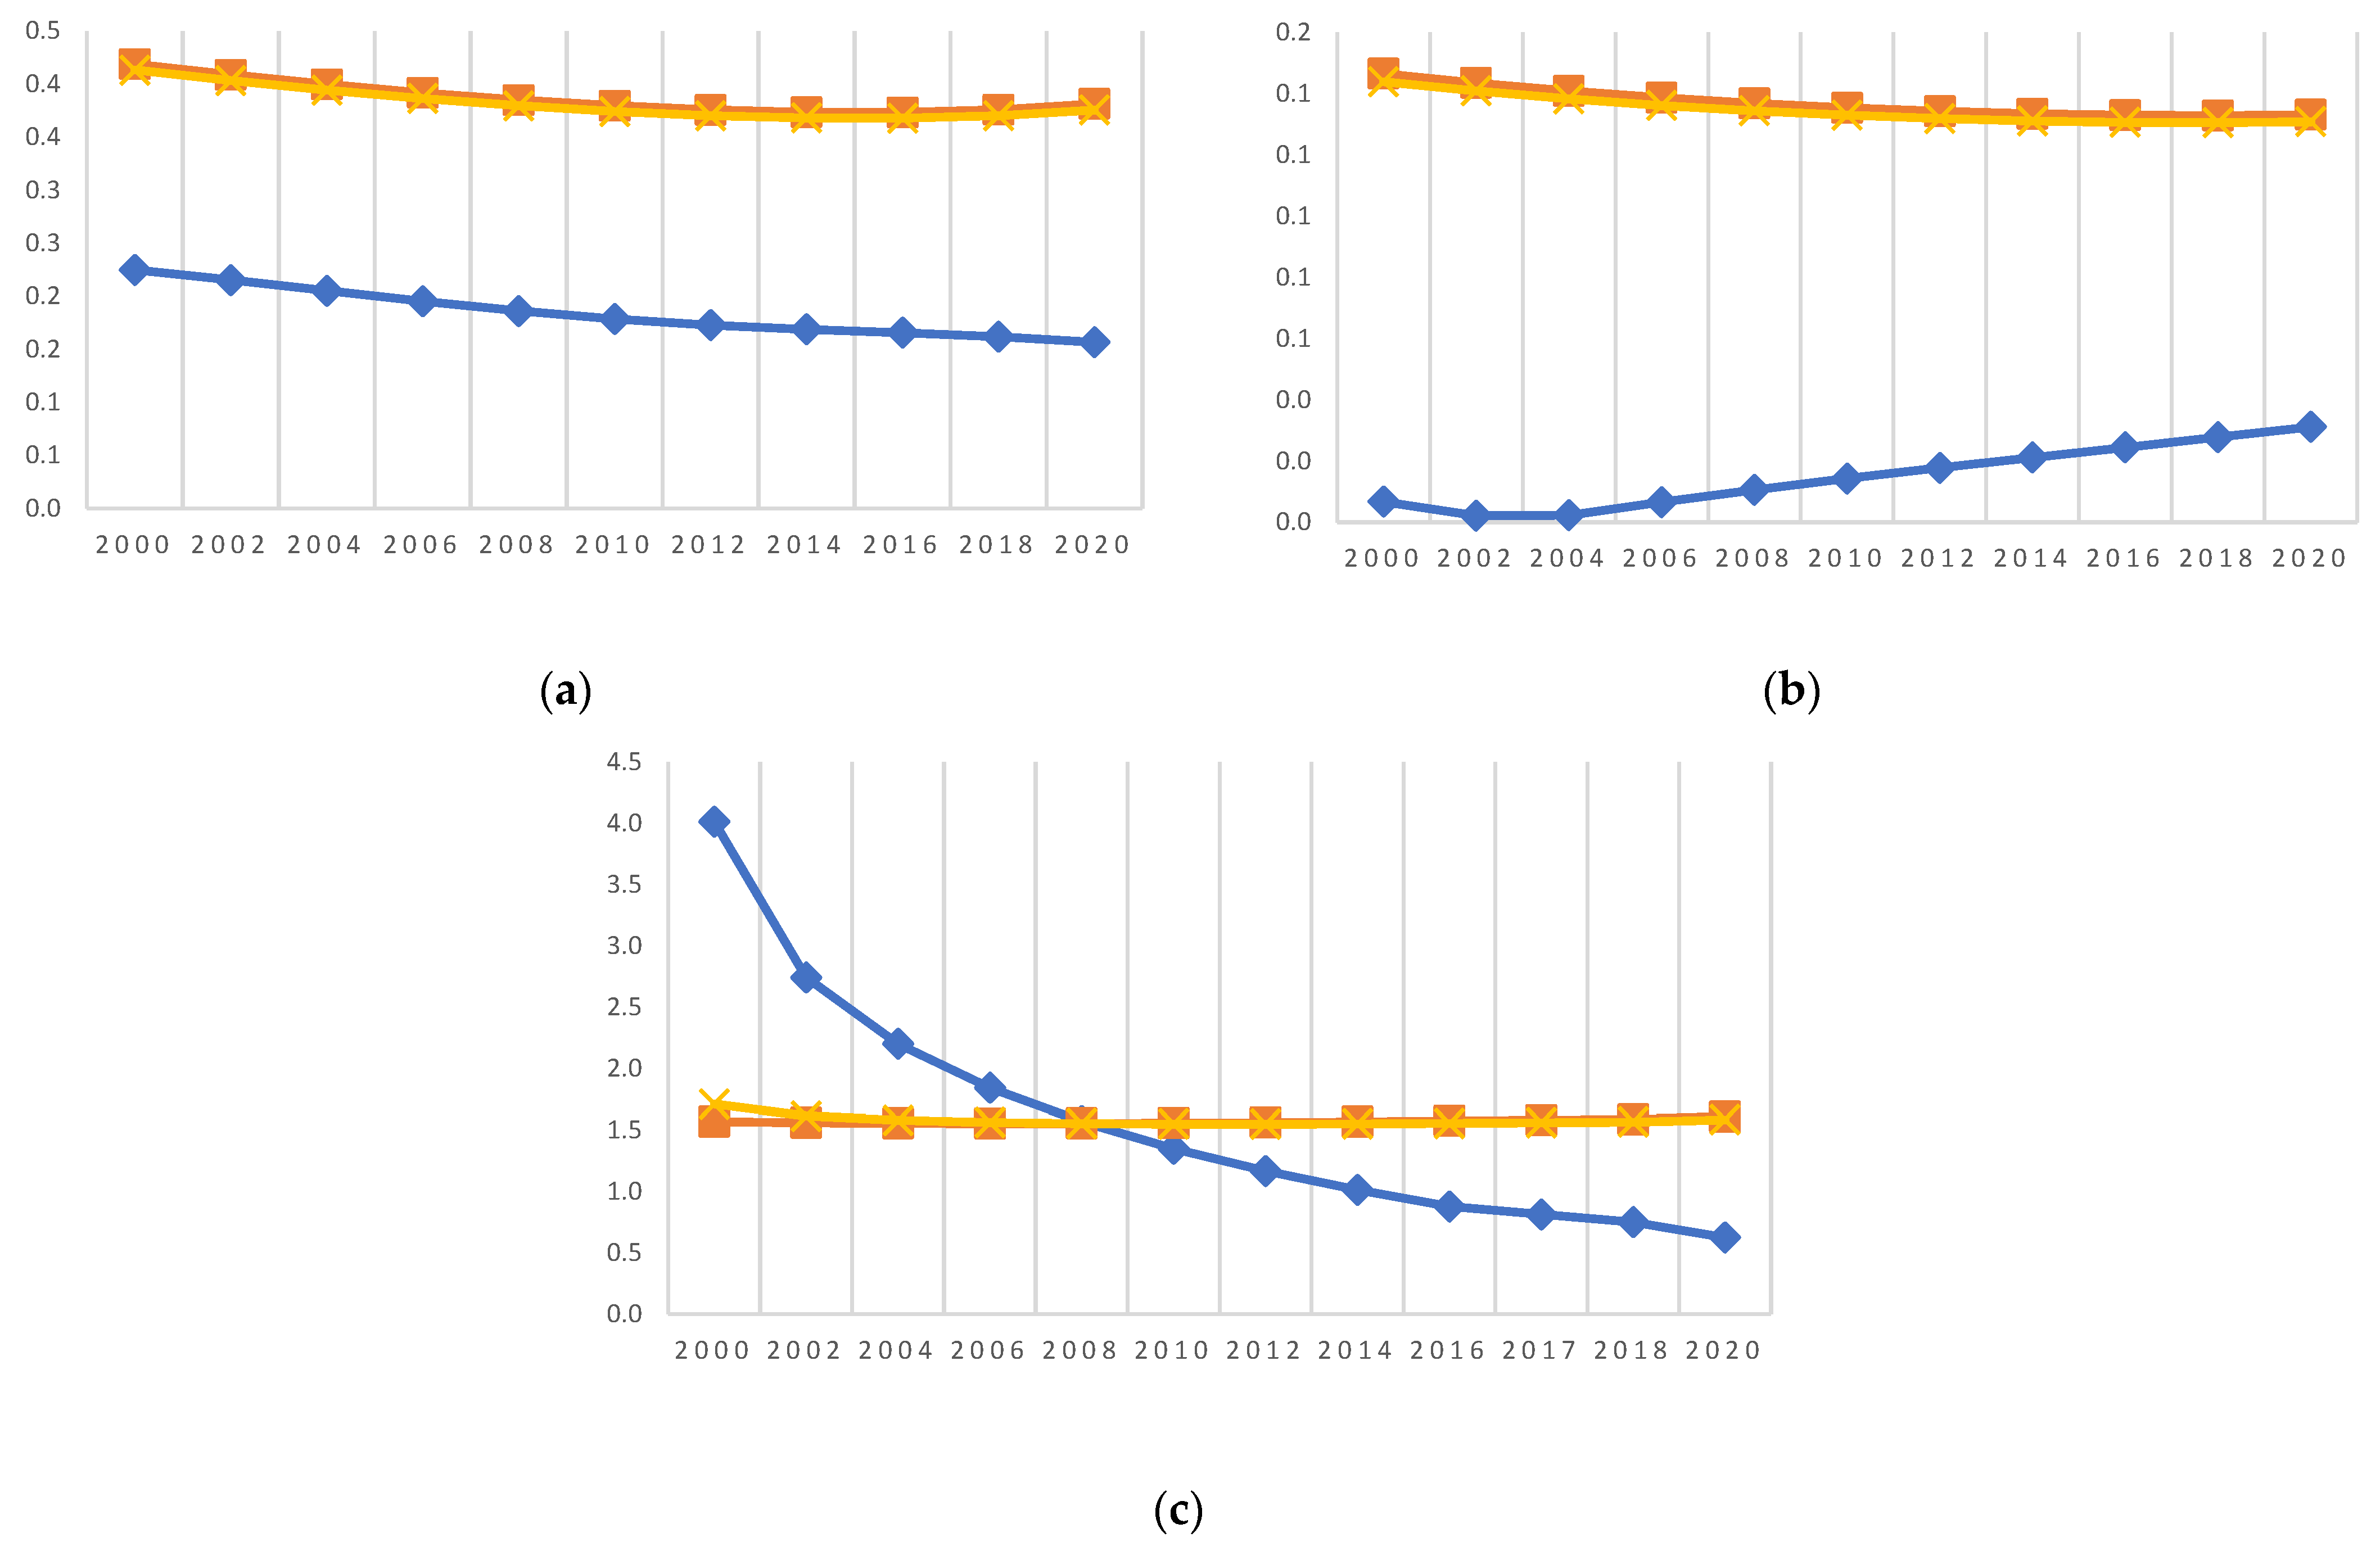
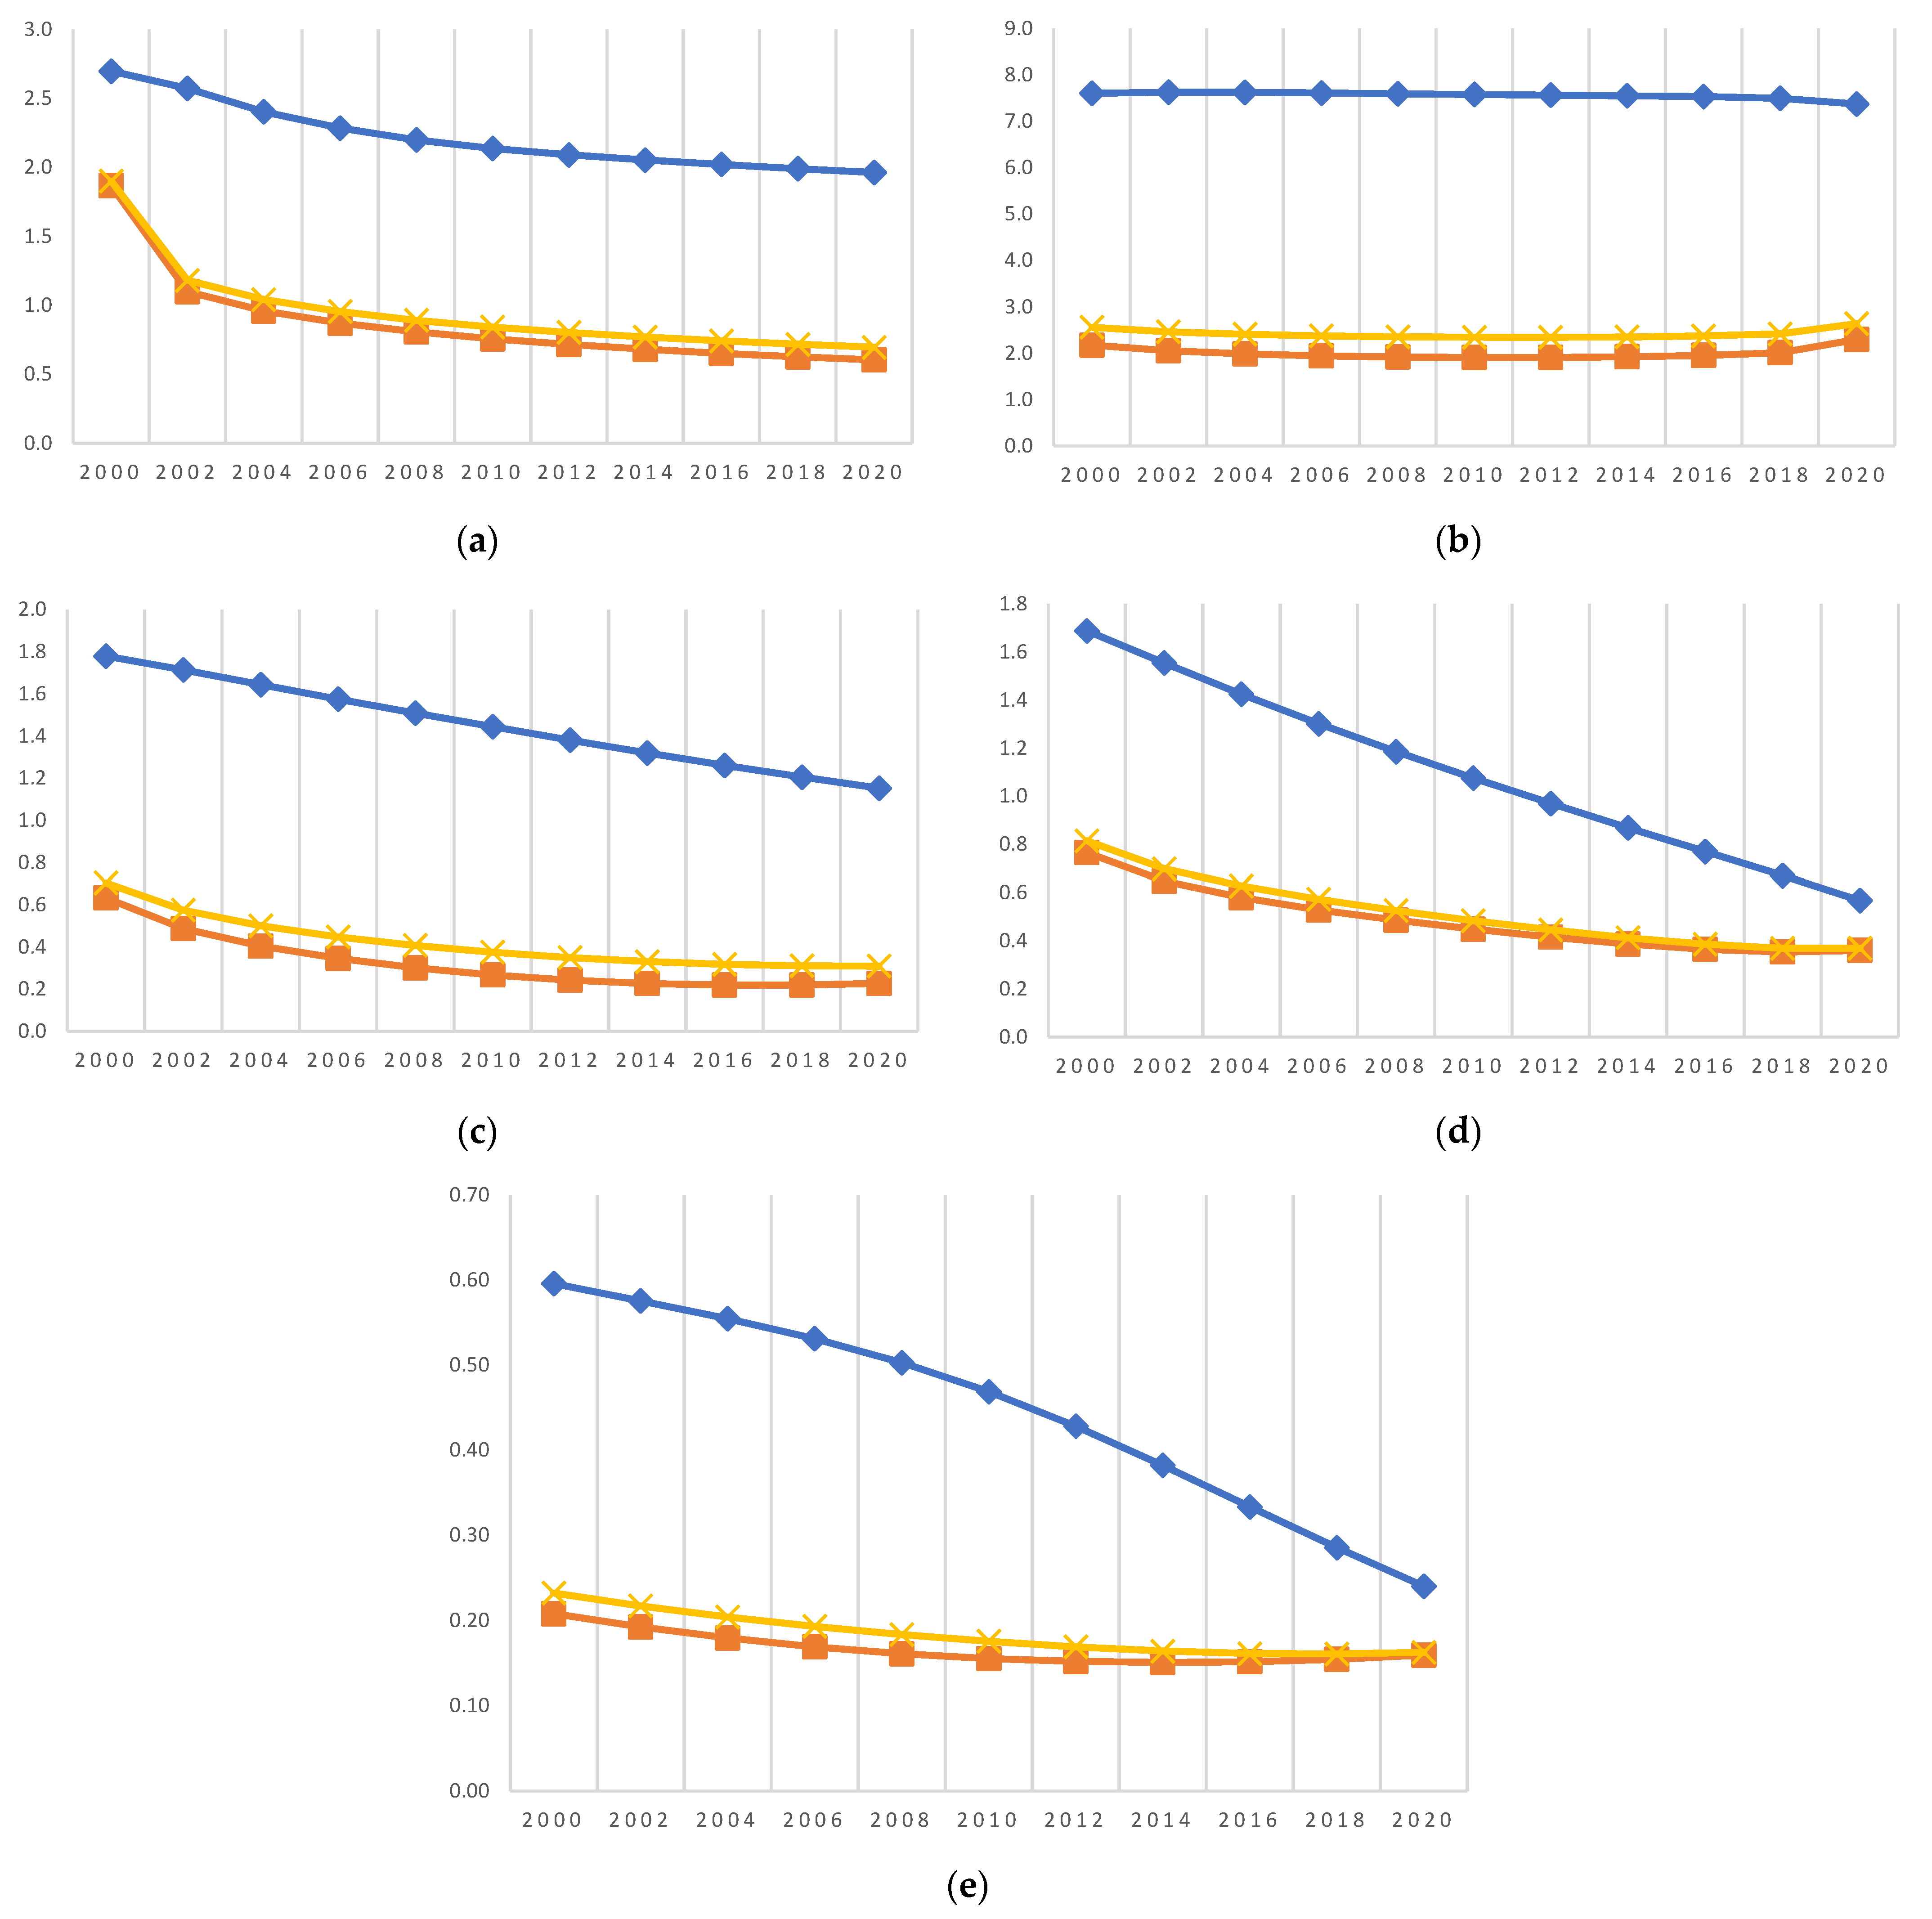
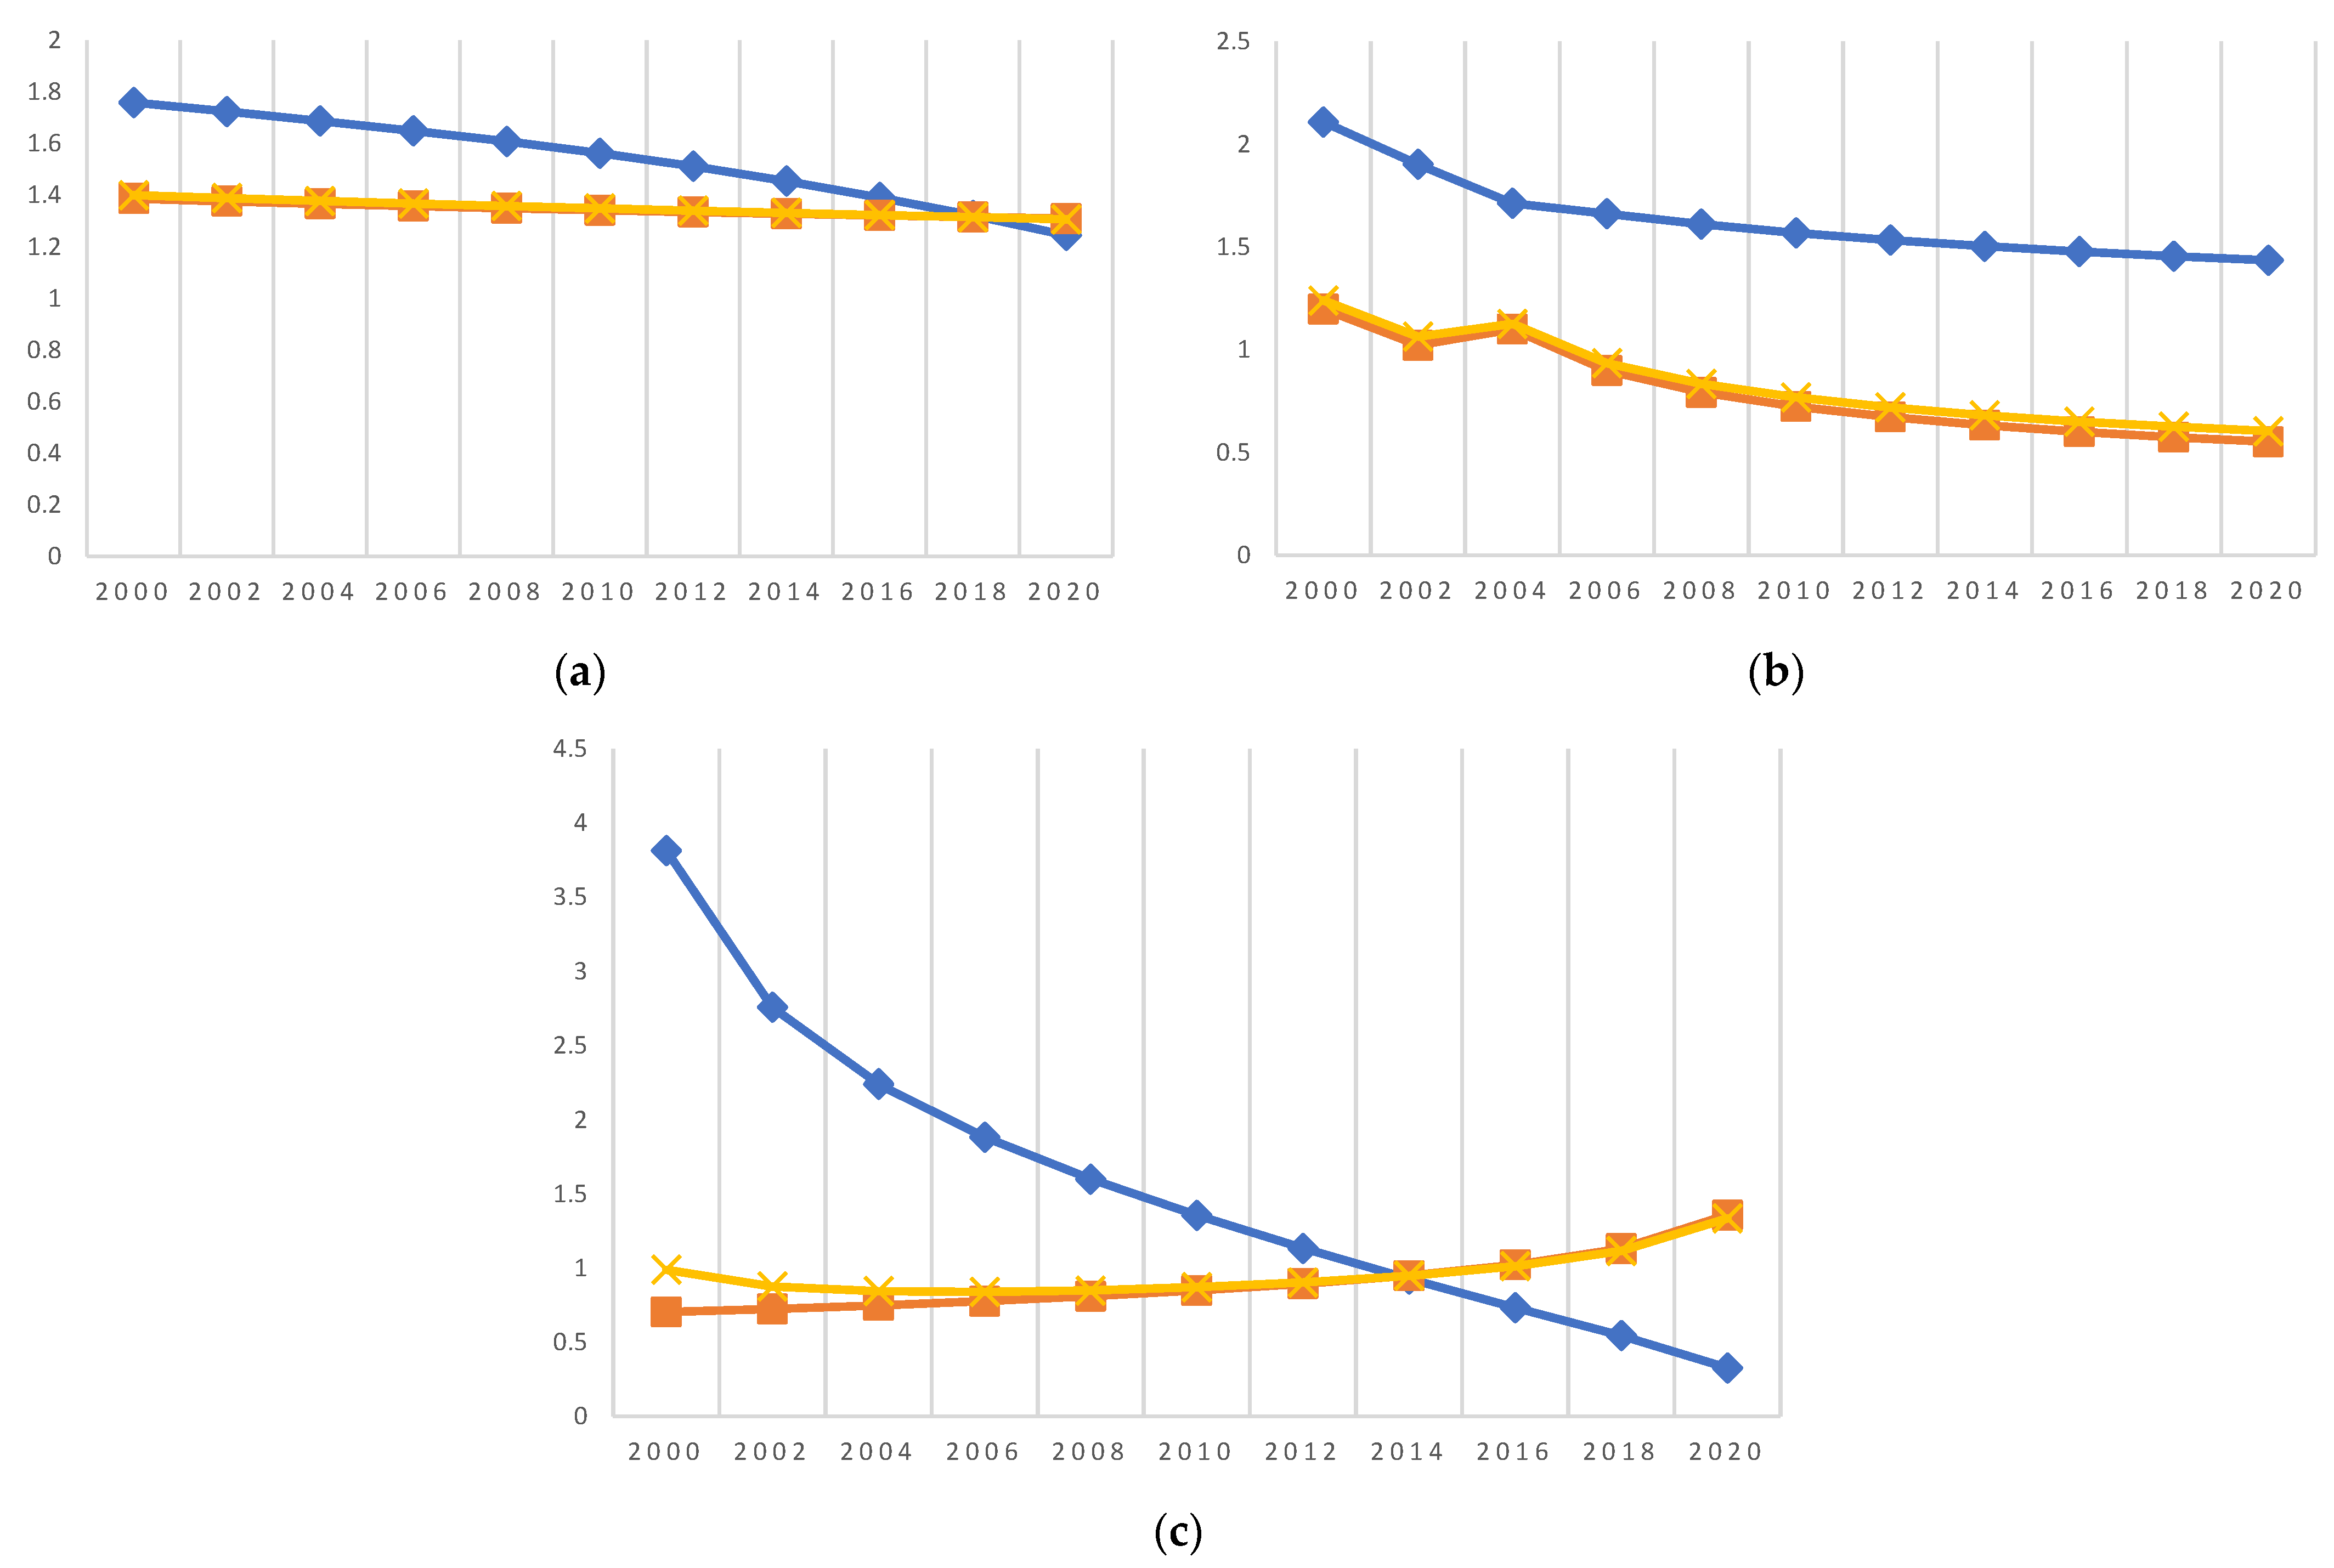
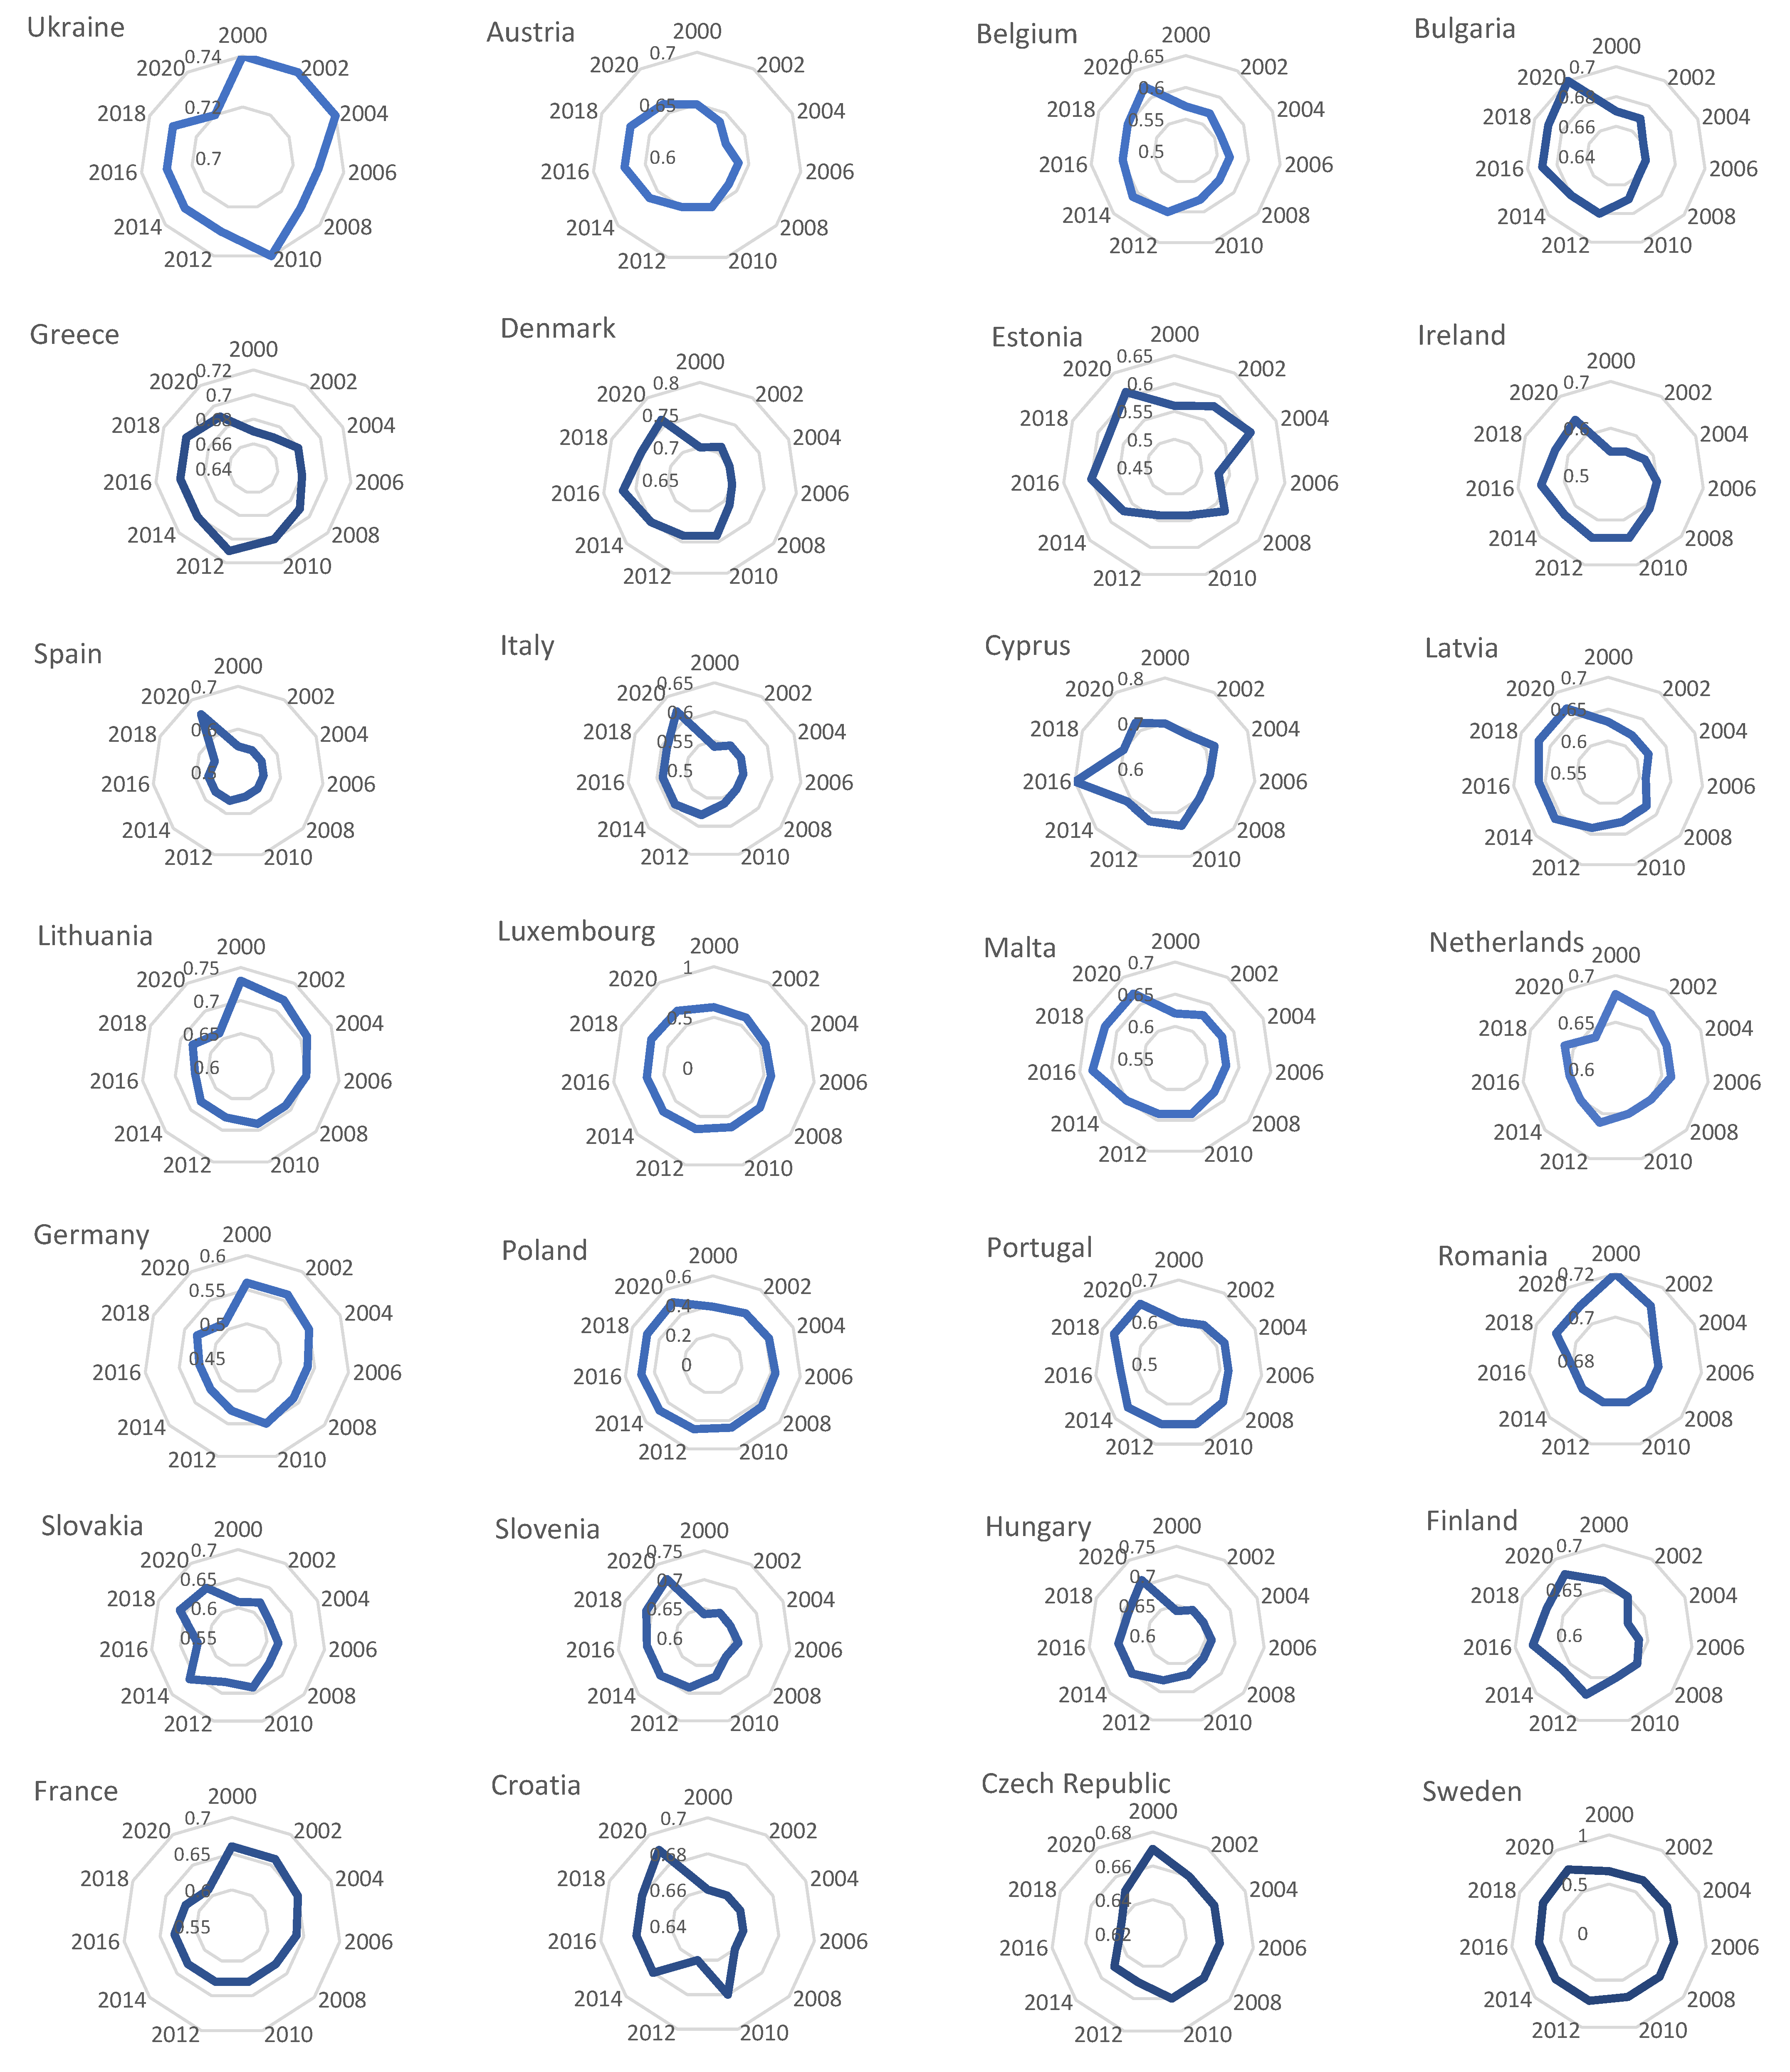
4. Results
4.1. Assessment of σ-Convergence
4.2. β-Convergence
4.3. Integrated Energy Efficiency Index
- minimum wage—increasing the level of social welfare in the country should be one of the most important goals for the state because a society that receives an adequate level of income and does not live on the edge of poverty is able to invest in the development of its own energy independence and environmental security [2,32,56,75,76].
5. Conclusions and Discussion
Author Contributions
Funding
Data Availability Statement
Acknowledgments
Conflicts of Interest
Appendix A


References
- Allcott, H.; Greenstone, M. Is There an Energy Efficiency Gap? J. Econ. Perspect. 2012, 26, 3–28. [Google Scholar] [CrossRef]
- Polcyn, J.; Us, Y.; Lyulyov, O.; Pimonenko, T.; Kwilinski, A. Factors Influencing the Renewable Energy Consumption in Selected European Countries. Energies 2022, 15, 108. [Google Scholar] [CrossRef]
- Samusevych, Y.; Vysochyna, A.; Vasylieva, T.; Lyeonov, S.; Pokhylko, S. Environmental, energy and economic security: Assessment and interaction. E3S Web Conf. 2021, 234, 12. [Google Scholar] [CrossRef]
- Taliento, M.; Netti, A. Corporate Social/Environmental Responsibility and Value Creation: Reflections on a Modern Business Management Paradigm. Bus. Ethics Leadersh. 2020, 4, 123–131. [Google Scholar] [CrossRef]
- Vanickova, R. Innovation Corporate Energy Management: Efficiency of Green Investment. Mark. Manag. Innov. 2020, 2, 56–67. [Google Scholar] [CrossRef]
- Foundation for Environmental Education (FEE). 2022. Available online: https://fee.no/ (accessed on 20 June 2022).
- Green Paper of the Commission of the European Communities: European Strategy for Sustainable, Competitive and Secure Energy. Available online: https://zakon.rada.gov.ua/laws/show/994_713#Text (accessed on 8 March 2006).
- ENTSO-E. 2022. Available online: https://www.entsoe.eu/news/2022/03/16/continental-europe-successful-synchronisation-with-ukraine-and-moldova-power-systems/ (accessed on 20 June 2022).
- Ziabina, Y.; Pimonenko, T. The Green Deal Policy for renewable energy: A bibliometric analysis. Virtual Econ. 2020, 3, 147–168. [Google Scholar] [CrossRef] [PubMed]
- Global Sustainable Competitiveness Index. 2019. Available online: http://solability.com/the-global-sustainablecompetitiveness-index/downloads (accessed on 20 June 2022).
- Pavlyk, V. Assessment of green investment impact on the energy efficiency gap of the national economy. Financ. Mark. Inst. Risks 2020, 4, 117–123. [Google Scholar] [CrossRef]
- Pavlyk, V. Institutional Determinants of Assessing Energy Efficiency Gaps in the National Economy. SocioEcon. Chall. 2020, 4, 122–128. [Google Scholar] [CrossRef]
- Aleem, S.H.A.; Zobaa, A.F.; Mageed, H.M.A. Assessment of energy credits for the enhancement of the Egyptian Green Pyramid Rating System. Energy Policy 2015, 87, 407–416. [Google Scholar] [CrossRef] [Green Version]
- Ziabina, Y.; Pimonenko, T.; Starchenko, L. Energy Efficiency of National Economy: Social, Economic and Ecological Indicators. SocioEcon. Chall. 2020, 4, 160–174. [Google Scholar] [CrossRef]
- Kolosok, S.; Saher, L.; Kovalenko, Y.; Delibasic, M. Renewable Energy and Energy Innovations: Examining Relationships Using Markov Switching Regression Model. Mark. Manag. Innov. 2022, 2, 151–160. [Google Scholar] [CrossRef]
- Shah, W.U.H.; Hao, G.; Yan, H.; Yasmeen, R.; Lu, Y. Energy efficiency evaluation, changing trends and determinants of energy productivity growth across South Asian countries: SBM-DEA and Malmquist approach. Environ. Sci. Pollut. Res. 2022, 29, 1–17. [Google Scholar] [CrossRef] [PubMed]
- Miskiewicz, R. Efficiency of electricity production technology from post-process gas heat: Ecological, economic and social benefits. Energies 2020, 13, 6106. [Google Scholar] [CrossRef]
- Saługa, P.W.; Szczepańska-Woszczyna, K.; Miśkiewicz, R.; Chład, M. Cost of equity of coal-fired power generation projects in Poland: Its importance for the management of decision-making process. Energies 2020, 13, 4833. [Google Scholar] [CrossRef]
- Tvaronavičienė, M. Clusters, innovations and energy efficiency: If relationship could be traced. Mark. Manag. Innov. 2017, 2, 382–391. [Google Scholar] [CrossRef] [Green Version]
- Chygryn, O.; Kuzior, A.; Olefirenko, O.; Uzik, J. Green Brand as a New Pattern of Energy-Efficient Consumption. Mark. Manag. Innov. 2022, 3, 78–87. [Google Scholar] [CrossRef]
- Matvieieva, Y.; Hamida, H.B. Modelling and Forecasting Energy Efficiency Impact on the Human Health. Health Econ. Manag. Rev. 2022, 3, 78–85. [Google Scholar] [CrossRef]
- Đonlagić, A.; Moskalenko, B.A. The Impact of FDI Inflow on the Environment: A Case of the Baltic-Black Sea Region Countries. SocioEcon. Chall. 2020, 4, 151–159. [Google Scholar] [CrossRef]
- Boutti, R.; El Amri, A.; Rodhain, F. Multivariate Analysis of a Time Series EU ETS: Methods and Applications in Carbon Finance. Financ. Mark. Inst. Risks 2019, 3, 18–29. [Google Scholar] [CrossRef]
- El Amri, A.; Boutti, R.; Oulfarsi, S.; Rodhain, F.; Bouzahir, B. Carbon financial markets underlying climate risk management, pricing and forecasting: Fundamental analysis. Financ. Mark. Inst. Risks 2020, 4, 31–44. [Google Scholar] [CrossRef]
- Mishenin, Y.; Klisinski, J.; Yarova, I.; Rak, A. Ensuring healthy environment: Mechanisms of cluster structures development in the field of waste management. Health Econ. Manag. Rev. 2020, 1, 78–90. [Google Scholar] [CrossRef]
- Pająk, K.; Kvilinskyi, O.; Fasiecka, O.; Miskiewicz, R. Energy security in regional policy in Wielkopolska region of Poland. Econ. Environ. 2017, 2, 122–138. [Google Scholar]
- Kurowska, K.; Kryszk, H.; Bielski, S. Determinants of biomass production for energy purposes in North-Eastern Poland. In Proceedings of the International Conference Engineering for Rural Development, Jelgava, Latvia, 22–24 May 2014; pp. 29–30. [Google Scholar]
- Zhang, X.; Zhang, K.M. Demand Response Behind—Meter Gener. Air Quality. Environ. Sci. Technol. 2015, 49, 1260–1267. [Google Scholar] [CrossRef] [PubMed]
- Driscoll, C.T.; Buonocore, J.J.; Levy, J.I.; Lambert, K.F.; Burtraw, D.; Reid, S.B.; Schwartz, J. US power plant carbon standards and clean air and health co-benefits. Nat. Clim. Change 2015, 5, 535–540. [Google Scholar] [CrossRef]
- Chen, Y.-L.; Shih, Y.-H.; Tseng, C.-H.; Kang, S.-Y.; Wang, H.-C. Economic and health benefits of the co-reduction of air pollutants and greenhouse gases. Mitig. Adapt. Strateg. Glob. Change 2012, 18, 1125–1139. [Google Scholar] [CrossRef]
- Komelina, O.; Shcherbinina, S. Methodology of estimation of energy reserves and energy efficiency of the housing fund of Ukraine. Mark. Manag. Innov. 2018, 1, 382–390. [Google Scholar] [CrossRef] [Green Version]
- Basok, B.; Bazeev, E.; Pavlenko, A.; Kurayeva, I. Municipal Heat Energy of Ukraine-Adaptation to Global Warming. Rocz. Ochr. Środowiska 2021, 23, 552–568. [Google Scholar] [CrossRef]
- Maratovich, K.N.; Omarkhanova, Z.; Bekarysovna, R.A.; Saparbayeva, S.S.; Ikramkhanovna, Z.D.; Bakytgul, A. Development of production and investment measures for energy saving and energy efficiency in rural areas. J. Environ. Manag. Tour. 2020, 11, 1251–1258. [Google Scholar] [CrossRef]
- Kolosok, S.; Pimonenko, T.; Yevdokymova, A.; Nazim, O.H.; Palienko, M.; Prasol, L. Energy efficiency policy: Impact of green innovations. Mark. Manag. Innov. 2020, 4, 50–60. [Google Scholar] [CrossRef]
- Jiang, Q.; Tang, C.; Zhan, J.; Zhang, W.; Wu, F. Environmental cost and pollution risk caused by the industrial transfer in Qinghai Province. Front. Earth Sci. 2014, 8, 362–374. [Google Scholar] [CrossRef]
- Zhao, Y.; Mao, J. Energy effects of nonenergy policies: Minimum wage standard and enterprise energy efficiency in China. Resour. Policy 2022, 79, 102953. [Google Scholar] [CrossRef]
- Yi, H. Green businesses in a clean energy economy: Analysing drivers of green business growth in U. S. states. Energy 2014, 68, 922–929. [Google Scholar] [CrossRef]
- Su, Y.-W.; Yang, H.-Y.; Lin, C.-H. Increase of electricity price and energy efficiency: Analysis using the macroeconomic interindustry model of Taiwan. Econ. Syst. Res. 2017, 29, 430–451. [Google Scholar] [CrossRef]
- Cebula, R.J. US residential electricity consumption: The effect of states’ pursuit of energy efficiency policies. Appl. Econ. Lett. 2012, 19, 1499–1503. [Google Scholar] [CrossRef]
- Lin, J.; Kang, J.; Khanna, N.; Shi, L.; Zhao, X.; Liao, J. Scenario analysis of urban GHG peak and mitigation cobenefits: A case study of Xiamen City, China. J. Clean. Prod. 2018, 171, 972–983. [Google Scholar] [CrossRef]
- Creason, J.R.; Bistline, J.E.; Hodson, E.L.; Murray, B.C.; Rossmann, C.G. Effects of technology assumptions on US power sector capacity, generation and emissions projections: Results from the EMF 32 Model Intercomparison Project. Energy Econ. 2018, 73, 290–306. [Google Scholar] [CrossRef]
- Bunse, K.; Vodicka, M.; Schönsleben, P.; Brülhart, M.; Ernst, F.O. Integrating energy efficiency performance in production management—Gap analysis between industrial needs and scientific literature. J. Clean. Prod. 2011, 19, 667–679. [Google Scholar] [CrossRef]
- Schulze, M.; Nehler, H.; Ottosson, M.; Thollander, P. Energy management in industry—A systematic review of previous findings and an integrative conceptual framework. J. Clean. Prod. 2016, 112, 3692–3708. [Google Scholar] [CrossRef] [Green Version]
- Liu, W.C. The relationship between primary energy consumption and real gross domestic product: Evidence from major Asian countries. Sustainability 2020, 12, 2568. [Google Scholar] [CrossRef] [Green Version]
- Siitonen, S.; Tuomaala, M.; Suominen, M.; Ahtila, P. Implications of process energy efficiency improvements for primary energy consumption and CO2 emissions at the national level. Appl. Energy 2010, 87, 2928–2937. [Google Scholar] [CrossRef]
- Reuter, M.; Patel, M.K.; Eichhammer, W. Applying ex-post index decomposition analysis to primary energy consumption for evaluating progress towards European energy efficiency targets. Energy Effic. 2017, 10, 1381–1400. [Google Scholar] [CrossRef]
- Klessmann, C.; Rathmann, M.; de Jager, D.; Gazzo, A.; Resch, G.; Busch, S.; Ragwitz, M. Policy options for reducing the costs of reaching the European renewables target. Renew. Energy 2013, 57, 390–403. [Google Scholar] [CrossRef]
- Liobikienė, G.; Butkus, M.; Bernatonienė, J. Drivers of greenhouse gas emissions in the Baltic states: Decomposition analysis related to the implementation of Europe 2020 strategy. Renew. Sustain. Energy Rev. 2016, 54, 309–317. [Google Scholar] [CrossRef]
- Abbas, Q.; Nurunnabi, M.; Alfakhri, Y.; Khan, W.; Hussain, A.; Iqbal, W. The role of fixed capital formation, renewable and non-renewable energy in economic growth and carbon emission: A case study of Belt and Road Initiative project. Environ. Sci. Pollut. Res. 2020, 27, 45476–45486. [Google Scholar] [CrossRef] [PubMed]
- Oyebanji, M.O.; Kirikkaleli, D. Energy productivity and environmental deregulation: The case of Greece. Environ. Sci. Pollut. Res. 2022, 29, 82772–82784. [Google Scholar] [CrossRef]
- Iqbal, W.; Fatima, A.; Yumei, H.; Abbas, Q.; Iram, R. Oil supply risk and affecting parameters associated with oil supplementation and disruption. J. Clean. Prod. 2020, 255, 120187. [Google Scholar] [CrossRef]
- Karellas, S.; Panopoulos, K.D.; Panousis, G.; Rigas, A.; Karl, J.; Kakaras, E. An evaluation of Substitute natural gas production from different coal gasification processes based on modelling. Energy 2012, 45, 183–194. [Google Scholar] [CrossRef]
- Andrade, H.S.; Loureiro, G. A Comparative Analysis of Strategic Planning Based on a Systems Engineering Approach. Bus. Ethics Leadersh. 2020, 4, 86–95. [Google Scholar] [CrossRef]
- Chygryn, O. The mechanism of the resource-saving activity at joint stock companies: The theory and implementation features. Int. J. Ecol. Dev. 2016, 31, 42–59. [Google Scholar]
- Chygryn, O.; Rosokhata, A.; Rybina, O.; Stoyanets, N. Green competitiveness: The evolution of concept formation. E3S Web Conf. 2021, 234, 4. [Google Scholar] [CrossRef]
- Ziabina, Y.A. Determinants of Energy Efficiency of the National Economy. Doctoral Dissertation, Sumy State University, Sumy, Ukraine, 2021. [Google Scholar]
- Hu, J.-L.; Wang, S.-C. Total-factor energy efficiency of regions in China. Energy Policy 2006, 34, 3206–3217. [Google Scholar] [CrossRef]
- Han, L.; Han, B.; Shi, X.; Su, B.; Lv, X.; Lei, X. Energy efficiency convergence across countries in the context of China’s Belt and Road initiative. Appl. Energy 2018, 213, 112–122. [Google Scholar] [CrossRef]
- NationMaster is a Statistics Database. Available online: https://www.nationmaster.com/ (accessed on 20 June 2022).
- State Statistics Service of Ukraine. Available online: http://www.ukrstat.gov.ua/ (accessed on 20 June 2022).
- European Statistical Office. Available online: https://ec.europa.eu/eurostat/statistics-explained/index.php/Electricity_price_statistics (accessed on 20 June 2022).
- Our World in Data. 2022. Available online: https://ourworldindata.org/co2-and-other-greenhouse-gas-emissions (accessed on 20 June 2022).
- Mohammadi, H.; Ram, R. Cross-country convergence in energy and electricity consumption, 1971–2007. Energy Econ. 2012, 34, 1882–1887. [Google Scholar] [CrossRef]
- Salman, M.; Zha, D.; Wang, G. Assessment of energy poverty convergence: A global analysis. Energy 2022, 255, 124579. [Google Scholar] [CrossRef]
- Bello, M.O.; Ch’ng, K.S. Convergence in energy intensity of GDP: Evidence from West African countries. Energy 2022, 13, 124217. [Google Scholar] [CrossRef]
- Kurniawan, T.A.; Liang, X.; O’Callaghan, E.; Goh, H.; Othman, M.H.D.; Avtar, R.; Kusworo, T.D. Transformation of Solid Waste Management in China: Moving towards Sustainability through Digitalization-Based Circular Economy. Sustainability 2022, 14, 2374. [Google Scholar] [CrossRef]
- Gil, A. Challenges on waste-to-energy for the valorization of industrial wastes: Electricity, heat and cold, bioliquids and biofuels. Environ. Nanotechnol. Monit. Manag. 2022, 17, 100615. [Google Scholar] [CrossRef]
- Ezzat Salem, M.; El-Halim, A.; Refky, A.; Nassar, I.A. Potential of Waste to Energy Conversion in Egypt. J. Electr. Comput. Eng. 2022, 2022, 7265553. [Google Scholar] [CrossRef]
- Liu, Q.; Zhu, Y.; Yang, W.; Wang, X. Research on the Impact of Environmental Regulation on Green Technology Innovation from the Perspective of Regional Differences: A Quasi-Natural Experiment Based on China’s New Environmental Protection Law. Sustainability 2022, 14, 1714. [Google Scholar] [CrossRef]
- Elavarasan, R.M.; Pugazhendhi, R.; Irfan, M.; Mihet-Popa, L.; Khan, I.A.; Campana, P.E. State-of-the-art sustainable approaches for deeper decarbonization in Europe–An endowment to climate neutral vision. Renew. Sustain. Energy Rev. 2022, 159, 112204. [Google Scholar] [CrossRef]
- Hainsch, K.; Löffler, K.; Burandt, T.; Auer, H.; del Granado, P.C.; Pisciella, P.; Zwickl-Bernhard, S. Energy transition scenarios: What policies, societal attitudes, and technology developments will realize the EU Green Deal? Energy 2022, 239, 122067. [Google Scholar] [CrossRef]
- Jiang, P.; Sonne, C.; You, S. Dynamic carbon-neutrality assessment needed to tackle the impacts of global crises. Environ. Sci. Technol. 2022, 56, 9851–9853. [Google Scholar] [CrossRef]
- Prisecaru, P. The war in Ukraine and the overhaul of EU energy security. Glob. Econ. Obs. 2022, 10, 16–25. [Google Scholar]
- Shpak, N.; Ohinok, S.; Kulyniak, I.; Sroka, W.; Androniceanu, A. Macroeconomic Indicators and CO2 Emissions in the EU Region. Amfiteatru Econ. J. 2022, 24, 817. [Google Scholar] [CrossRef]
- Gillingham, K.; Palmer, K. Bridging the Energy Efficiency Gap: Policy Insights from Economic Theory and Empirical Evidence. Rev. Environ. Econ. Policy 2014, 8, 18–38. [Google Scholar] [CrossRef] [Green Version]
- Panchenko, V.; Harust, Y.; Us, Y.; Korobets, O.; Pavlyk, V. Energy-Efficient Innovations: Marketing, Management and Law Supporting. Mark. Manag. Innov. 2020, 1, 256–264. [Google Scholar] [CrossRef] [Green Version]
- Chygryn, O.; Krasniak, V. Theoretical and applied aspects of the development of environmental investment in Ukraine. Mark. Manag. Innov. 2015, 3, 226–234. [Google Scholar]
- Prokopenko, O.; Miśkiewicz, R. Perception of “green shipping” in the contemporary conditions. Entrep. Sustain. Issues 2020, 8, 269–284. [Google Scholar] [CrossRef]
- Us, Y.; Pimonenko, T.; Lyulyov, O.; Chen, Y.; Tambovceva, T. Promoting Green Brand of University in Social Media: Text Mining and Sentiment Analysis. Virtual Econ. 2022, 5, 24–42. [Google Scholar] [CrossRef]
- Miśkiewicz, R. The importance of knowledge transfer on the energy market. Polityka Energetyczna 2018, 21, 49–62. [Google Scholar] [CrossRef]
- Anser, M.K.; Iqbal, W.; Ahmad, U.S.; Fatima, A.; Chaudhry, I.S. Environmental efficiency and the role of energy innovation in emissions reduction. Environ. Sci. Pollut. Res. 2020, 27, 29451–29463. [Google Scholar] [CrossRef] [PubMed]
- Wołowiec, T.; Kolosok, S.; Vasylieva, T.; Artyukhov, A.; Skowron, Ł.; Dluhopolskyi, O.; Sergiienko, L. Sustainable Governance, Energy Security, and Energy Losses of Europe in Turbulent Times. Energies 2022, 15, 8857. [Google Scholar] [CrossRef]
- Sotnyk, I.; Kurbatova, T.; Kubatko, O.; Baranchenko, Y.; Li, R. The price for sustainable development of renewable energy sector: The case of ukraine. E3S Web Conf. 2021, 280, 2006. [Google Scholar] [CrossRef]
- Sotnyk, I.; Kurbatova, T.; Romaniuk, Y.; Prokopenko, O.; Gonchar, V.; Sayenko, Y.; Prause, G.; Sapiński, A. Determining the Optimal Directions of Investment in Regional Renewable Energy Development. Energies 2022, 15, 3646. [Google Scholar] [CrossRef]
- Hussain, H.I.; Haseeb, M.; Kamarudin, F.; Dacko-Pikiewicz, Z.; Szczepańska-Woszczyna, K. The role of globalization, economic growth and natural resources on the ecological footprint in thailand: Evidence from nonlinear causal estimations. Processes 2021, 9, 1103. [Google Scholar] [CrossRef]


| Variables | Unit of Measurement | Indicators | Explanations | Source |
|---|---|---|---|---|
| Environmental subindex | ||||
| Ozone concentration | units of Dobson | OCN d | The indicator, the level of which affects climate change and is an indicator regulated by the European Green Agreement | NationMaster [59] |
| The amount of waste generated | thousands of tons | VGW d | Reduction of this indicator is characterized by the introduction of closed cycles in production and efficient use of resources, which meets the requirements of the Sustainable Development Strategy and the European Green Agreement | Ukrstat/Eurostat [60,61] |
| CO2 emissions per capita | tons per capita | COE d | A key indicator, the decline of which is regulated by all development strategies both at the national level and abroad | |
| Energy subindex | ||||
| Primary energy consumption | terawatt hours | PEC s | The level of this indicator characterizes the development of the industry with the growth of economic indicators, such as GDP | World Bank [62] |
| A share of renewable energy in final energy consumption | in percentages | REC s | One of the key indicators of energy efficiency of the national economy and, accordingly, its growth due to the EU Green Agreement | |
| Coefficient of dependence of energy imports on solid fossil fuels | in percentages | SEI d | Reduction of this indicator will have a positive impact on the level of energy efficiency of the national economy and increase the potential of energy security of the country | NationMaster [59] |
| Economic subindex | ||||
| A share of household expenditures on housing and communal services | in percentages | SHE d | According to the main theses of the Sustainable Development Strategy, the population should have access to energy resources at affordable prices, which is regulated by this indicator | Ukrstat/Eurostat [60,61] |
| Minimum wage | EUR | AWS s | This indicator is one of the key indicators of the country’s level of development, which in turn affects the ability of the population to switch to more energy-efficient technologies with a view to improving the environmental situation in the country | |
| Cost of electricity | eurocents per 1 kW | CEL d | In the long run, these indicators should decrease with the introduction of renewable energy sources | |
| Price of natural gas | eurocents per 1 m3 | CNG d | ||
| Current costs of environmental protection | millions ofeuros | CCE s | The growth of this indicator characterizes the country’s financial capacity to improve environmental conditions and preserve the country’s biodiversity, which is regulated by the Sustainable Development Strategy and the European Green Agreement | World Bank [62] |
| Ukraine and the EU Member Countries | The EU Member Countries | |||||
|---|---|---|---|---|---|---|
| Variable | Coef. | Std. Err. | p > |t| | Coef. | Std. Err. | p > |t| |
| COE | 0.0067444 | 0.0008814 | 0.000 | 0.0072551 | 0.0008841 | 0.000 |
| F1 | −1.56 × 10⁻⁷ | 3.15 × 10⁻⁷ | 0.000 | −1.85 × 10⁻⁷ | 3.20 × 10⁻⁸ | 0.000 |
| F2 | 3.44 × 10⁻⁶ | 5.28 × 10⁻⁶ | 0.514 | 5.21 × 10⁻⁶ | 5.27 × 10⁻⁶ | 0.324 |
| F3 | −0.0004557 | 0.0000595 | 0.000 | −0.0005008 | 0.0000608 | 0.000 |
| OCN | −0.0000515 | 0.0002505 | 0.007 | 0.0000271 | 0.0002554 | 0.005 |
| F1 | 5.54 × 10⁻⁹ | 3.33 × 10⁻⁹ | 0.097 | 6.17 × 10⁻⁹ | 3.43 × 10⁻⁹ | 0.072 |
| F2 | 1.71 × 10⁻⁶ | 6.21 × 10⁻⁷ | 0.006 | 1.66 × 10⁻⁶ | 6.30 × 10⁻⁷ | 0.009 |
| F3 | 0.0000597 | 7.15 × 10⁻⁶ | 0.000 | 0.0000645 | 7.46 × 10⁻⁶ | 0.000 |
| VGW | −0.0009668 | 0.0002807 | 0.001 | −0.0004391 | 0.0001422 | 0.002 |
| F1 | 9.66 × 10⁻⁸ | 3.38 × 10⁻⁷ | 0.004 | 1.14 × 10⁻⁷ | 1.73 × 10⁻⁷ | 0.000 |
| F2 | −0.0000284 | 7.38 × 10⁻⁶ | 0.000 | −0.0000243 | 3.73 × 10⁻⁶ | 0.000 |
| F3 | −0.0002588 | 0.0000746 | 0.001 | −0.0000422 | 0.0000384 | 0.272 |
| Ukraine and the EU Member Countries | The EU Member Countries | |||||
|---|---|---|---|---|---|---|
| Variable | Coef. | Std. Err. | p > |t| | Coef. | Std. Err. | p > |t| |
| AWS | −0.0748172 | 0.0076215 | 0.000 | 0.0804651 | 0.0078424 | 0.000 |
| F1 | −3.10 × 10⁻⁶ | 5.12 × 10⁻⁷ | 0.000 | −3.16 × 10⁻⁶ | 5.20 × 10⁻⁷ | 0.000 |
| F2 | 0.0002316 | 0.0000832 | 0.006 | 0.0002314 | 0.0000839 | 0.006 |
| F3 | −0.0044312 | 0.0010716 | 0.000 | −0.0041382 | 0.001089 | 0.000 |
| CCE | 0.0106225 | 0.0010957 | 0.000 | 0.0058254 | 0.0013096 | 0.000 |
| F1 | 6.48 × 10⁻⁸ | 1.84 × 10⁻⁷ | 0.724 | 1.58 × 10⁻⁷ | 1.80 × 10⁻⁷ | 0.379 |
| F2 | 0.0001565 | 0.0000374 | 0.000 | 0.0000877 | 0.000038 | 0.021 |
| F3 | −0.0027164 | 0.0004119 | 0.000 | −0.0023974 | 0.0004166 | 0.000 |
| CEL | 0.0192067 | 0.000854 | 0.000 | 0.0242908 | 0.0009609 | 0.000 |
| F1 | −3.06 × 10⁻⁷ | 3.50 × 10⁻⁸ | 0.000 | −2.85 × 10⁻⁷ | 3.33 × 10⁻⁸ | 0.000 |
| F2 | 0.0000234 | 6.46 × 10⁻⁶ | 0.000 | 0.0000194 | 6.10 × 10⁻⁶ | 0.002 |
| F3 | −0.0001273 | 0.0000753 | 0.091 | −0.0000977 | 0.0000716 | 0.173 |
| CNG | 0.1097298 | 0.084919 | 0.097 | −0.1230202 | 0.0905341 | 0.175 |
| F1 | −6.07 × 10⁻⁷ | 4.34 × 10⁻⁶ | 0.889 | −7.28 × 10⁻⁷ | 4.47 × 10⁻⁶ | 0.871 |
| F2 | 0.0004302 | 0.0008171 | 0.599 | 0.0004201 | 0.0008339 | 0.615 |
| F3 | 0.0027709 | 0.0089511 | 0.757 | 0.0020991 | 0.0093136 | 0.822 |
| SHE | 0.0074535 | 0.0008075 | 0.000 | −0.0055212 | 0.0008675 | 0.000 |
| F1 | 7.30 × 10⁻⁸ | 1.48 × 10⁻⁸ | 0.000 | 9.58 × 10⁻⁸ | 1.48 × 10⁻⁸ | 0.000 |
| F2 | −0.0000267 | 2.79 × 10⁻⁶ | 0.000 | −0.0000296 | 2.75 × 10⁻⁶ | 0.000 |
| F3 | −0.0001438 | 0.0000322 | 0.000 | −0.0001523 | 0.0000317 | 0.000 |
| Ukraine and the EU Member Countries | The EU Member Countries | |||||
|---|---|---|---|---|---|---|
| Variable | Coef. | Std. Err. | p > |t| | Coef. | Std. Err. | p > |t| |
| PEC | −0.0002893 | 0.0000964 | 0.003 | 0.0000897 | 0.000104 | 0.389 |
| F1 | −1.05 × 10⁻⁸ | 9.95 × 10⁻⁹ | 0.290 | −2.78 × 10⁻⁸ | 9.70 × 10⁻⁹ | 0.004 |
| F2 | 0.000013 | 2.23 × 10⁻⁶ | 0.000 | 0.0000192 | 2.25 × 10⁻⁶ | 0.000 |
| F3 | −0.0000272 | 0.0000219 | 0.214 | −0.0000765 | 0.0000224 | 0.001 |
| REC | −0.0040503 | 0.0011173 | 0.000 | −0.0041818 | 0.0011596 | 0.000 |
| F1 | −8.61 × 10⁻⁷ | 1.27 × 10⁻⁶ | 0.499 | −1.07 × 10⁻⁶ | 1.32 × 10⁻⁶ | 0.417 |
| F2 | 0.0002792 | 0.000244 | 0.253 | 0.0002878 | 0.0002486 | 0.247 |
| F3 | 0.0015166 | 0.0027075 | 0.576 | 0.0017635 | 0.0028193 | 0.532 |
| SEI | 0.0001926 | 0.0005106 | 0.706 | −0.0006947 | 0.000458 | 0.130 |
| F1 | −9.58 × 10⁻⁷ | 1.77 × 10⁻⁶ | 0.589 | −2.73 × 10⁻⁷ | 1.58 × 10⁻⁶ | 0.863 |
| F2 | 0.0002556 | 0.0003142 | 0.416 | 0.0002183 | 0.0002778 | 0.432 |
| F3 | 0.0008748 | 0.0035393 | 0.805 | 0.0034231 | 0.0032054 | 0.286 |
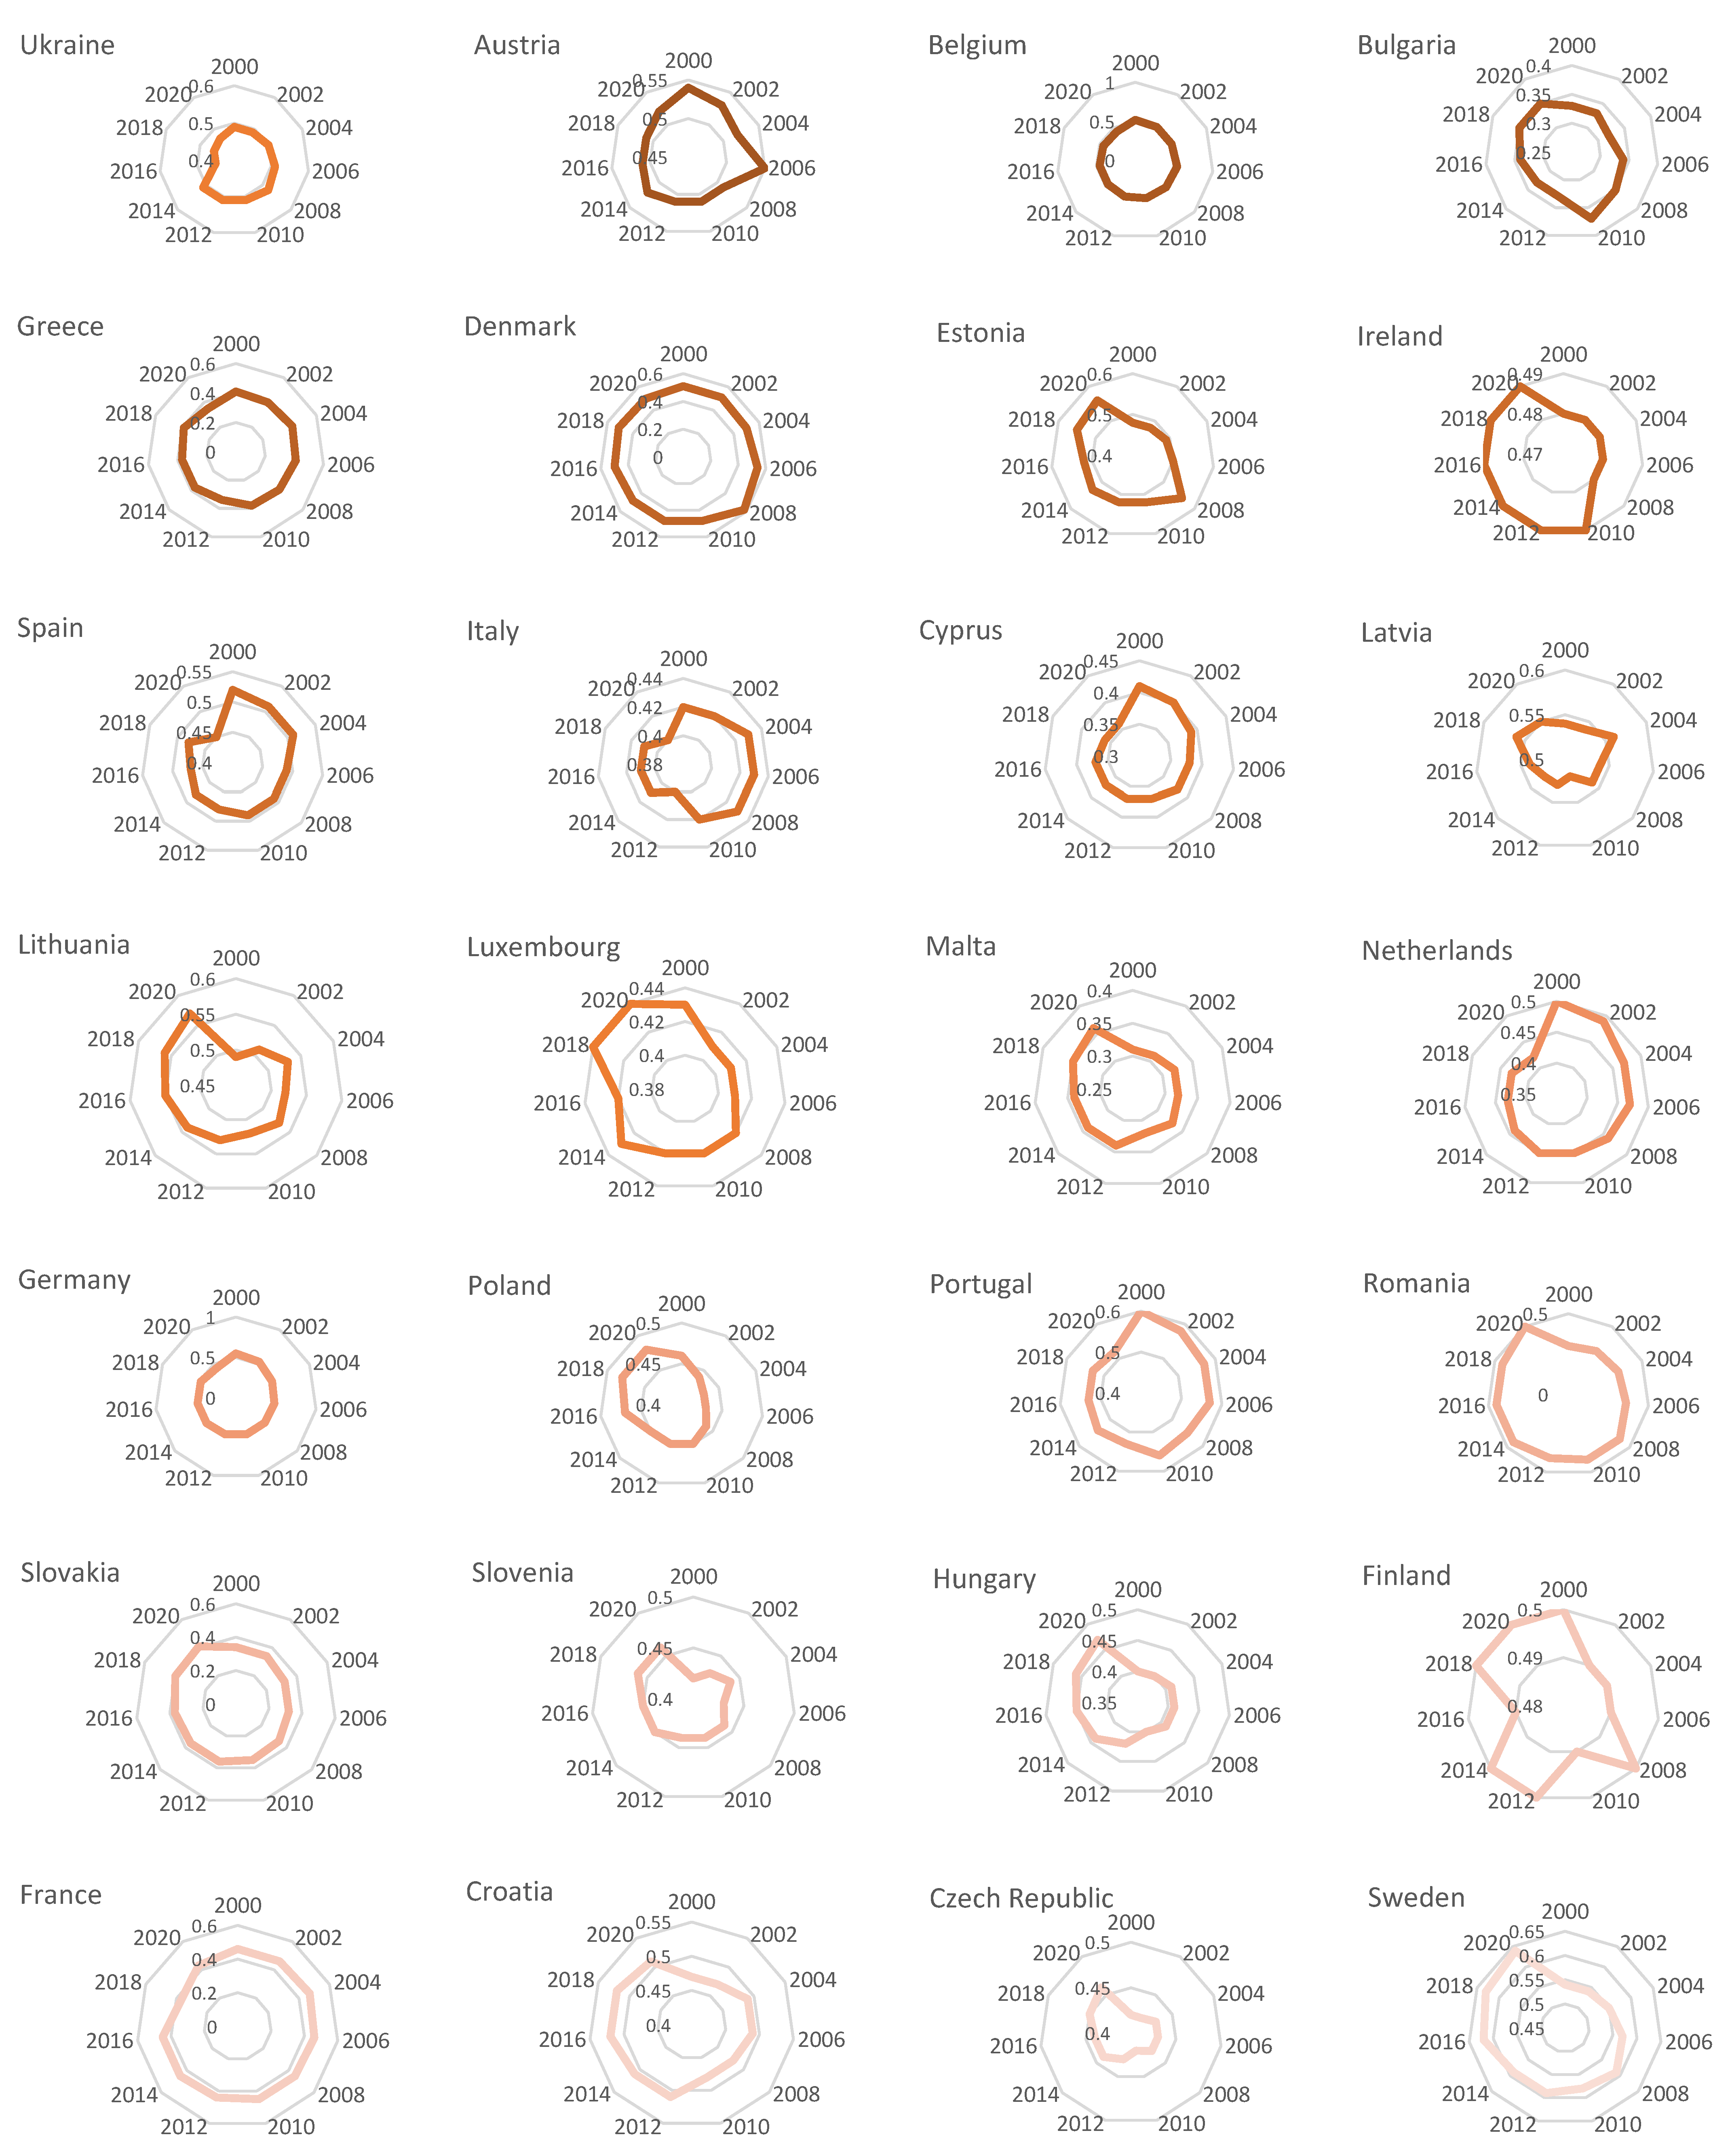
| Country | Years | |||||
|---|---|---|---|---|---|---|
| 2000 | 2004 | 2008 | 2012 | 2016 | 2020 | |
| Ukraine | 0.74 | 0.74 | 0.73 | 0.73 | 0.73 | 0.72 |
| Austria | 0.65 | 0.63 | 0.64 | 0.65 | 0.67 | 0.66 |
| Belgium | 0.57 | 0.56 | 0.57 | 0.6 | 0.6 | 0.62 |
| Bulgaria | 0.67 | 0.66 | 0.66 | 0.68 | 0.69 | 0.7 |
| Greece | 0.67 | 0.68 | 0.69 | 0.71 | 0.7 | 0.69 |
| Denmark | 0.7 | 0.7 | 0.71 | 0.74 | 0.77 | 0.76 |
| Estonia | 0.56 | 0.6 | 0.57 | 0.54 | 0.6 | 0.61 |
| Ireland | 0.55 | 0.58 | 0.61 | 0.64 | 0.65 | 0.64 |
| Spain | 0.56 | 0.56 | 0.56 | 0.57 | 0.57 | 0.66 |
| Italy | 0.54 | 0.55 | 0.55 | 0.58 | 0.59 | 0.62 |
| Cyprus | 0.7 | 0.72 | 0.7 | 0.72 | 0.8 | 0.72 |
| Latvia | 0.63 | 0.62 | 0.63 | 0.64 | 0.66 | 0.67 |
| Lithuania | 0.73 | 0.71 | 0.69 | 0.68 | 0.67 | 0.66 |
| Luxembourg | 0.6 | 0.56 | 0.6 | 0.63 | 0.67 | 0.67 |
| Malta | 0.62 | 0.63 | 0.63 | 0.64 | 0.68 | 0.67 |
| Netherlands | 0.68 | 0.66 | 0.65 | 0.66 | 0.65 | 0.64 |
| Germany | 0.56 | 0.55 | 0.54 | 0.53 | 0.52 | 0.51 |
| Poland | 0.39 | 0.42 | 0.44 | 0.46 | 0.49 | 0.5 |
| Portugal | 0.6 | 0.62 | 0.64 | 0.65 | 0.64 | 0.67 |
| Romania | 0.72 | 0.7 | 0.7 | 0.7 | 0.7 | 0.71 |
| Slovakia | 0.61 | 0.61 | 0.62 | 0.63 | 0.62 | 0.65 |
| Slovenia | 0.64 | 0.65 | 0.65 | 0.69 | 0.7 | 0.72 |
| Hungary | 0.64 | 0.65 | 0.66 | 0.68 | 0.7 | 0.71 |
| Finland | 0.66 | 0.63 | 0.65 | 0.67 | 0.68 | 0.68 |
| France | 0.66 | 0.65 | 0.63 | 0.63 | 0.63 | 0.61 |
| Croatia | 0.66 | 0.66 | 0.66 | 0.66 | 0.68 | 0.69 |
| Czech Republic | 0.67 | 0.66 | 0.66 | 0.65 | 0.64 | 0.65 |
| Sweden | 0.63 | 0.65 | 0.68 | 0.72 | 0.72 | 0.77 |
Disclaimer/Publisher’s Note: The statements, opinions and data contained in all publications are solely those of the individual author(s) and contributor(s) and not of MDPI and/or the editor(s). MDPI and/or the editor(s) disclaim responsibility for any injury to people or property resulting from any ideas, methods, instructions or products referred to in the content. |
© 2023 by the authors. Licensee MDPI, Basel, Switzerland. This article is an open access article distributed under the terms and conditions of the Creative Commons Attribution (CC BY) license (https://creativecommons.org/licenses/by/4.0/).
Share and Cite
Ziabina, Y.; Kwilinski, A.; Lyulyov, O.; Pimonenko, T.; Us, Y. Convergence of Energy Policies between the EU and Ukraine under the Green Deal Policy. Energies 2023, 16, 998. https://doi.org/10.3390/en16020998
Ziabina Y, Kwilinski A, Lyulyov O, Pimonenko T, Us Y. Convergence of Energy Policies between the EU and Ukraine under the Green Deal Policy. Energies. 2023; 16(2):998. https://doi.org/10.3390/en16020998
Chicago/Turabian StyleZiabina, Yevheniia, Aleksy Kwilinski, Oleksii Lyulyov, Tetyana Pimonenko, and Yana Us. 2023. "Convergence of Energy Policies between the EU and Ukraine under the Green Deal Policy" Energies 16, no. 2: 998. https://doi.org/10.3390/en16020998