Article

Grating Spectrum Design and Optimization of GMM-FBG Current Sensor

1
China Electric Power Research Institute, Beijing 100192, China
2
State Grid Shizuishan Electric Power Supply Company, Shizuishan 753099, China
3
State Key Laboratory of Power Transmission Equipment and System Security and New Technology, Chongqing University, Chongqing 400044, China
*
Authors to whom correspondence should be addressed.
Energies 2023, 16(2), 997; https://doi.org/10.3390/en16020997
Submission received: 10 November 2022 / Revised: 26 December 2022 / Accepted: 9 January 2023 / Published: 16 January 2023
(This article belongs to the Topic High Voltage Systems and Smart Technologies)

Abstract

:
In this study, the performance of a current sensor based on giant magnetostrictive materials (GMM) and fiber Bragg grating (FBG) has been improved by optimizing the spectral characteristics of gratings. By analyzing the influence of FBG on the current sensor characteristics, three key parameters (gate region length, refractive index modulation depth, and toe cutting system) are selected for optimization. The optimal grating parameters are determined to improve the linearity and sensitivity of sensor output. Experimental tests reveal that after grating optimization, the current sensor shows excellent performance parameters, including a linearity of 0.9942, sensitivity of 249.75 mV/A, and good stability in the temperature range of 0–60 °C. This research can provide a reference for improving the grating design and performance of existing GMM-FBG current sensors.

1. Introduction

With the expansion of smart grid systems, traditional electromagnetic current transformers are evolving into electronic current transformers and optical current sensors that are cost-effective, consume less power, and can be easily miniaturized and installed [1,2,3,4]. Owing to considerable changes in the amplitude and frequency of grid current signals, traditional current transformers can no longer meet the requirements for installing massive nodes in an entire grid network [5,6,7,8]. Current sensors combining giant magnetostrictive material (GMM) [9,10,11] and fiber Bragg grating (FBG) technology [12,13] can be used to perform broadband, high-precision, passive, and non-contact measurements of current signals [14,15,16]. However, since FBG is highly sensitive to external forces and temperature, these sensors are easily affected by changes in external temperature; thus, temperature compensation strategies must be implemented.
Several temperature compensation methods have been applied to GMM-FBG current sensors, which are based on temperature-independent sensing systems [17], same sensing elements [18,19], different sensing elements [20,21], and optimization algorithms [22]. Some scholars have proposed a double-grating intensity demodulation system by using FBG as the sensing element and demodulation element to realize temperature-independent measurements of current signals [23,24,25,26]. This temperature compensation system has a wide measurement frequency range, simple structure, and low cost; however, grating parameters significantly influence its sensing performance. Furthermore, no systematic study has been conducted for optimizing grating parameters in order to improve the performance of GMM-FBG sensors. For example, in a previous study, although the characteristics, linearity, and wavelength range of the spectral overlap area curve have been directly associated with sensor performance, the overlap area curve is determined using basic spectrum parameters [27]. Therefore, to design, develop, and improve the performance of existing GMM-FBG current sensors, it is necessary to determine the relationship between FBG parameters and sensor output characteristics.
In view of this, this study analyzes the effect of FBG on the current sensor characteristics. Based on the coupling mode theory, three key parameters (gate region length, refractive index modulation depth, and toe cutting system) have been observed to control the spectral morphology of the grating. Furthermore, the influence of these parameters on the spectral superposition area is studied using a numerical calculation method. By analyzing the variation curves of the superimposed spectral area under different parameters, the customized parameters of the sensor and reference FBG are determined to improve the linearity and sensitivity of the sensor output.

2. Sensor Working Mechanism

2.1. Influence of FBG on Sensor Characteristics

By introducing a reference FBG, the GMM-FBG current sensor establishes the relationship between the input signal and superimposed light intensity of the reflection spectrum of the two gratings. Subsequently, the light intensity is demodulated to detect the measured signal. In this entire process, the variation characteristics of the superimposed area in the reflection spectra of the sensing grating and reference grating (low superimposed light strength) control the sensor output performance, while the spectral morphology of FBG reflection affects these variation characteristics. Therefore, the output characteristics of the sensor are closely related to the spectral morphology of the two gratings (Figure 1).
Figure 1a,b show the superposition areas of two spectra at different spectral reflectivities and bandwidths. Figure 1c shows that the spectral center wavelength λ1 remains unchanged after toe cutting, while the grating center wavelength λ2 exhibits the same input-output curve. Since the initial superposition areas (b1 and b2) of the spectrum are different in these two cases, different sensor output amplitudes are observed when the input signal is zero. In Figure 1b, the variation in superimposed area is large, and the input-output curve of the sensor is steeper than that in Figure 1a. Since the reflectance change curve at one end of the spectrum is not linear, the change trend of the superimposed area of the two spectra after the grating shifts to the right is represented by a curve with high linearity, as shown by the black curve in Figure 1c. The fitted input-output curve is shown in red in Figure 1c, where k1 > k2. Figure 1a,b show that there is a significant sidelobe effect in the grating reflection spectrum, which further reduces the linearity of the input-output curve in Figure 1c. A sidelobe is observed in the grating spectrum because grating refractive index modulation begins and ends abruptly. To ensure that this modulation exhibits a certain functional form, the grating is subjected to toe cutting. Figure 1d,e show the distribution of the superimposed area and the input-output curve after toe cutting, respectively. The spectra are significantly reduced at the side lobe after toe cutting, which makes the change in superimposed area more linear under the same condition; that is, the linear fit degree of y3 is higher than that of y1.
From the above analysis, it can be concluded that the spectral reflectance and bandwidth of a single FBG control the maximum value of the superimposed spectral area and the linear fit degree of the input-output curve, thus affecting the output amplitude and linearity of the sensor. Depending on whether toe cutting is performed and the toe cutting system employed, the output linearity of the sensor is altered due to a change in the number of sidelobes on both sides of the spectrum.

2.2. Coupled Mode Theory

Essentially, the shape of an FBG reflection spectrum is determined by its customized parameters including gate region length, refractive index modulation depth, and post-processing method. Therefore, this section simulates the spectral shape of a single grating based on the coupled mode theory and elucidates the variation law of superimposed spectral area under different parameters with the help of numerical calculation methods. Thus, a relationship between the customized parameters of FBG and sensor output characteristics is established, and a parameter selection scheme that can improve sensor performance is proposed.
FBG causes a coupling between two reverse modes, namely, the fiber core modes propagating along the z-axis and -z direction. Assuming that the amplitude of the mode propagating along the z-axis is A and the amplitude of the mode propagating along -z is B, the simplified coupled-mode theory of FBG can be obtained by considering only the coupling between these two core modes [28].
d A d z = j k B e j 2 δ z
d B d z = j k * A e j 2 δ z
where δ = β π / Λ , k = ( π / λ ) δ n ¯ e f f , β is the propagation constant, λ is the grating period, k is the coupling coefficient of z-axis and -z-axis modes, and δ n ¯ e f f represents the change in refractive index at different positions.
Equations (1) and (2) are differential equations of A and B, respectively. If the length of the gate region is L, then z = 0, A = A(0), z = L, and B = B(L) are the boundary conditions of the system of equations. When k 2 > δ 2 , the solution of this system of equations is:
A ( z ) = e j δ z { s cosh ( L z ) j δ sinh [ s ( L z ) ] } A ( 0 ) e j δ L j k sinh ( s z ) B ( L ) s cosh ( s L ) j δ sinh ( s L )
B ( z ) = e j δ z j k * sinh [ s ( L z ) ] A ( 0 ) + e j δ L [ s cosh ( s z ) j δ sinh ( s z ) ] B ( L ) s cosh ( s L ) j δ sinh ( s L )
where s 2 = k k * δ 2 = k 2 δ 2 . Generally, it is advised that A(0) = 1 and B(L) = 0, which ensures that the FBG reflectance is:
R = P B ( 0 ) P A ( 0 ) = | B ( 0 ) | 2 | A ( 0 ) | 2 = k k * sinh 2 ( s L ) s 2 cosh 2 ( s L ) + δ 2 sinh 2 ( s L )
Although the two modes that were coupled in FBG are both fiber core modes, they tend to propagate under a phase matching condition of δ = 0, which corresponds to maximum reflectance and maximum transmittance.
R max = tanh 2 ( k L )
The zero-value bandwidth of both sides of the grating reflection spectrum can be obtained by using the reflectance formula in Equation (5):
Δ λ = 2 λ C N 1 + ( k L π ) 2
where λ C is the wavelength corresponding to the reflectance amplitude of the grating reflection spectrum, and N = L/ Λ represents the period number of the FBG under a phase matching condition of δ = 0, β π / Λ = 0 . By combining this equation with the propagation constant and the effective refractive index β = 2 π n e f f / λ , the center wavelength λC of grating reflection spectrum can be deduced as follows:
λ C = 2 n e f f Λ
The above-mentioned equations have been derived based on the coupled mode theory. The reflection spectrum of FBG is closely related to the gate region length L, δ n ¯ e f f , and the function associated with the toe cutting system σ ( z ) . Figure 2 shows the reflection spectra of FBG not subjected to toe cutting at an L of 5 mm, 10 mm, 5 mm, and 10 mm and δ n ¯ e f f of 1 × 10⁻⁴, 1 × 10⁻⁴, 5 × 10⁻⁴, and 5 × 10⁻⁴, respectively. To visualize the morphological changes in the spectra at different parameters, the central wavelengths of the four spectra are set differently.

3. Sensor Design and Optimization

Based on the coupled mode theory, the influences of FBG gate length, refractive index modulation depth, and toe cutting function on the spectral morphology of a single grating were analyzed. Furthermore, MATLAB software was used to study the variation in the superimposed area of the two spectra to determine the FBG customized parameters that can improve the sensor characteristics.

3.1. Effect of Grating Length on Sensor Characteristics

According to Equations (5) and (7), the reflectance amplitude Rmax and bandwidth ∆λ of a single grating spectrum are closely related to the grating gate region length L. Figure 3 shows the curve of the reflection spectrum Rmax versus ∆λ when L increases from 1 mm to 30 mm at a refractive index modulation depth of 1 × 10⁻⁴. Rmax increases significantly when L increases from 1 mm to 10 mm and then increases slowly until L exceeds 20 mm, after which the curve exhibits a stationary state and Rmax remains at 0.9999. Meanwhile, ∆λ decreases significantly when L increases from 1 mm to 10 mm, after which it decreases slowly. When L is greater than 25 mm, ∆λ remains at 0.05. Although both Rmax and ∆λ have important effects on spectral morphology, their optimum values cannot be maintained at the same L. Therefore, it is necessary to determine the L value at which Rmax and ∆λ can be maintained at suitable levels from the perspective of sensor output characteristics.
Figure 3 shows that the range of L is reduced to 1–15 mm. The initial spectral center wavelength of the sensing and reference grating was set as 1549.85 nm and 1550 nm, respectively. The reference grating was kept stationary, and the center wavelength of the sensing grating was shifted from 1549.85 nm to 1550 nm with a step size of 0.002 nm. The curve of the superimposed area of the two spectra was studied when the spectral center wavelength of the sensing grating increased. Figure 4a shows the change curve of the superimposed area of reference spectrum and sensing spectrum under different L values.
Figure 4 shows that the change curve of the superimposed area corresponding to each gate region length is symmetrically distributed. After the central wavelength of the sensing grating spectrum is offset by 0.15 nm, the superimposed area reaches its maximum value; however, this is only true when the central wavelength of the sensing grating spectrum is the same as that of the reference grating spectrum. In Figure 4a, the superimposed area on the left side of the curve gradually increases with the movement of the sensing grating spectrum. There is a linear positive correlation between the input and output of the sensor within this area, which represents the actual operating area of the sensor. The variation rule of the curve at this side is analyzed as follows:
When L increases from 1 mm to 15 mm, Rmax increases and ∆λ decreases continuously. Although Rmax changes when the central wavelength does not shift, the spectral reflectance at the left side of the spectrum changes less than that at the right side. The superimposed area is primarily controlled by the spectral bandwidth ∆λ. Meanwhile, the maximum value of the superposition area of the two spectra decreases continuously; that is, when the sensing grating offset is zero, the corresponding output value decreases continuously with an increase in L. When L increases from 1 mm to 9 mm, amplitude of the superposition area curve increases gradually; then, the rate of increase rises due to the superposition area being located at the center of the two phases with maximum spectral wavelength. Moreover, the superposition area depends on the form of a single spectrum, while Rmax and ∆λ increase and decrease the superposition area, respectively. Meanwhile, the impact of Rmax changes on the superposition area is greater than the impact of ∆λ changes. Therefore, the slope of the change curve of the superimposed area increases with a rise in the amplitude of the superimposed area. When L increases from 10 mm to 15 mm, the changes in Rmax and ∆λ are relatively moderate, and the initial value and amplitude of the superposition area do not change significantly; meanwhile, Rmax is large, ∆λ is small, and the spectral shape is high and narrow. The upper part of the curve exhibits a bending radian, which is different from the linear fitting degree. Figure 4b shows that when L 10 mm, the slope of the curve is approximately 80 and its linearity is higher than 0.99. Meanwhile, linearity is the highest when L = 10 mm. Therefore, considering the amplitude characteristics and linearity of the sensor, the length of the grating region L is selected as 10 mm.

3.2. Effect of Grating Refractive Index Modulation Depth on Sensor Characteristics

During the fabrication of FBG, the refractive index modulation depth can be categorized as strong, medium, and weak, with sizes of 1.2 × 10⁻³, 1.2 × 10⁻⁴, and 1 × 10⁻⁵, respectively. According to Equations (5) and (7), the individual spectral reflectance amplitude and bandwidth are directly related to the refractive index modulation depth. Therefore, the refractive index modulation depth can affect the morphology change of a single spectrum, thereby influencing the change in the superimposed area of the two spectra and affecting the output characteristics of the sensor. In this section, the influence of refractive index modulation depth on sensor output characteristics is studied.
Figure 5 shows the variation curves of spectral reflectance amplitude Rmax and bandwidth ∆λ with the refractive index modulation depth at L = 10 mm. The variation trends of Rmax and ∆λ with the refractive index modulation depth are evidently different: Rmax first increases rapidly when the refractive index modulation depth changes from weak to strong, and it enters a saturation state when the refractive index modulation depth exceeds 30 × 10−5, although ∆λ keeps increasing with a rise in refractive index modulation depth. Therefore, when the refractive index modulation depth is larger, Rmax can increase and maintain the value of ∆λ, thereby increasing the superposition area of the two spectra under the same conditions and improving the amplitude characteristics of the sensor. Therefore, FBG with a strong refractive index modulation depth is selected as the experimental FBG.
Figure 6 shows the variation curves of the spectral superposition area with the translation distance of sensing grating when the refractive index modulation depth of the grating is categorized as medium (1.2 × 10⁻⁴) and strong (1 × 10⁻³) when L = 10 mm. The amplitude of the superposition area of the grating refractive index is significantly larger than that of the medium modulation, while the other characteristics do not change significantly. It is established that the enhanced refractive index modulation depth of the grating can increase the amplitude of the superposed area of the sensing spectrum and the reference spectrum, thus improving the output amplitude characteristics of the sensor.

3.3. Effect of Grating toe Cutting Mode on Sensor Characteristics

The toe cutting function is equivalent to the window function in the digital filter. Although the toe cutting will lead to an uneven refractive index modulation of the grating; however, a certain functional form can prove beneficial to enhancing the edge mode suppression and improving the spectral characteristics. Common toe cutting functions include Gauss toe cutting function, Hamming toe cutting function, Blackman toe cutting function, Tanh toe cutting function, Sinc toe cutting function, and Cauchy toe cutting function. Toe cutting of a uniform grating can inhibit spectral sidelobes, which can improve the output performance of the sensor by improving the linearity associated with the change curve of the superimposed area of the two reflection spectra. However, with the introduction of the toe cutting function σ ( z ) , the solution of the coupled mode equation cannot be obtained analytically, and the spectral distribution of the coupled mode equation needs to be analyzed numerically. In this section, the entire FBG is equally divided into uniform small segments by using the transmission matrix method, and the refractive index modulation of each segment of the grating can be regarded as the constant amplitude modulation with σ ( z ) being constant. Moreover, the solution associated with the coupling mode equation of the grating can be obtained. By studying the influence of the toe cutting system on the single spectrum and the superimposed area of the two spectra, toe cutting can improve the output characteristics of the sensor.
Figure 7 shows the reflection spectra of FBG after toe cutting with different methods. After setting reasonable parameters, each toe cutting system has a certain inhibitory effect on the spectral sidelobes of the grating, which is reflected by the reduction in the number and amplitude of sidelobes; however, the inhibitory effect is different. From the figure, we can determine the decreasing order of the side-lobe suppression effect of the toe cutting functions: Blackman, Hamming, Gauss, Tanh, Cauchy, and Sinc function. The stronger the sidelobe suppression effect, the higher the linearity of the spectral superimposed area change curve; this improves the linearity of the sensor output. When the sidelobe is suppressed, the amplitude of the main spectral peak also decreases slightly, which, in turn, reduces the amplitude of the maximum superimposed area as well as the output amplitude of the sensor. Based on the effect of the six toe cutting functions on the spectral morphology of the grating, the Gaussian and Hamming functions can significantly suppress the spectral sidelobes and maximize the amplitude of the main spectral peak after the toe cutting operation, which are the two functions with the strongest comprehensive toe cutting effect.
Furthermore, Gaussian toe cutting function (G = 8) is selected to perform toe cutting operations on the fiber grating. Figure 8 shows the spectral morphology of a single grating without a toe cut and Gaussian toe cut (G = 8). The spectral sidelobes of the grating after a Gaussian toe cut are completely suppressed and have little influence on the amplitude of the main spectral peak. According to the calculation, the reflectance amplitude corresponding to the main spectral peak before and after Gaussian toe cutting decreases from 0.97 to 0.945, with a reduction rate of less than 3%; the effect on the spectral superimposed area can be ignored.
Based on the influence of Gaussian toe cutting on the spectrum of a single grating, Figure 9a shows the curve of the superimposed area of sensing spectrum and reference spectrum as a function of the moving distance of the sensing spectrum. Under the same conditions, neither Gaussian toe cutting (G = 8) nor the cutting method are used. Figure 9b shows the fitting analysis results on the left side of the two curves.
The left linear fitting degree of the curve after Gauss toe cutting (0.996) was 0.01 higher than that of the toe cutting. The slopes of the curve after Gauss toe cutting and without toe cutting were 79.2 and 74.2, respectively, which increased by 6%. These results establish that the Gaussian cutting toe (G = 8) methods can be manipulated. The sensor and the reference grating spectrum on both sides of the sidelobe are non-functional, thereby improving the spectrum superposition areas and increasing the change in the curve linearity of the mobile sensing spectrum distance, which can further improve the output linearity and sensitivity of the cut-toe mode sensor.
In summary, to improve the sensor output amplitude and linearity, the center wavelength of the sensing grating and reference grating have been customized in this study to be 1449.971 nm and 1550.033 nm (the difference is less than 0.15 nm), respectively; meanwhile, their gate region length is 10 mm and refractive index modulation depth is 1.2 × 10⁻³, and the post-processing method used is Gaussian toe cutting (G = 8).

4. Experimental Testing and Analysis

4.1. Construction of Experimental Platform

The GMM-FBG current sensor test system is shown in Figure 10. To reduce the input current, a magnetic ring is used to replace the middle single current wire. The coils with 200 turns are symmetrically wound on the two arms of the magnetic ring, and the DC input signal is provided by a 10 A DC source. A 400-turn coil is wound below the magnetic ring, and a signal generator combined with a power amplifier is used to provide AC input signals. The grating parameters of the current sensor are customized according to the parameters determined above. During the bonding process between GMM and FBG, both ends of FBG were axially fixed parallel to GMM with a stent, and an appropriate amount of optical glue was injected between the two sides by moving the injection rubber tube before and after the bonding process.

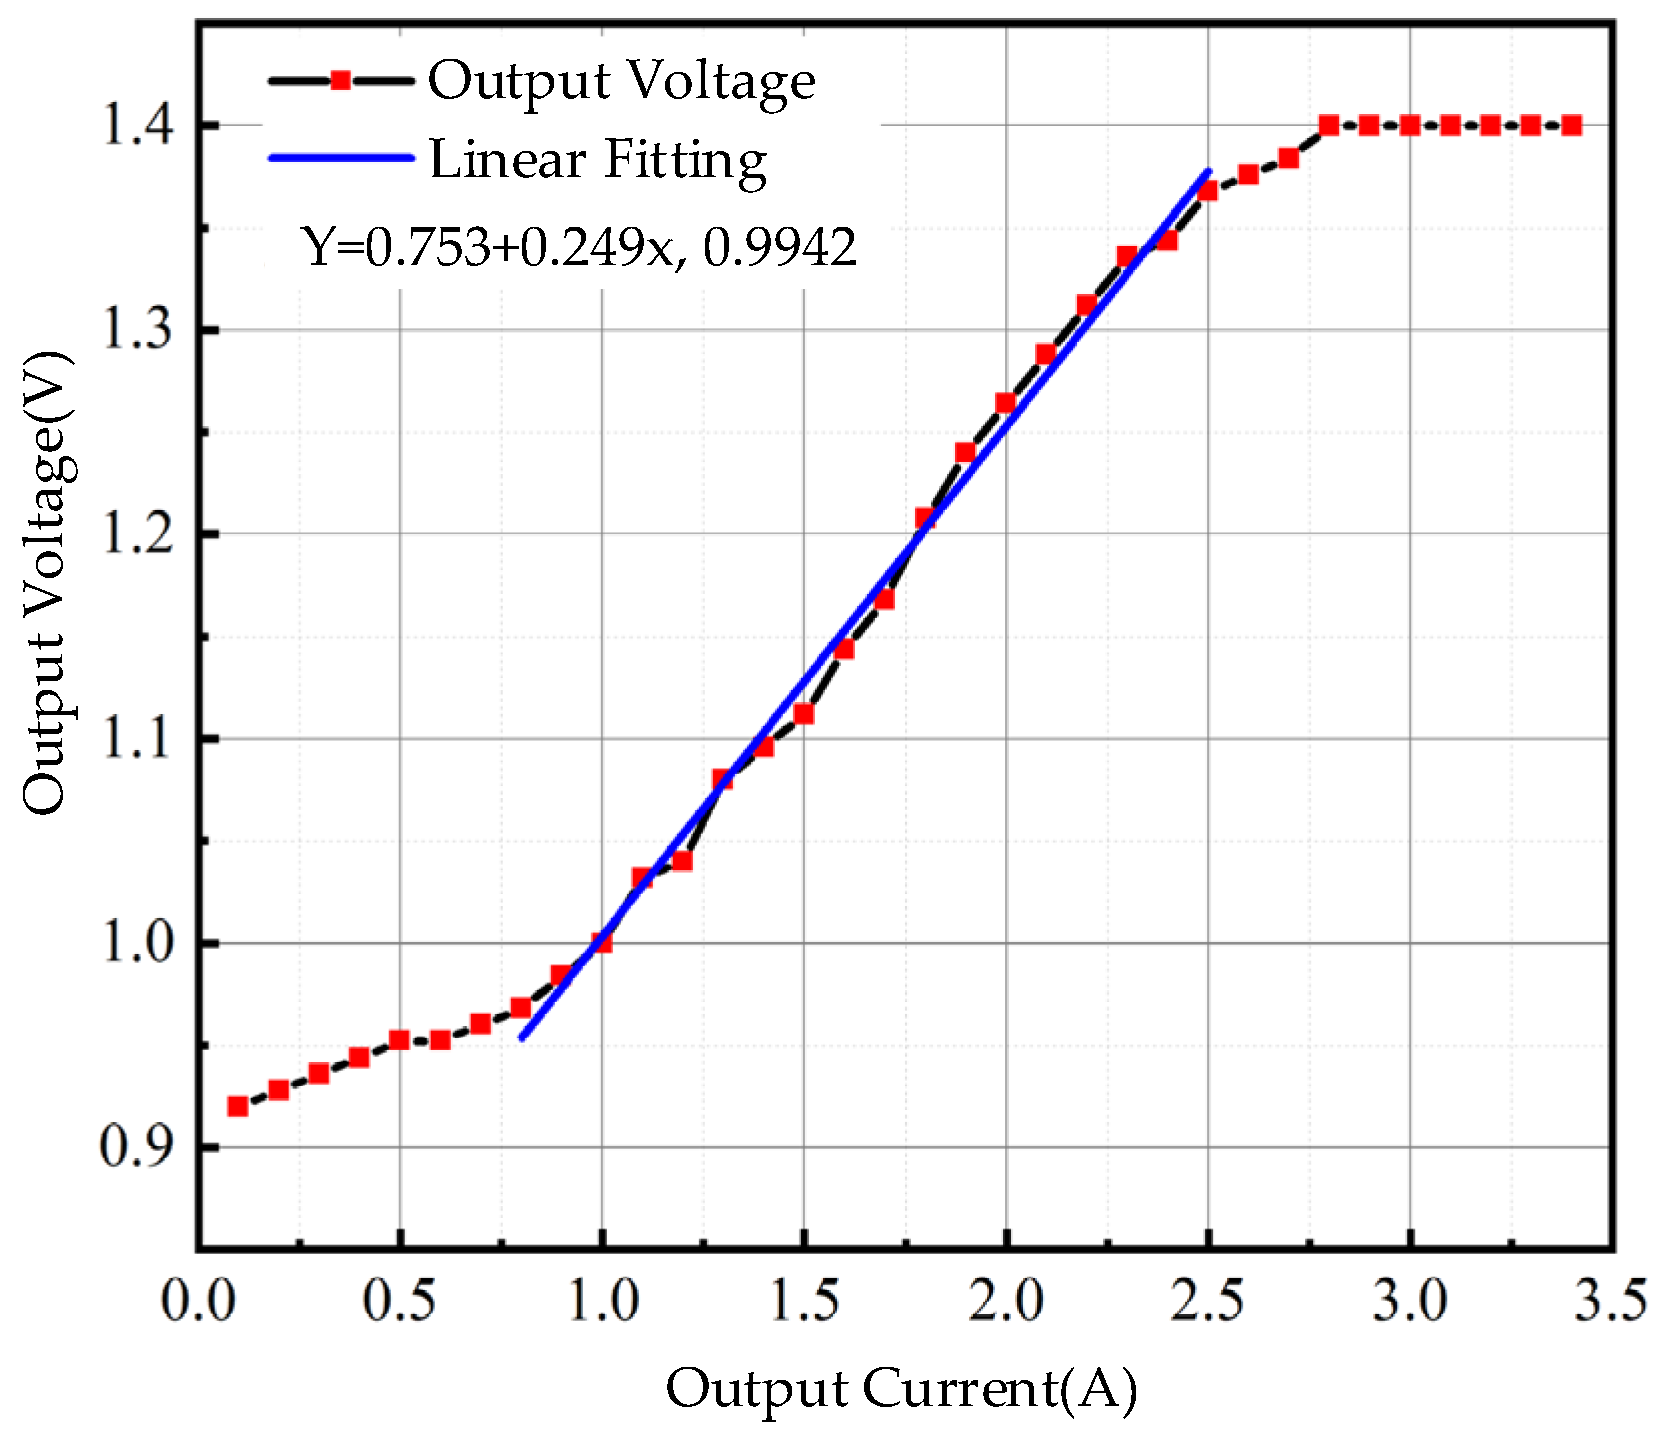
4.2. Sensor Input and Output Characteristics

First, the output current of the DC source should initially be 0 A, and the current should increase in 0.1 A intervals until the output no longer changes. Second, the oscilloscope must be adjusted according to the DC coupling mode to read out the changes in the input light intensity in the photodetector. Figure 11 shows the input-output relation curve. When the current changes from 0 to 0.7 A, the output voltage changes slowly and the slope of the curve is small, which is in accordance with the initial slow change state. From 0.8 A–2.5 A, the curve is linear, and the output linearity and sensitivity are the highest. After 2.5 A, the curve gradually becomes gentle, and the output sensitivity decreases significantly. After 2.8 A, the curve enters a saturation state; that is, when the input current increases, the output remains unchanged. By comparison, the sensor input-output relation curve is consistent with the curve that depicts the relationship between GMM strain and magnetic field. This shows that the dual raster-intensity demodulation mode has a wide working range and good linearity, which can truly reflect the change in input current. By fitting the linear section of the curve, it can be concluded that the input-output linear correlation coefficient (R2) is as high as 0.9942, and the sensitivity is 249.75 mV/A.
Finally, the temperature compensation effectiveness of the demodulation method has been verified using a verification test, wherein the sensor temperature is varied from 0 °C to 60 °C, and the temperature change step is set to 2 °C. From the results of the test, the phase difference has an insignificant trend of decreasing with an increase in temperature during the test, and the maximum phase difference fluctuation is 4.4°. The amplitude gain decreases slowly and tends to be stable with increasing temperature, while the gain fluctuation is 0.68 dB. The results show that the grating intensity demodulation can effectively compensate for the influence of temperature change (in the range of 0 °C–60 °C) to ensure that the sensor has a certain temperature stability.

5. Conclusions

In this study, the performance of current sensors based on GMM and FBG is optimized by improving the spectral characteristics of gratings. Based on the coupled mode theory, three key parameters (length of grating region, depth of refractive index modulation, and type of toe cutting function) are used to determine the spectral morphology of a single grating. Furthermore, the influence of these three parameters on the spectral superposition area is studied using a numerical calculation method, where the spectral superposition area represents the output characteristic of the sensor. By analyzing the variation curves of the spectral superimposed area under different parameters, the customized parameters of the experimental sensing and reference FBG were determined to improve the linearity and sensitivity of the sensor output. The test results show that the input-output linear correlation coefficient of the optimized current sensor (R2) goes up to 0.9942, sensor sensitivity becomes 249.75 mV/A, and the sensor exhibits good stability from 0 °C to 60 °C. This work can provide theoretical and practical guidance for grating spectrum analysis and grating parameter optimization of existing GMM-FBG current sensors, while offering insights for improving performance parameters of GMM-FBG such as linearity, sensitivity, and temperature stability.

Author Contributions

Conceptualization, F.J., Y.L. and Q.Y.; methodology, F.J.; validation, Y.L. and Q.Y.; formal analysis, F.D.; investigation, F.D. and Y.L.; resources, Y.L. and G.P.; data curation, W.L.; writing—original draft, W.L. and F.D.; writing—review and editing, F.J. and Q.Y.; supervision, F.J. and G.P.; project administration, Y.L., G.P. and Q.Y.; funding acquisition, F.J. and G.P. All authors have read and agreed to the published version of the manuscript.

Funding

This research received no external funding.

Data Availability Statement

Not applicable.

Acknowledgments

Not applicable.

Conflicts of Interest

The authors declare no conflict of interest.

References

  1. Liu, C.; Shen, T.; Wu, H.; Feng, Y.; Chen, J. Applications of magneto-strictive, magneto-optical, magnetic fluid materials in optical fiber current sensors and optical fiber magnetic field sensors: A review. Opt. Fiber. Technol. 2021, 65, 102634. [Google Scholar] [CrossRef]
  2. Morello, R.; Mukhopadhyay, S.C.; Liu, Z.; Slomovitz, D.; Samantaray, S.R. Advances on Sensing Technologies for Smart Cities and Power Grids: A Review. IEEE Sens. J. 2017, 17, 7596–7610. [Google Scholar] [CrossRef]
  3. Strasser, T.; Andren, F.; Kathan, J.; Cecati, C.; Buccella, C.; Siano, P.; Leitao, P.; Zhabelova, G.; Vyatkin, V.; Vrba, P.; et al. A Review of Architectures and Concepts for Intelligence in Future Electric Energy Systems. IEEE Trans. Ind. Electron. 2015, 62, 2424–2438. [Google Scholar] [CrossRef] [Green Version]
  4. Lobaccaro, G.; Carlucci, S.; Lofstrom, E. A review of systems and technologies for smart homes and smart grids. Energies 2016, 9, 348. [Google Scholar] [CrossRef] [Green Version]
  5. Nie, Y.X.; Yin, X.G.; Zhang, Z. Optical current transducer used in high voltage power system. In Proceedings of the IEEE/PES Transmission and Distribution Conference and Exhibition, Yokohama, Japan, 6–10 October 2002; pp. 1849–1853. [Google Scholar]
  6. Wang, R.L.; Xu, S.Y.; Li, W.; Wang, X.H. Optical fiber current sensor research: Review and outlook. Opt. Quant. Electron. 2016, 48, 1–22. [Google Scholar] [CrossRef]
  7. Andrea, Z.; Nicola, B.; Angelo, C.; Lorenzo, V.; Michele, Z. Internet of Things for Smart Cities. IEEE Internet Things 2014, 1, 22–32. [Google Scholar]
  8. Silva, R.M.; Martins, H.; Nascimento, I.; Baptista, J.M.; Ribeiro, A.L.; Santos, J.L.; Jorge, P.; Frazao, O. Optical Current Sensors for High Power Systems: A Review. Appl. Sci. 2012, 2, 602–628. [Google Scholar] [CrossRef]
  9. Wang, N.J.; Liu, Y.; Zhang, H.W.; Chen, X.; Li, Y.X. Fabrication, magnetostriction properties and applications of Tb-Dy-Fe alloys: A review. China Foundry 2016, 13, 75–84. [Google Scholar] [CrossRef] [Green Version]
  10. Hudson, J.; Busbridge, S.C.; Piercy, A.R. Magnetomechanical properties of epoxy-bonded Terfenol-D composites. Ferroelectr. 1999, 228, 283–295. [Google Scholar] [CrossRef]
  11. Abbundi, R.; Clark, A.E.; Mcmasters, O.D. Magnetostriction of Laves phase rare earth-Ni2compounds. IEEE Trans. Magn. 1980, 16, 1074–1076. [Google Scholar] [CrossRef]
  12. Liu, H.L.; Or, S.W.; Tam, H.Y. Magnetostrictive composite-fiber Bragg grating (MC-FBG) magnetic field sensor. Sensor Actuat. A-Phys. 2012, 173, 122–126. [Google Scholar] [CrossRef]
  13. Thomas, S.; Mathew, J.; Radhakrishnan, P.; Nampoori, V.; George, A.K.; Al-Harthi, S.H.; Ramanujan, R.V.; Anantharaman, M.R. Metglas thin film based magnetostrictive transducers for use in long period fibre grating sensors. Sensor Actuat. A-Phys. 2010, 161, 83–90. [Google Scholar] [CrossRef] [Green Version]
  14. Xia, J.; Wang, Q.; Liu, X.; Luo, H. Fiber Optic Fabry-Perot Current Sensor Integrated with Magnetic Fluid Using a Fiber Bragg Grating Demodulation. Sensors 2015, 15, 16632–16641. [Google Scholar] [CrossRef] [Green Version]
  15. Ding, Z.; Du, Y.; Liu, T.; Liu, K.; Feng, B.; Jiang, J. Distributed Optical Fiber Current Sensor Based on Magnetostriction in OFDR. IEEE Photonic. Tech. L. 2015, 27, 2055–2058. [Google Scholar] [CrossRef]
  16. Qing, J.; Qun, H.; Zhizhuang, L.; Zhenzhou, C.; Haofeng, H.; Shuang, W.; Kun, R.; Junfeng, J.; Tiegen, L. Temperature Compensation of Optical Fiber Current Sensors With a Static Bias. IEEE Sens. J. 2022, 22, 352–356. [Google Scholar]
  17. Deborah, R.; Andrew, J.W.; Grzegorz, F.; Pawel, N.; James, R.M. A Fiber-Bragg-Grating-Based Sensor for Simultaneous AC Current and Temperature Measurement. IEEE Sens. J. 2006, 6, 1539–1542. [Google Scholar]
  18. Zhao, H.; Sun, F.; Yang, Y.; Cao, G.; Sun, K. A novel temperature-compensated method for FBG-GMM current sensor. Opt. Commun. 2013, 308, 64–69. [Google Scholar] [CrossRef]
  19. Yi, B.; Chu, B.C.B.; Chiang, K.S. Temperature compensation for a fiber-Bragg-grating-based magnetostrictive sensor. Microw. Opt. Techn. Let. 2003, 36, 211–213. [Google Scholar] [CrossRef]
  20. Chiang, K.S.; Kancheti, R.; Rastogi, V. Temperature-compensated fiber-Bragg-grating-based magnetostrictive sensor for dc and ac currents. Opt. Eng. 2003, 42, 1906–1909. [Google Scholar] [CrossRef]
  21. Mora, J.; Diez, A.; Cruz, J.L.; Andres, M.V. A magnetostrictive sensor interrogated by fiber gratings for DC-current and temperature discrimination. IEEE Photonic. Tech. Lett. 2000, 12, 1680–1682. [Google Scholar] [CrossRef]
  22. Wang, W.; Jiang, X.; Yu, Q. Temperature self-compensation fiber-optic pressure sensor based on fiber Bragg grating and Fabry–Perot interference multiplexing. Opt. Commun. 2012, 285, 3466–3470. [Google Scholar] [CrossRef]
  23. Dante, A.; Bacurau, R.M.; Spengler, A.W.; Ferreira, E.C.; Dias, J.A.S. A Temperature-Independent Interrogation Technique for FBG Sensors Using Monolithic Multilayer Piezoelectric Actuators. IEEE Trans Instrum. Meas. 2016, 65, 2476–2484. [Google Scholar] [CrossRef]
  24. Yang, Y.; Yang, Q.; Ge, W.; Li, L. A Temperature-Insensitive AC Current Sensor Based on Two Opposite Bias Magnetic Circuits. IEEE Photonic. Tech. Lett. 2016, 28, 2724–2727. [Google Scholar] [CrossRef]
  25. Zhang, Z.; Yan, L.; Pan, W.; Luo, B.; Wang, P.; Guo, L.; Zhou, W. Sensitivity Enhancement of Strain Sensing Utilizing a Differential Pair of Fiber Bragg Gratings. Sensors 2012, 12, 3891–3900. [Google Scholar] [CrossRef] [PubMed] [Green Version]
  26. Zhao, Y.; Liao, Y.B. Discrimination methods and demodulation techniques for fiber Bragg grating sensors. Opt. Laser. Eng. 2004, 41, 1–18. [Google Scholar] [CrossRef]
  27. He, Y.; Yang, Q.; Sun, S.; Luo, M.; Peng, G.; Wang, T.; Wang, G. Effects of fiber Bragg grating design on dual-grating demodulation performance. J. Physics. D Appl. Phys. 2018, 51, 495102. [Google Scholar] [CrossRef]
  28. Huang, C.; Jing, W.C.; Liu, K.; Zhang, Y.M.; Peng, G.D. Demodulation of fiber Bragg grating sensor using cross-correlation algorithm. IEEE Photonic. Tech. Lett. 2007, 19, 707–709. [Google Scholar]
Figure 1. Effect of spectral morphology on sensor characteristics. (a,b) Schematic of the spectral superposition area at different reflectivities and bandwidths and (c) corresponding input-output curve. (d) Schematic of the spectral superposition area after toe cutting and (e) corresponding input-output curve.
Energies 16 00997 g001
Figure 2. Reflection spectra of FBG with different refractive index modulation depths and gate region lengths.
Energies 16 00997 g002
Figure 3. Spectral reflectance amplitude and bandwidth of FBG as a function of gate region length.
Energies 16 00997 g003
Figure 4. (a) Variation in spectral superposition area with the translation distance of sensing grating at different gate region lengths. (b) Linear fitting of the superimposed area on the left side of the curve at L = 10 mm, 11 mm, 13 mm, and 15 mm.
Energies 16 00997 g004
Figure 5. Curve of spectral reflectance amplitudes and bandwidths of FBG with different refractive index modulation depths.
Energies 16 00997 g005
Figure 6. Variation curves of spectral superimposed area as a function of the translation distance of sensing grating when L = 10 mm, and the refractive index modulation depth is 1.2 × 10⁻³ and 1 × 10⁻⁴.
Energies 16 00997 g006
Figure 7. Grating reflection spectra after different toe cutting methods.
Energies 16 00997 g007
Figure 8. Grating reflection spectra of uncut toe and Gaussian toe (G = 8).
Energies 16 00997 g008
Figure 9. (a) Variation curve of spectral superimposed area as a function of spectral translation distance without toe cutting and Gaussian toe cutting (G = 8). (b) Left linear fitting of the curve of spectral superimposed area change.
Energies 16 00997 g009
Figure 10. Test platform for DC response characteristics of sensor.
Energies 16 00997 g010
Figure 11. DC response characteristic curve of sensor.
Energies 16 00997 g011
Disclaimer/Publisher’s Note: The statements, opinions and data contained in all publications are solely those of the individual author(s) and contributor(s) and not of MDPI and/or the editor(s). MDPI and/or the editor(s) disclaim responsibility for any injury to people or property resulting from any ideas, methods, instructions or products referred to in the content.

