
Structural and Electrochemical Properties of Musa acuminata Fiber Derived Hard Carbon as Anodes of Sodium-Ion Batteries
 ,
,
Abstract
:1. Introduction
2. Experimental Procedure
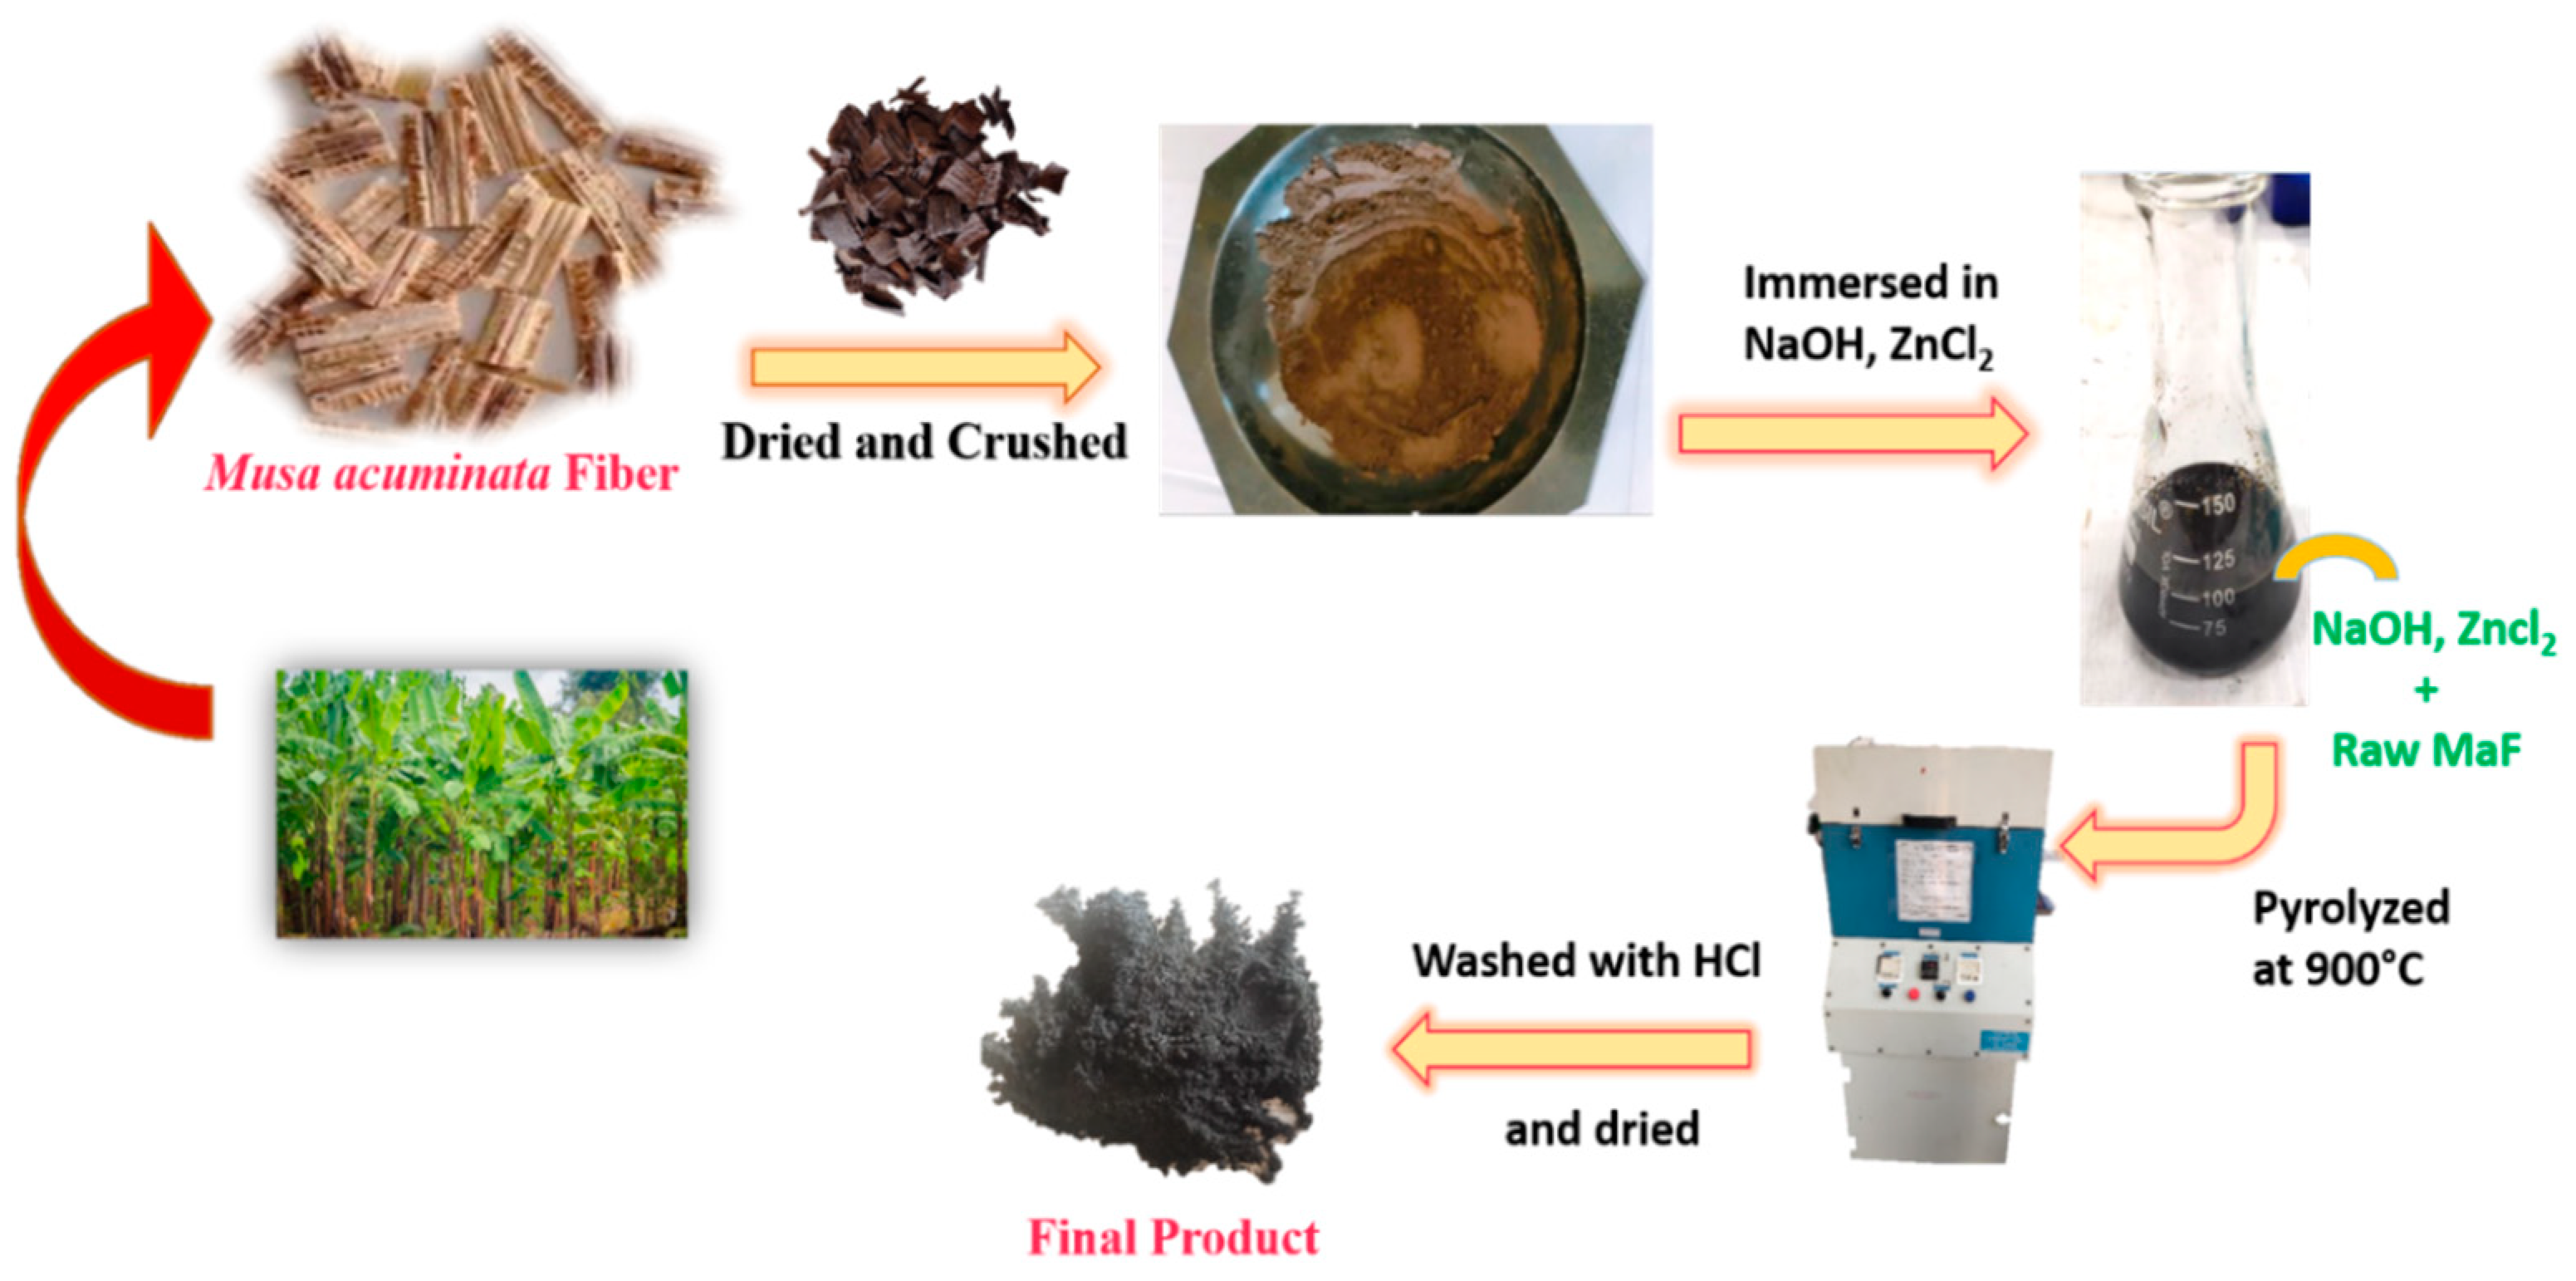
2.1. Preparation of MaF Derived Hard Carbon (MaFDHC)
2.2. Structural Characterizations
2.3. Cell Fabrication and Electrochemical Measurements
3. Results and Discussion
4. Conclusions
Supplementary Materials
Author Contributions
Funding
Data Availability Statement
Conflicts of Interest
References
- Xie, Y.; Fan, M.; Shen, T.; Liu, Q.; Chen, Y. SnS2 nanoplates as stable anodes for sodium-ion and lithium-ion batteries. Mater. Technol. 2016, 31, 646–652. [Google Scholar] [CrossRef]
- Takashi, J.Y.; Jassiel, R.R.; Vilas, G.P. Waste biomass-derived carbon anode for enhanced lithium storage. ACS Omega. 2020, 5, 19715–19720. [Google Scholar]
- Krishnaveni, K.; Subadevi, R.; Raja, M.; Premkumar, T.; Sivakumar, M. Sulfur/PAN/acetylene black composite prepared by a solution processing technique for lithium-sulfur batteries. J. Appl. Polym. Sci. 2018, 135, 46598. [Google Scholar]
- Xu, X.; Wu, P.; Li, Q.; Yang, W.; Zhang, X.; Wang, X.; Meng, J.; Niu, C.; Mai, L. Realizing stable lithium and sodium storage with high areal capacity using novel nanosheet-assembled compact CaV4O9 microflowers. Nano Energy 2018, 50, 606–614. [Google Scholar] [CrossRef]
- Franklin, R.E. Crystallite growth in graphitizing and non-graphitizing carbons. Proceedings of the Royal Society of London. Ser. A Math. Phys. Sci. 1951, 209, 196–218. [Google Scholar]
- Luo, Y.; Tang, Y.; Zheng, S.; Yan, Y.; Xue, H.; Pang, H. Dual anode materials for lithium-and sodium-ion batteries. J. Mater. Chem. A 2018, 6, 4236. [Google Scholar] [CrossRef]
- Kouthaman, M.; Arjunan, P.; Kannan, K.; Priyanka, V.; Subadevi, R.; Kumaran, V.; Gnanamuthu, R.M.; Sivakumar, M. Enhancing structural stability of layered O3-type Na-Mn-Ni-Cu-O cathode material through copper substitution for sodium batteries. J. Taiwan Inst. Chem. Eng. 2020, 117, 86–92. [Google Scholar] [CrossRef]
- Lotfabad, E.M.; Ding, J.; Cui, K.; Kohandehghan, A.; Kalisvaart, W.P.; Hazelton, M.; Mitlin, D. High-density sodium and lithium-ion battery anodes from banana peels. ACS Nano 2014, 8, 7115–7129. [Google Scholar] [CrossRef]
- Ahuja, V.; Senthilkumar, B.; Senguttuvan, P. Ultra-stable Sb/hard carbon composite anodes with synergistic alkali-ion storage performances. Mater. Res. Bull. 2021, 144, 111491. [Google Scholar] [CrossRef]
- Kannan, K.; Kouthaman, M.; Arjunan, P.; Subadevi, R.; Sivakumar, M. Titanium based layered O3-NaTi7/10Ni3/20Mg3/20O2 anode material for sodium ion batteries. Mater. Lett. 2020, 273, 127950. [Google Scholar] [CrossRef]
- Arjunan, P.; Kouthaman, M.; Kannan, K.; Diwakar, K.; Priyanka, V.; Subadevi, R.; Sivakumar, M. Study on Efficient Electrode from Electronic waste renewed carbon material for sodium battery applications. J. Environ. Chem. Eng. 2021, 9, 105024. [Google Scholar] [CrossRef]
- Wu, F.C.; Tseng, R.L.; Juang, R.S. Preparation of highly microporous carbons from fir wood by KOH activationfor adsorption of dyes and phenols from water. Sep. Purif. Technol. 2005, 47, 10–19. [Google Scholar] [CrossRef]
- Mahmoudi, K.; Hamdi, N. Preparation and characterization of activated carbon from date pits by chemical activation with zinc chloride for methyl orange adsorption. J. Mater. Environ. Sci. 2014, 51, 758–1769. [Google Scholar]
- Pelaez-Cid, A.A.; Teutli-Leon, M.M.M. Lignocellulosic Precursors Used in the Synthesis of Activated Carbon: Characterization Techniques and Applications in the Wastewater Treatment, 1st ed.; Montoya, V.H., Bonilla-Petriciolet, A., Eds.; InTech: Rijeka, Croatia, 2012. [Google Scholar]
- Pereira, R.G.; Veloso, C.M.; Da Silva, N.M.; De Sousa, L.F.; Bonomo, R.C.F.; De Souza, A.O.; Souza, M.O.D.G.; Fontan, R.D.C.I. Preparation of activated carbons from cocoa shells and siriguela seeds using H3PO4 and ZnCL2 as activating agents for BSA and lactalbumin adsorption. Fuel Process. Technol. 2014, 126, 476–486. [Google Scholar] [CrossRef]
- Teo, E.Y.L.; Muniandy, L.; Ng, E.P.; Adam, F.; Mohamed, A.R.; Jose, R.; Chong, K.F. High surface area activated carbon from rice husk as a high-performance supercapacitor electrode. Electrochem. Acta 2016, 192, 110–119. [Google Scholar] [CrossRef] [Green Version]
- Abdel-Ghani, N.T.; El-Chaghaby, G.A.; El Gamma, M.H.; Rawash, E.A. Optimizing the preparation conditions of activated carbons from olive cake using KOH activation. New Carbon Mater. 2016, 31, 2–10. [Google Scholar] [CrossRef]
- Yahya, M.A.; Al-Qodah, Z.; Ngah, C.W.Z. Agricultural bio-waste materials as potential sustainable precursors used for activated carbon production: A review. Renew. Sustain. Energy Rev. 2015, 46, 218–235. [Google Scholar] [CrossRef]
- Rafatullah, M.; Ahmad, T.; Ghazali, A.; Sulaiman, O.; Danish, M.; Hashim, R. Oil palm biomass as a precursor of activated carbons: A review. Crit. Rev. Environ. Sci. Technol. 2013, 43, 1117–1161. [Google Scholar] [CrossRef]
- Wirasnita, R.; Hadibarata, T.; Yusoff, A.R.M.; Mat, L.Z. Preparation and characterization of activated carbon from oil palm empty fruit bunch wastes using zinc chloride. J. Teknol. 2015, 74, 77–81. [Google Scholar] [CrossRef] [Green Version]
- Demiral, H.; Demiral, I.; Karabacako, G.B.; Tumsek, F. Production of activated carbon from olive bagasse by physical activation. Chem. Eng. Res. Des. 2011, 89, 206–213. [Google Scholar] [CrossRef]
- Hussein, M.Z.; Abdul Rahman, M.B.; Yahaya, A.H.; Taufiq-Yap, Y.H.; Ahmad, N. Oil palm trunk as a raw material for activated carbon production. J. Porous Mater. 2001, 8, 327–334. [Google Scholar] [CrossRef]
- Meenatchi, T.; Priyanka, V.; Subadevi, R.; Liu, W.R.; Huang, C.H.; Sivakumar, M. Probe on hard carbon electrode derived from orange peel for energy storage application. Carbon Lett. 2021, 31, 1033–1039. [Google Scholar] [CrossRef]
- Ranaweera, C.K.; Kahol, P.K.; Ghimire, M.; Mishra, S.R.; Gupta, R.K. Orange-peel-derived carbon: Designing sustainable and high-performance supercapacitor electrodes. J. Carbon Res. 2017, 3, 25. [Google Scholar] [CrossRef] [Green Version]
- Zhu, Y.; Xiang, X.; Liu, E.; Wu, Y.; Xie, H.; Wu, Z.; Tian, Y. An activated microporous carbon prepared from phenol-melamine-formaldehyde resin for lithium-ion battery anode. Mater. Res. Bull. 2012, 47, 2045–2050. [Google Scholar] [CrossRef]
- Thenappan, M.; Rengapillai, S.; Marimuthu, S. Hard carbon reprising porous morphology derived from coconut sheath for sodium-ion battery. Energies 2022, 15, 8086. [Google Scholar] [CrossRef]
- Subagyo, A.; Chafidz, A. Banana pseudo-stem fiber: Preparation, characteristics, and applications. Banan. Nutr.-Funct. Process. Kinet. 2018, 10, 1–19. [Google Scholar]
- Ahmad, T.; Danish, M. Prospects of banana waste utilization in wastewater treatment: A review. J. Environ. Manag. 2018, 206, 330–348. [Google Scholar] [CrossRef]
- Venkateshwaran, N.; Ayyasamy, E. Banana fiber reinforced polymer composites—A Review. J. Reinf. Plast. Compos. 2010, 29, 2387–2396. [Google Scholar] [CrossRef]
- Srinivasan, V.S.; Boopathy, S.R.; Sangeetha, D.; Ramnath, B.V. Evaluation of mechanical and thermal properties of banana–flax-based natural fiber composite. Mater. Des. 2014, 60, 620–627. [Google Scholar] [CrossRef]
- Subramanya, R.; Satyanarayana, K.G.; Shetty Pilar, B. Evaluation of structural tensile and thermal properties of banana fibers. J. Natural Fibers 2017, 14, 485–497. [Google Scholar]
- Oliveira, G.F.D.; Andrade, R.C.D.; Trindade, M.A.G.; Andrade, H.M.C.; Carvalho, C.T.D. Thermogravimetric and spectroscopic study (TG–DTA/FT–IR) of activated carbon from the renewable biomass source babassu. Quimica Nova 2017, 40, 284–292. [Google Scholar] [CrossRef]
- Parre, A.; Karthikeyan, B.; Balaji, A.; Udhayasankar, R. Investigation of chemical, thermal and morphological properties of untreated and NaOH treated banana fiber. Mater. Today Proc. 2020, 22, 347–352. [Google Scholar] [CrossRef]
- Periera, P.H.F.; Benini, K.C.C.C.; Watashi, C.Y.; Voorwald, H.J.C.; Cioffi, M.O.H. Characterization of high density Polyethylene(HDPE) Reinforced with Banana peel fibers. Bioresources 2013, 8, 2351–2365. [Google Scholar] [CrossRef] [Green Version]
- Wang, Z.; Qie, L.; Yuan, L.; Zhang, W.; Hu, X.; Huang, Y. Functionalized N–doped interconnected carbon nanofibers as an anode material for sodium-ion storage with excellent performance. Carbon 2013, 55, 328–334. [Google Scholar] [CrossRef]
- Taer, E.; Taslim, R.; Aini, Z.; Hartati, S.D.; Mustika, W.S. Activated carbon electrode from banana-peel waste for supercapacitor applications. In Proceedings of the 6th International conference on theoretical and applied physics, Yogyakarta, Indonesia, 6–8 September 2017; p. 040004-1-5. [Google Scholar]
- Priyanka, V.; Savithiri, G.; Subadevi, R.; Suryanarayanan, V.; Sivakumar, M. Physicochemical Exfoliation of Graphene Sheets using Graphitic Carbon Nitride. New J. Chem. 2019, 43, 16200–16206. [Google Scholar] [CrossRef]
- Wang, Y.X.; Chou, S.L.; Liu, H.K.; Dou, S.X. Reduced graphene oxide with superior cycling stability and rate capability for sodium storage. Carbon 2013, 57, 202–208. [Google Scholar] [CrossRef]
- Panitz, J.C.; Novak, P. Raman microscopy of a quality control tool for electrodes for lithium-ion batteries. J. Power Sources 2000, 97, 174–180. [Google Scholar] [CrossRef]
- Diwakar, K.; Rajkumar, P.; Arjunan, P.; Liu, W.R.; Huang, C.H.; Subadevi, R.; Sivakumar, M. Eggshell—Membrane—Derived carbon coated on Li2FeSiO4 cathode materials for Li-ion batteries. Appl. Energy Mater. 2020, 13, 786. [Google Scholar]
- Liu, K.; Ostadhassan, M. The impact of pore size distribution data presentation format on pore structure interpretation on shales. Adv. Geo-Energy Res. 2019, 3, 187–197. [Google Scholar] [CrossRef]
- Subramanian, V.; Luo, C.; Stephan, A.M.; Nahm, K.S.; Thomas, S.; Wei, B. Supercapacitors from activated carbon derived from banana fibers. J. Phys. Chem. C 2007, 111, 7527–7531. [Google Scholar] [CrossRef]
- Lillo-Rodenas, M.A.; Juan-Juan, J.; Cazorla-Amoros, D.; Linares-Solano, A. About reactions occurring during chemical activation with hydroxides. Carbon 2004, 42, 1371–1375. [Google Scholar] [CrossRef]
- Xu, B.; Chen, Y.; Wei, G.; Cao, G.; Zhang, H.; Yang, Y. Activated carbon with high capacitance prepared by NaOH activation for supercapacitors. Mater. Chem. Phy. 2010, 124, 504–509. [Google Scholar] [CrossRef]
- Harmas, M. Effect of Zinc chloride activation on D-Glucose derived carbons-based capacitors performance in ionic liquid. J. Electrochem. Soc. 2020, 167, 080533. [Google Scholar] [CrossRef]
- Kulic, M.; Varol, E.A.; Putun, A.E. Preparation and surface characterization of activated carbons from euphorbia rigida by chemical activation with ZnCl2, K2CO3, NaOH and H3PO4. Appl. Surf. Sci. 2012, 261, 247–254. [Google Scholar] [CrossRef]
- Zhang, T.; Mao, J.; Liu, X.; Xuan, M.; Bi, K.; Zhang, X.L.; Hu, J.; Fan, J.; Chen, S.; Shao, G. Pinecone biomass-derived Hard carbon anodes for high-performance sodium-ion batteries. RSC Adv. 2017, 7, 41504–41511. [Google Scholar] [CrossRef] [Green Version]
- Xiao, L.; Lu, H.; Fang, Y.; Sushko, M.L.; Cao, Y.; Ai, X.; Yang, H.; Liu, J. Low-defect and low-porosity hard carbon with high coulombic efficiency and high capacity for practical sodium ion battery anode. Adv. Energy Mater. 2018, 8, 1703238. [Google Scholar] [CrossRef]
- Gorka, J.; Vix-Guterl, C.; Ghimbeu, C.M. Recent progress in design of biomass-derived hardcarbons for sodium-ion batteris. J. Carbon Res. 2016, 2, 1–17. [Google Scholar]
- Mozzaffar, A.; Huang, S.S.; Lin, Y.H.; Lin, Y.C.; Shih, B.Y.; Sheu, H.S.; Liao, Y.F.; Wu, N.L. High performance carbon—Coated ZnMn2O4 nNocrystallite supercapacitors with tailored microstructures enabled by novel solution combustion method. J. Power Sources 2018, 378, 90–97. [Google Scholar]
- Mozzaffar, A.; Liu, H.W.; Lin, C.H.; Weng, Y.T.; Sheu, H.S.; Lee, J.F.; Lu, M.L.; Liao, Y.F.; Wu, N.L. Enabling extraordinary rate performance for poorly conductive oxide Pseudocapacitors. Energy Environ. Mater. 2020, 3, 405–413. [Google Scholar]
- Xie, J.; Yang, P.; Wang, Y.; Qi, T.; Lei, Y.; Li, C.M. Puzzles and confusions in supercapacitor and battery: Theory and solutions. J. Power Sources 2018, 40, 213–223. [Google Scholar] [CrossRef]
- Li, Y.; Hu, Y.S.; Titirici, M.M.; Chen, L.; Huang, X. Hard carbon microtubes made from renewable cotton as high-performance anode material for sodium-ion batteries. Adv. Energy Mater. 2016, 6, 1600659. [Google Scholar] [CrossRef]
- Suhdi Wang, S.C. Fine activated carbon from rubber fruit shell prepared by using ZnCl2 and KOH activation. Appl. Sci. 2021, 11, 3994. [Google Scholar] [CrossRef]


| No | Sample | Surface Area (m2 g−1) | Pore Diameter (nm) | Pore Volume (cc g−1) |
|---|---|---|---|---|
| Reference [42] | MaFDHC without activation, | 36 | 1.9 | Not Reported |
| 10% of KOH treated, | 386 | 2.5 | ||
| 10% of ZnCl2 treated. | 1097 | 2.3 | ||
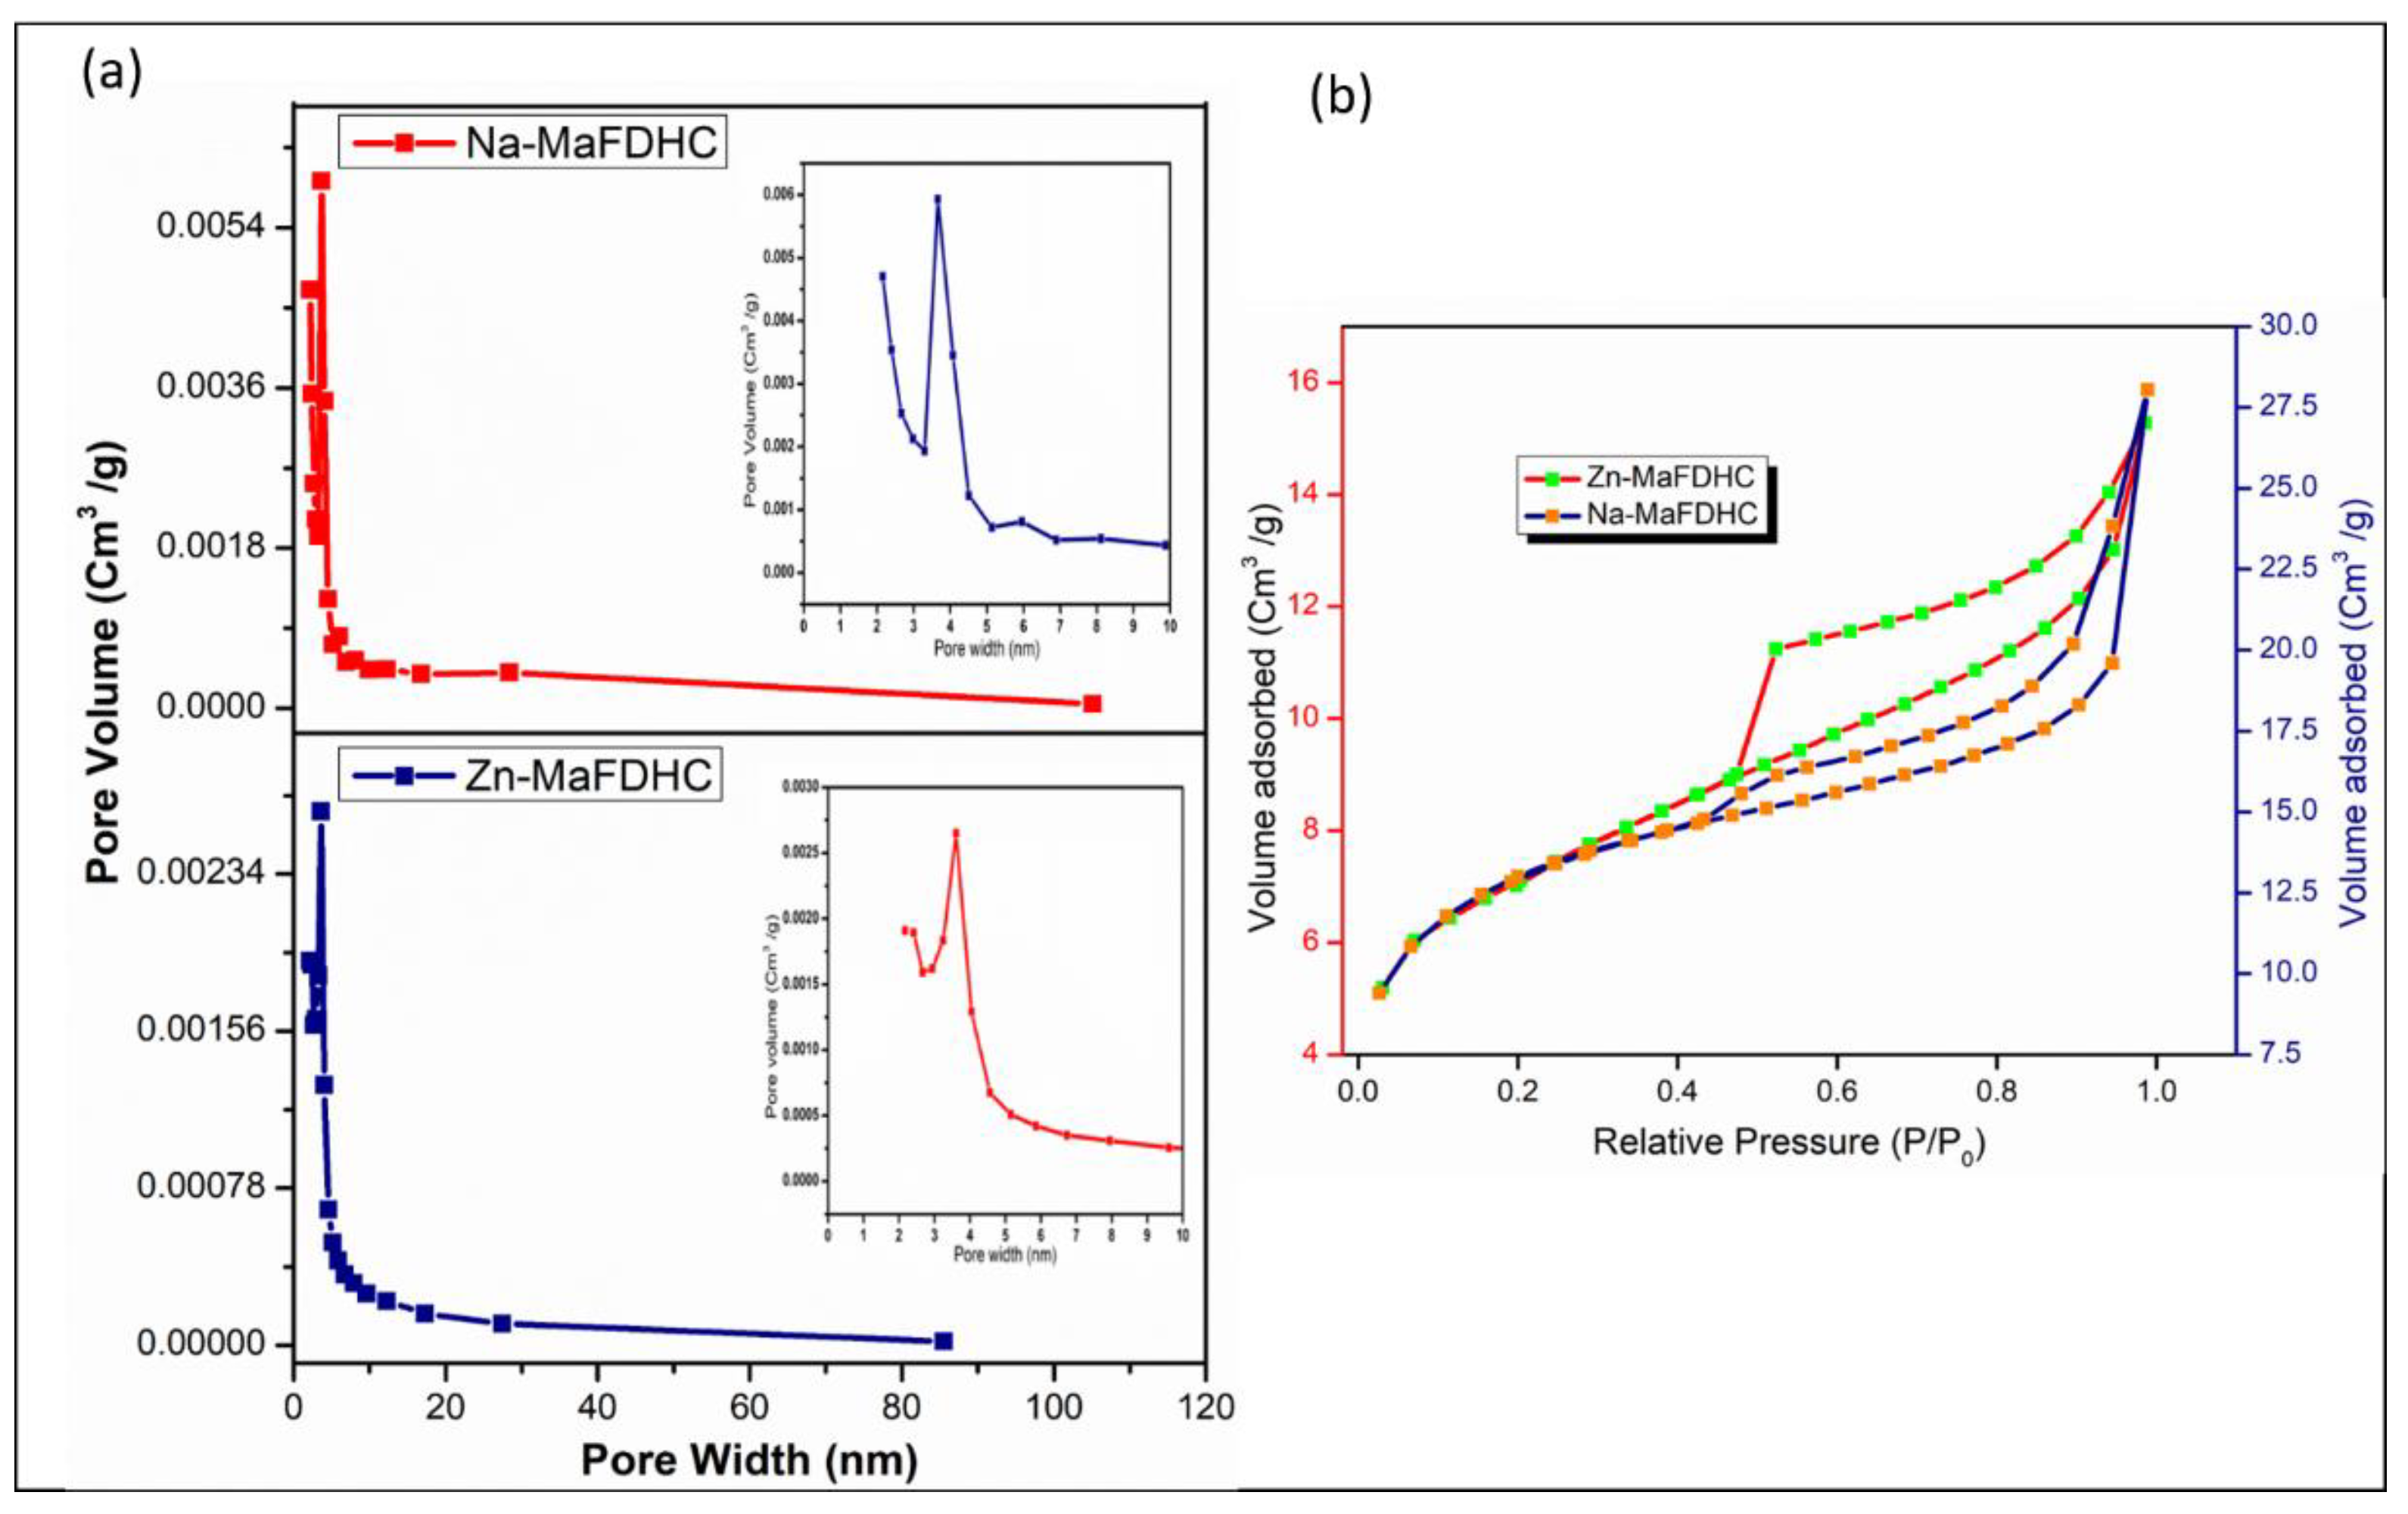
| 1 | Raw MaF | 18 | 2.1 | 0.009 |
| 2 | Na—MaFDHC | 45.02 | 3.611 | 0.029 |
| 3 | Zn—MaFDHC | 351 | 3.757 | 0.017 |
Disclaimer/Publisher’s Note: The statements, opinions and data contained in all publications are solely those of the individual author(s) and contributor(s) and not of MDPI and/or the editor(s). MDPI and/or the editor(s) disclaim responsibility for any injury to people or property resulting from any ideas, methods, instructions or products referred to in the content. |
© 2023 by the authors. Licensee MDPI, Basel, Switzerland. This article is an open access article distributed under the terms and conditions of the Creative Commons Attribution (CC BY) license (https://creativecommons.org/licenses/by/4.0/).
Share and Cite
Thenappan, M.; Mathiyalagan, K.; Abdollahifar, M.; Rengapillai, S.; Marimuthu, S. Structural and Electrochemical Properties of Musa acuminata Fiber Derived Hard Carbon as Anodes of Sodium-Ion Batteries. Energies 2023, 16, 979. https://doi.org/10.3390/en16020979
Thenappan M, Mathiyalagan K, Abdollahifar M, Rengapillai S, Marimuthu S. Structural and Electrochemical Properties of Musa acuminata Fiber Derived Hard Carbon as Anodes of Sodium-Ion Batteries. Energies. 2023; 16(2):979. https://doi.org/10.3390/en16020979
Chicago/Turabian StyleThenappan, Meenatchi, Kouthaman Mathiyalagan, Mozaffar Abdollahifar, Subadevi Rengapillai, and Sivakumar Marimuthu. 2023. "Structural and Electrochemical Properties of Musa acuminata Fiber Derived Hard Carbon as Anodes of Sodium-Ion Batteries" Energies 16, no. 2: 979. https://doi.org/10.3390/en16020979