
Analysis of the Operation of Smoke Exhaust Ventilation in the Metro’s Technological Corridor Based on Numerical Simulation of Selected Locations of Fire

Abstract
:1. Introduction
2. Simulation Model of Smoke Exhaust Ventilation of the Technical Corridor
2.1. Mathematical Model and Simulation Software
2.2. Characteristics of the Smoke Exhaust Ventilation and the Technical Corridor
- -
- Air supply grilles positioned to a maximum of 0.8 m above the floor;
- -
- Minimum capacity of a single air supply grille: 3600 m3/h;
- -
- Flow speed through the air supply grilles should not exceed 5 m/s;
- -
- Exhaust grilles placed at least 1.8 m above floor level;
- -
- The maximum distance between two exhaust grilles or between an exhaust grille and a supply grille should not exceed 10.0 m;
- -
- The flow speed through the exhaust grilles should not exceed 8 m/s;
- -
- The maximum distance between two exhaust grilles or between an exhaust grille and a supply grille should not exceed 7.0 m in the case of a bent section of the corridor;
- -
- The branch should be separated from the vertical exhaust duct by a cut-off flap;
- -
- The fire ventilation duct should meet the classification criteria of fire tightness, insulation, and smoke tightness for at least 60 min (EI60).
- -
- Length of 78.0 m and high of 3.4 m;
- -
- Area of 186.0 m2;
- -
- Mechanical exhaust ventilation with a volumetric capacity of 28,000 m3/h;
- -
- Eight exhaust points with dimensions of 500 mm × 550 mm;
- -
- Gravitational supply ventilation (air supply from the platform area and other surrounding rooms) with a volumetric capacity of 36,000 m3/h;
- -
- Seven air supply points, with dimensions of 800 mm × 800 mm;
- -
- The compensating air necessary for the operation of fire smoke exhaust ventilation will be supplied from the platform space after opening the fire dampers;
- -
- Smoke exhaust duct resistance class EI120, when exposed to fire from the inside and outside.
3. Results of Numerical Simulation of Smoke Ventilation Operation and Discussion
3.1. Variant A
3.2. Variant B
3.3. Variant C
3.4. Variant D
4. Conclusions
Author Contributions
Funding
Data Availability Statement
Acknowledgments
Conflicts of Interest
References
- Wu, P.; Xu, L.; Zhong, L.; Gao, K.; Qu, X.; Pei, M. Revealing the determinants of the intermodal transfer ratio between metro and bus systems considering spatial variations. J. Transp. Geogr. 2022, 104, 103415. [Google Scholar] [CrossRef]
- Transport for London. Available online: http://www.tfl.gov.uk/corporate/modesoftransport/londonunderground/1604.aspx (accessed on 12 November 2022).
- The History of the Construction of the Subway. Available online: https://metro.waw.pl/o-firmie/historia-budowy-metra/ (accessed on 12 November 2022). (In Polish).
- Metro Warszawskie Sp. z o.o. Annual Report. 2021. Available online: https://metro.waw.pl/wp-content/uploads/2022/08/metro_raport_2021.pdf (accessed on 12 November 2022). (In Polish and English).
- Statistical Office in Warszawa. Population. Available online: https://warszawa.stat.gov.pl/download/gfx/warszawa/en/defaultstronaopisowa/400/1/1/21_wwa_04_ludnosc.pdf (accessed on 12 November 2022).
- Act of July 7, 1994 Construction Law (in Polish), Journal of Laws No. 2021 item 2351 Consolidated Text. Available online: https://isap.sejm.gov.pl/isap.nsf/download.xsp/WDU20210002351/O/D20212351.pdf (accessed on 5 January 2023).
- Regulation of the Minister of Infrastructure of 12 April 2002 on the Technical Conditions to Be Met by Buildings and Their Location (in Polish), Journal of Laws 2022 pos. 1225 consolidated text. Available online: https://isap.sejm.gov.pl/isap.nsf/download.xsp/WDU20220001225/O/D20221225.pdf (accessed on 5 January 2023).
- Regulation of the Minister of Infrastructure of June 17, 2011 on the Technical Conditions to Be Met by Underground Subway Constructions and Their Location (in Polish), Journal of Laws No. 144, item 859. Available online: https://isap.sejm.gov.pl/isap.nsf/download.xsp/WDU20111440859/O/D20110859.pdf (accessed on 5 January 2023).
- Kosiorek, M. Fire safety of buildings w General construction. In Building Physics, 1st ed.; Arkady: Warsaw, Poland, 2005; pp. 667–691. (In Polish) [Google Scholar]
- Jędrak, J.; Konduracka, E.; Badyda, A.J.; Dąbrowski, P. Impact of Air Pollution on Health, 1st ed.; Krakowski Alarm Smogowy: Kraków, Poland, 2017; pp. 37–65. [Google Scholar]
- Sawicki, T. Factors that threaten the safety of firefighters in fire conditions. Bezpieczeństwo Pr. (Eng. Work. Saf.) 2004, 7–8, 35–38. (In Polish) [Google Scholar]
- Konecki, M.; Kolbrecki, A. Estimation of available safe egress time from compartments as a function of fire critical parameters. Pr. Inst. Tech. Bud. (Eng. Work. Build. Res. Inst.) 2004, 3, 3–9. (In Polish) [Google Scholar]
- Yuen, A.C.Y.; De Cachinho Cordeiro, I.M.; Chen, T.B.Y.; Chen, Q.; Liu, H.; Yeoh, G.H. Multiphase CFD modelling for enclosure fires—A review on past studies and future perspectives. Exp. Comput. Multiph. Flow 2021, 4, 1–25. [Google Scholar] [CrossRef]
- Ansys Fluent. Available online: https://www.ansys.com (accessed on 5 January 2023).
- OpenFoam. Available online: https://www.openfoam.com (accessed on 15 November 2022).
- PHOENICS. Available online: https://www.cham.co.uk/phoenics.php (accessed on 15 November 2022).
- Fire Dynamics Simulator (FDS) and Smokeview (SMV). Available online: https://pages.nist.gov/fds-smv/ (accessed on 12 November 2022).
- Zhang, J.; Li, Y.; Dai, B.; Li, X.; Huang, Y. The Effect of Exhaust Velocity on Smoke Exhaust in Subway Platform Fire. Procedia Eng. 2018, 211, 1018–1025. [Google Scholar] [CrossRef]
- Wu, F.; Jiang, J.; Zhou, R. Smoke Flow Temperature beneath the ceiling in an atrium-style subway station with different fire source locations. Procedia Eng. 2018, 211, 794–800. [Google Scholar] [CrossRef]
- Wang, W.; He, T.; Huang, W.; Shen, R.; Wang, Q. Optimization of switch modes of fully enclosed platform screen doors during emergency platform fires in underground metro station. Tunn. Undergr. Space Technol. 2018, 81, 277–288. [Google Scholar] [CrossRef]
- Kallianiotis, A.; Papakonstantinou, D.; Tolias, I.C.; Benardos, A. Evaluation of fire smoke control in underground space. Undergr. Space 2022, 7, 295–310. [Google Scholar] [CrossRef]
- Chen, J.; Long, Z.; Wang, L.; Xu, B.; Bai, Q.; Zhang, Y.; Liu, C.; Zhong, M. Fire evacuation strategy analysis in long metro tunnels. Saf. Sci. 2022, 147, 105603. [Google Scholar] [CrossRef]
- Shi, C.; Li, J.; Xu, X. Full-scale tests on smoke temperature distribution in long-large subway tunnels with longitudinal mechanical ventilation. Tunn. Undergr. Space Technol. 2021, 109, 103784. [Google Scholar] [CrossRef]
- Wang, H.; Gao, H. Study of Blockage Effects of Metro Train on Critical Velocity in Sloping Subway Tunnel Fires with Longitudinal Ventilation. Energies 2022, 15, 5762. [Google Scholar] [CrossRef]
- Chen, T.B.Y.; Yuen, A.C.Y.; De Cachinho Cordeiro, I.M.; Liu, H.; Cao, R.; Ellison, A.; Yeoh, G.H. In-Depth Assessment of Cross-Passage Critical Velocity for Smoke Control in Large-Scale Railway Tunnel Fires. Fire 2022, 5, 140. [Google Scholar] [CrossRef]
- Dong, S.; Zhang, X.; Wang, K. Study on Fire Ventilation Control of Subway Tunnel: A Case Study for Dalian Subway. Sustainability 2022, 14, 8695. [Google Scholar] [CrossRef]
- Liu, Q.; He, R.; Zhang, L. Simulation-based multi-objective optimization for enhanced safety of fire emergency response in metro stations. Reliab. Eng. Syst. Saf. 2022, 228, 108820. [Google Scholar] [CrossRef]
- PyroSim. Fire Dynamics and Smoke Control Simulation. Available online: https://www.thunderheadeng.com/pyrosim (accessed on 31 December 2022).
- McGrattan, K.; Hostikka, S.; Floyd, J.; McDermott, R.; Vanella, M. Fire Dynamics Simulator. Technical Reference Guide. Volume 1: Mathematical Model, 6th ed.; NIST: Gaithersburg, MD, USA, 2022. Available online: https://pages.nist.gov/fds-smv/manuals.html (accessed on 5 January 2023).
- CIBSE. CIBSE Guide E—Fire Safety Engineering—6.5.3.1 Fire Growth Rate, 4th ed.; The Chartered Institution of Building Services Engineers (CIBSE): London, UK, 2019; Available online: https://app.knovel.com/hotlink/pdf/id:kt012K28D1/cibse-guide-e-fire-safety/fire-growth-rate (accessed on 19 November 2022).
- McGrattan, K.; Hostikka, S.; Floyd, J.; McDermott, R.; Vanella, M. Fire Dynamics Simulator. User’s Guide, 6th ed.; NIST: Gaithersburg, MD, USA, 2022. Available online: https://pages.nist.gov/fds-smv/manuals.html (accessed on 5 January 2023).
- NFPA 92B; Standard for Smoke Management Systems in Malls, Atria and Large Spaces. National Fire Protection Association (NFPA): Quincy, MA, USA, 2009.
- Kosiorek, M.; Głąbski, P. Designing Fire Ventilation Systems for Escape Routes in Tall and High-Rise Buildings; Instruction No. 378/2002; Building Research Institute: Warsaw, Poland, 2002.
- Szczepański, M.; Pęski, S.; Miros, G. Issues on designing the subway in Warsaw. Urban Reg. Transp. 2015, 9, 13–20. (In Polish) [Google Scholar]
- ILF Consulting Engineers Polska sp., o.o. Personal communication, Warsaw, Poland, 2021.
- Orzełowska, F. Analysis of the Operation of Smoke Ventilation in the Metro’s Technological Corridor Based on Numerical Simulation of Selected Fire Variants. Master’s Thesis, Warsaw University of Technology, Warsaw, Poland, 2022. (In Polish). [Google Scholar]
- PD 7974-6:2019; Application of Fire Safety Engineering Principles to the Design of Buildings Human Factors. Life Safety Strategies. Occupant Evacuation, Behaviour and Condition (Sub-System 6). European Standards: Plzen, Czech Republic, 2019.
- McGrattan, K.; Hostikka, S.; Floyd, J.; McDermott, R.; Vanella, M. Fire Dynamics Simulator Technical Reference Guide. Volume 4: Software Quality Assurance, 6th ed.; NIST: Gaithersburg, MD, USA, 2022. Available online: https://pages.nist.gov/fds-smv/manuals.html (accessed on 5 January 2023).


| No. | Description | Value |
|---|---|---|
| 1 | Alarming time | 60 s |
| 2 | Time of the first reactions after the occurrence of a fire (category: watchful, acquainted) | 60 s |
| 3 | Time of passage of all users through the emergency door | 90 s |
| 3.a | Computational speed of the user on a level path | 1.2 m/s |
| 3.b | Length of the path (from the farthest room to the emergency exit) | 78.0 m |
| 3.c | Time of transition (78.0/1.2 = 65 s) | 65 s |
| 3.d | Width of the emergency door | 1.6 m |
| 3.e | Throughput of emergency doors | 1.33 pers./(m s−1) |
| 3.f | The number of people who can pass through the emergency door per second (1.6 × 1.33 = 2.13) | 2.13 pers. |
| 3.g | Staff | 50 pers. |
| 3.h | Time of passage of staff through the emergency door (50/2.13 = 25) | 25 s |
| 3.i | Time of movement of subway staff (65 + 25 = 90) | 90 s |
| 4 | RSET (30 + 65 + 90 = 180) | 180 s |
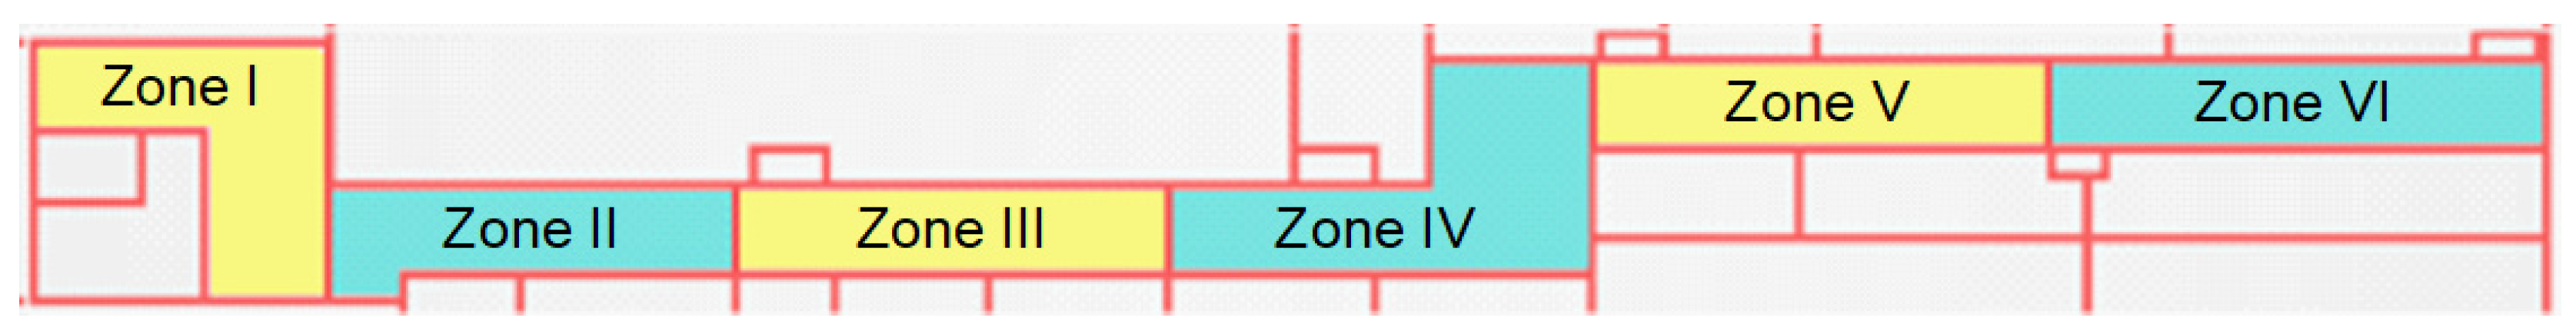
| Variant | Description |
|---|---|
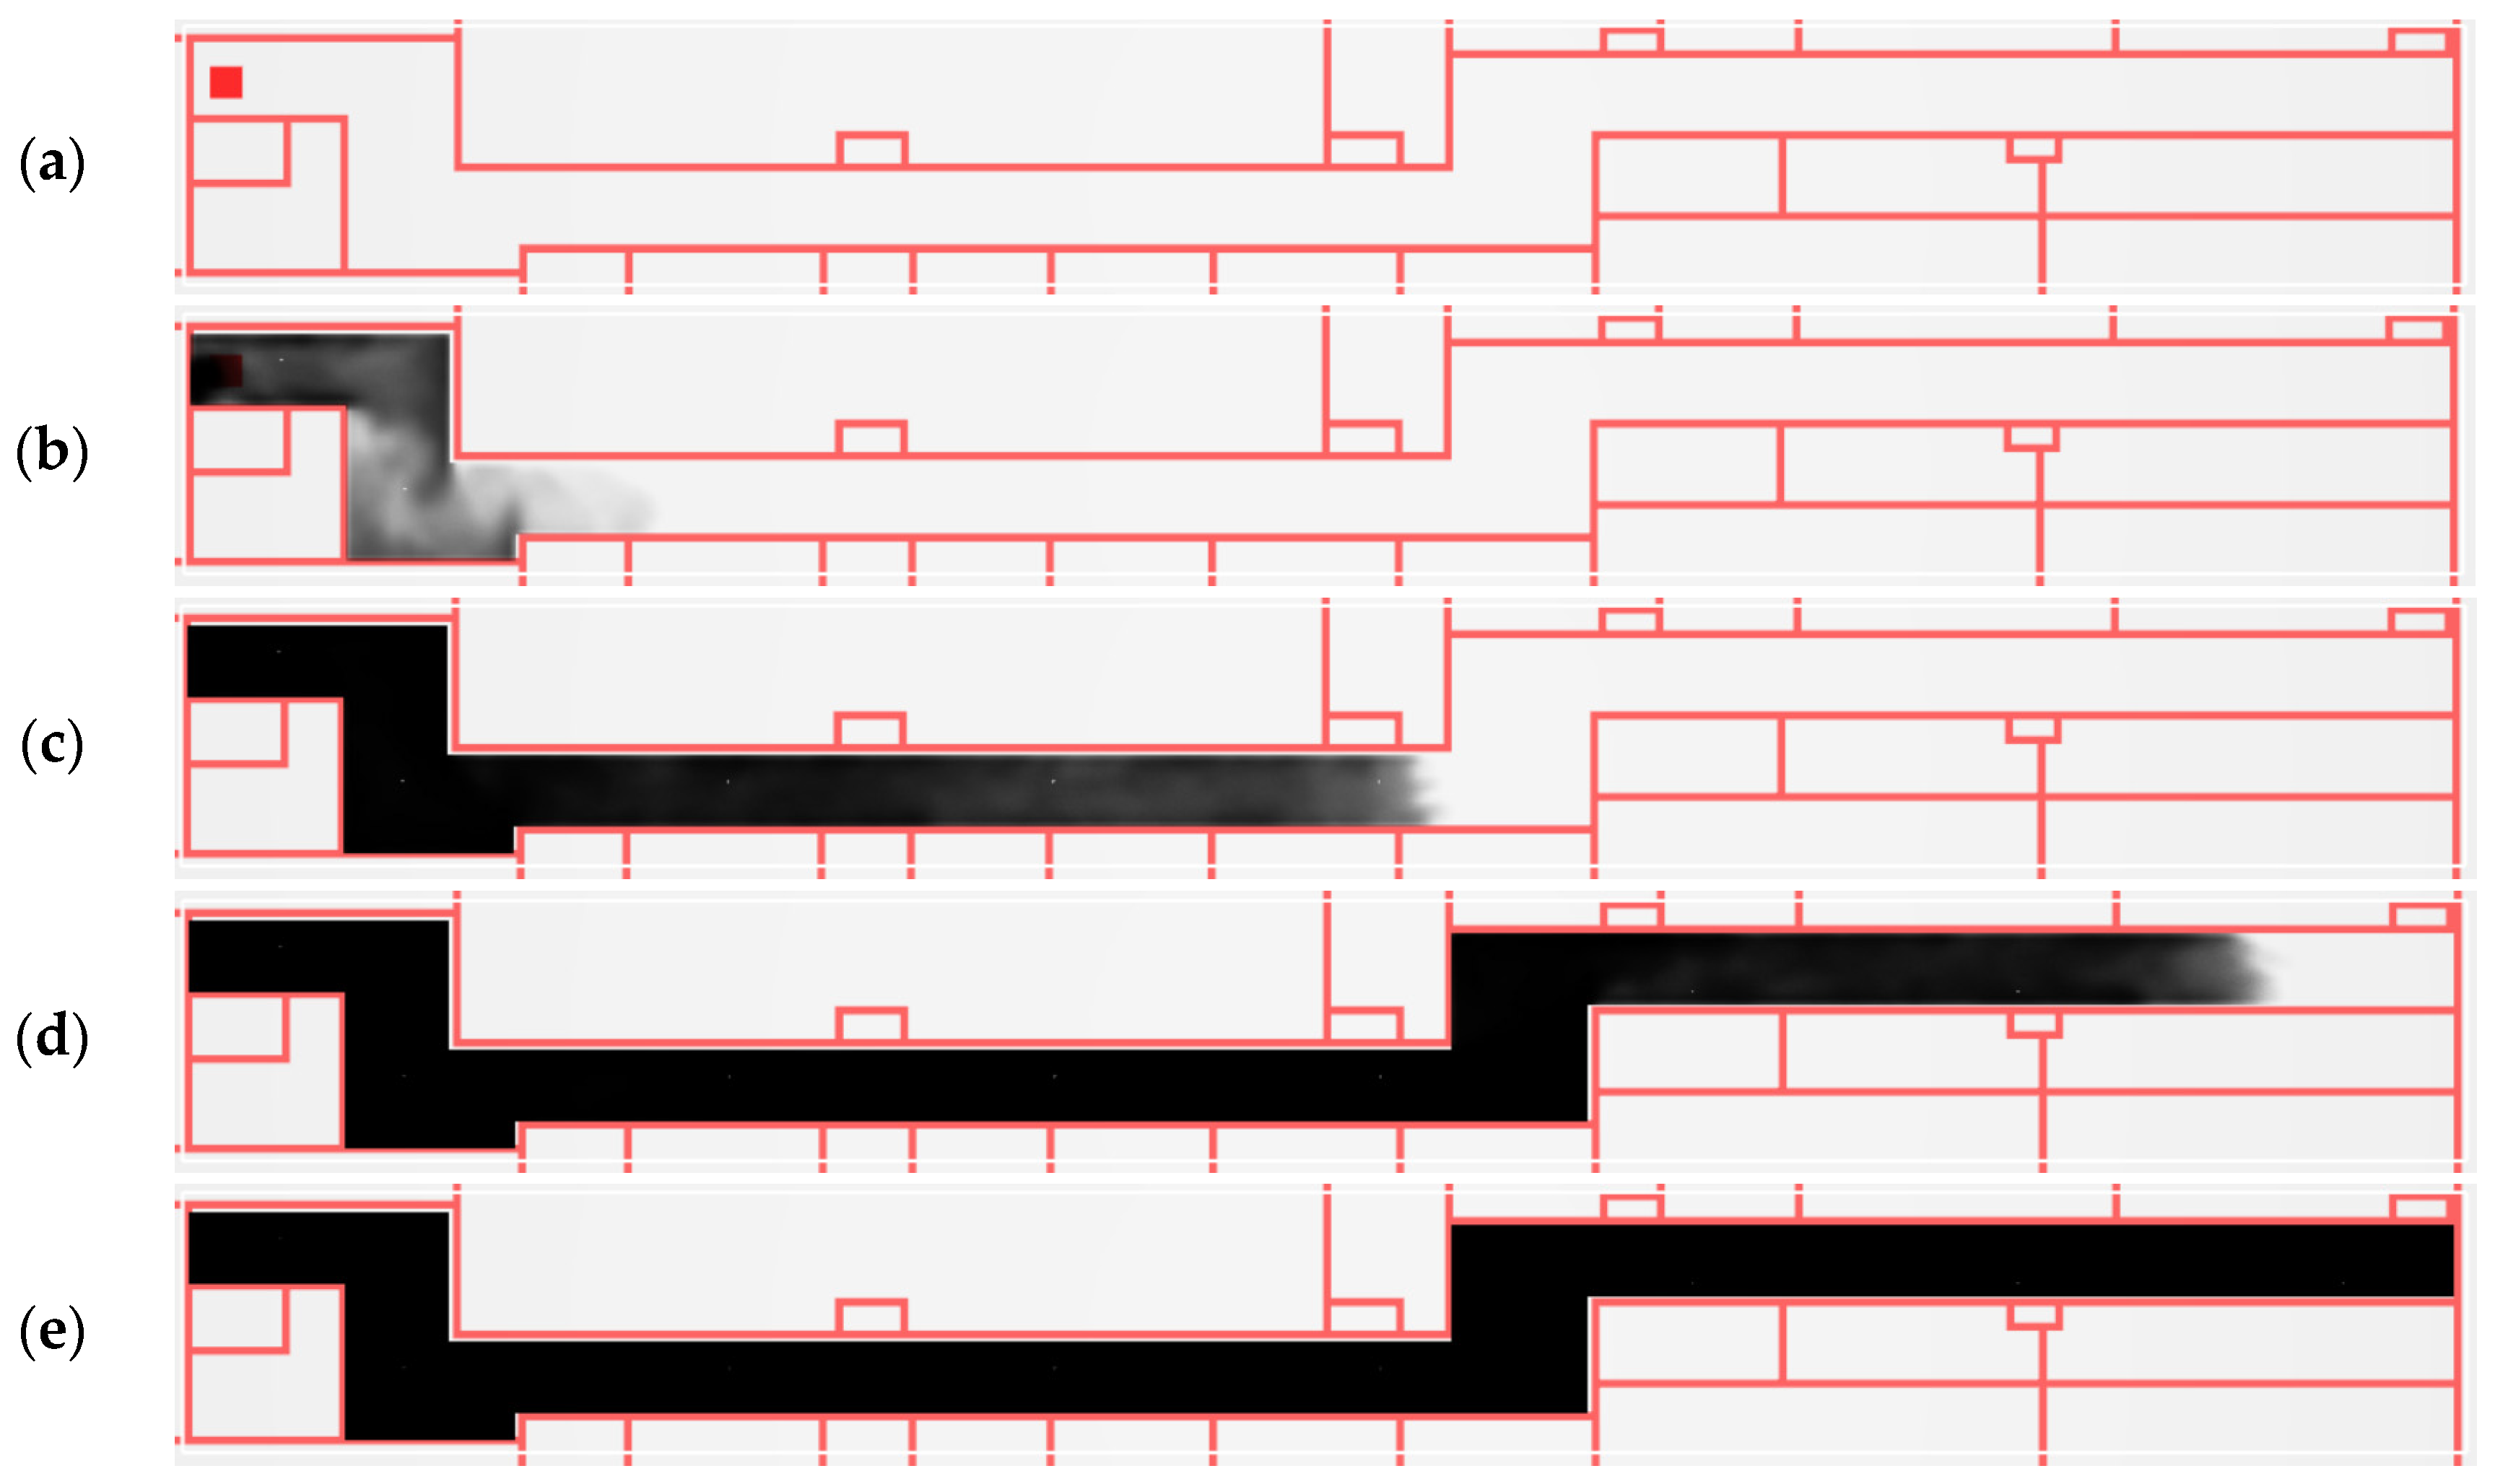
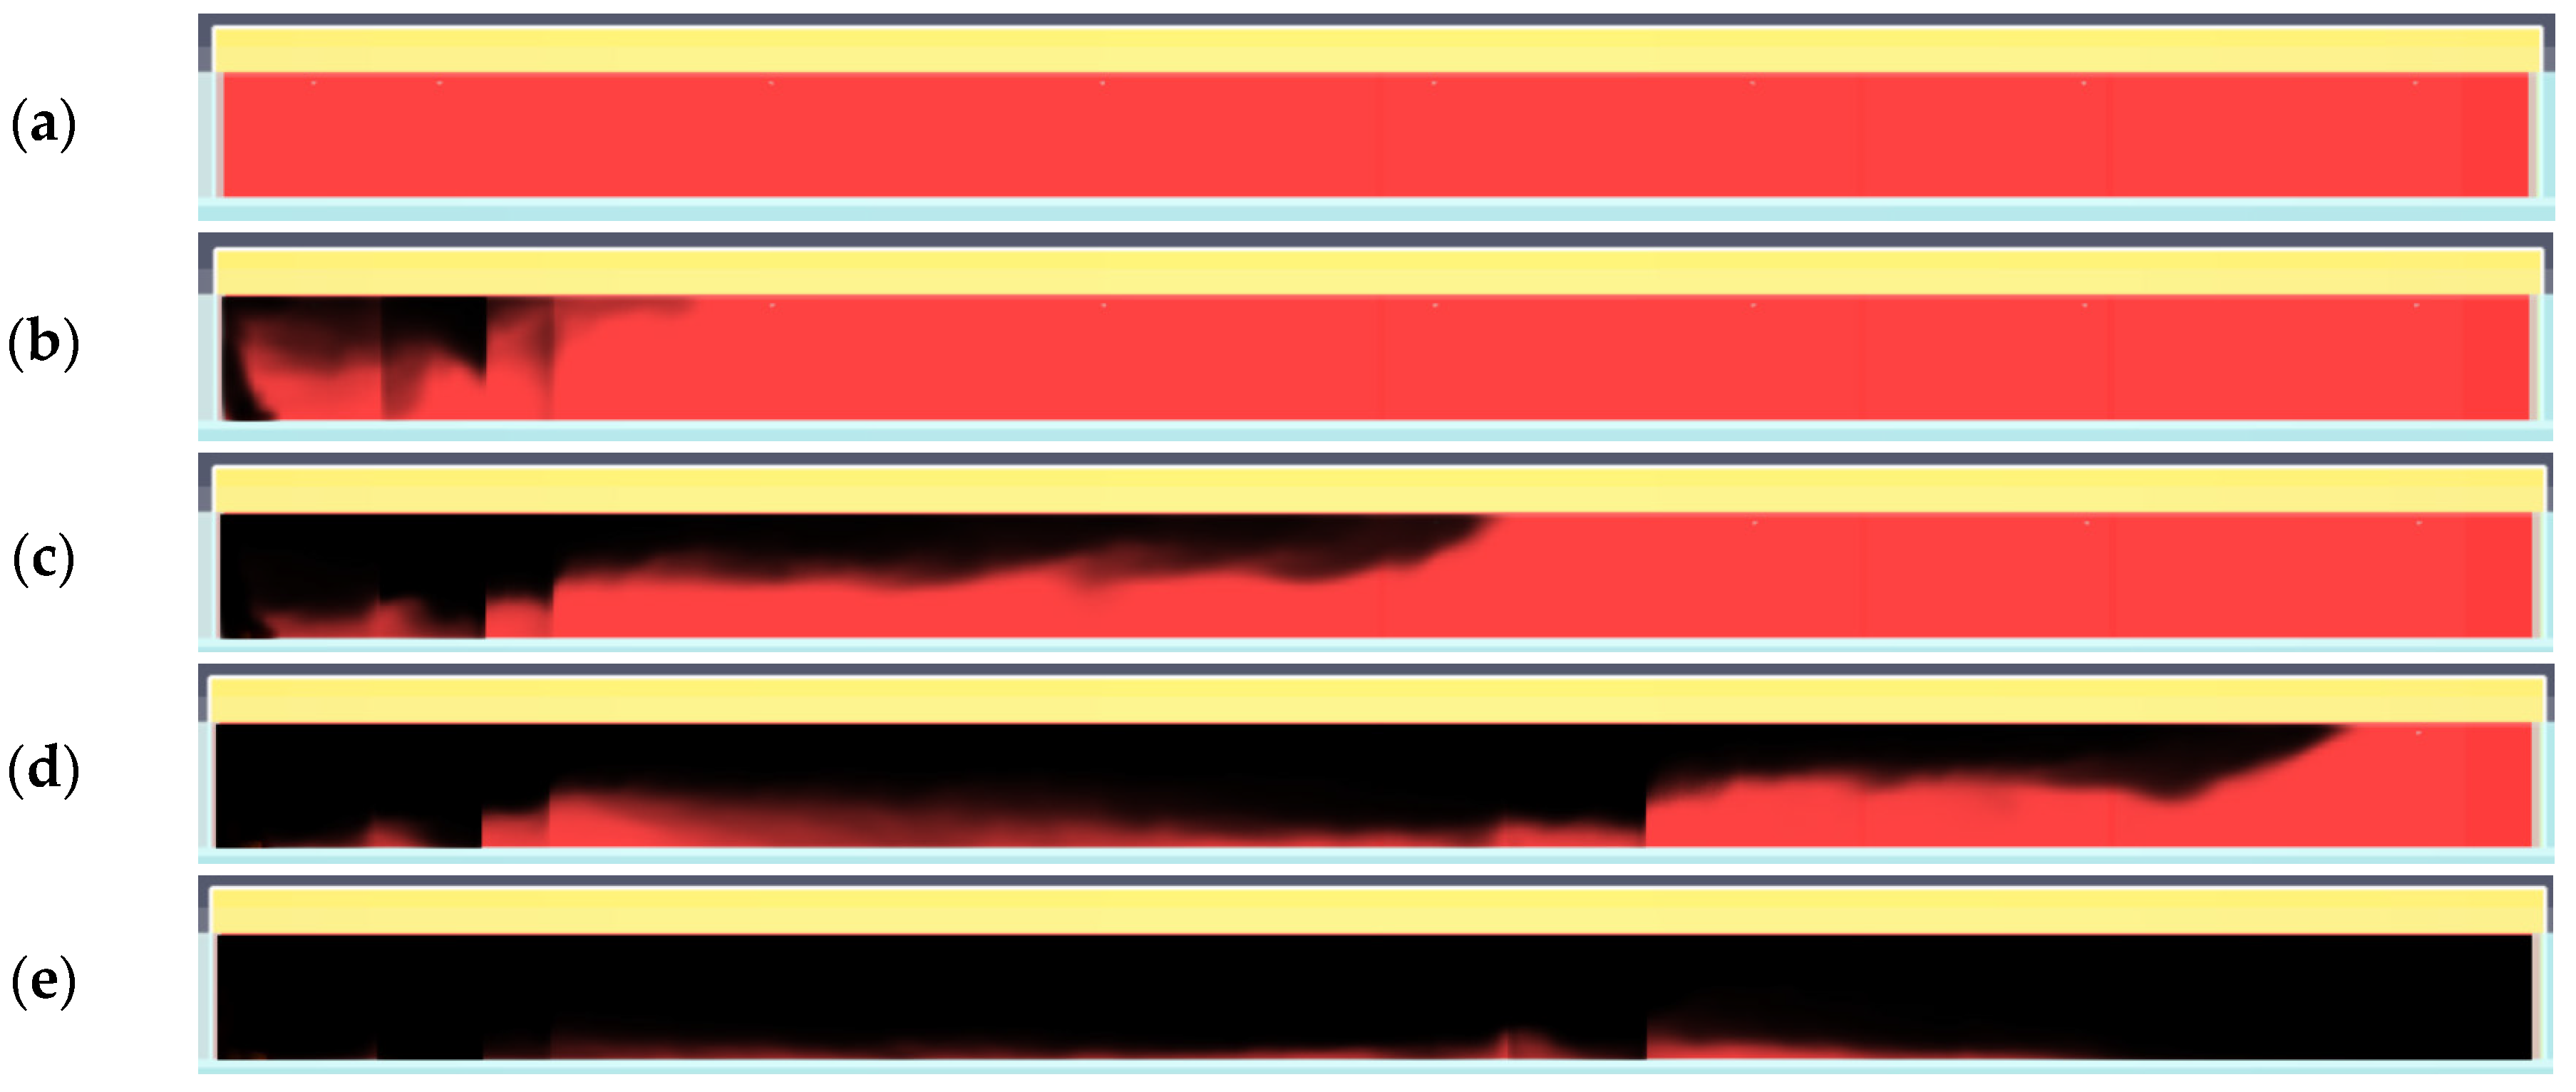
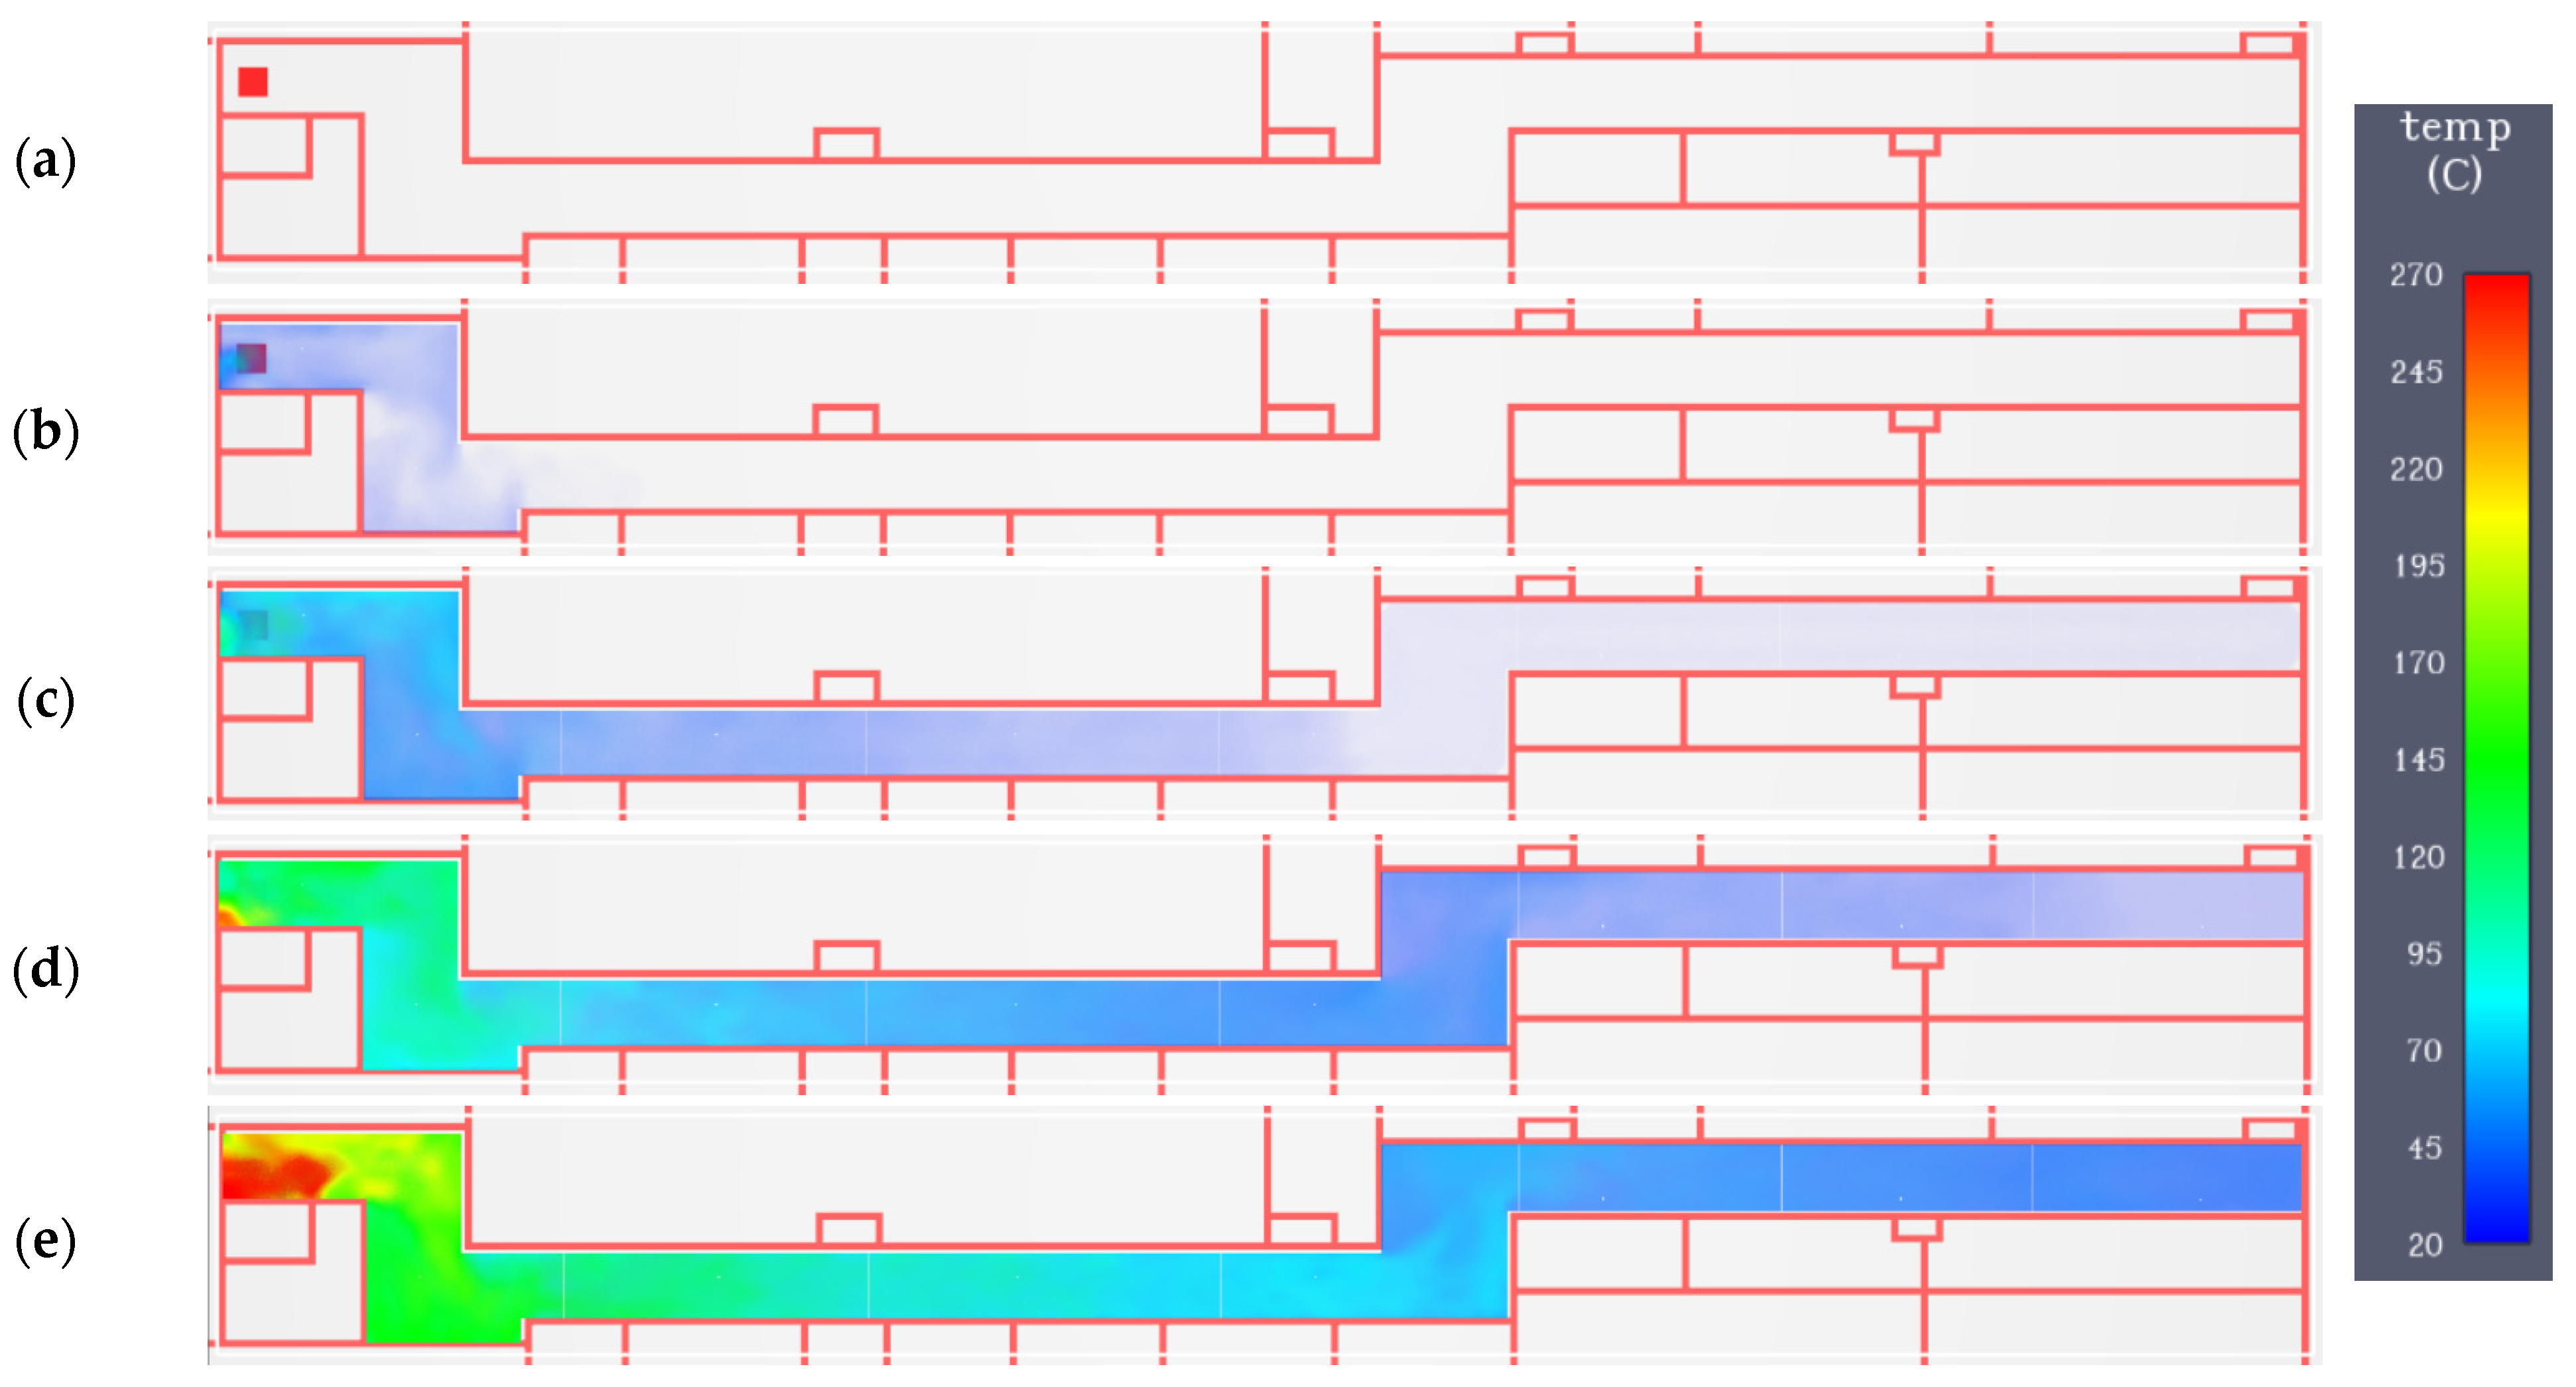
| A | Fire source appears on the left side of the service corridor in zone I, smoke exhaust ventilation is turned off |
| B | Fire source appears on the left side of the technological corridor in zone I, smoke exhaust ventilation is turned on |
| C | Fire source appears in the middle part of the technological corridor in zone IV, smoke exhaust ventilation is turned on |
| D | Fire source appears on the right side of the service corridor in zone VI, smoke exhaust ventilation is turned on |
| Variant | Smoke | Temperature | Polluted Air Speed | Remarks |
|---|---|---|---|---|
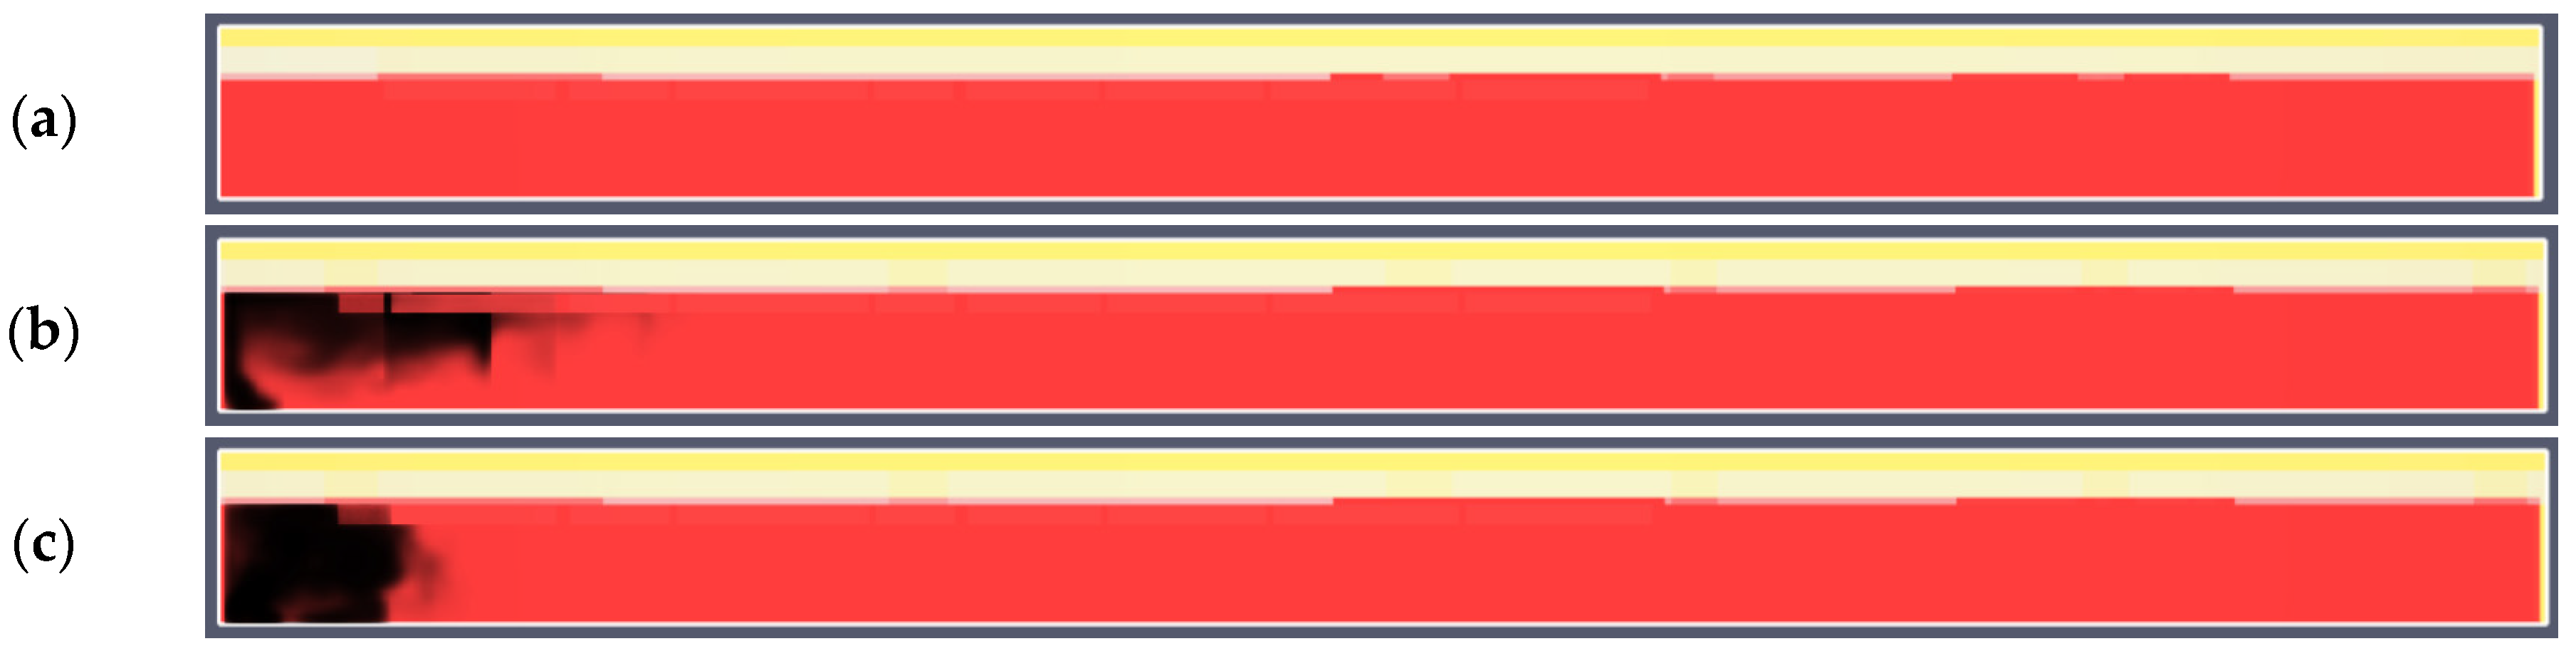
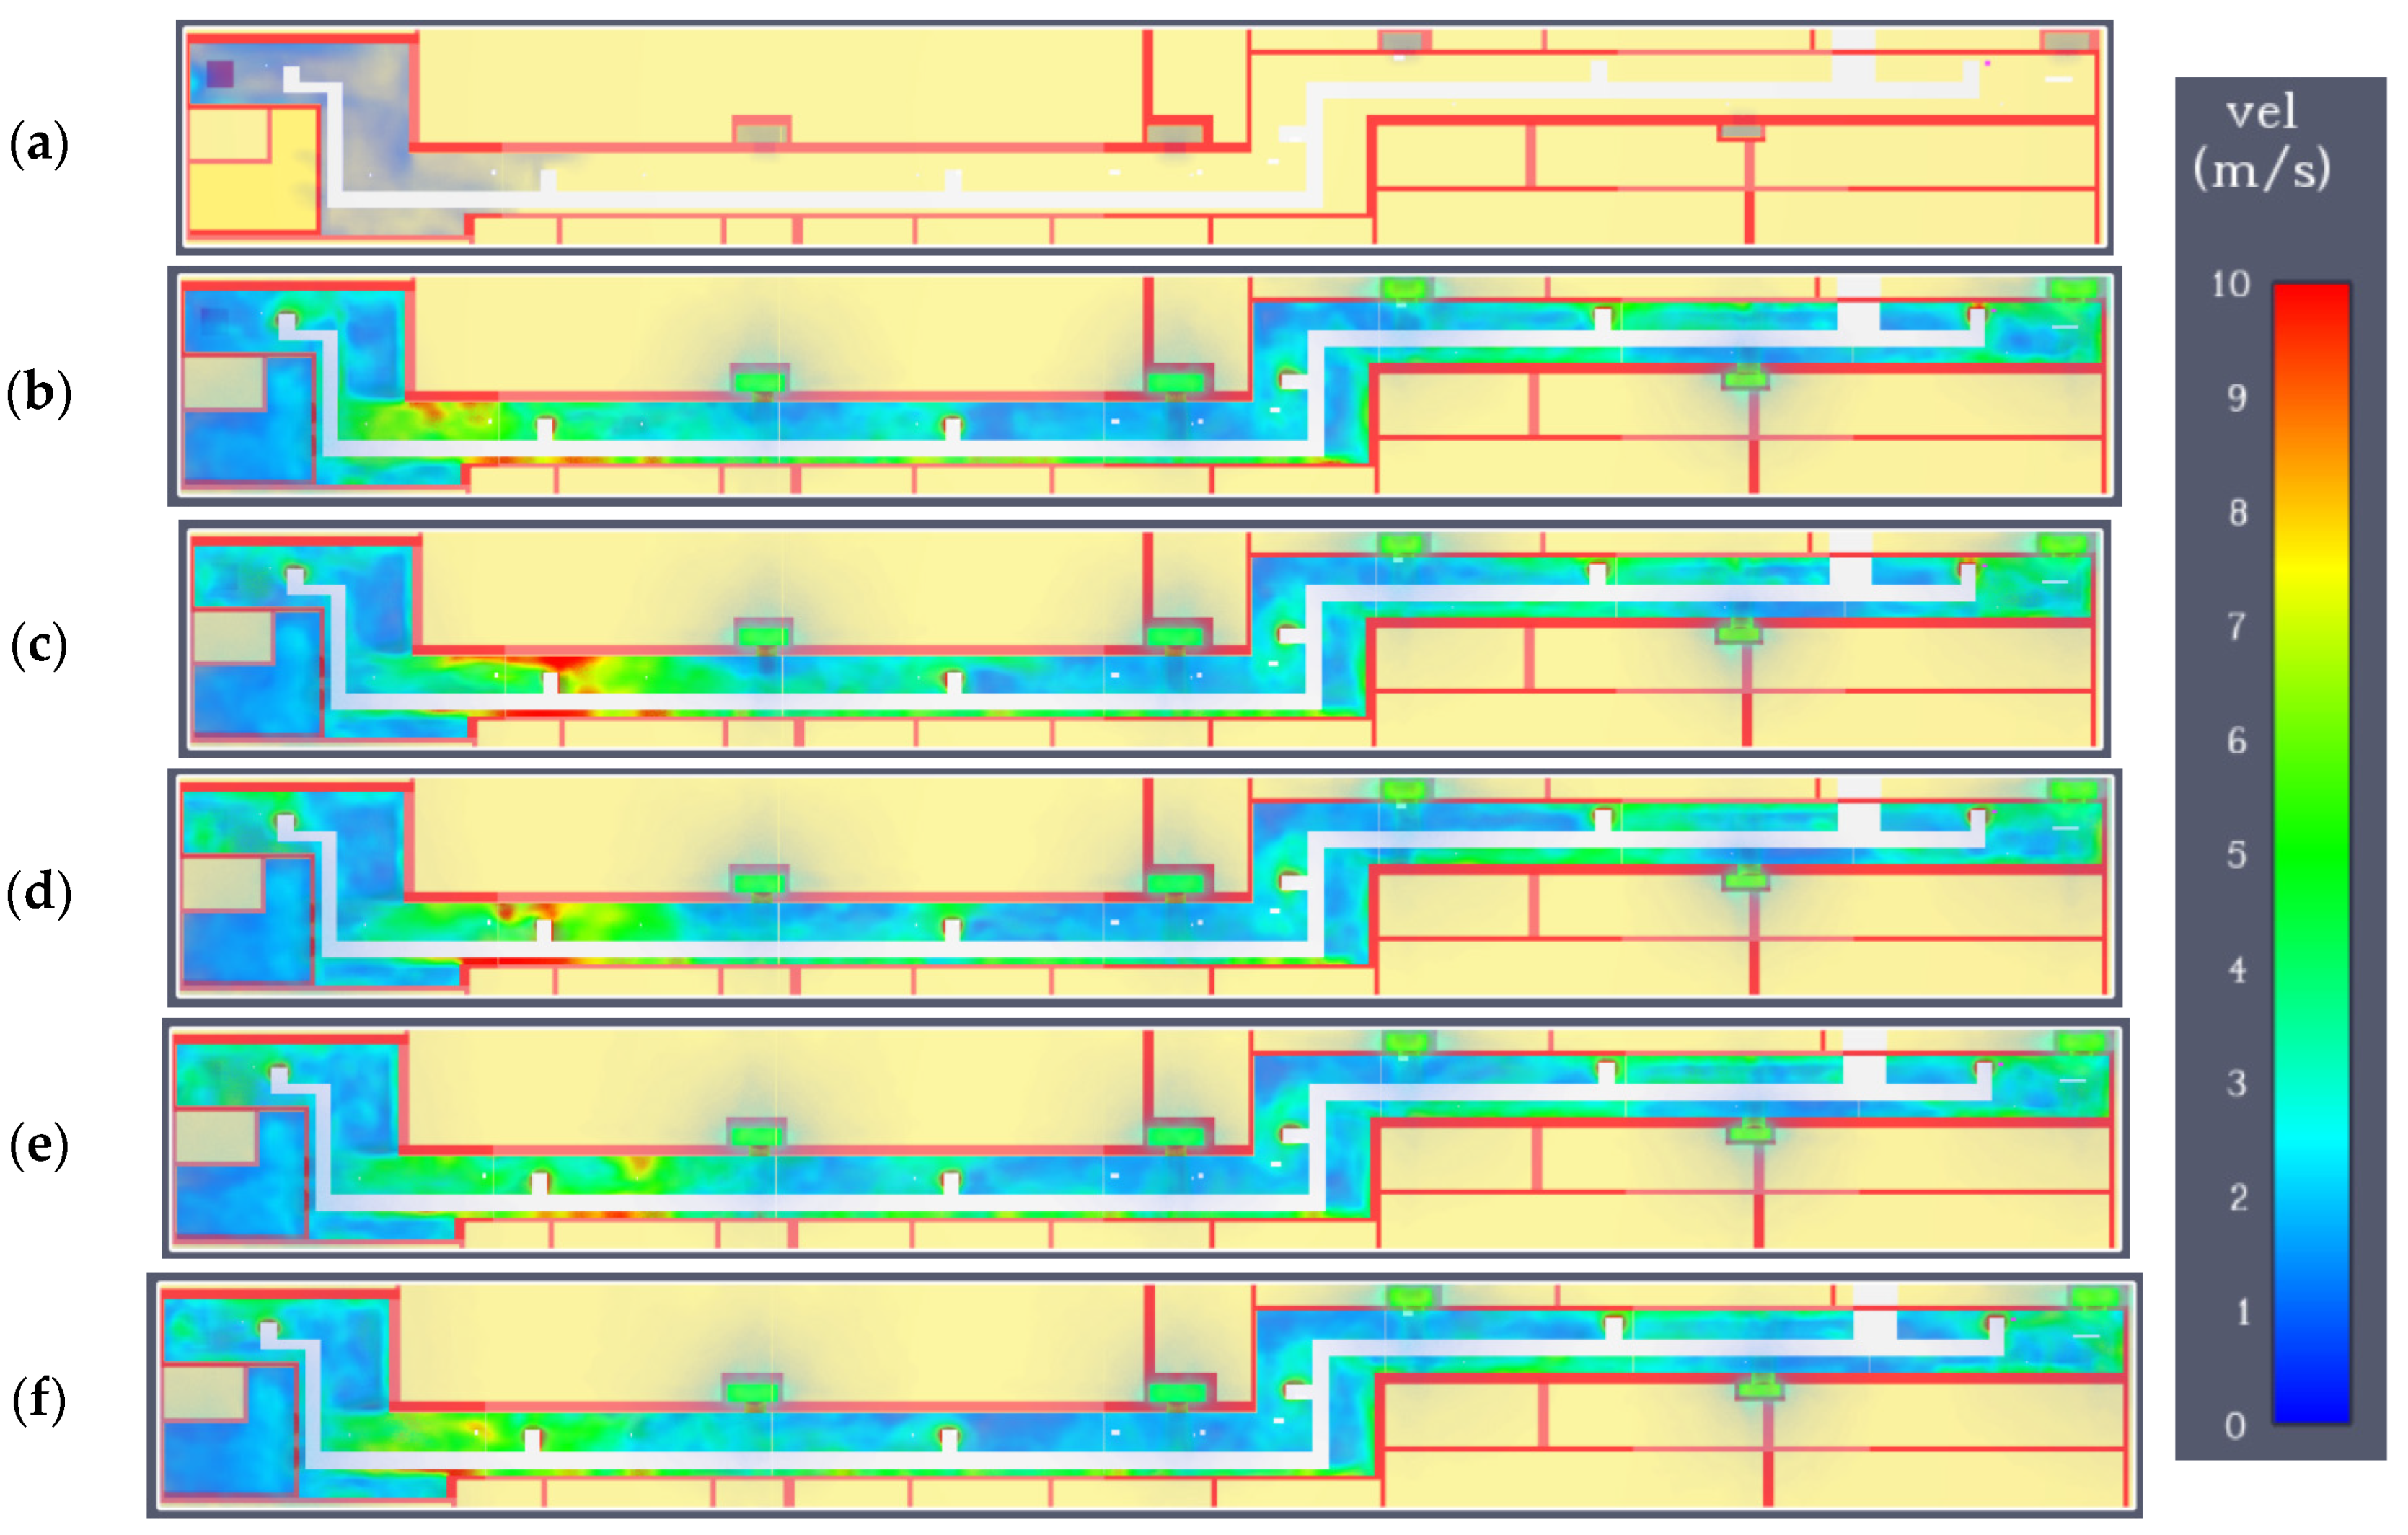
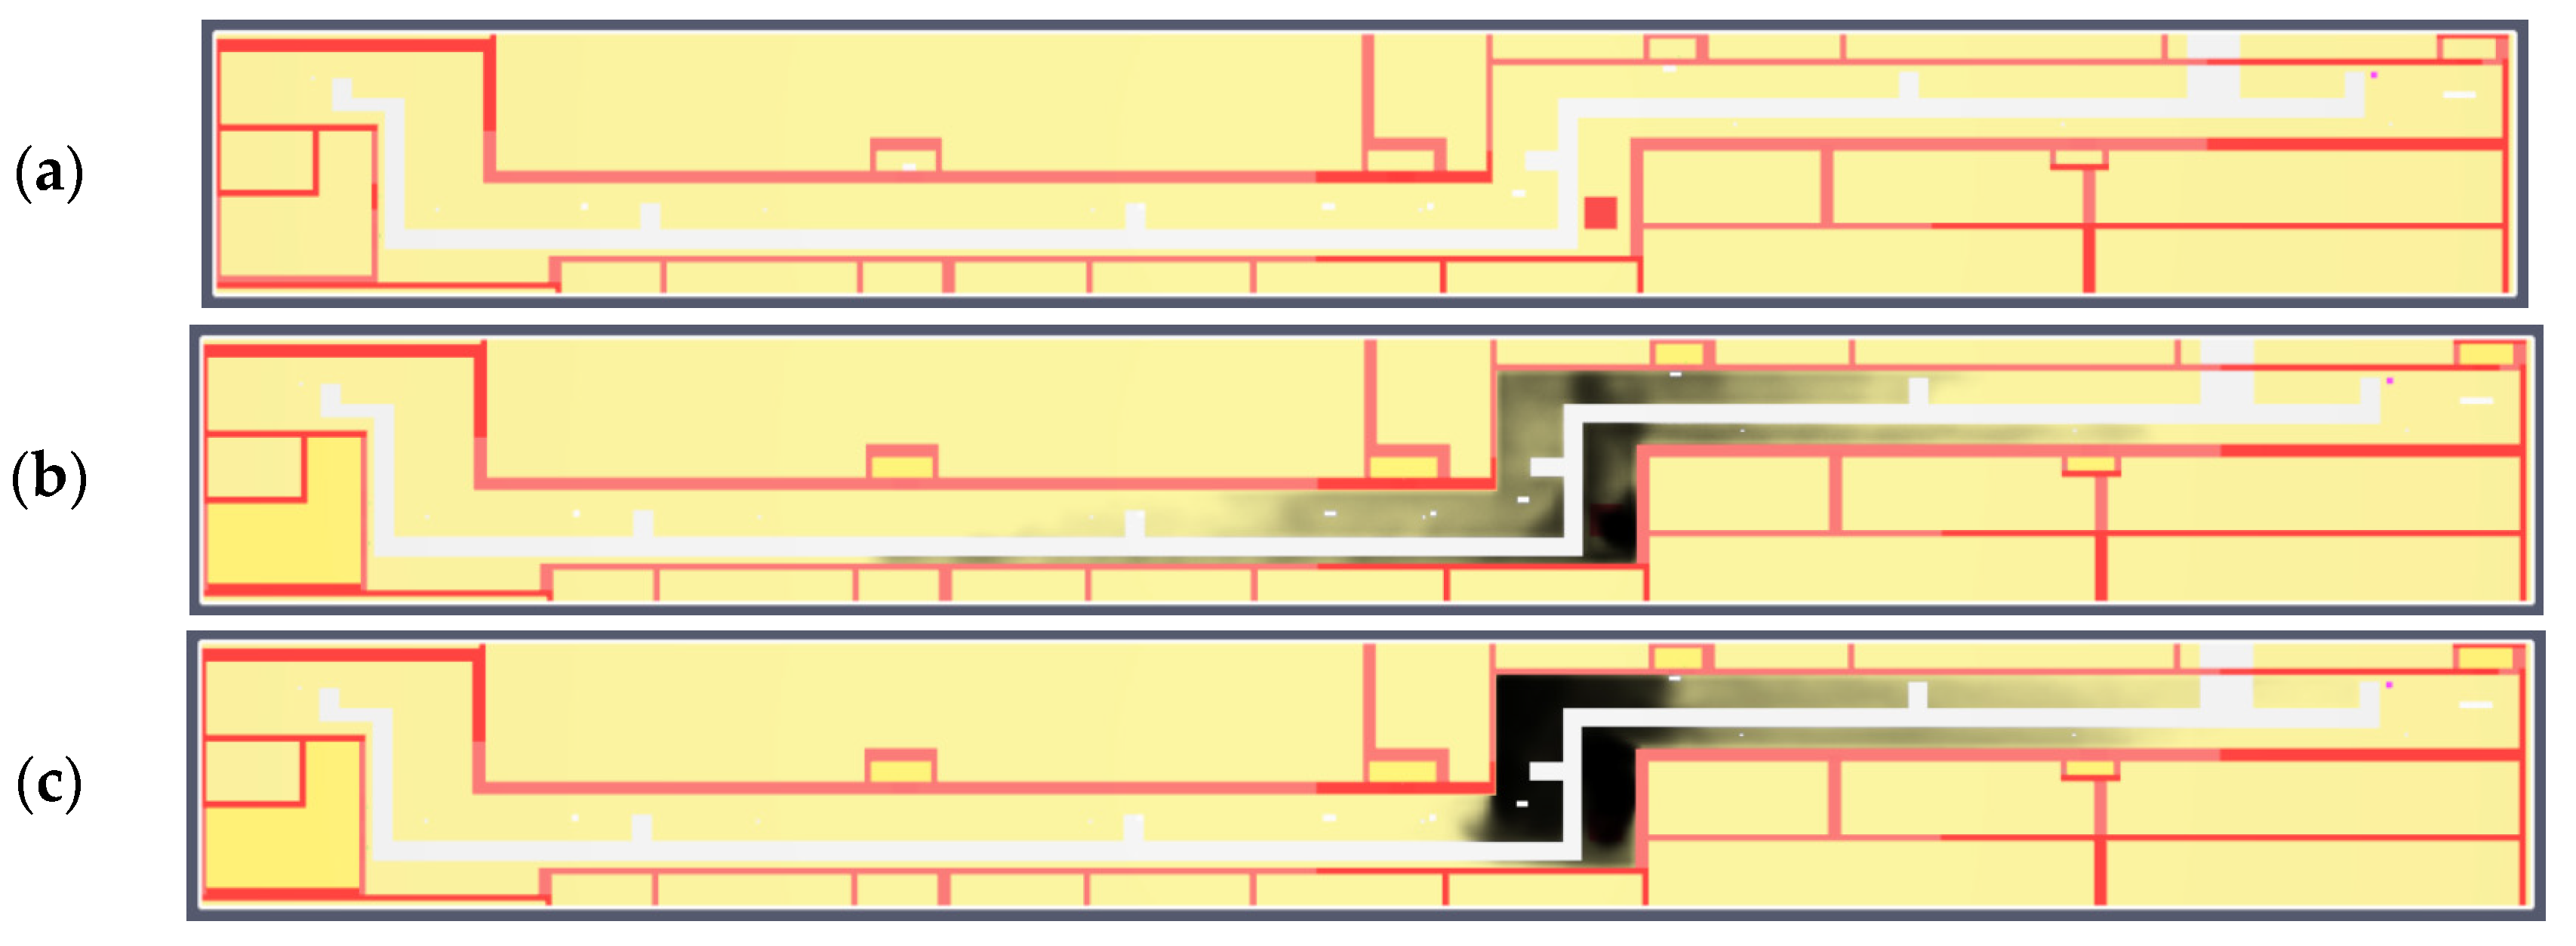
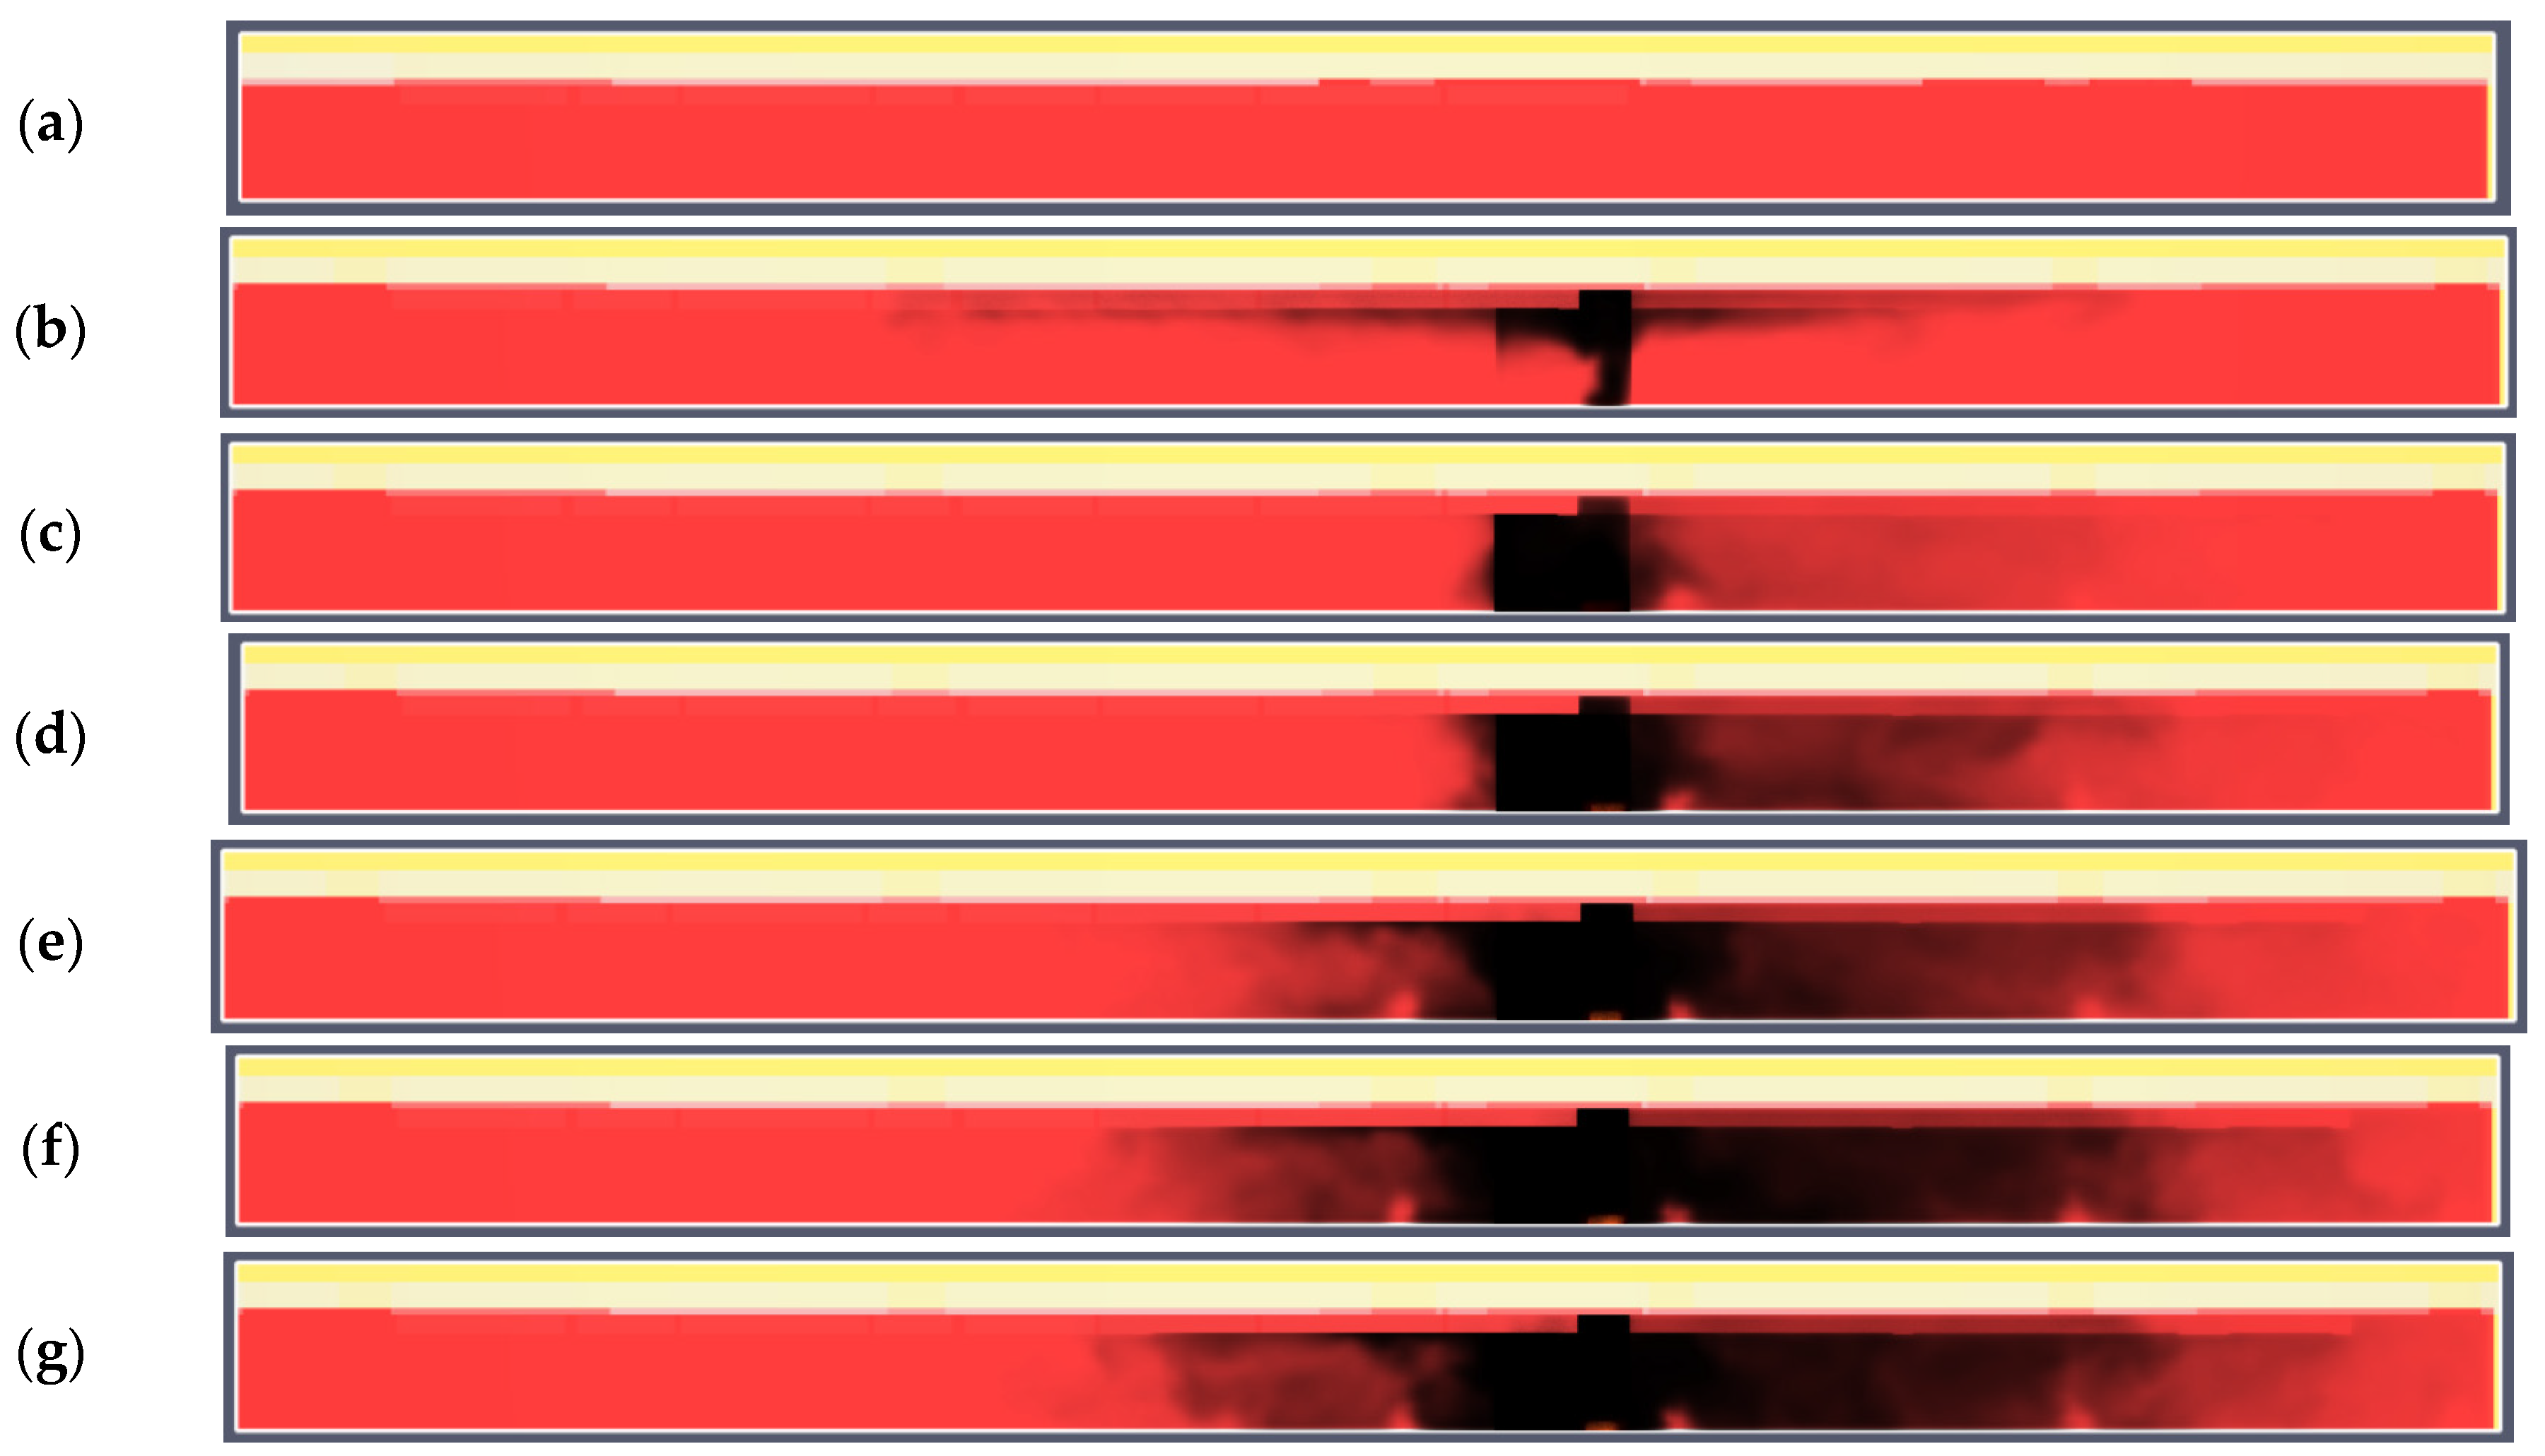
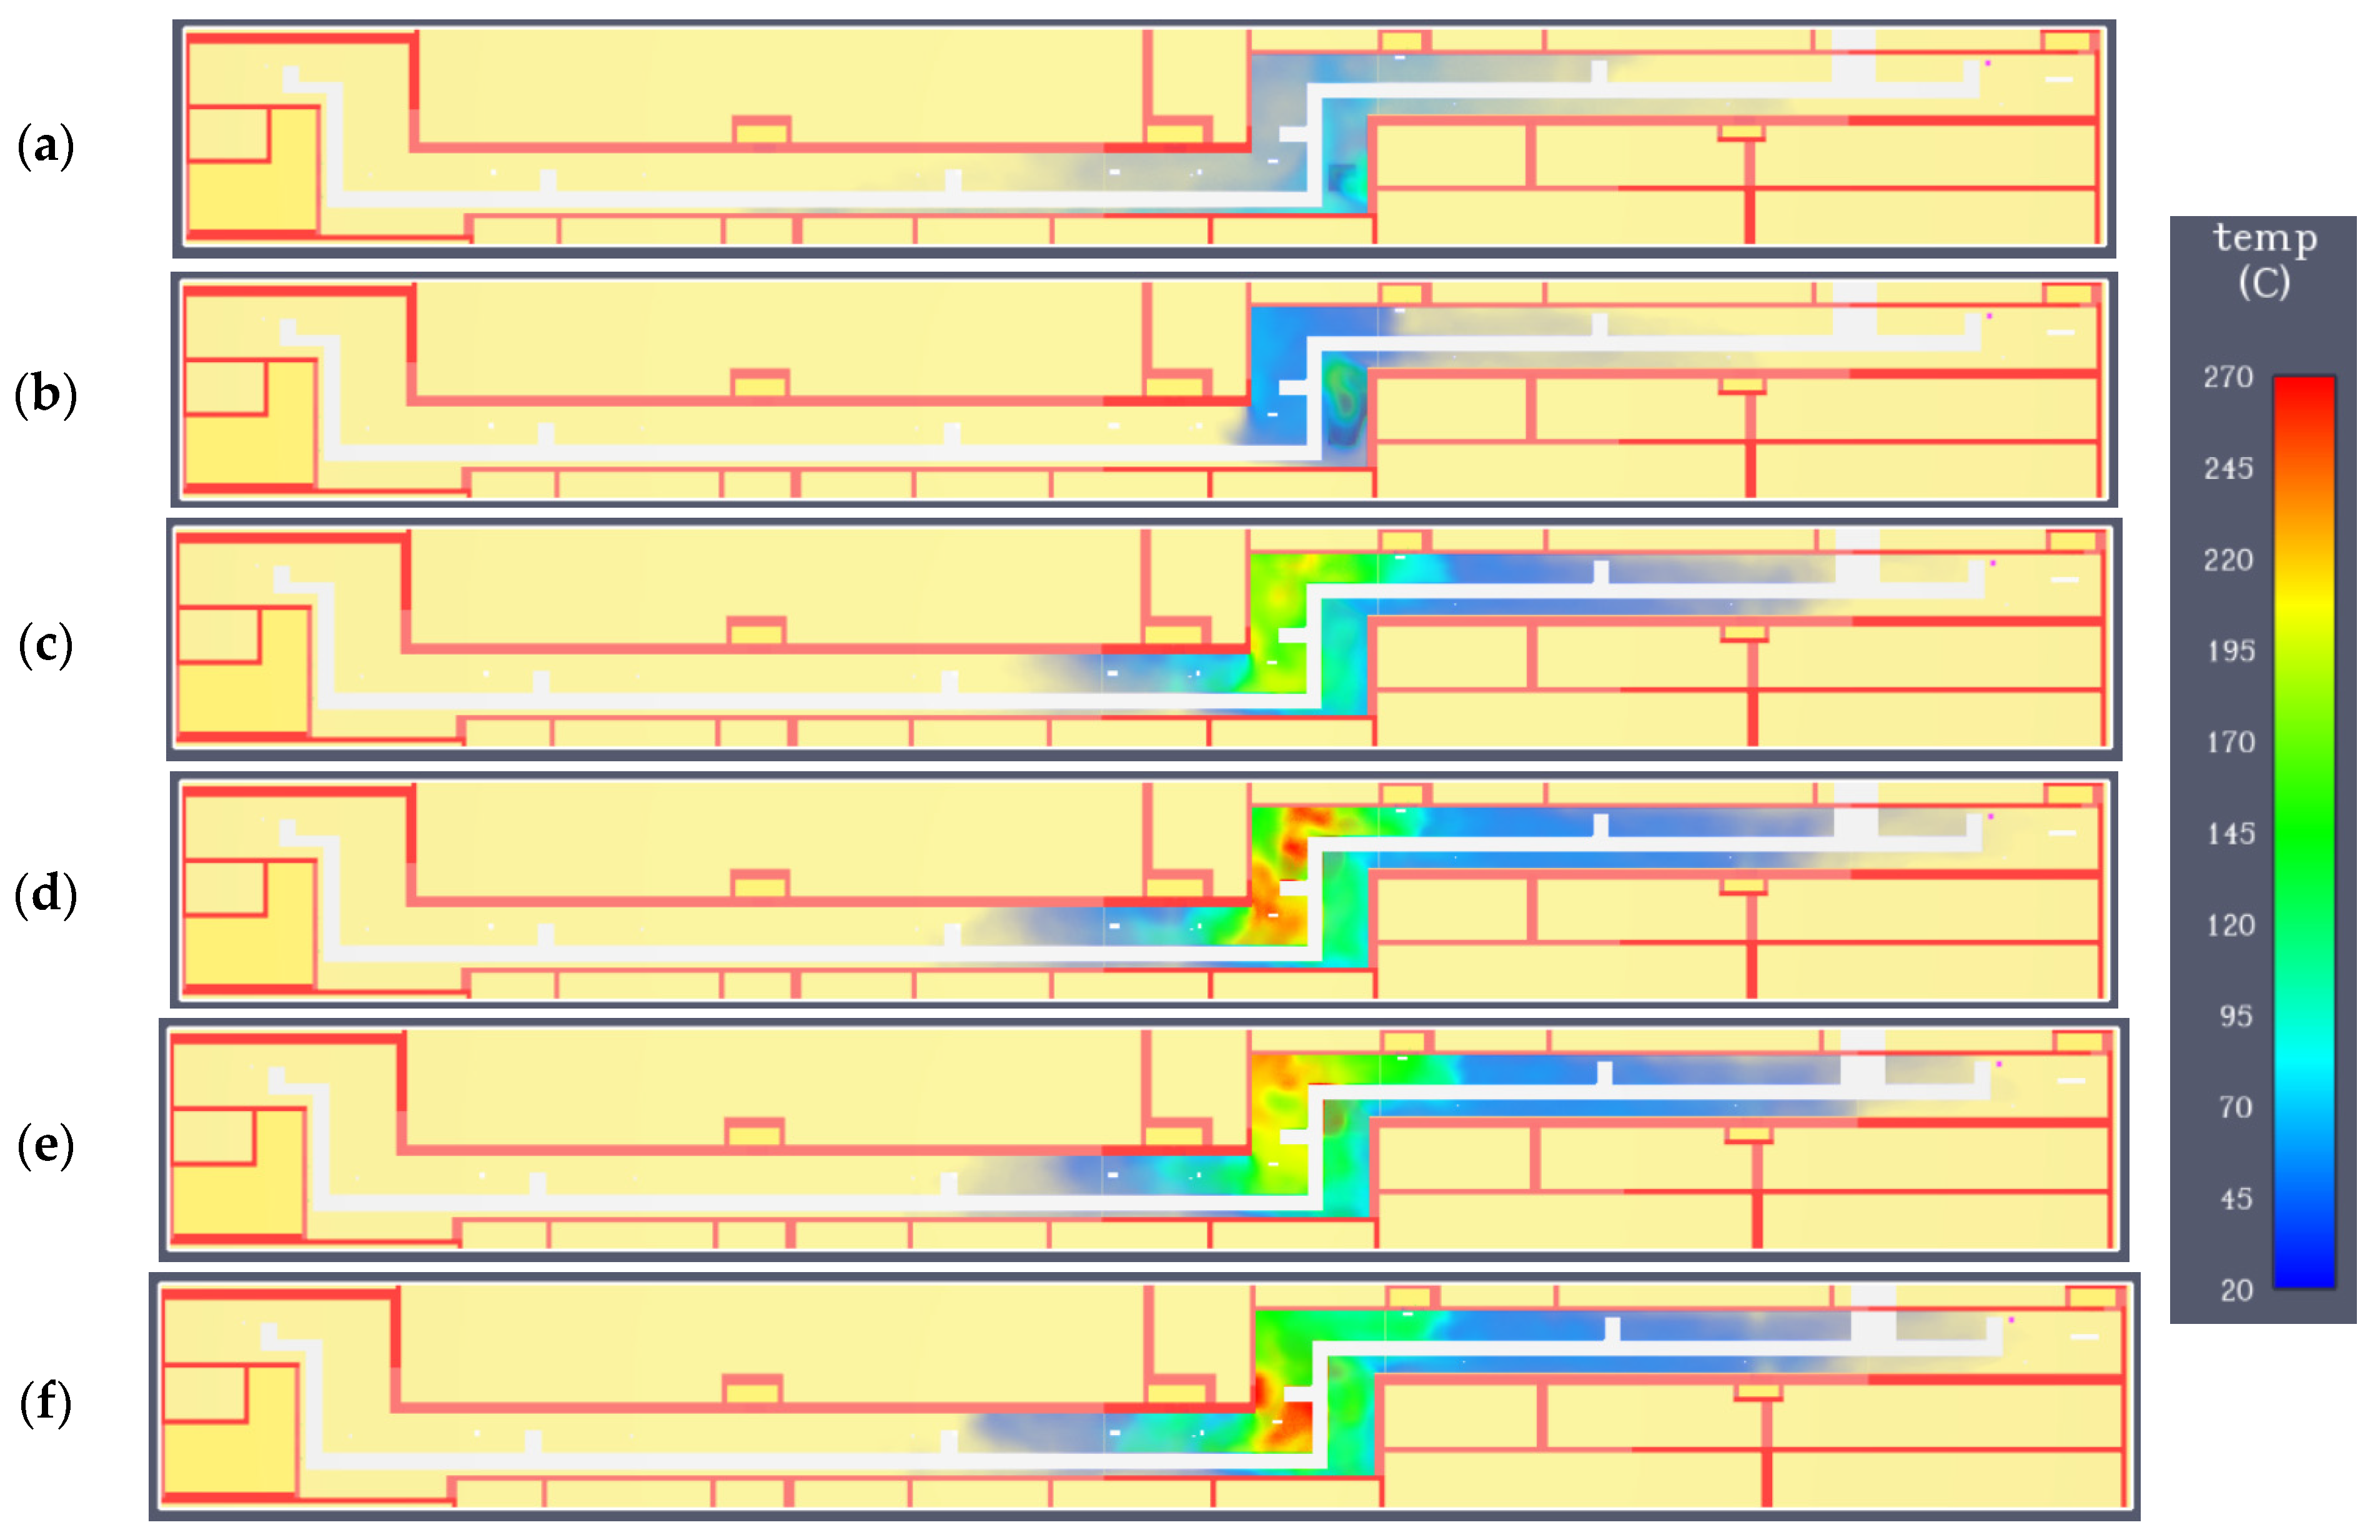
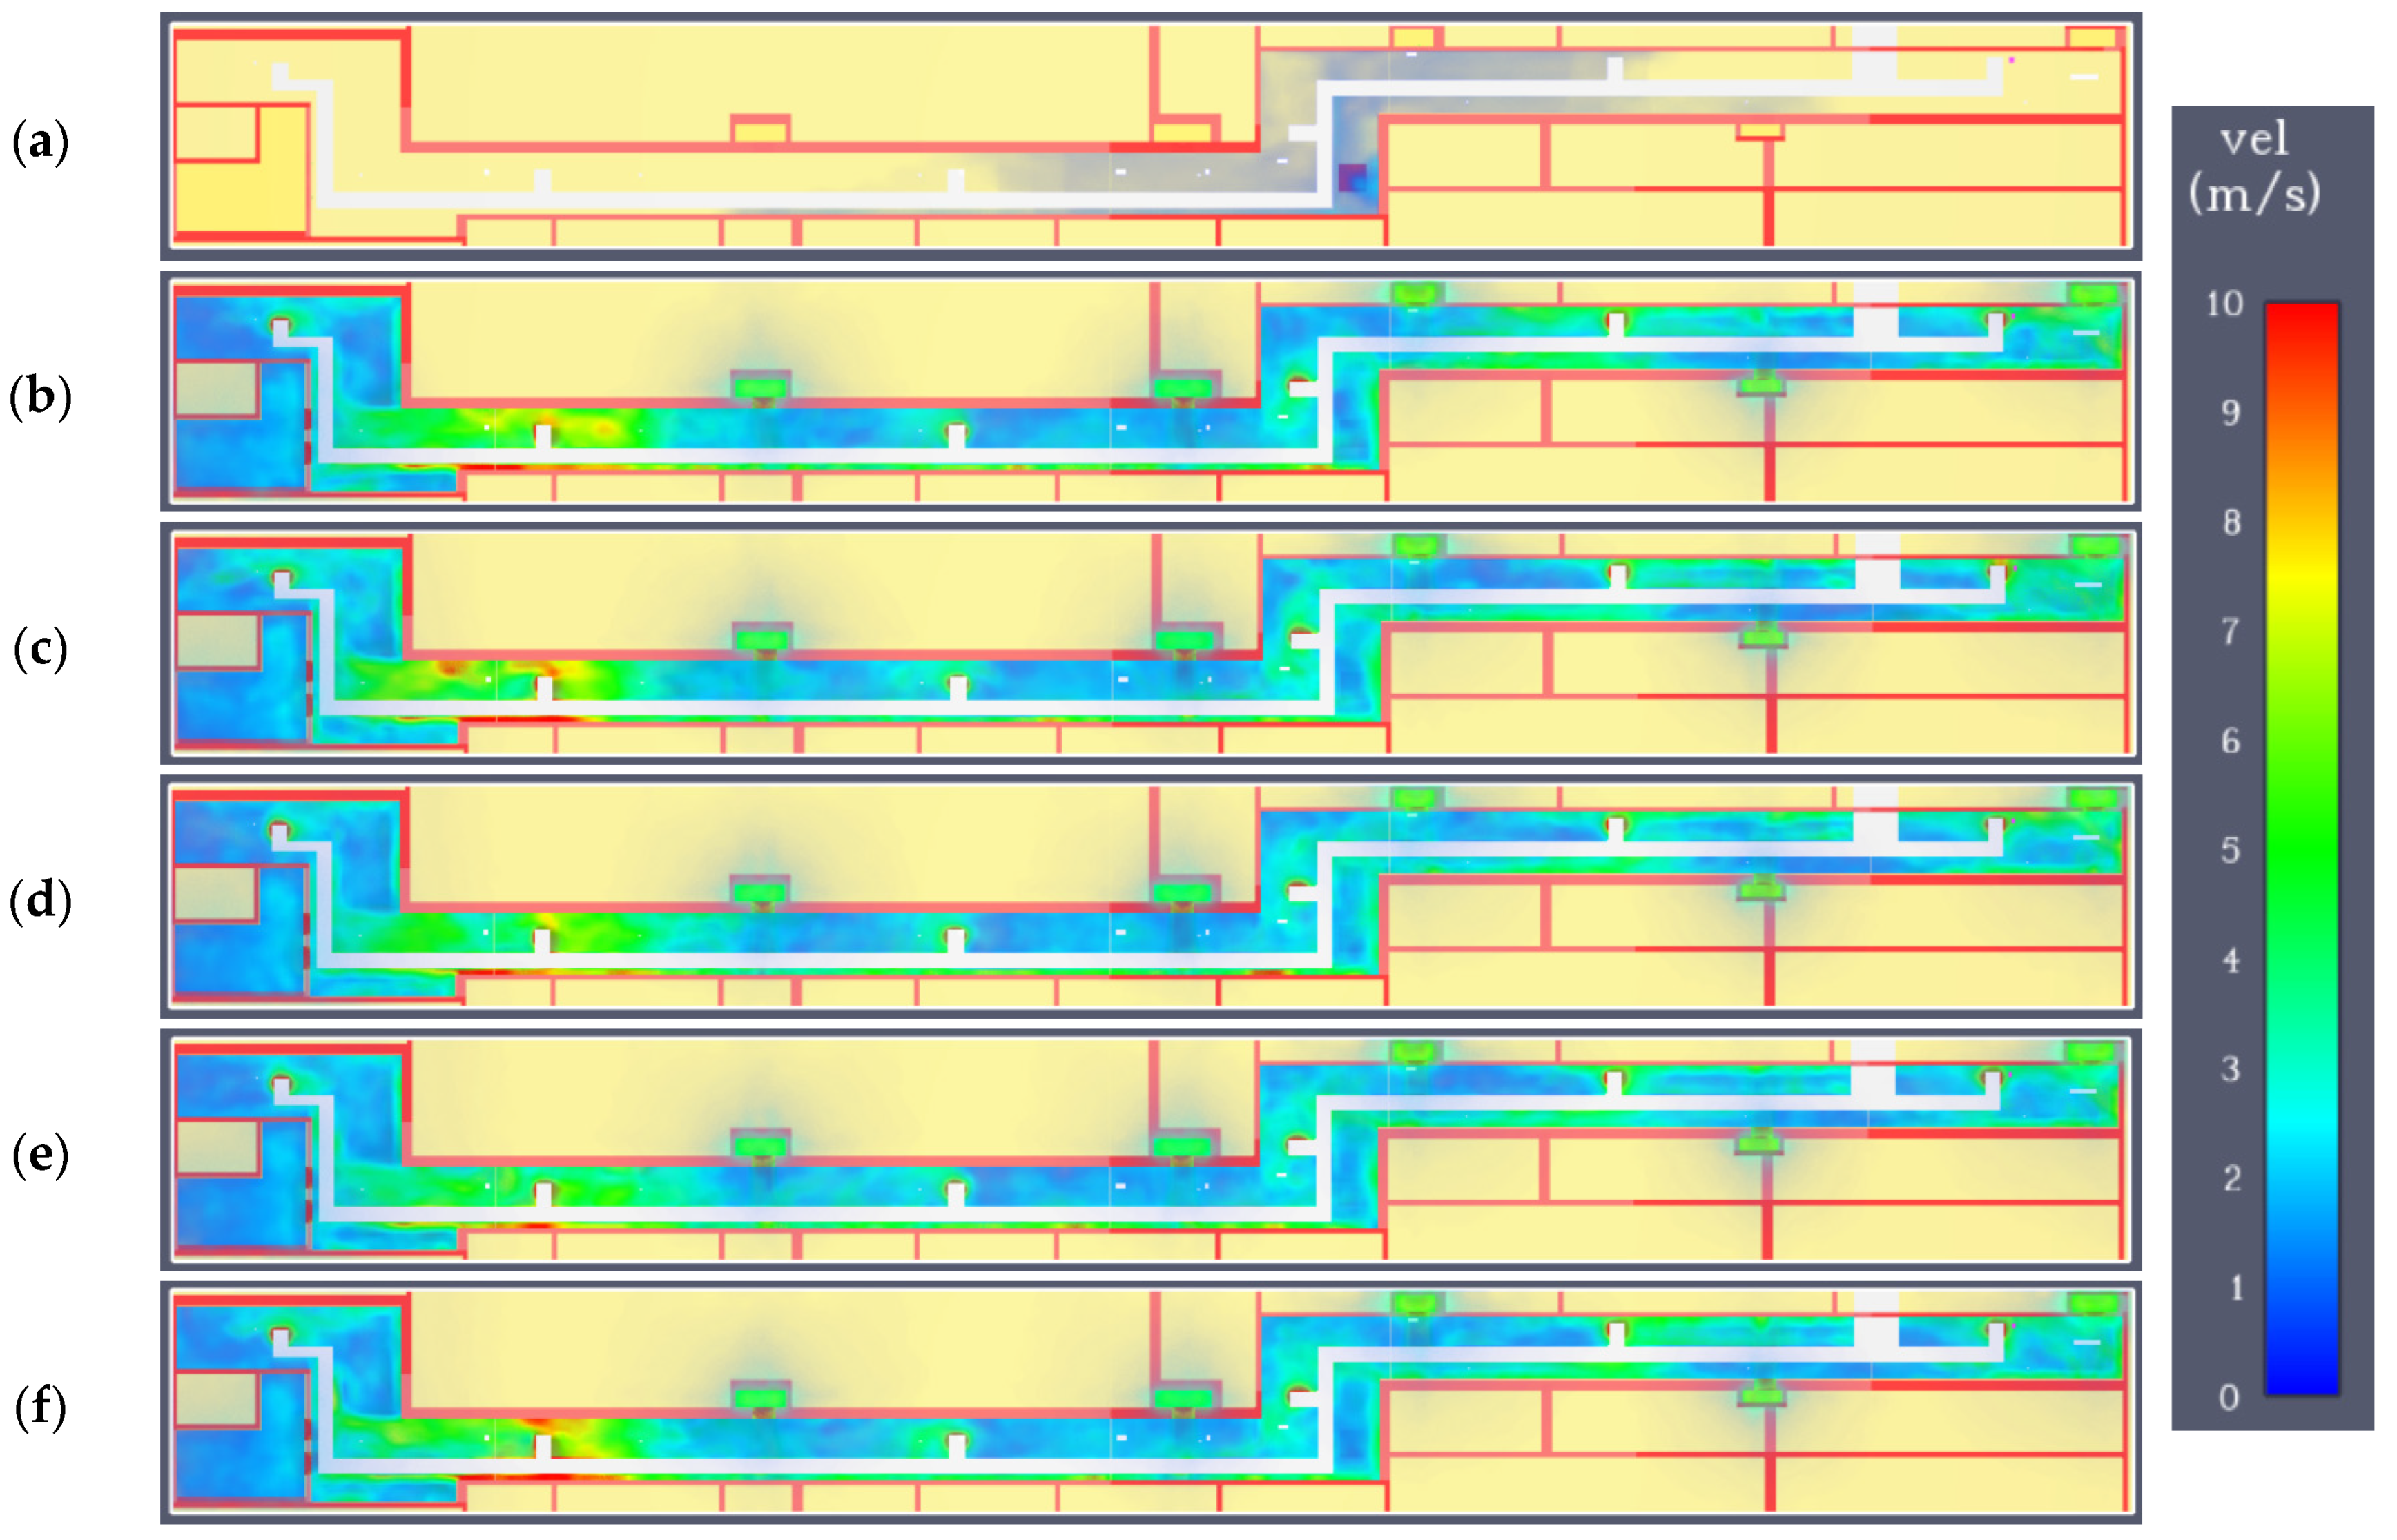
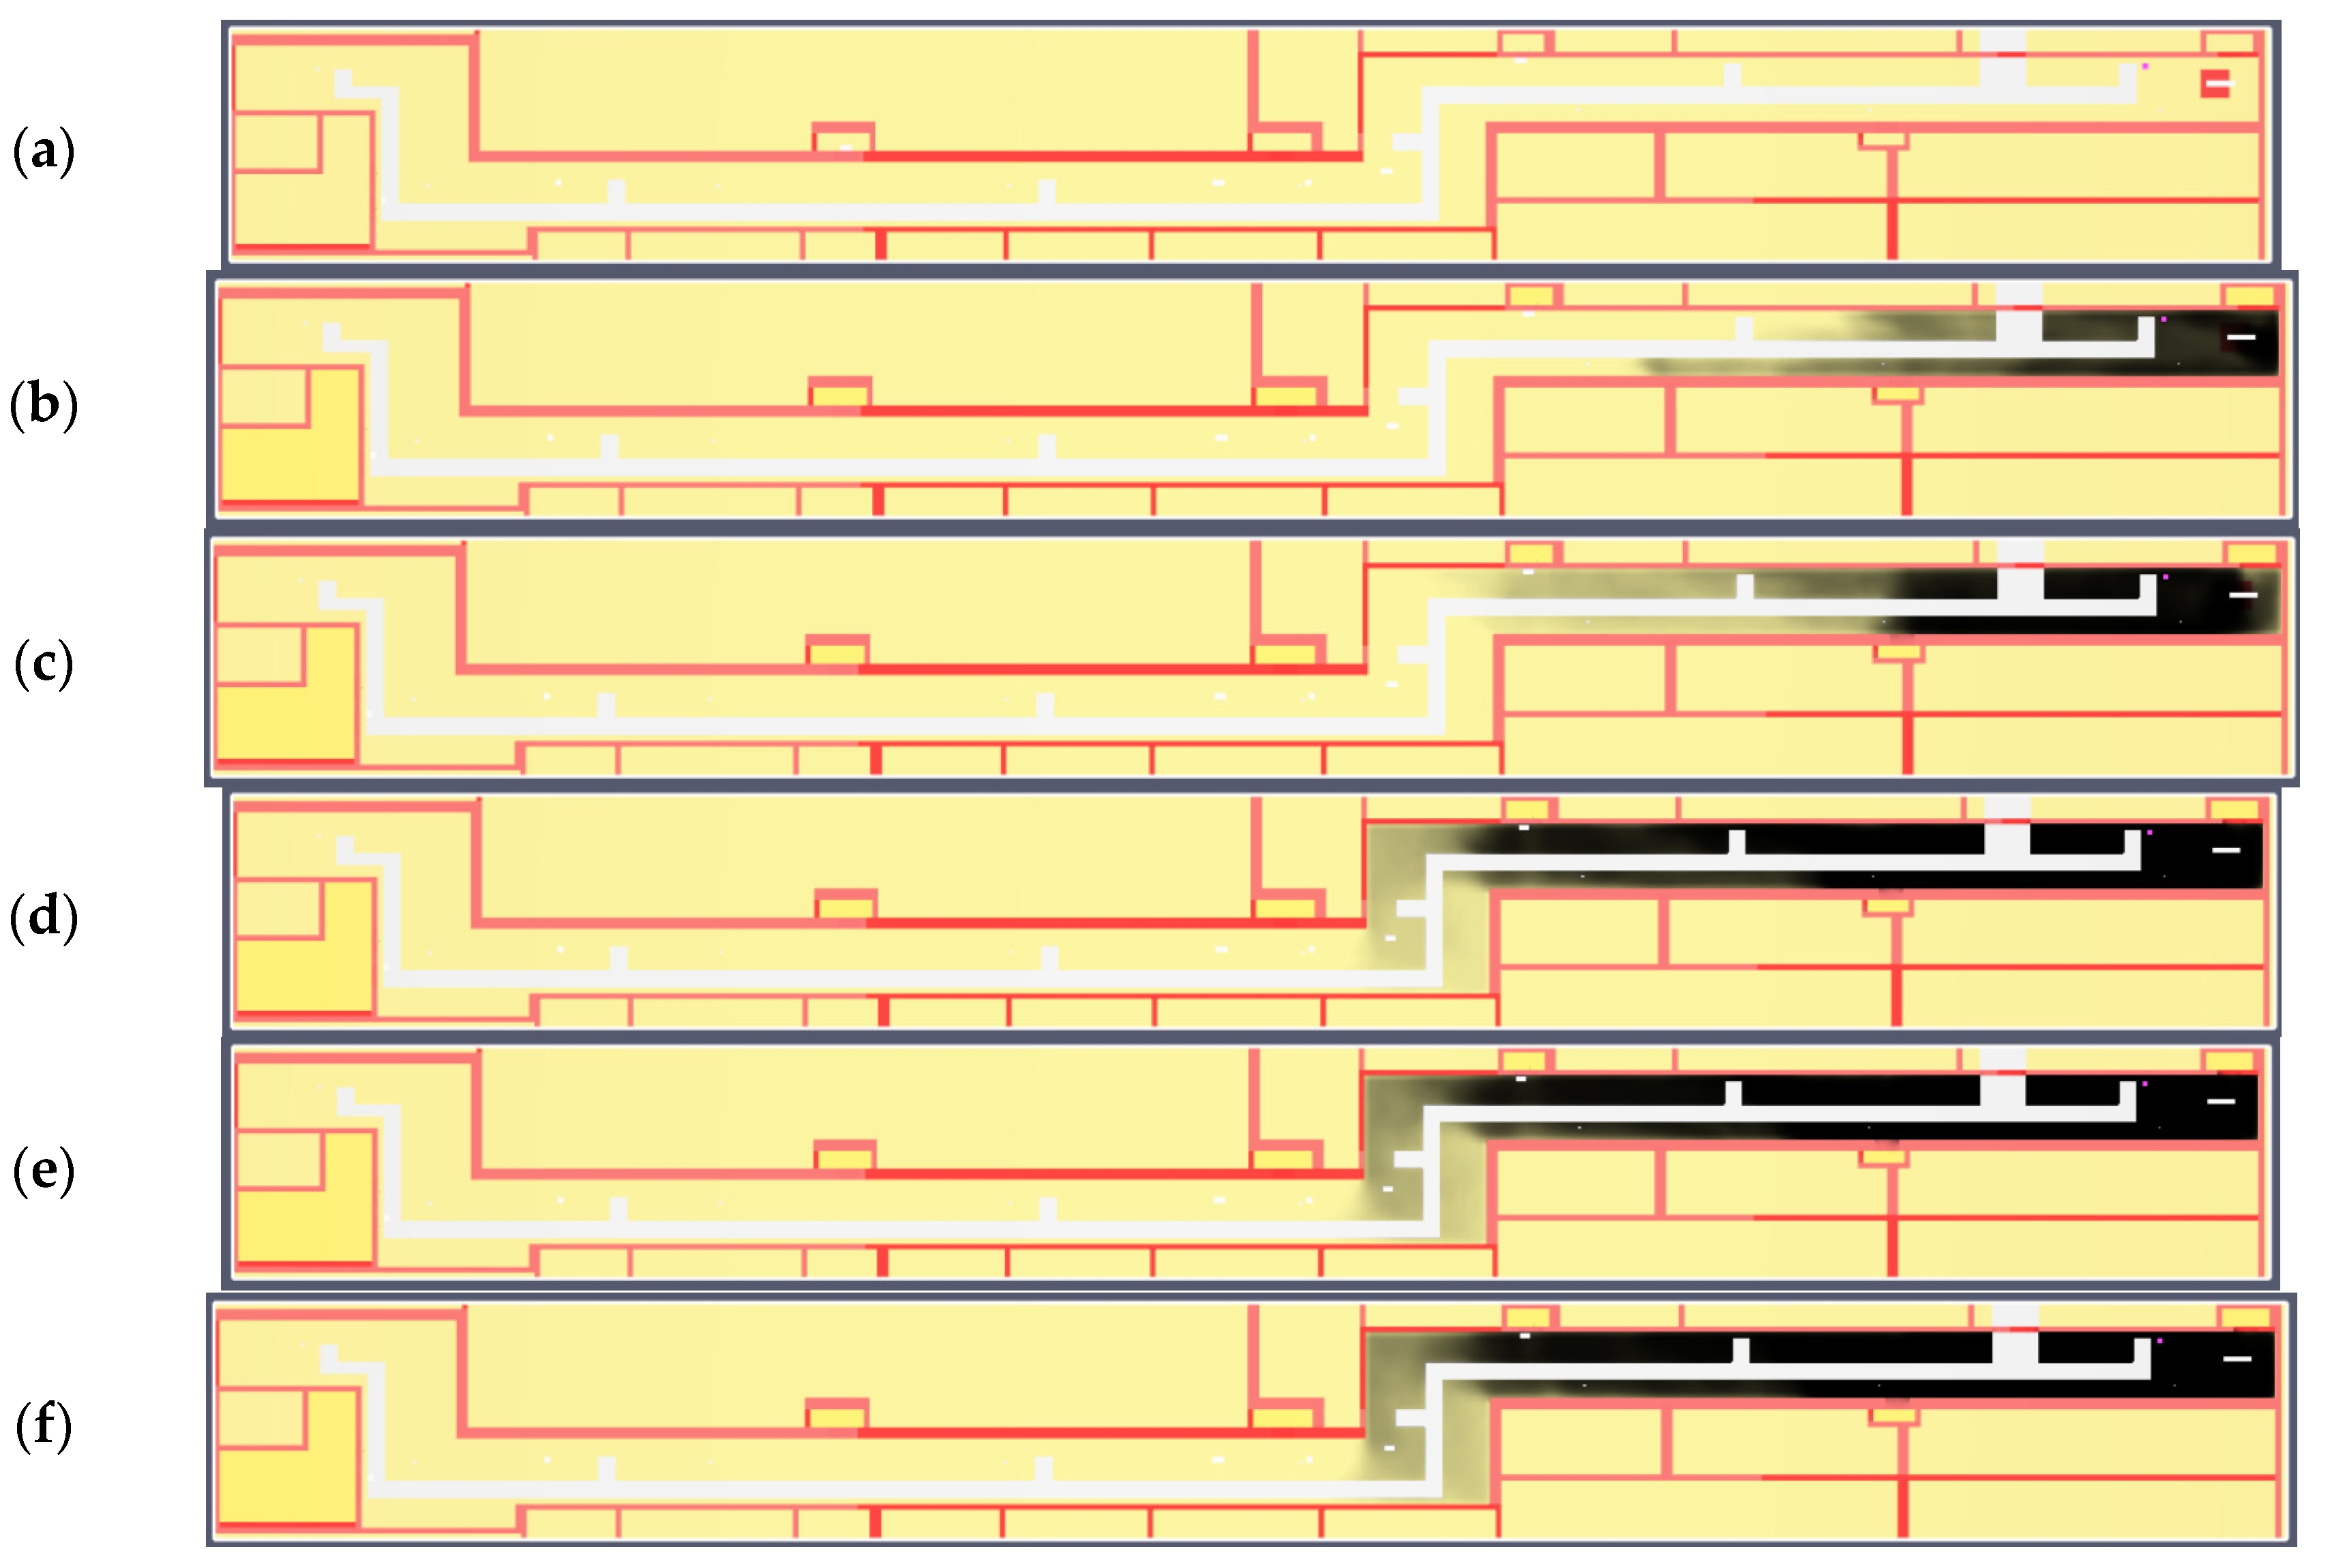
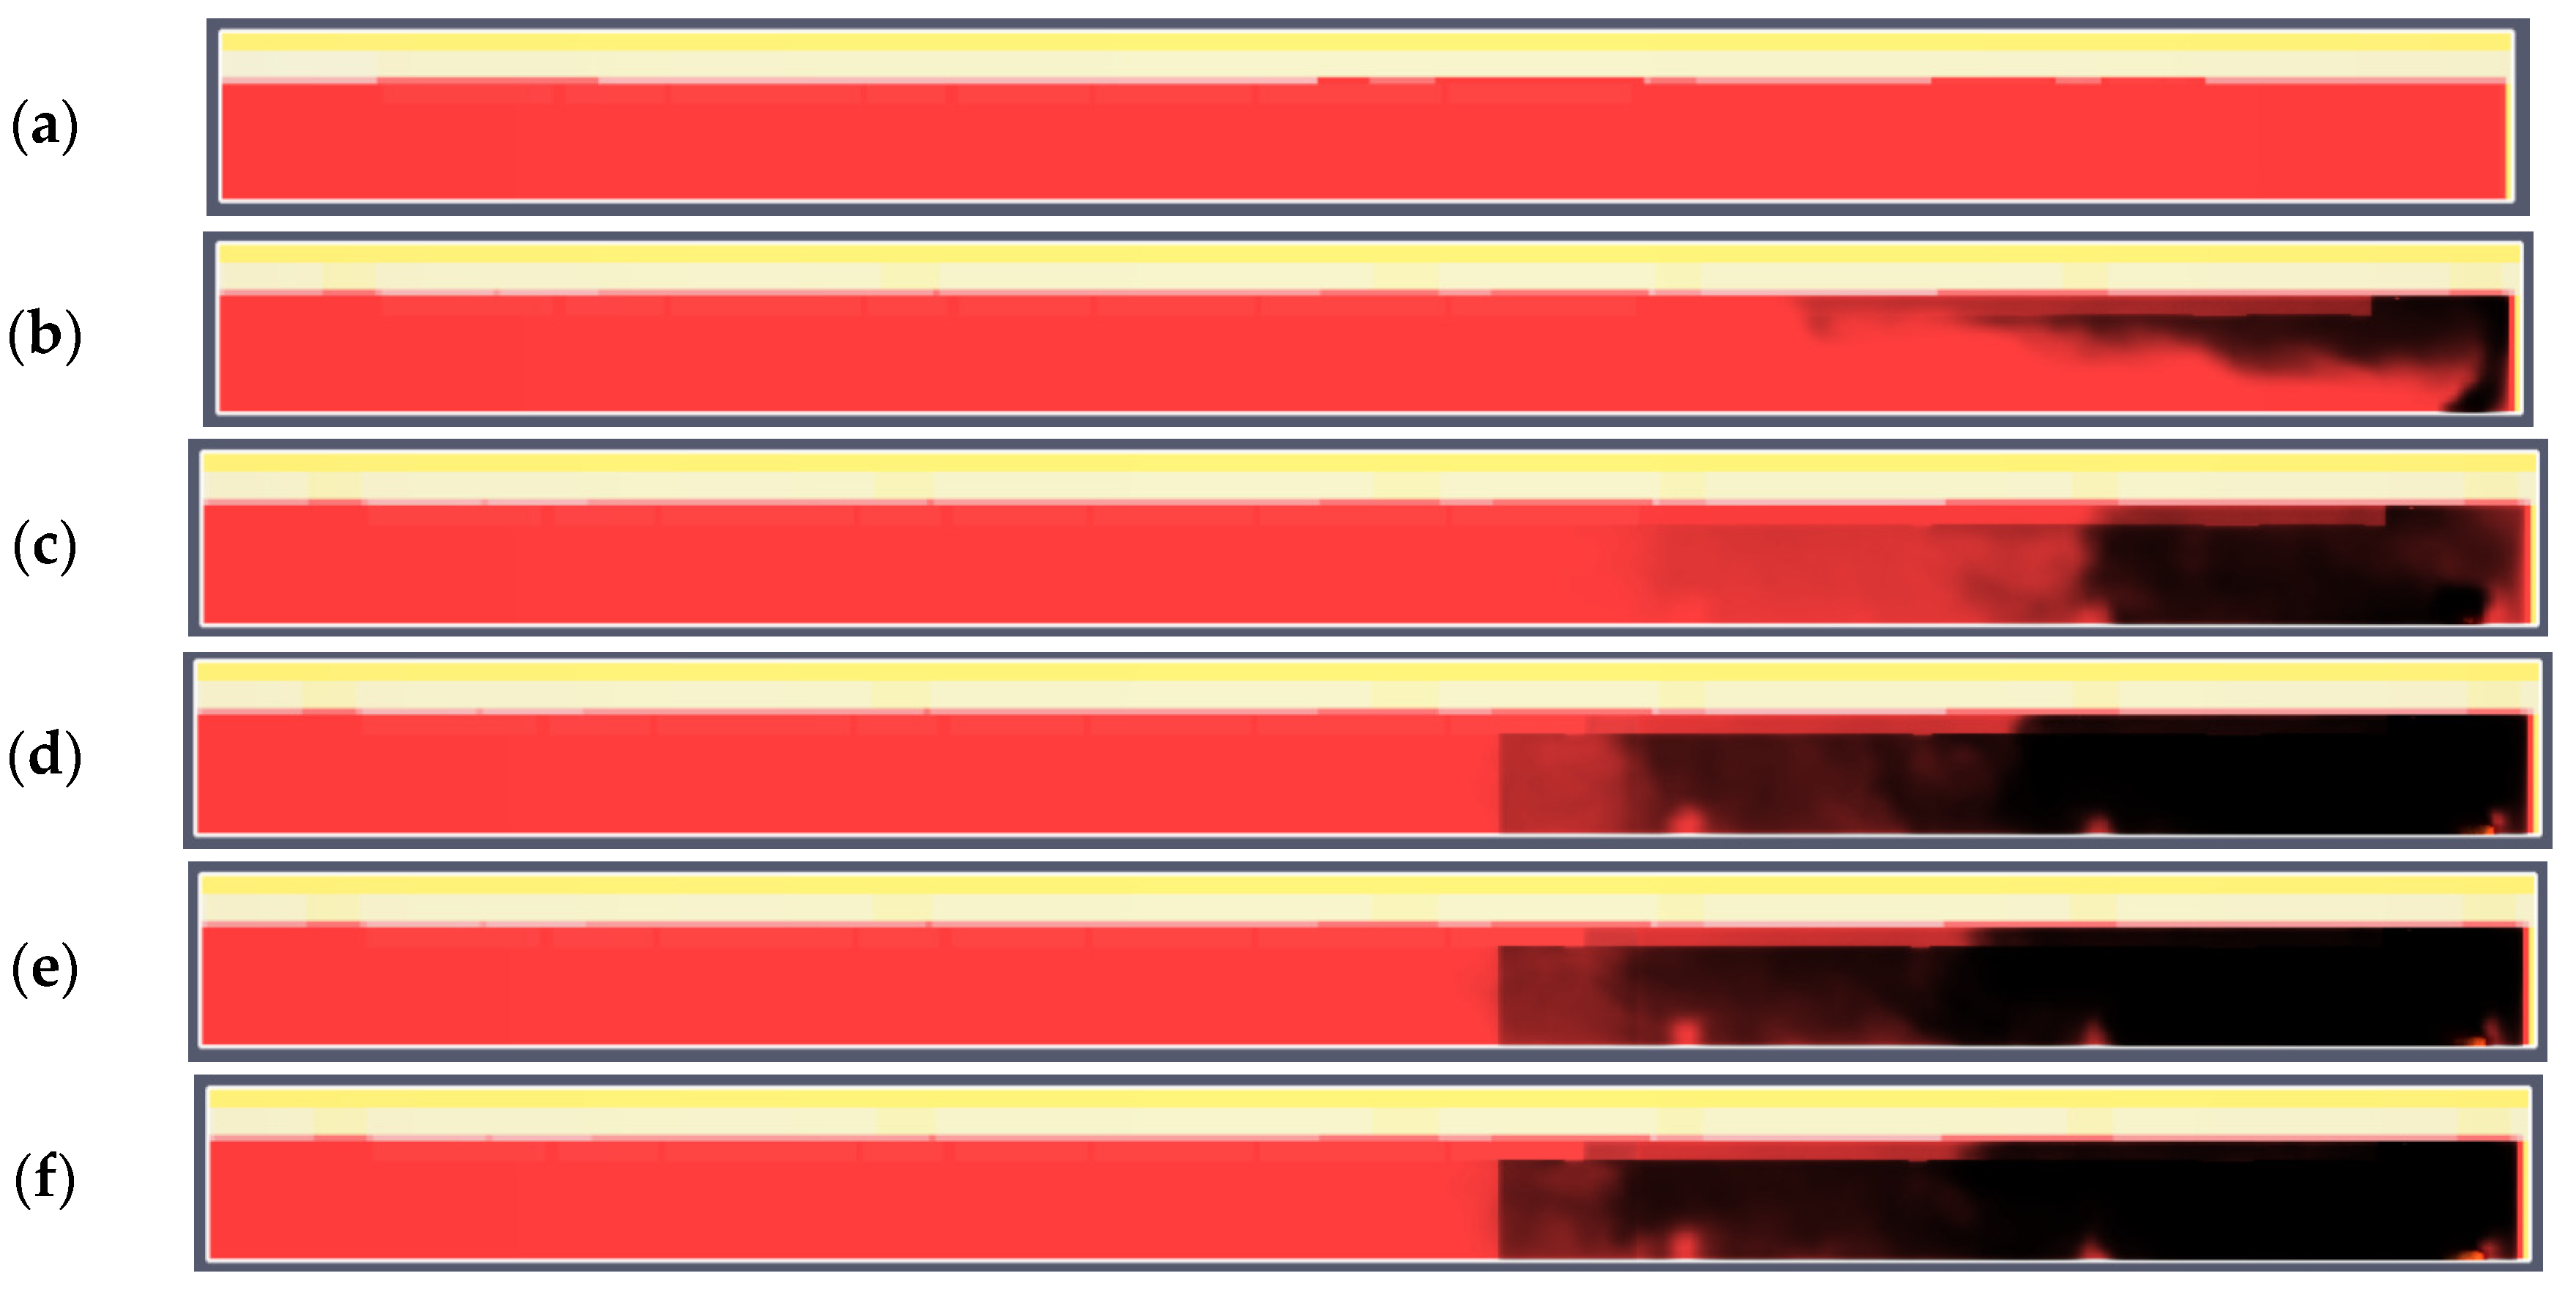
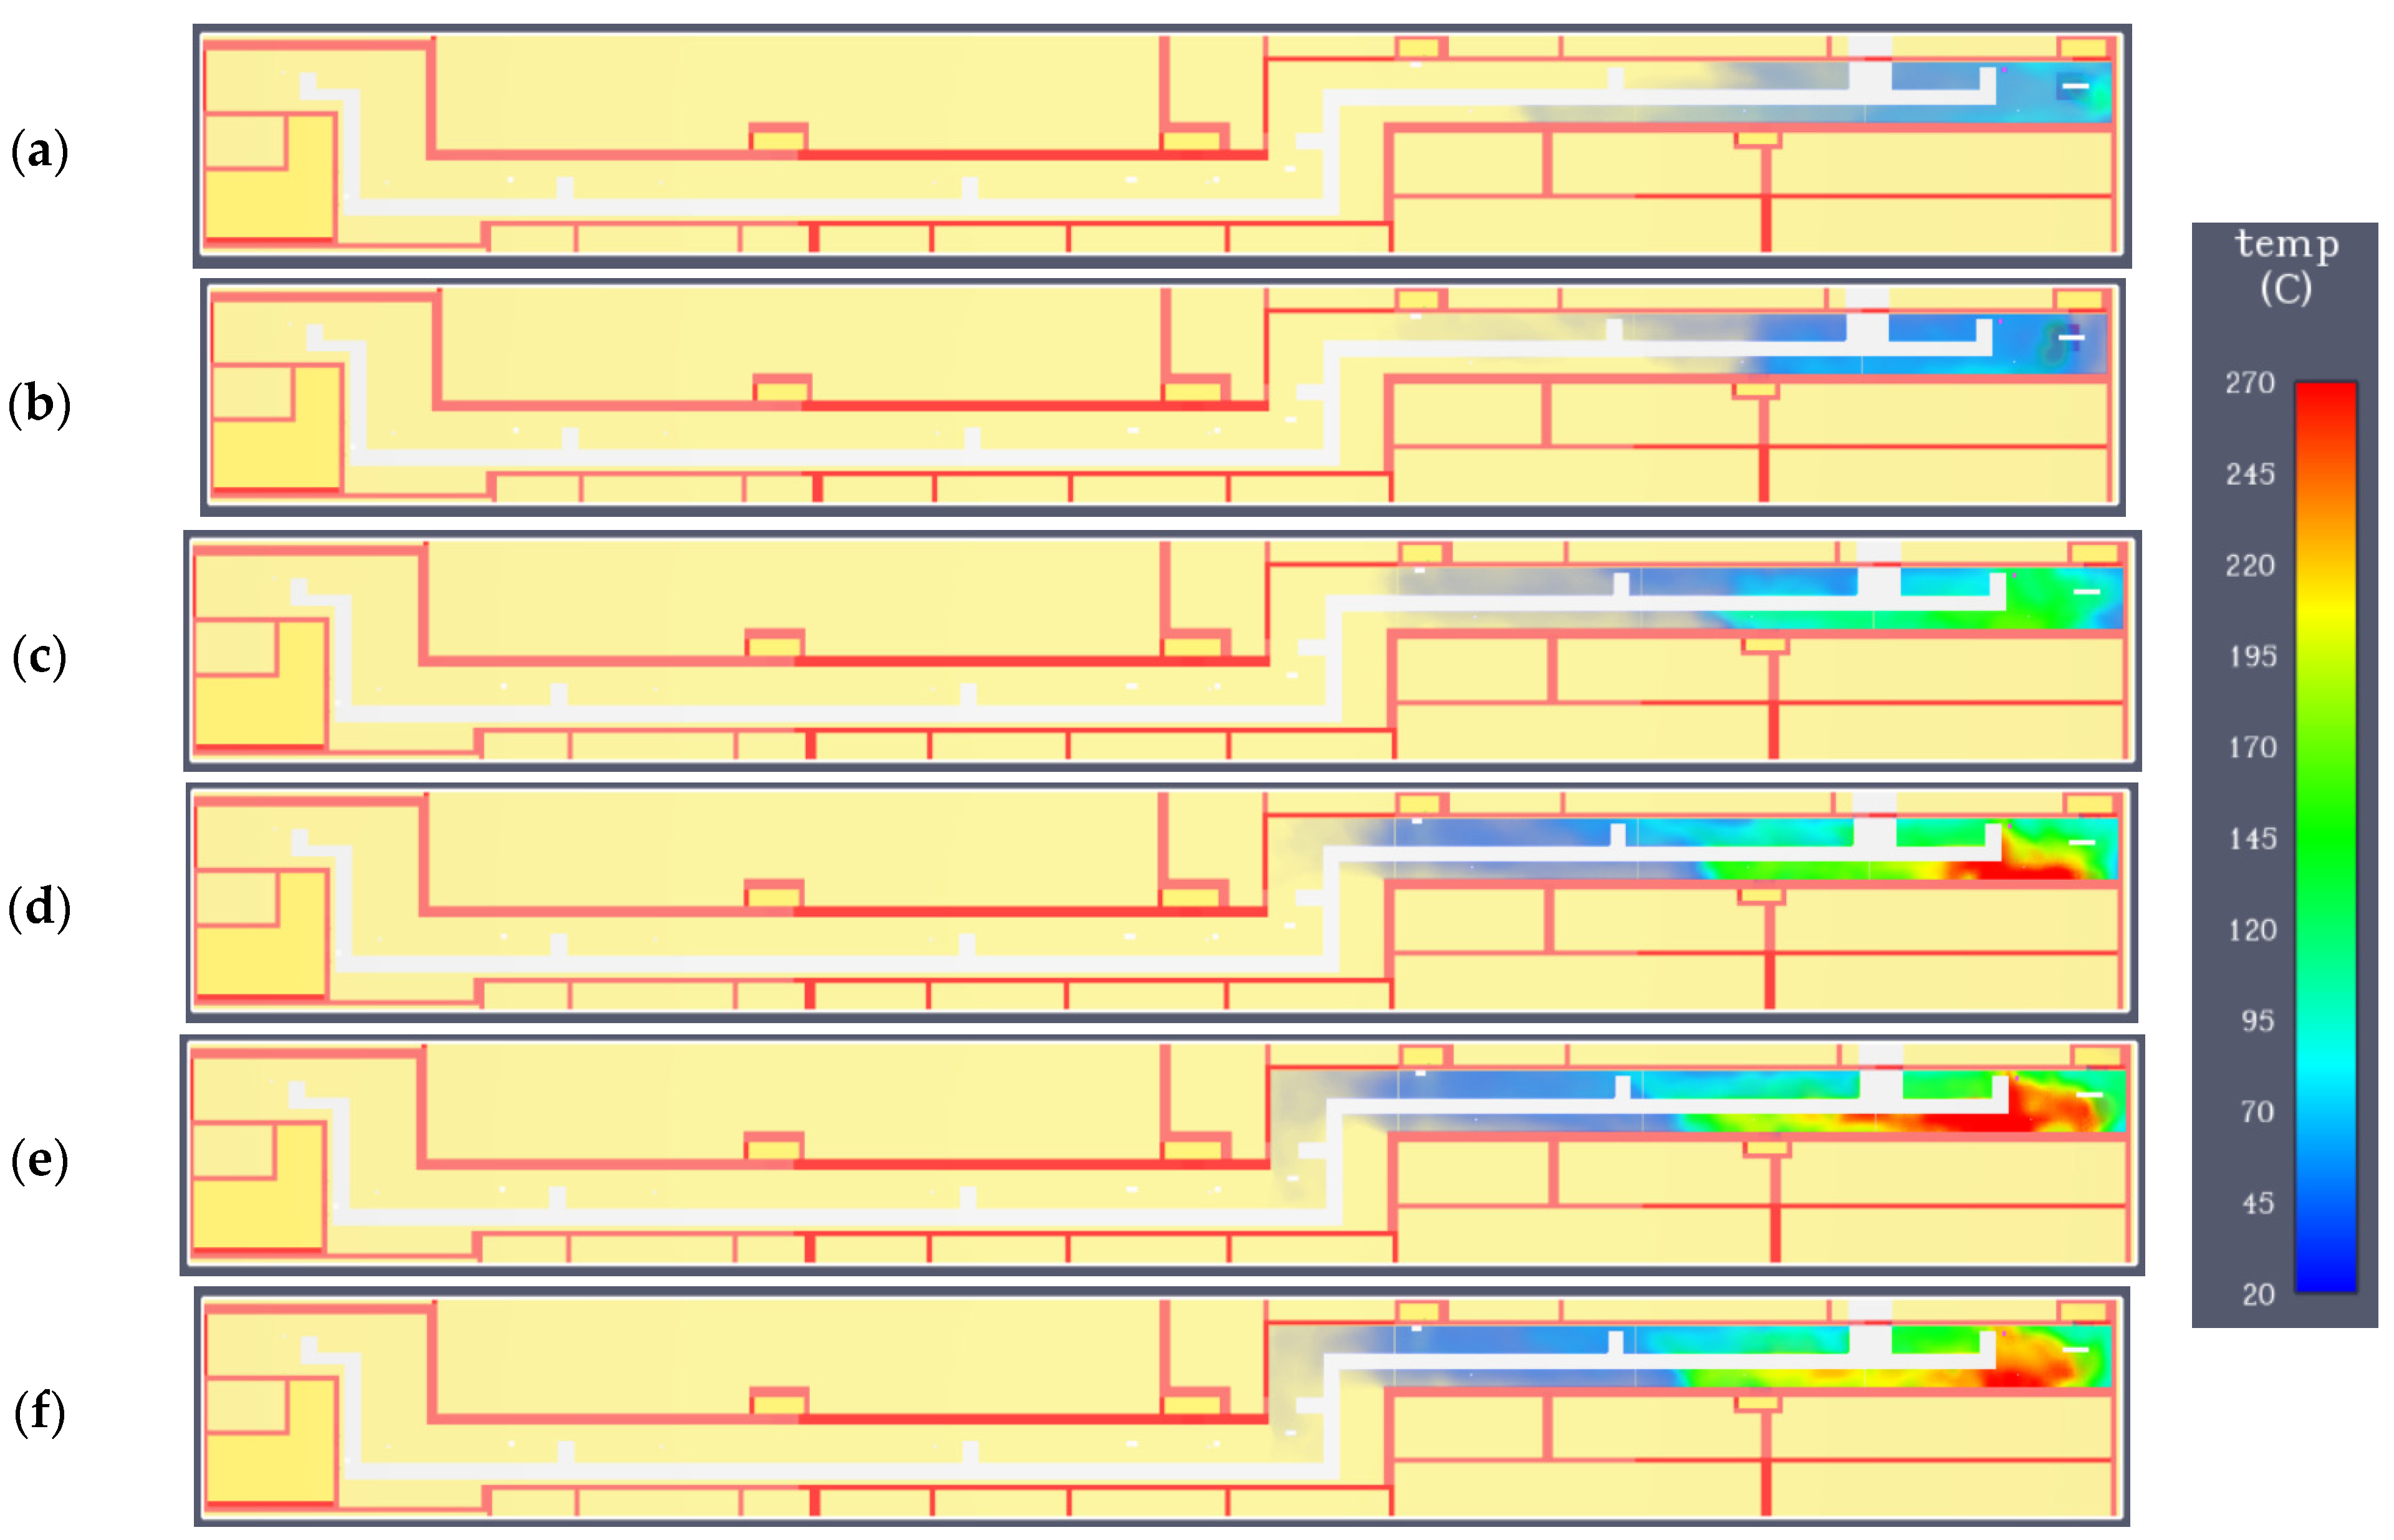
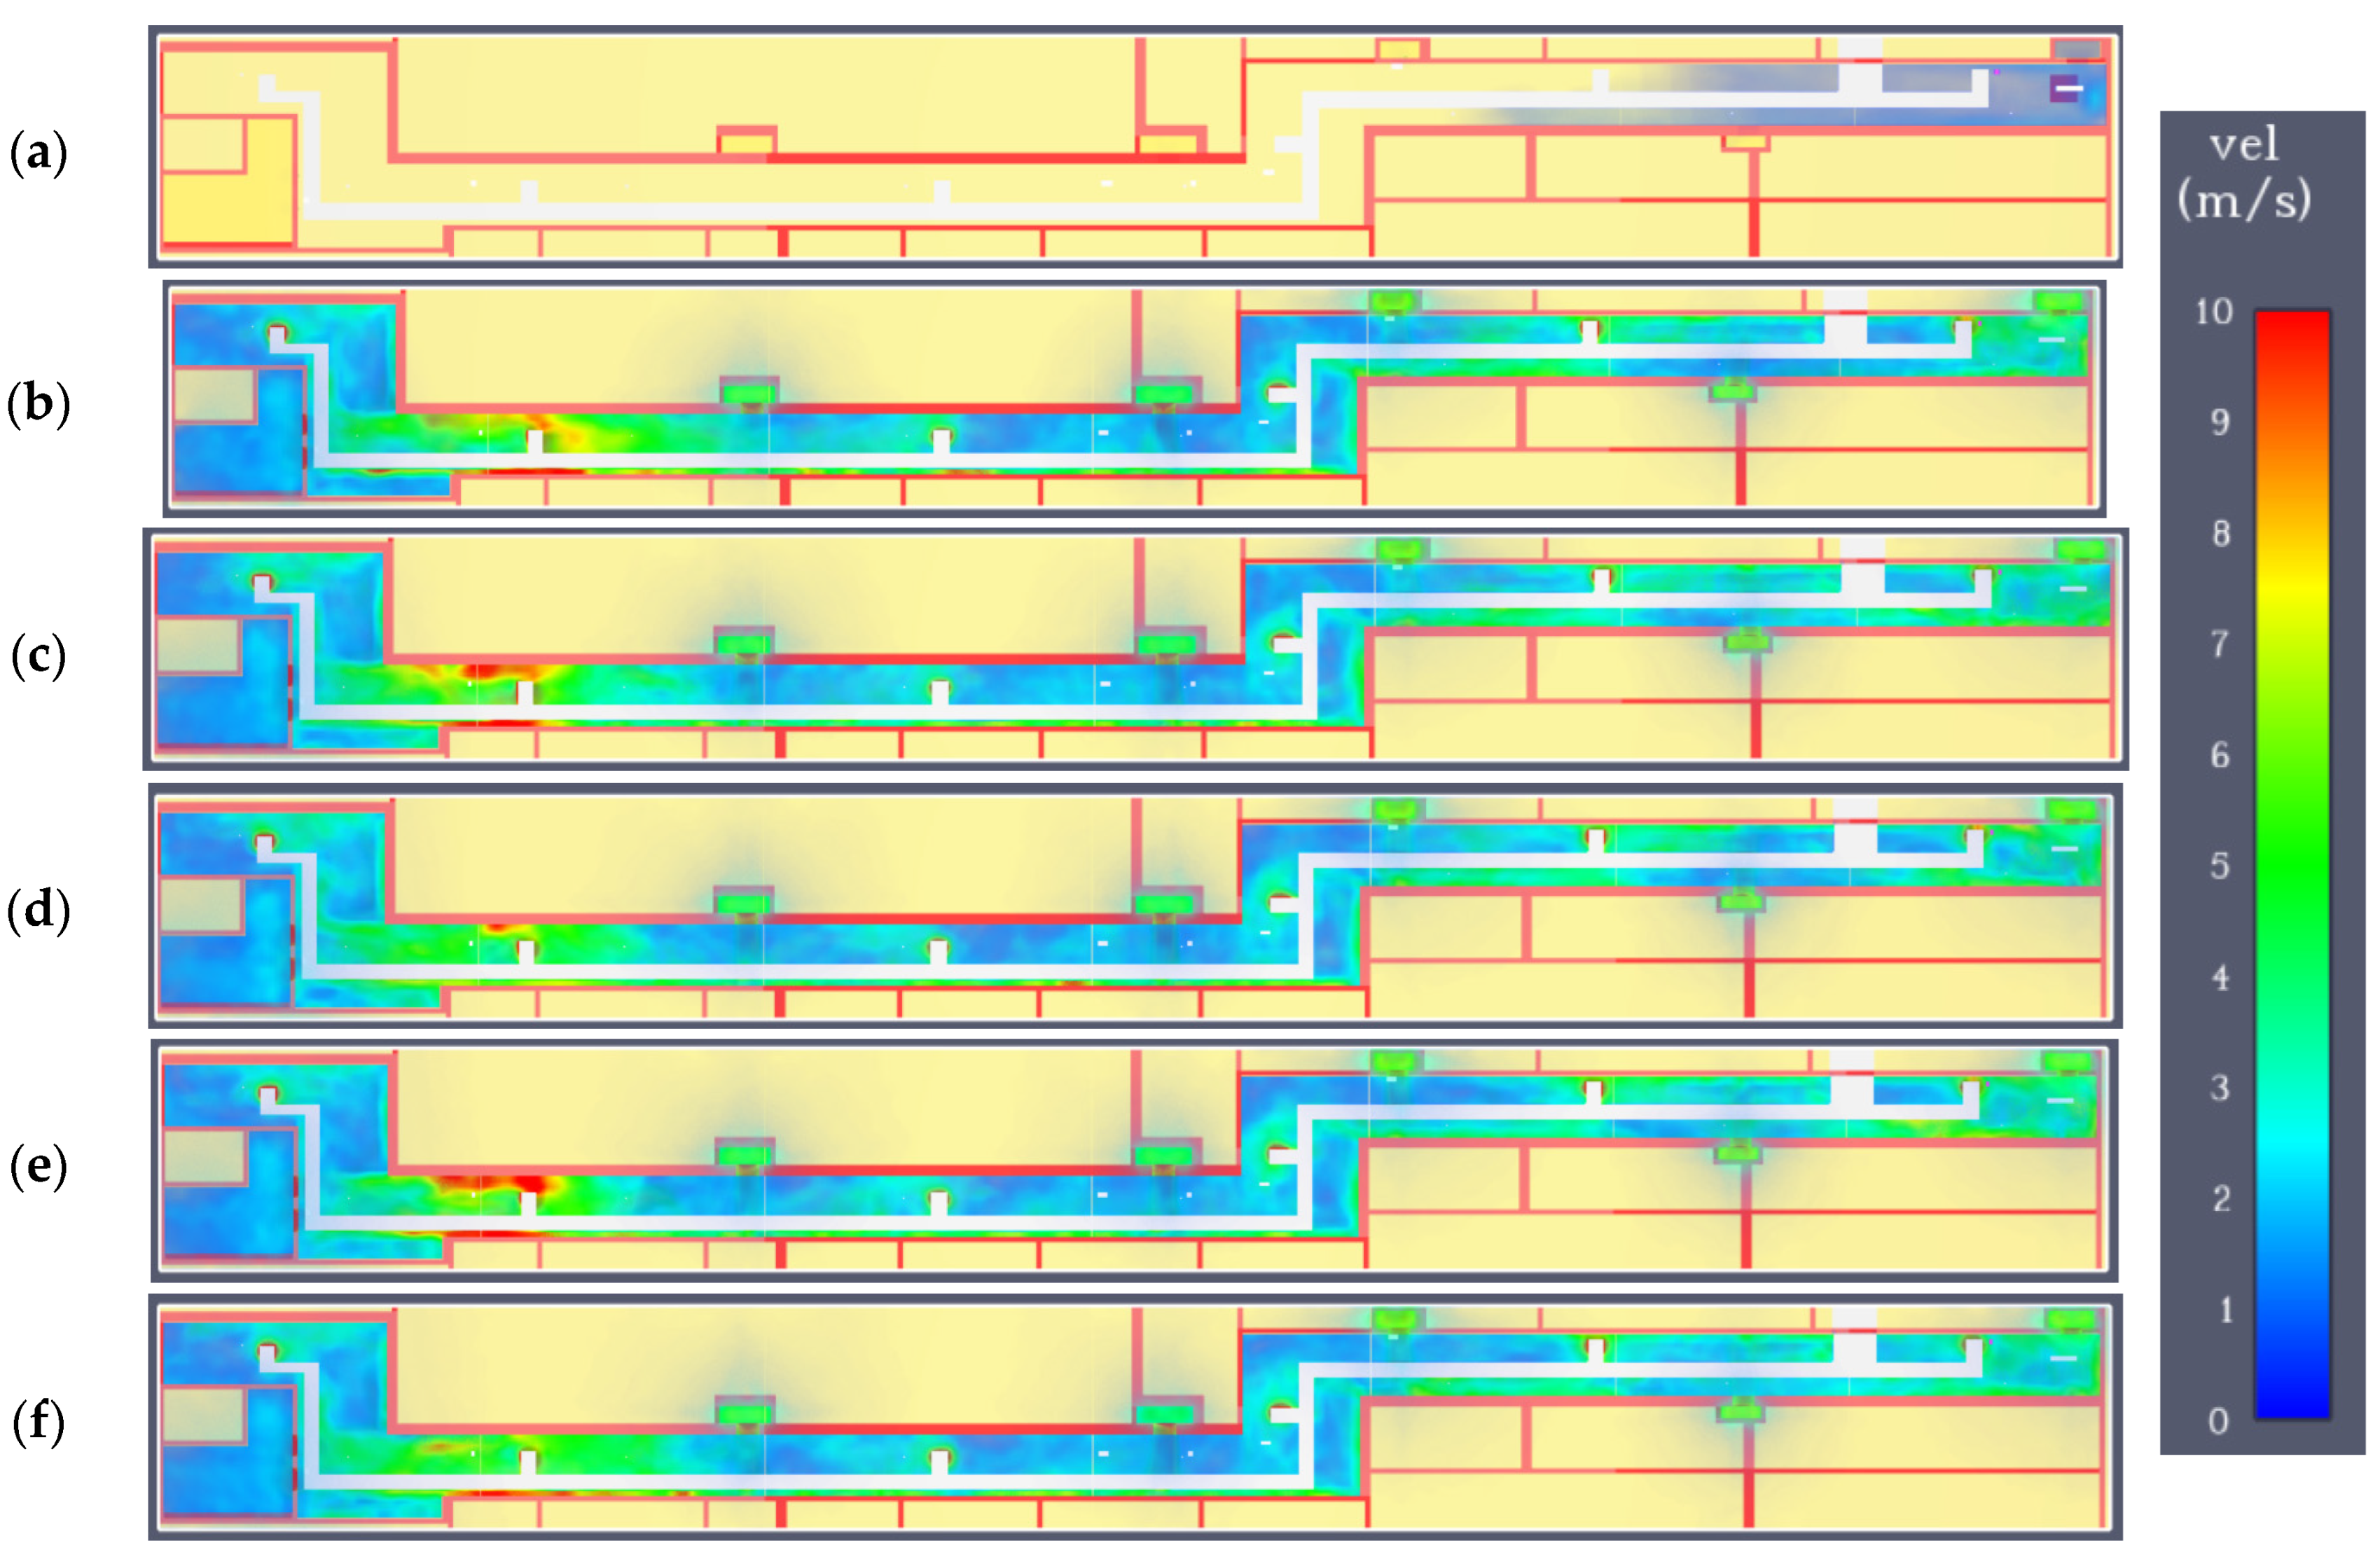
| A | Present in zones: I, II, III, IV, V (Figure 2d and Figure 3d) | Zone I: 170 °C; Zones II, III, IV, V, VI: 20–70 °C (Figure 4d) | Zone I: partially up to 3 m/s; Zones: II, III, IV, V: 0.6–1.8 m/s; Zone VI: below 0.8 m/s (Figure 5d) | Due to the presence of smoke, evacuation is impossible in an upright position |
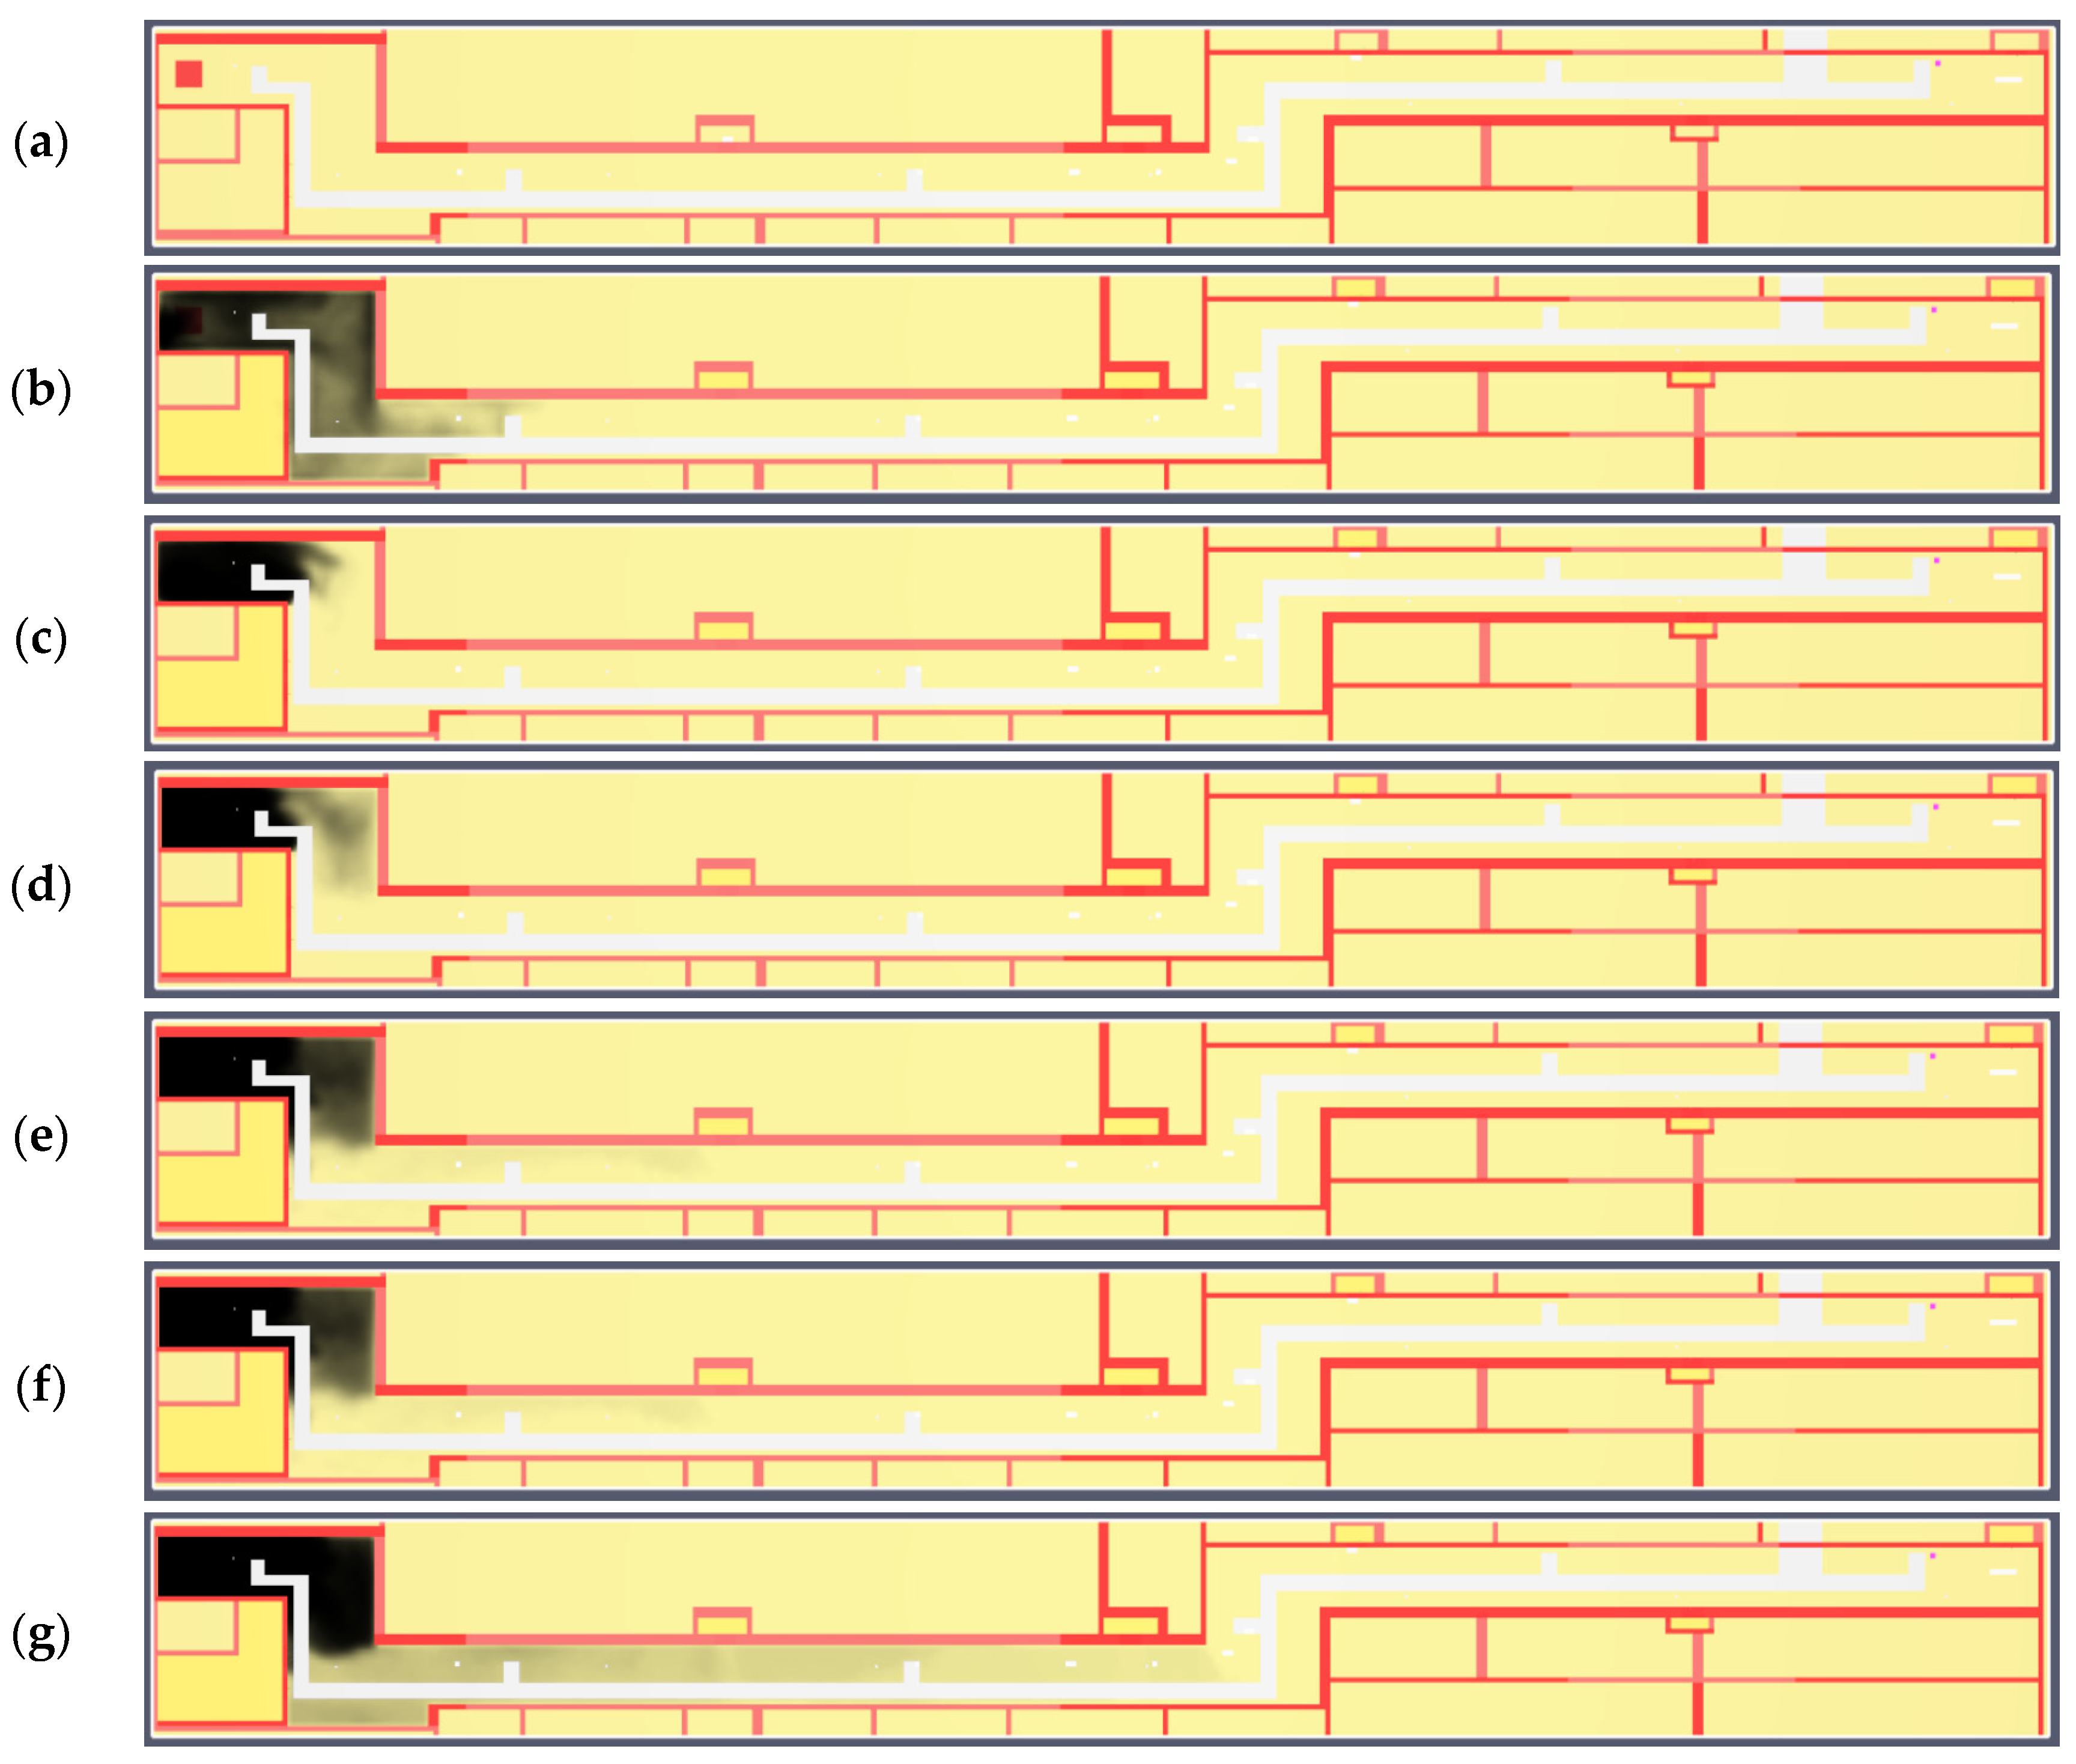
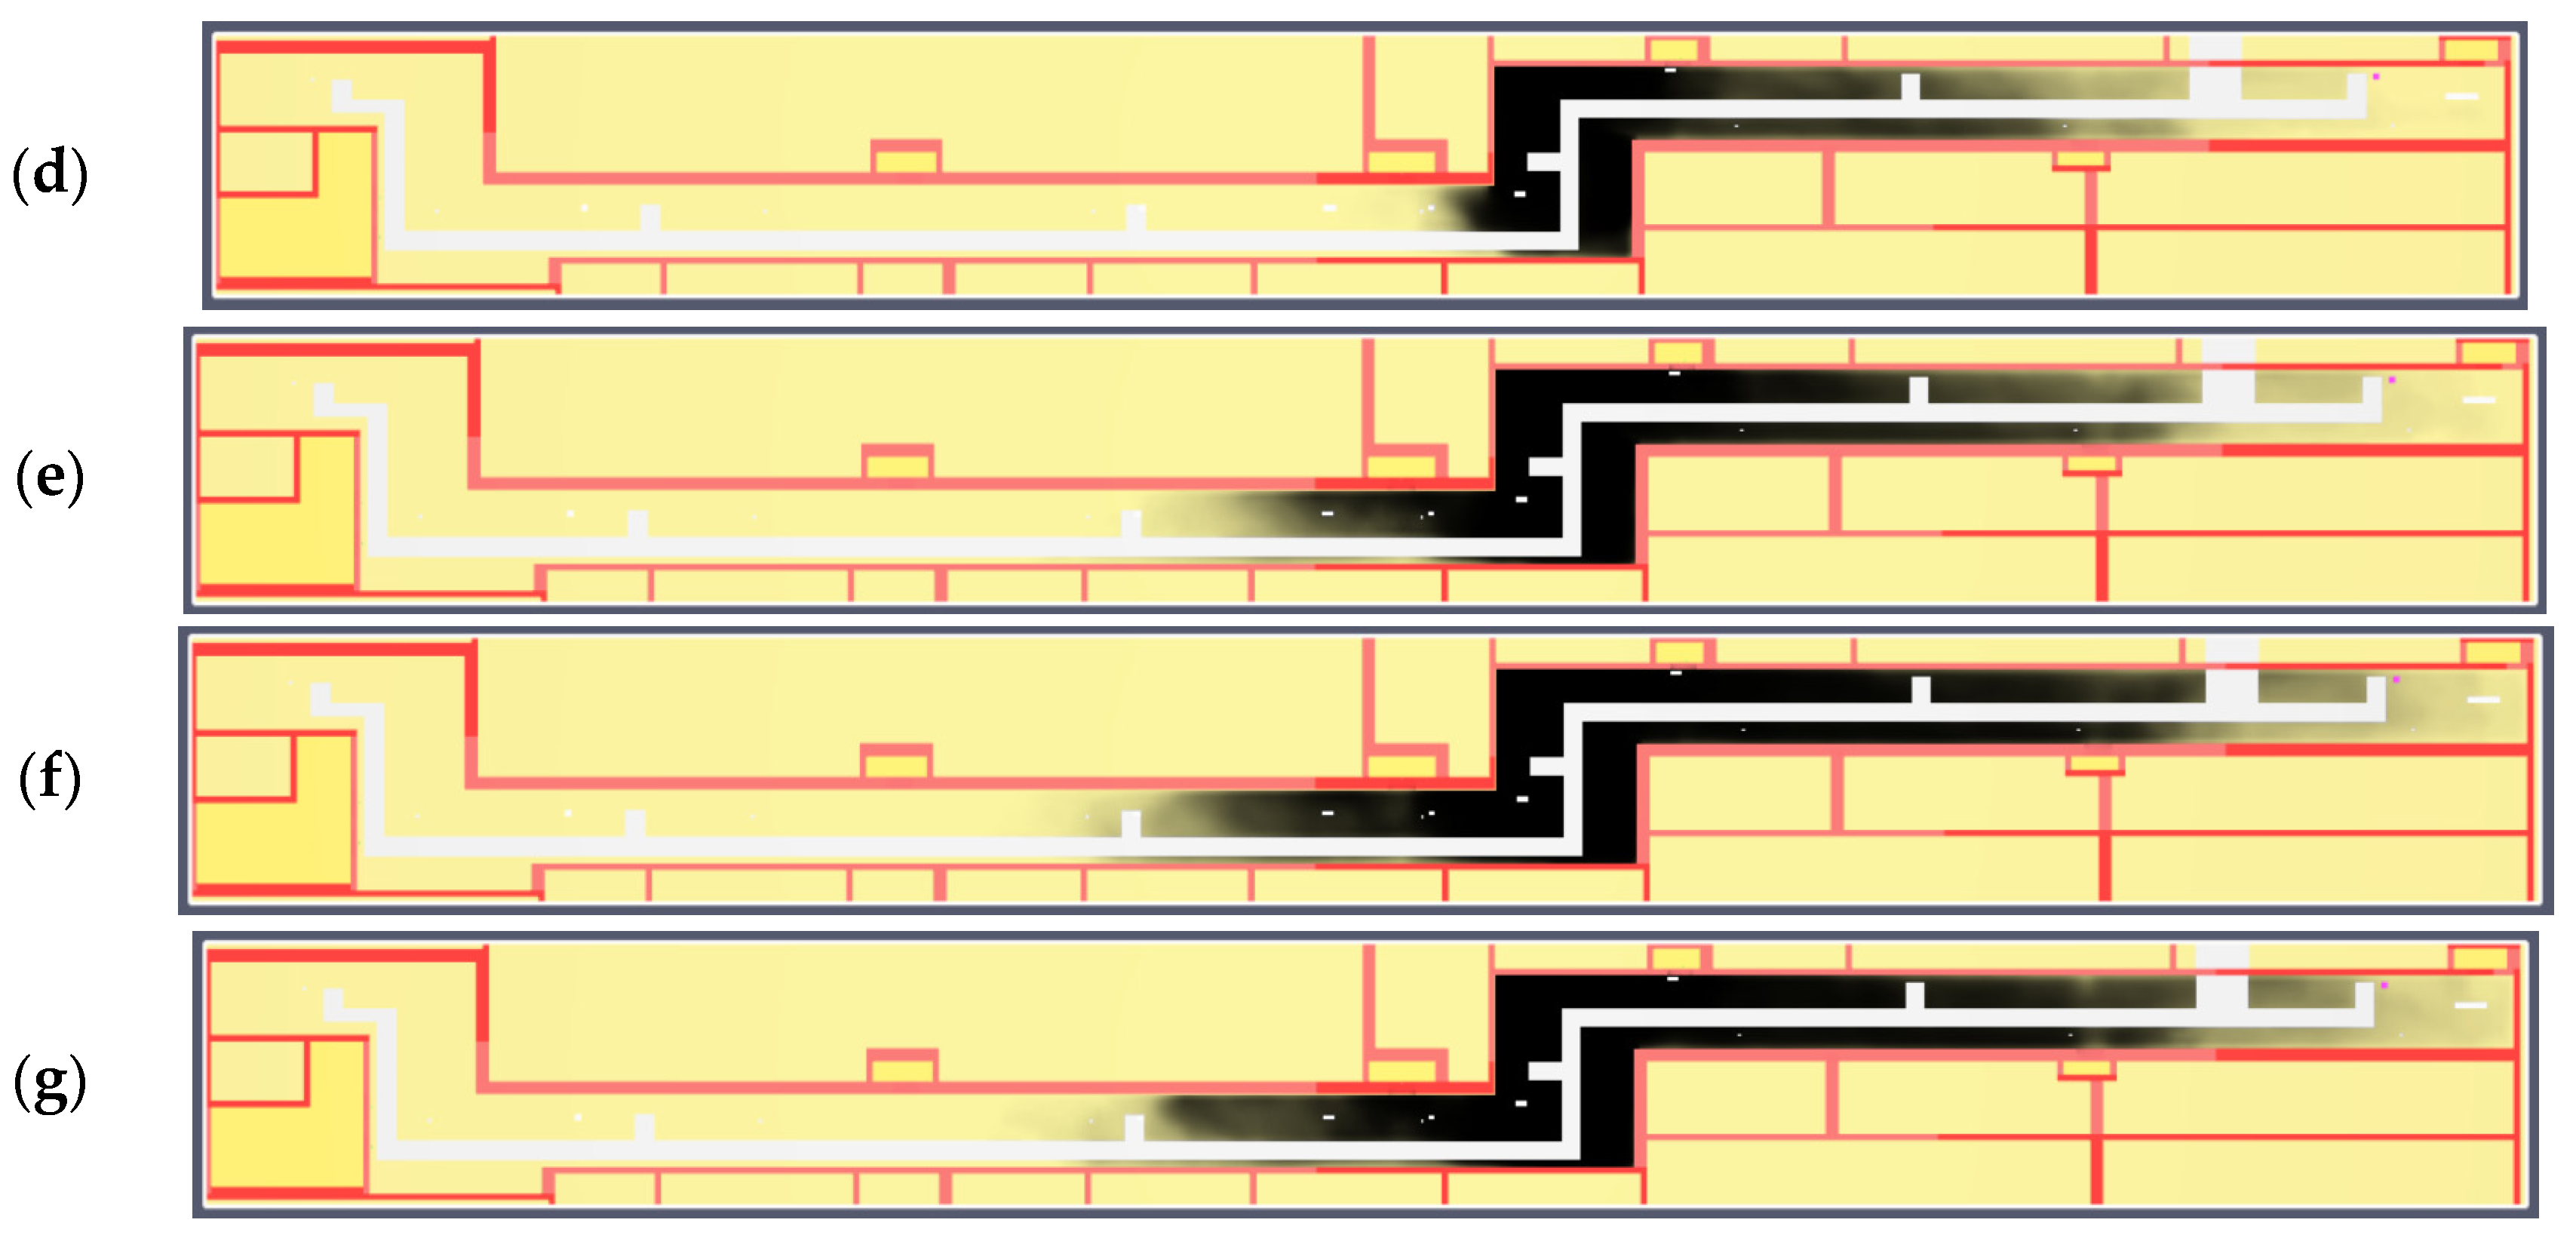
| B | Present in zone I, and partially in zone II (Figure 6d and Figure 7d) | Zone I: up to 155 °C; Zones II, III, IV, V, VI: no increase over operating temperature (Figure 8c) | Maximum speed 9 m/s at a height of 1.8 m at the exhaust grille in zone II; in other zones below 5–6 m/s (Figure 9c) | Except fire zone I, evacuation possible; Presence of smoke in zone II does not impede evacuation |
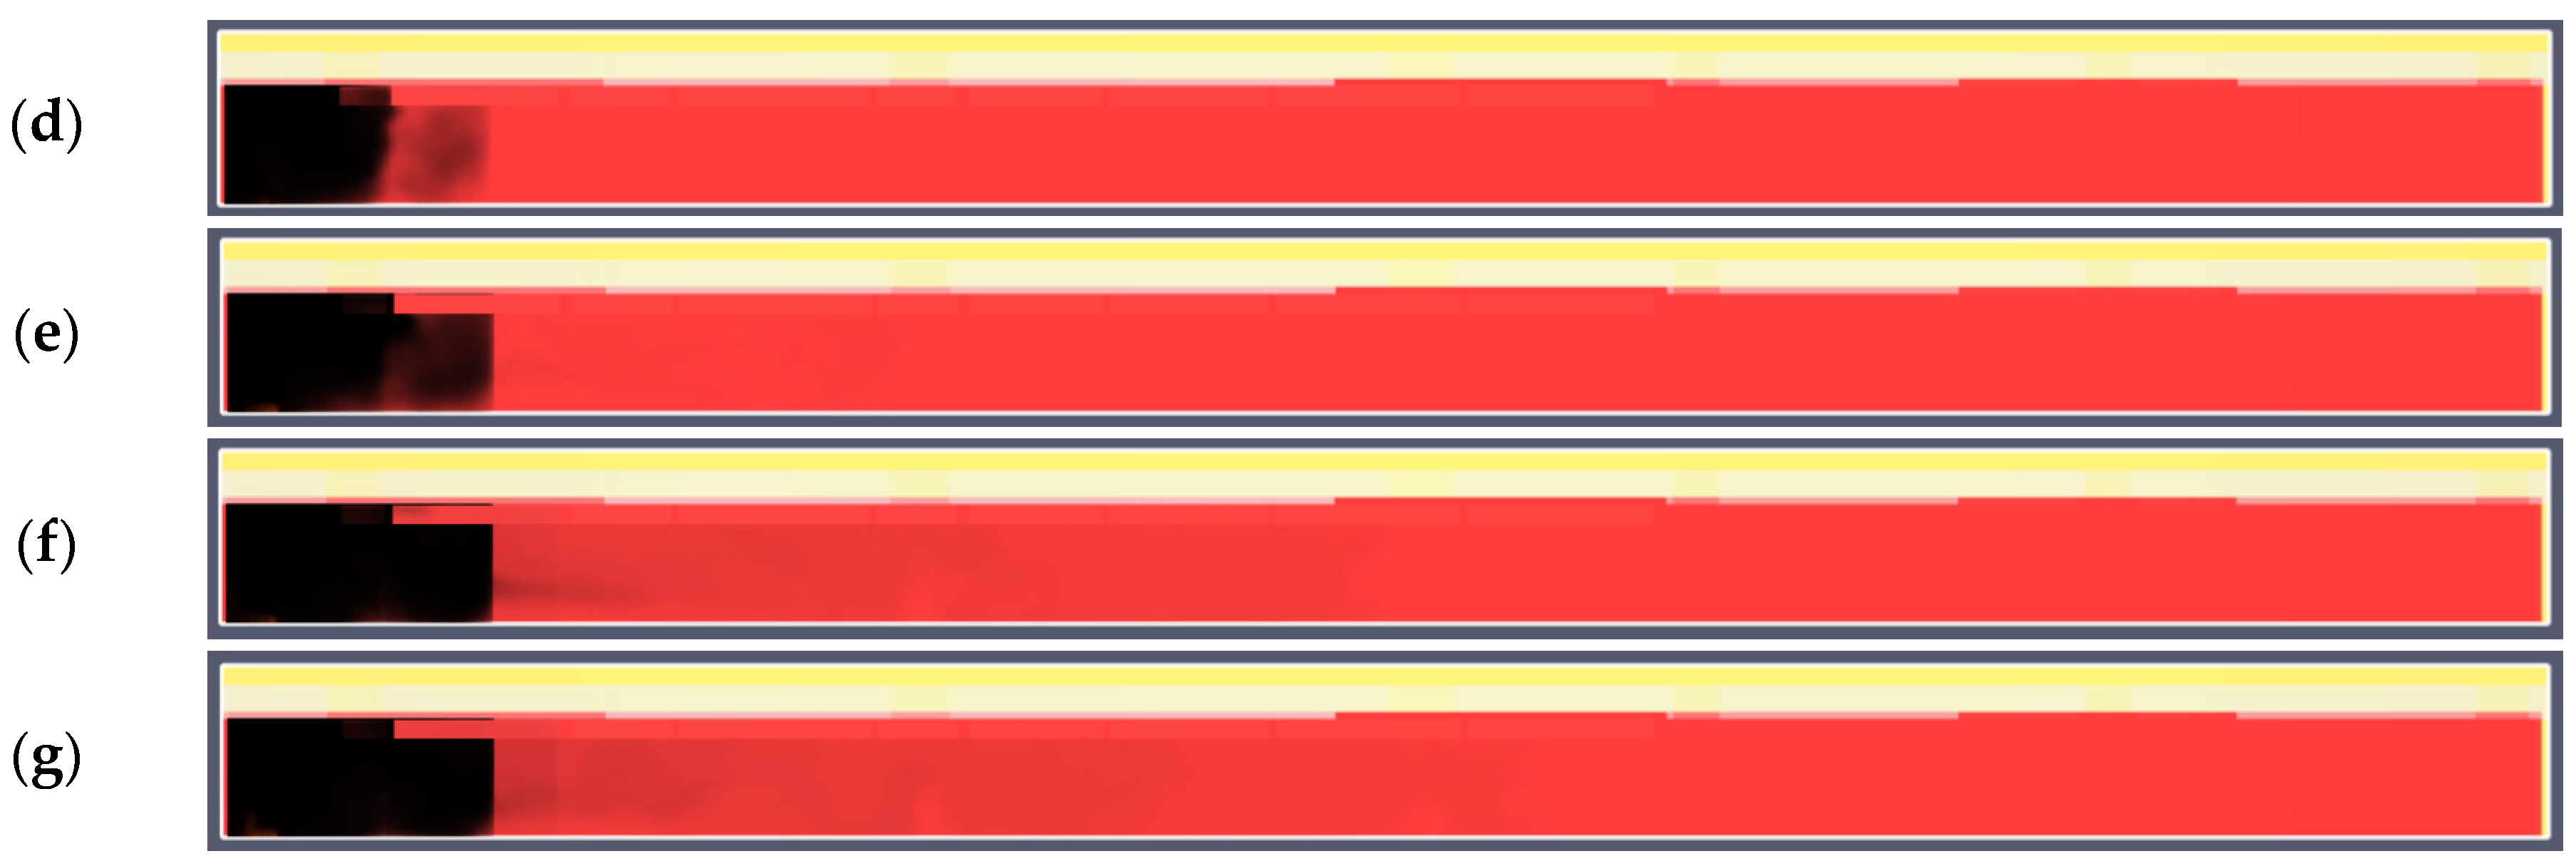
| C | Present in zone IV and V (Figure 10d and Figure 11d) | Zone IV: up to 100 °C; Zone V: below 55 °C; Other zones: below scale, i.e., below 20 °C (Figure 12c) | Maximum speed 10 m/s at a height of 1.8 m at the exhaust grille in zone II; In other zones below 5–6 m/s (Figure 13c) | Except fire zone IV, evacuation possible; Presence of smoke in zone V does not impede evacuation |
| D | Present in zones V, VI, and partially in IV (Figure 14d and Figure 15d) | Zone IV: below 80 °C; Zone V: below 50 °C; Other zones: below scale, i.e., below 20 °C (Figure 16c) | Maximum speed 10 m/s at a height of 1.8 m at the exhaust grille in zone II; In other zones below 5–6 m/s (Figure 17c) | Except fire zone VI, evacuation possible; Presence of smoke in zone V makes evacuation difficult |
Disclaimer/Publisher’s Note: The statements, opinions and data contained in all publications are solely those of the individual author(s) and contributor(s) and not of MDPI and/or the editor(s). MDPI and/or the editor(s) disclaim responsibility for any injury to people or property resulting from any ideas, methods, instructions or products referred to in the content. |
© 2023 by the authors. Licensee MDPI, Basel, Switzerland. This article is an open access article distributed under the terms and conditions of the Creative Commons Attribution (CC BY) license (https://creativecommons.org/licenses/by/4.0/).
Share and Cite
Jędrzejuk, H.; Orzełowska, F. Analysis of the Operation of Smoke Exhaust Ventilation in the Metro’s Technological Corridor Based on Numerical Simulation of Selected Locations of Fire. Energies 2023, 16, 849. https://doi.org/10.3390/en16020849
Jędrzejuk H, Orzełowska F. Analysis of the Operation of Smoke Exhaust Ventilation in the Metro’s Technological Corridor Based on Numerical Simulation of Selected Locations of Fire. Energies. 2023; 16(2):849. https://doi.org/10.3390/en16020849
Chicago/Turabian StyleJędrzejuk, Hanna, and Faustyna Orzełowska. 2023. "Analysis of the Operation of Smoke Exhaust Ventilation in the Metro’s Technological Corridor Based on Numerical Simulation of Selected Locations of Fire" Energies 16, no. 2: 849. https://doi.org/10.3390/en16020849