Article

Test Investigation and Rule Analysis of Bearing Fault Diagnosis in Induction Motors

Department of Electromechanical Power, PLA Navy Submarine Academy, Qingdao 266042, China
*
Author to whom correspondence should be addressed.
Energies 2023, 16(2), 699; https://doi.org/10.3390/en16020699
Submission received: 20 November 2022 / Revised: 29 December 2022 / Accepted: 3 January 2023 / Published: 6 January 2023

Abstract

:
In this paper, a series of tests were conducted on the bearings of induction motors to investigate vibration signal analysis-based diagnosis of bearing faults, and a thorough analysis was also conducted. In the engineering field, the kurtosis coefficient of vibration acceleration and the root mean square of vibration velocity, as well as resonant demodulated spectrum analysis of vibration acceleration, have been widely used for bearing fault diagnosis. These are integrated in almost any commercially available device for diagnosing bearing faults. However, the unsuitable use of these devices results in many false diagnoses. In light of this, they were selected as research objects and were investigated experimentally. In three induction motors, faults of different severity in the bearing outer race and cage were modeled for tests, and the corresponding results were used to evaluate the performance of the selected diagnosis methods. Some vague information in engineering was clarified, and some instructive rules were outlined to improve the bearing fault diagnosis performance. Taking the kurtosis coefficient of vibration acceleration (Ku) as an example, in engineering, Ku = 4 is generally taken as the diagnostic threshold of bearing faults. This means the following rule applies: if Ku ≤ 4, the bearing is healthy; otherwise, the bearing is faulty. However, the test results in this paper show that even if Ku ≤ 4, the bearing might be faulty; if Ku > 4, the bearing is indeed faulty. Therefore, the diagnostic rule should be improved as follows: if Ku > 4, the bearing is faulty (which can be assured), and if Ku ≤ 4, the status of the bearing is still undetermined. Thus, this paper can be helpful for researchers to gain an experimental understanding of the selected diagnosis methods and provides some improved rules on their use for reducing false diagnoses.

1. Introduction

As key components of an induction motor (IM), bearings are prone to failure, with a probability of up to 40–60% [1,2], which makes the diagnosis of bearing faults in IMs particularly important.
Vibration-signal-based bearing fault diagnosis methods are the most widely used at present [3,4,5,6,7,8,9,10,11,12,13,14,15,16,17]. Although stator-current-based methods have been rapidly developed in recent decades, they have poorer diagnosis performance [9,17]. Thus, vibration-signal-based bearing fault diagnosis methods are the focus of this paper. Through monitoring the time-domain indexes and analyzing the frequency spectrum of vibration signals, fault diagnosis can be carried out. Experience indicates that the kurtosis coefficient Ku of the vibration acceleration signal and the root mean square (RMS) value V of the vibration velocity signal are both sensitive to faults, and they have good robustness to changes in working conditions. Therefore, these two time-domain indexes are widely used in bearing fault diagnosis.
The time-domain parameter monitoring method is simple and effective to some extent, but it can only diagnose whether the bearing is faulty or healthy and it cannot determine the fault type. Therefore, vibration acceleration spectrum analysis is required to determine the fault type by investigating the characteristic frequency components of the bearing fault.
Bearing fault characteristics are generally reflected in vibration signals with frequencies lower than 1 kHz. In practice, many low-frequency structural vibration signals are caused by mechanical loosening, improper assembly, and other factors, which seriously affect the bearing fault characteristics. To eliminate such interference and highlight the bearing fault characteristics, resonance demodulation is employed. The methods presented in [4,5,6,7,8,9,10,11,12,13,14,15,16] are derived from the resonance demodulation spectrum analysis of vibration signals.
A thorough review of vibration-based bearing health indicators constructed from mechanical signal processing, modeling, and machine learning is provided in [4]. A kurtogram was used to select the optimal demodulation frequency band containing the maximum impulsivity related to bearing faults in [5,6]. A traverse symplectic correlation-gram was proposed in [7] to achieve the optimal demodulation frequency band selection. A mathematical morphological filter and Hilbert–Huang transformation were used in [8] to improve the accuracy of bearing fault detection. Vibration envelope analysis was combined with stator current analysis in [9] for the effective diagnosis of bearing faults. Based on spectrum analysis and the convolutional neural network, a fault diagnosis method was proposed in [10] to identify the bearing faults, which is especially suitable for bearings under inconsistent working conditions. Inspired by the excellent capability of sparse representation theory for fault feature extraction and classification, a collaborative sparsity-assisted fault diagnosis method was proposed and verified by enormous test results in [11]. A method for incipient bearing fault feature extraction was proposed in [12] based on optimized singular spectrum decomposition with 1.5-dimensional symmetric differential energy operator demodulation. To detect incipient bearing faults, the vibration signal was preconditioned to highlight minute fault components. After that, an accurate and low-complexity Rayleigh-quotient-based spectral estimator was used to identify fault component frequencies and amplitudes [13]. Based on the clustering and sparse representation of acquired noisy signals, an effective fault diagnosis algorithm for rolling bearings was proposed in [14]. Similarly, adaptive K-sparsity-based weighted Lasso was used to promote vibration signal sparsity for better extraction of bearing fault features in [15]. Based on the envelope harmonic-to-noise ratio and adaptive variational mode decomposition, a new feature extraction technique was presented for bearing fault diagnosis in [16].
At present, these methods are generally considered to be sensitive and reliable in engineering. However, our understanding of the performance of these vibration-signal-based bearing fault diagnosis methods lacks test support.
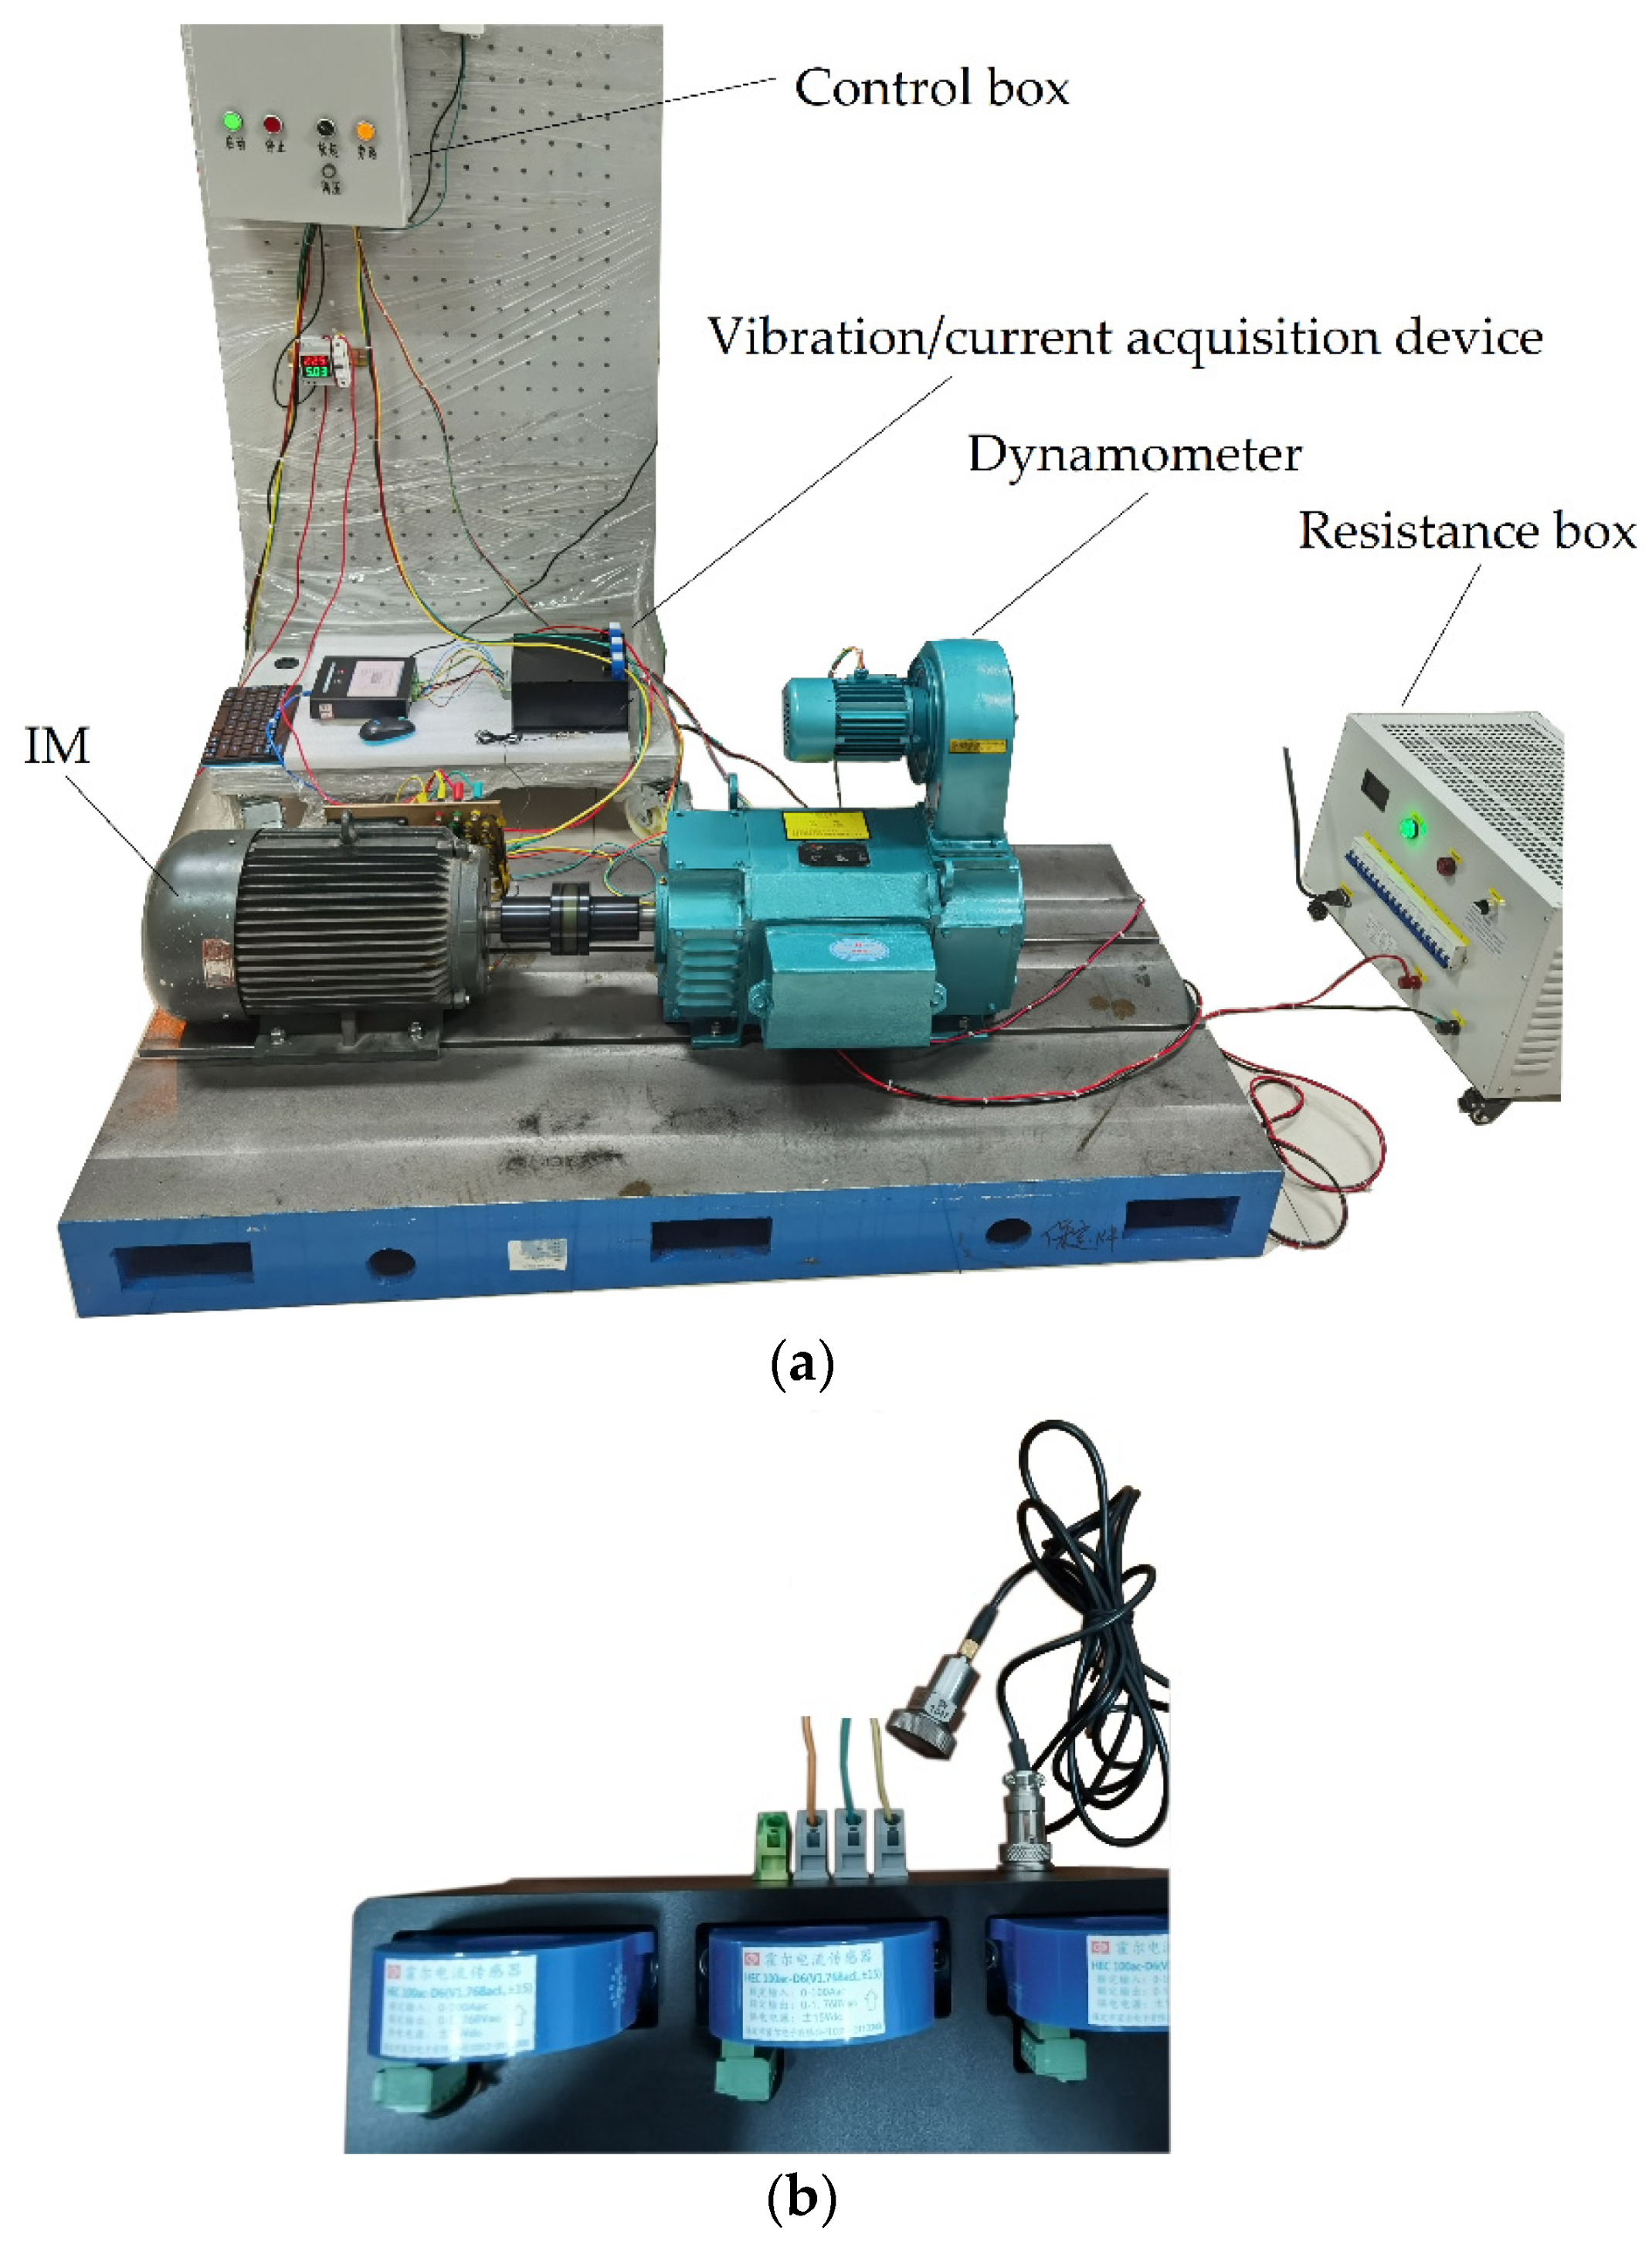
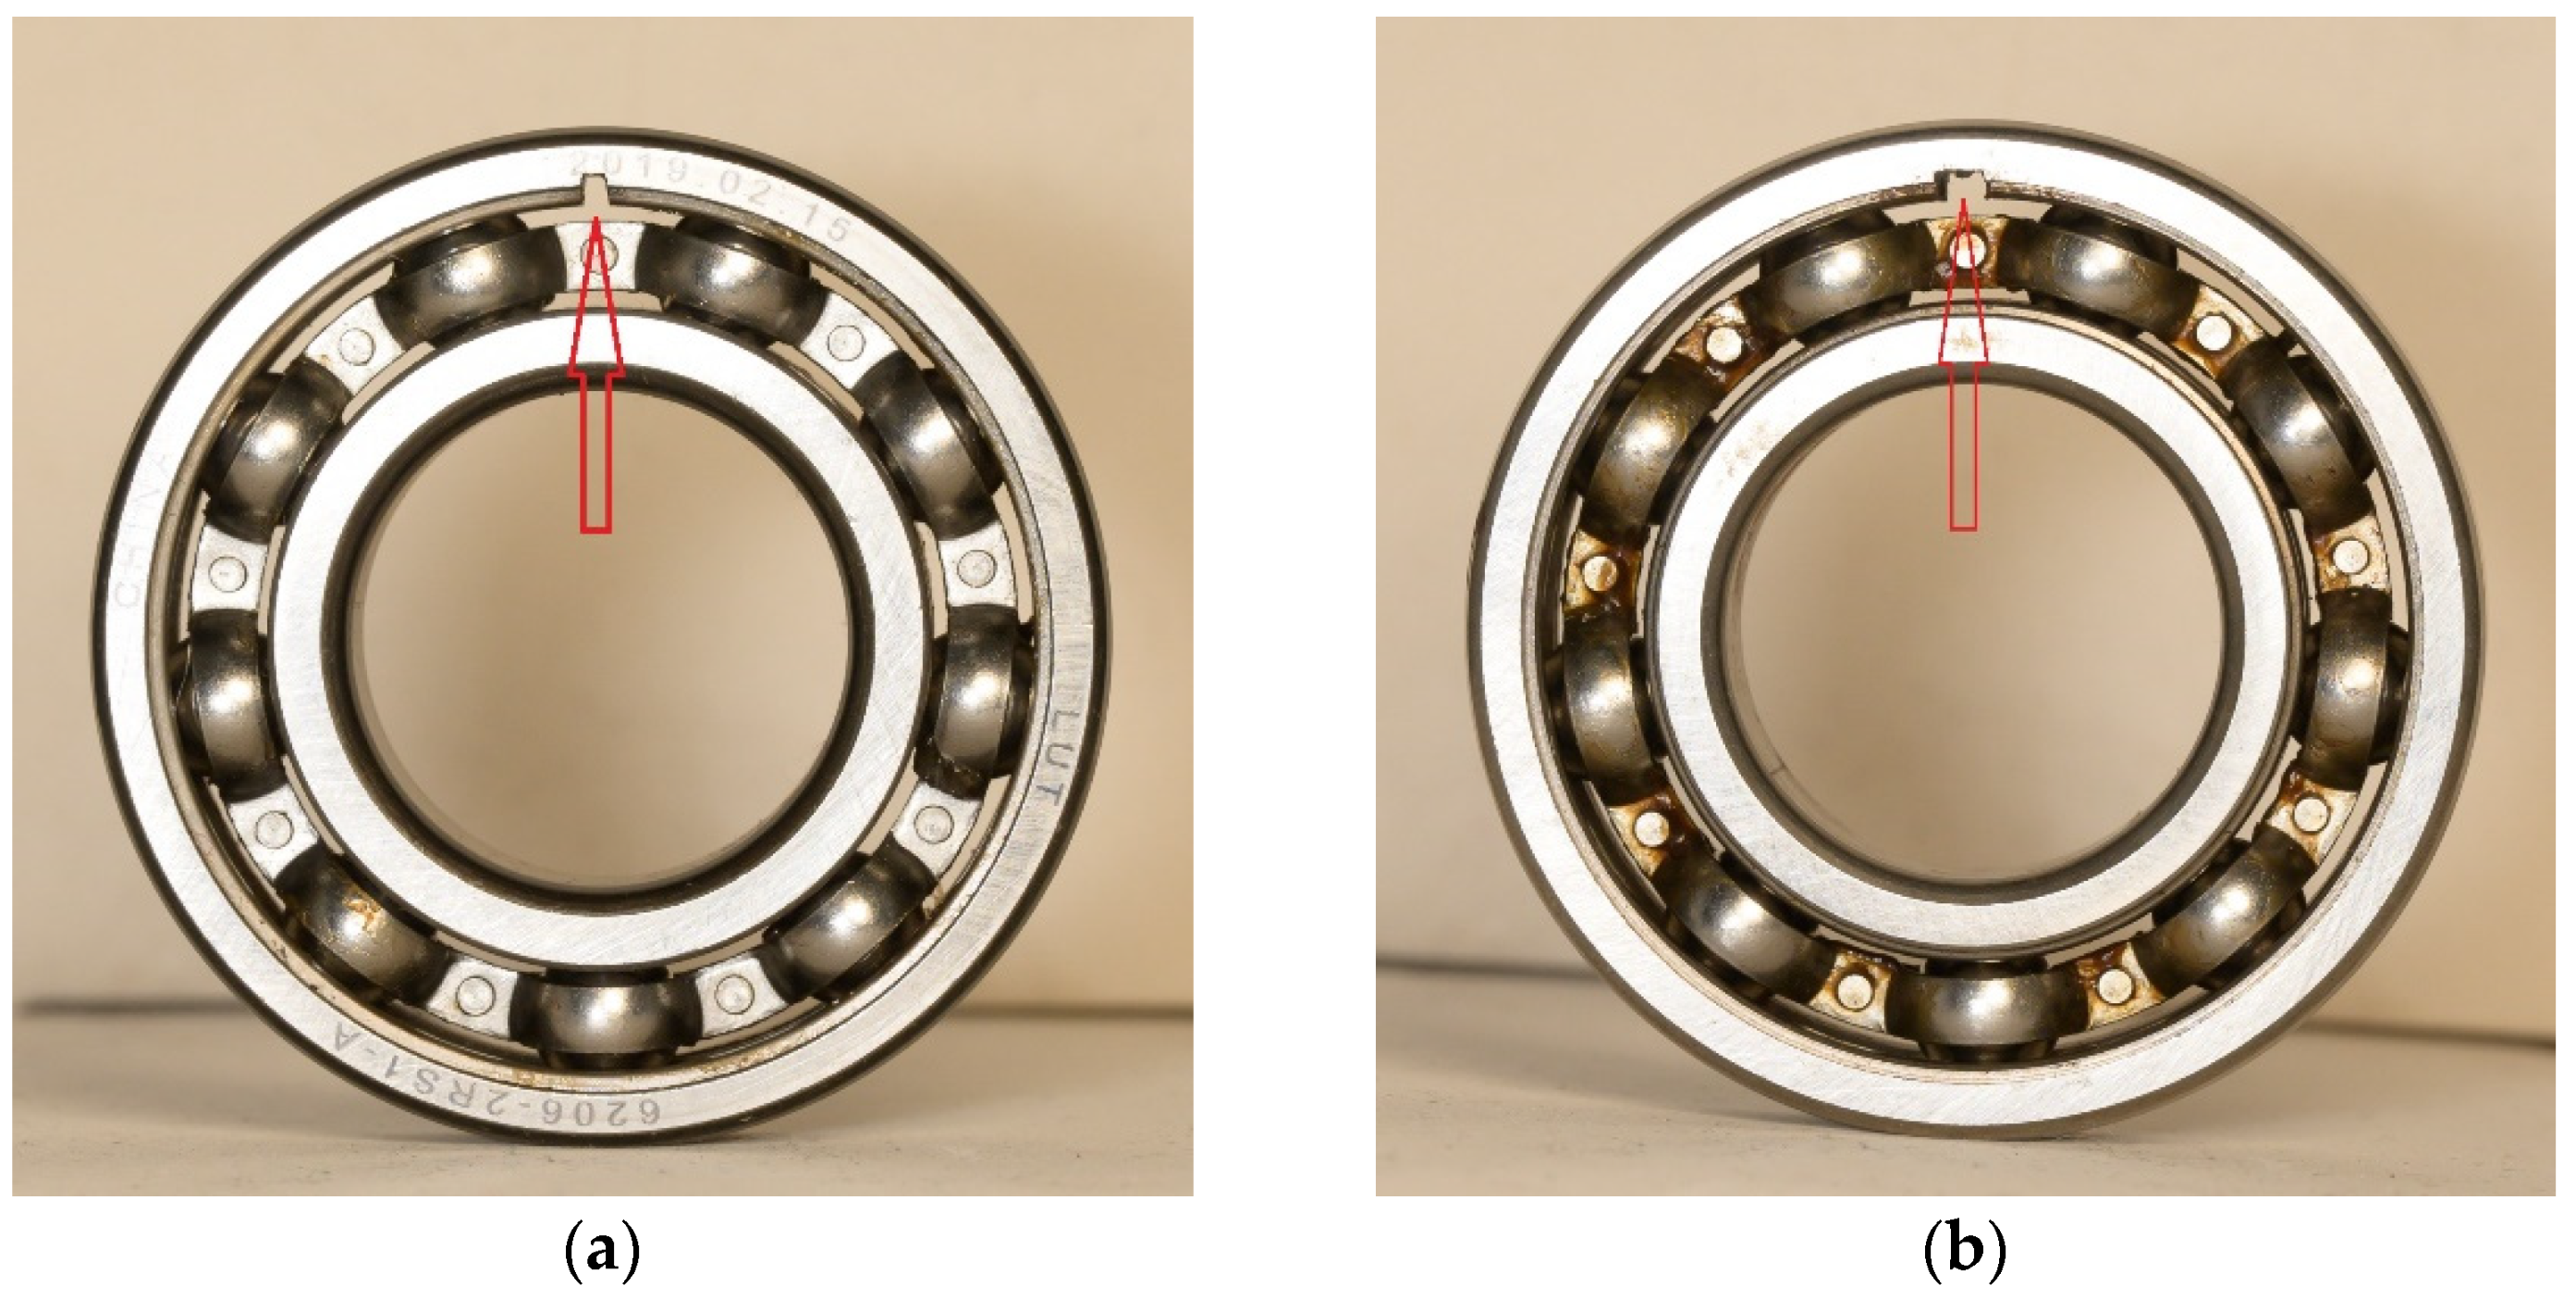
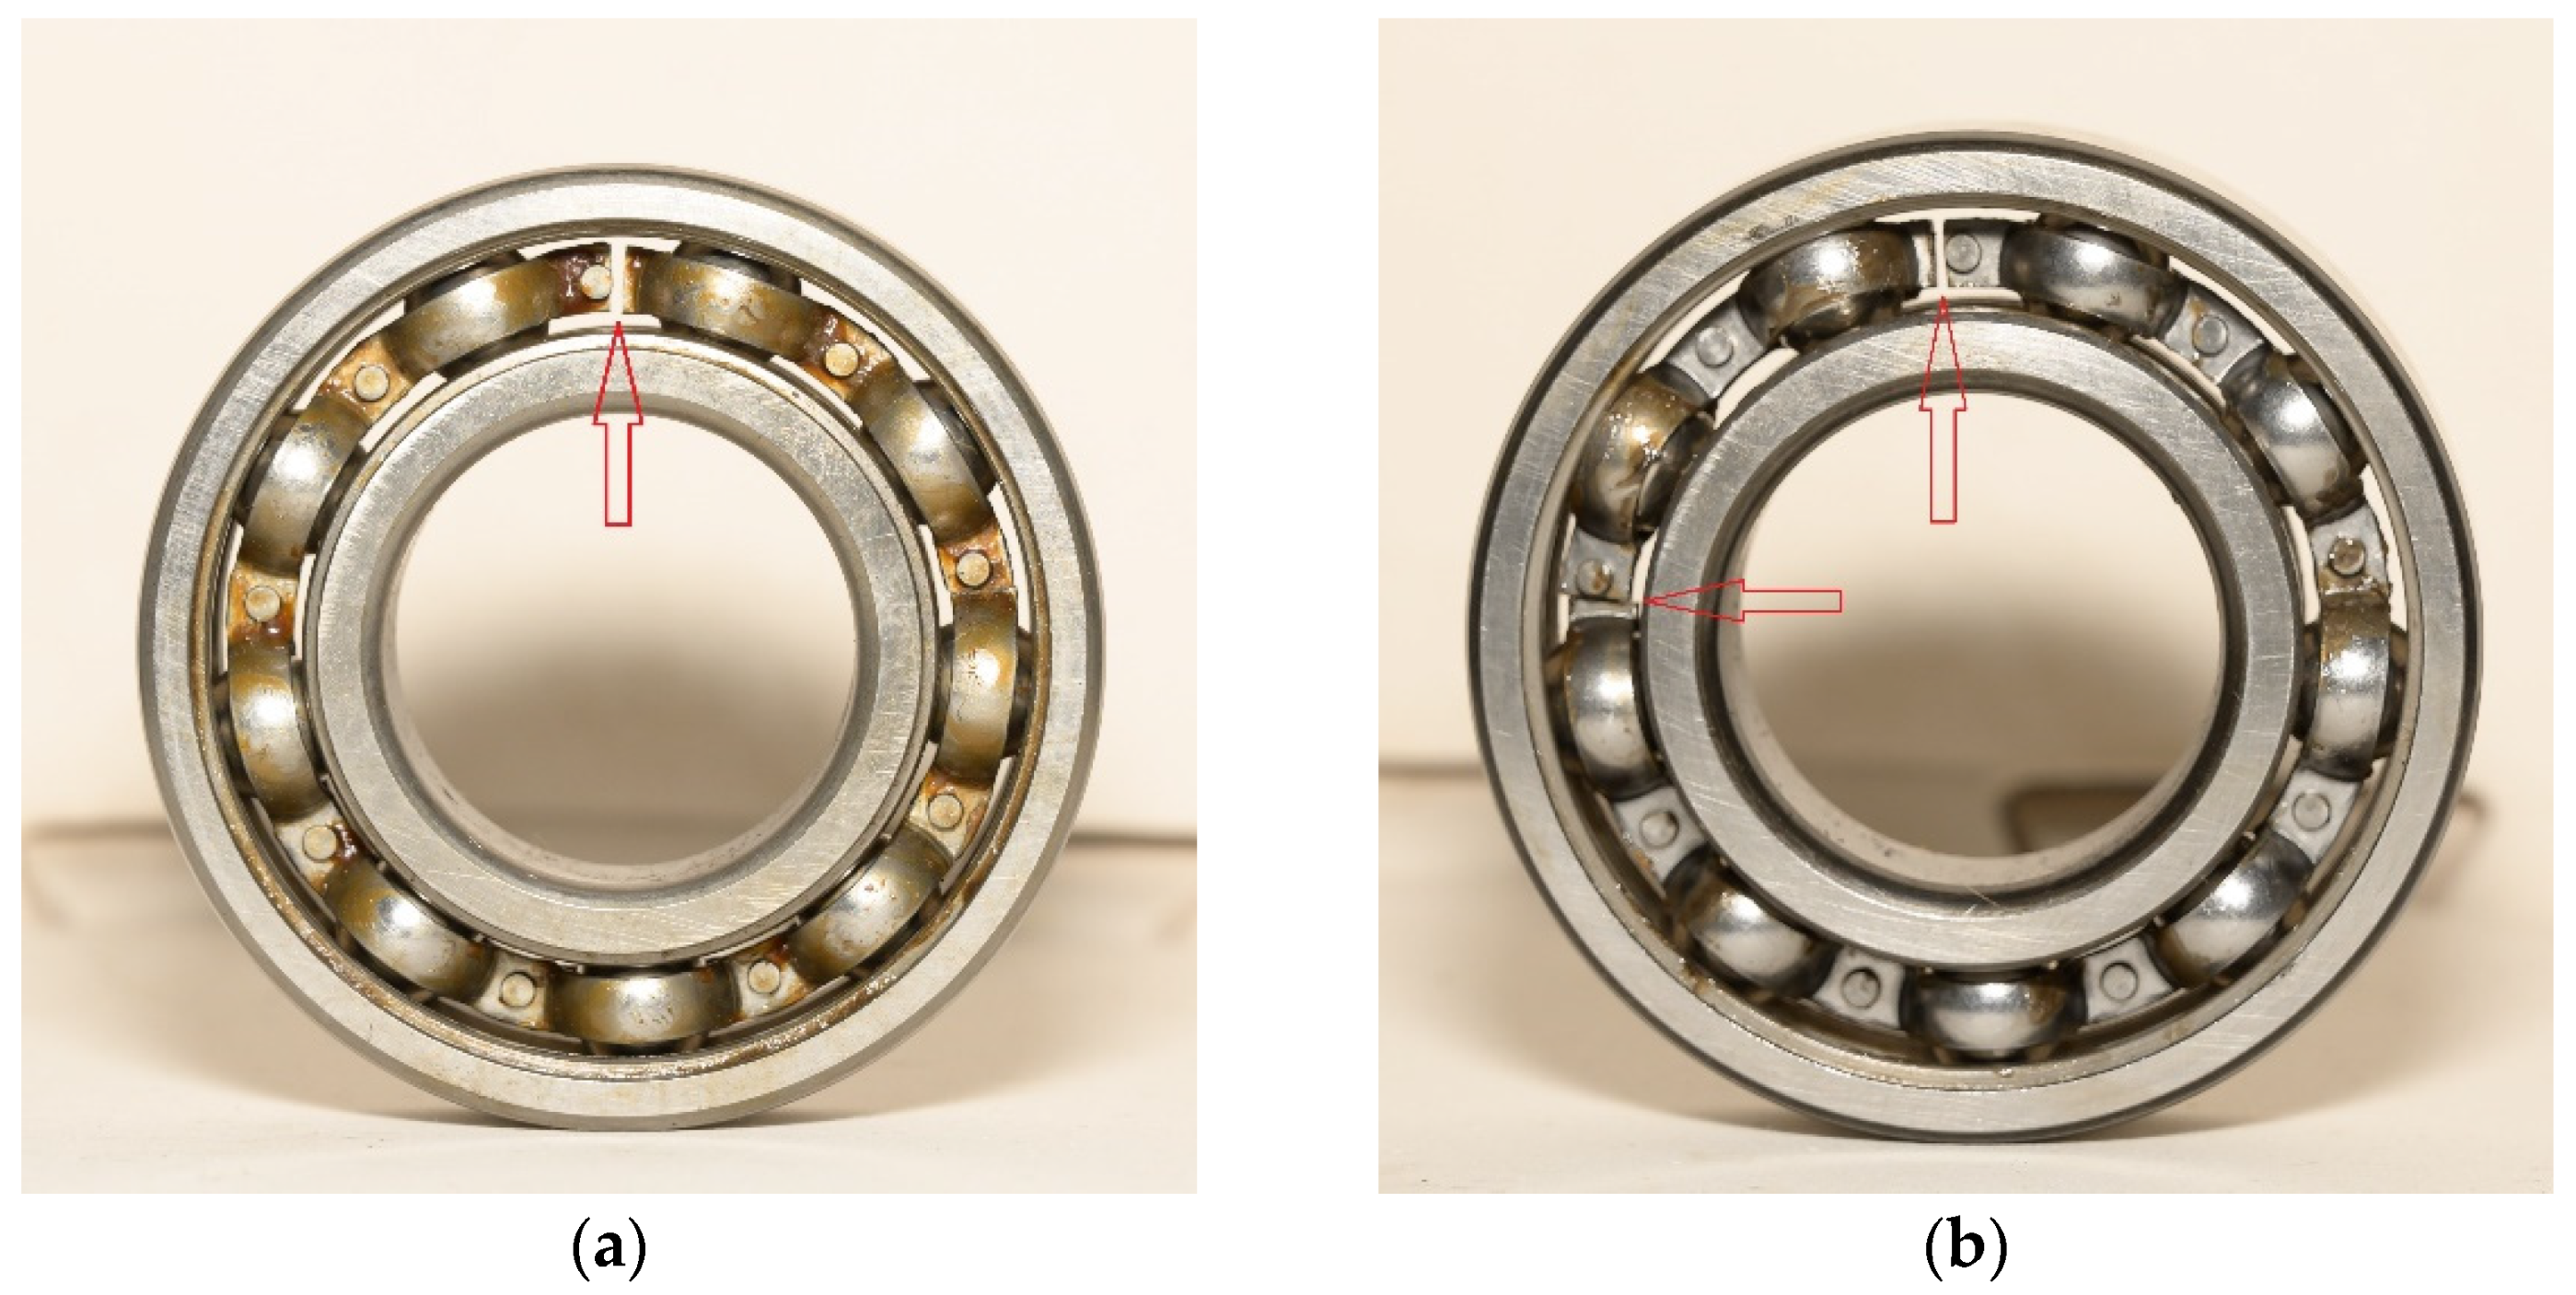
In this paper, we review the vibration-signal-based bearing fault diagnosis methods, and two time-domain indexes, kurtosis coefficient of vibration acceleration and RMS value of vibration velocity, were selected to represent these methods, along with vibration acceleration resonance demodulation spectrum analysis for performance evaluation. Three IMs of types Y100L-2, Y100L-4, and Y132M-4 were tested with modeled bearing outer race and cage faults of different severities. The vibration signals of the 6206-type bearing in Y100L-2 and Y100L-4 IMs and the 6308-type bearing in Y132M-4 IM were recorded and used for bearing fault diagnosis with the aforementioned methods. The diagnosis performance was thoroughly analyzed based on the test results. Furthermore, some vague information in engineering is corrected and further clarified in this paper and a series of rules and suggestions with guiding and practical significance are summarized at the end.

2. Vibration-Signal-Based Bearing Fault Diagnosis Methods

Rolling bearings are widely used in IMs and are composed of four parts: the outer race, inner race, rolling body, and cage. Faults in the outer race and the cage are common in rolling bearings.

2.1. Characteristic Frequencies of Vibration Signals of Bearing Faults

Different types of bearing faults will produce feature vibration signals with different characteristic frequency components. Taking outer race and cage faults as examples, their corresponding characteristic frequencies are shown in Equations (1) and (2), respectively:
f outer = n 2 f r ( 1 B d P d cos Φ ) ,
f cage = 1 2 f r ( 1 B d P d cos Φ )
where n is the number of rolling bodies, fr is the rotational frequency (Hz), Bd is the diameter of the rolling ball, Pd is the pitch diameter, and Φ is the contact angle.

2.2. Bearing Fault Diagnosis Based on Vibration Signal Analysis

For a discrete bearing vibration acceleration signal xi, its kurtosis coefficient Ku is defined as follows:
K u = N i = 1 N ( x i x ¯ ) 4 i = 1 N ( x i x ¯ ) 2 , x ¯ = 1 N i = 1 N x i
where N is the length and x ¯ is the mean value of discrete sequence xi.
For healthy bearings, the vibration acceleration signal follows the normal distribution, and Ku ≈ 3. In practice, Ku = 4 is generally taken as the diagnostic threshold of bearing faults.
For discrete bearing vibration velocity signal vi, its RMS value V is defined as:
V = 1 N i = 1 N v i 2
Table 1 shows the ISO standard for the evaluation of small IMs (<15 kW) based on the RMS value of the vibration velocity signal (excerpted from ISO 2372).
By monitoring Ku and V, it can be determined whether the IM is working normally or with a bearing fault; however, the type of fault cannot be recognized. Therefore, we need to investigate the characteristic frequency components by analyzing the vibration acceleration signal spectrum. The resonance demodulation method is one representative method.
The basic principle of resonance demodulation is as follows: when local defects occur on the surface of a certain bearing element, the defective surface will strike the surfaces of other elements matched with it, generating impulses due to resonance. These impulses contain a wide frequency band that covers the natural frequency of this element, resulting in high-frequency (>2 kHz) resonance vibration in the whole bearing system. Generally speaking, quite a few high-frequency vibrations will emerge. The vibration of interest is the one with the highest energy, which is selected for further analysis. This selection is a significant step, because it determines whether the fault feature can be extracted from the subsequent demodulated signal. The kurtogram is an effective tool to achieve this goal [5,6]. The selected high-frequency vibration can be separated out from the whole vibration signal using a band-pass filter with the center frequency equal to this high frequency. Its amplitude is modulated by the characteristic frequency of the faulty bearing element. In light of this, an envelope demodulator can be used to eliminate the attenuating high-frequency components. As a result, the low-frequency envelope signal containing only the characteristic information of the bearing fault is obtained. After that, the characteristic information can be extracted for bearing fault diagnosis by means of spectrum analysis of this envelope signal.
Obviously, another significant step is envelope demodulation, which can be achieved by Hilbert transform. For a vibration acceleration signal x(t), its Hilbert transform is defined as:
x ^ t = 1 π x τ t τ d τ
The envelope of x(t), i.e., the modulated signal, is defined as follows:
A t = x t 2 + x ^ t 2
Bearing fault diagnosis can thus be realized by analyzing the frequency spectrum of A(t) and investigating the characteristics of the bearing fault.
The above information outlines the well-known resonance demodulation envelope analysis, which is widely used in engineering practice to diagnose bearing faults. For further details, please refer to [4,5,6].
All of the methods described in [4,5,6,7,8,9,10,11,12,13,14,15,16] are essentially the same as the resonance demodulation spectrum analysis of the vibration acceleration signal, and the performance can be improved by introducing modern signal processing techniques.
The kurtosis coefficient of vibration acceleration and the RMS value of vibration velocity, along with vibration acceleration resonance demodulation spectrum analysis, are the most representative bearing fault diagnosis methods based on vibration signal analysis. In this study, their performance was evaluated with test data.

3. Test Equipment and Results

3.1. Laboratory Test

The main test equipment is shown in Figure 1, including the IMs, control box (to control the start and stop of the IM), dynamometer and resistance box (as adjustable load of the IM), and vibration and current signal acquisition device. Three IMs of types Y100L-2, Y100L2-4, and Y132M-4 were used for the investigation. Their rated power Pn, rated voltage Un, rated current In, rated speed Nn, and bearing types are listed in Table 2, and the parameters of the bearings are shown in Table 3.
As illustrated in Figure 1b, the vibration signal in the vertical direction was acquired by a piezoelectric acceleration sensor (Lance LC0104T) installed directly under the bearing seat.
For the outer race fault diagnosis test, two bearings of type 6206 were deliberately damaged by cutting two grooves of different widths and the same depth on their outer races, thus, modeling outer race defects with different severity. As shown in Figure 2, two grooves with widths of 1 and 3 mm and a depth of 1.5 mm were made on the outer races of the two bearings, and the fault severity could be considered as either slight or severe. Additionally, another bearing of type 6308 was similarly treated to model the outer race defect.
For the cage fault diagnosis test, two bearings of type 6206 were deliberately damaged by cutting one or two gaps on the cage, thus modeling cage defects with different severities. As shown in Figure 3, one or two gaps were made on the cage of each bearing, and the fault severity could be considered as either slight or severe.
Different conditions were designed and tested on the healthy IM, the IM with the outer race fault, and the IM with the cage fault. The motor loads were approximately set as full load and half load. The instantaneous signals of vibration acceleration were sampled and analyzed.

3.2. Test Results

3.2.1. Outer Race Fault

The resonance demodulation spectra of vibration acceleration signals of the Y100L-2 motor with a full load are given in Figure 4. The rotational speed was about 2909.4 r/min and the rotational frequency was 48.49 Hz. According to Equation (1), the characteristic frequency can be calculated as fouter ≈ 173.02 Hz. Table 4 lists the Ku, V, fouter, and amplitude values of vibration characteristic components.
Similar tests were carried out for the half-load condition, in which the rotational speed was about 2951.4 r/min and the vibration characteristic frequency fouter ≈ 175.49 Hz. Table 5 shows the Ku, V, fouter, and amplitude values of vibration characteristic components.
To determine whether the pole pair number of the IM affects the performance of the bearing fault diagnosis method based on vibration signal analysis, another test was carried out on a Y100L2-4 IM with two pole pairs. The bearing type, rated power, center height, installation platform, driving mechanism, load, and other factors of this motor were the same as those of the Y100L-2 IM with one pole pair, except for the pole pair number.
Table 6 shows the Ku, V, fouter, and amplitude values of vibration characteristic components of the Y100L2-4 IM with a nearly full load under three conditions: healthy, slight outer race fault, and severe outer race fault. Here, the rotational speed was about 1458.3 r/min and the vibration characteristic frequency fouter ≈ 86.73 Hz.
In addition, similar tests were carried out in the nearly half-load state, with a rotational speed of about 1472.9 r/min and a vibration characteristic frequency fouter ≈ 87.59 Hz. Table 7 shows the Ku, V, fouter, and amplitude values of vibration characteristic components.
The test data of the outer race fault diagnosis of the Y132M-4 IM with two pole pairs are provided in Table 8. In contrast to the Y100L2-4 IM with two pole pairs, the bearing type, rated power, and center height are different and only the pole pair number is the same. These data were used to further investigate the performance of the bearing fault diagnosis method based on vibration signal analysis.
The bearing type was 6308, and its parameters are listed in Table 3. To perform the outer race fault diagnosis test, it was deliberately damaged by cutting one groove 3 mm wide and 1.5 mm deep on the outer race.
Table 8 shows the Ku, V, fouter, and amplitude values of vibration characteristic components of Y132M-4 IM with a nearly full load under healthy and outer race fault conditions. The rotational speed was about 1458.2 r/min and the characteristic frequency of vibration foute ≈ 70.28 Hz.

3.2.2. Cage Fault

Figure 5 shows the resonance demodulation spectra of vibration acceleration signals of the Y100L2-4 IM with a nearly full load under three conditions: healthy, slight cage fault, and severe cage fault.
Table 9 shows the Ku, V, fcage, and amplitude values of vibration characteristic components. The rotational speed was about 1458.3 r/min and the rotational frequency was about 24.31 Hz. According to Equation (1), the characteristic frequency of vibration can be calculated as fcage ≈ 9.64 Hz.

4. Results Analysis

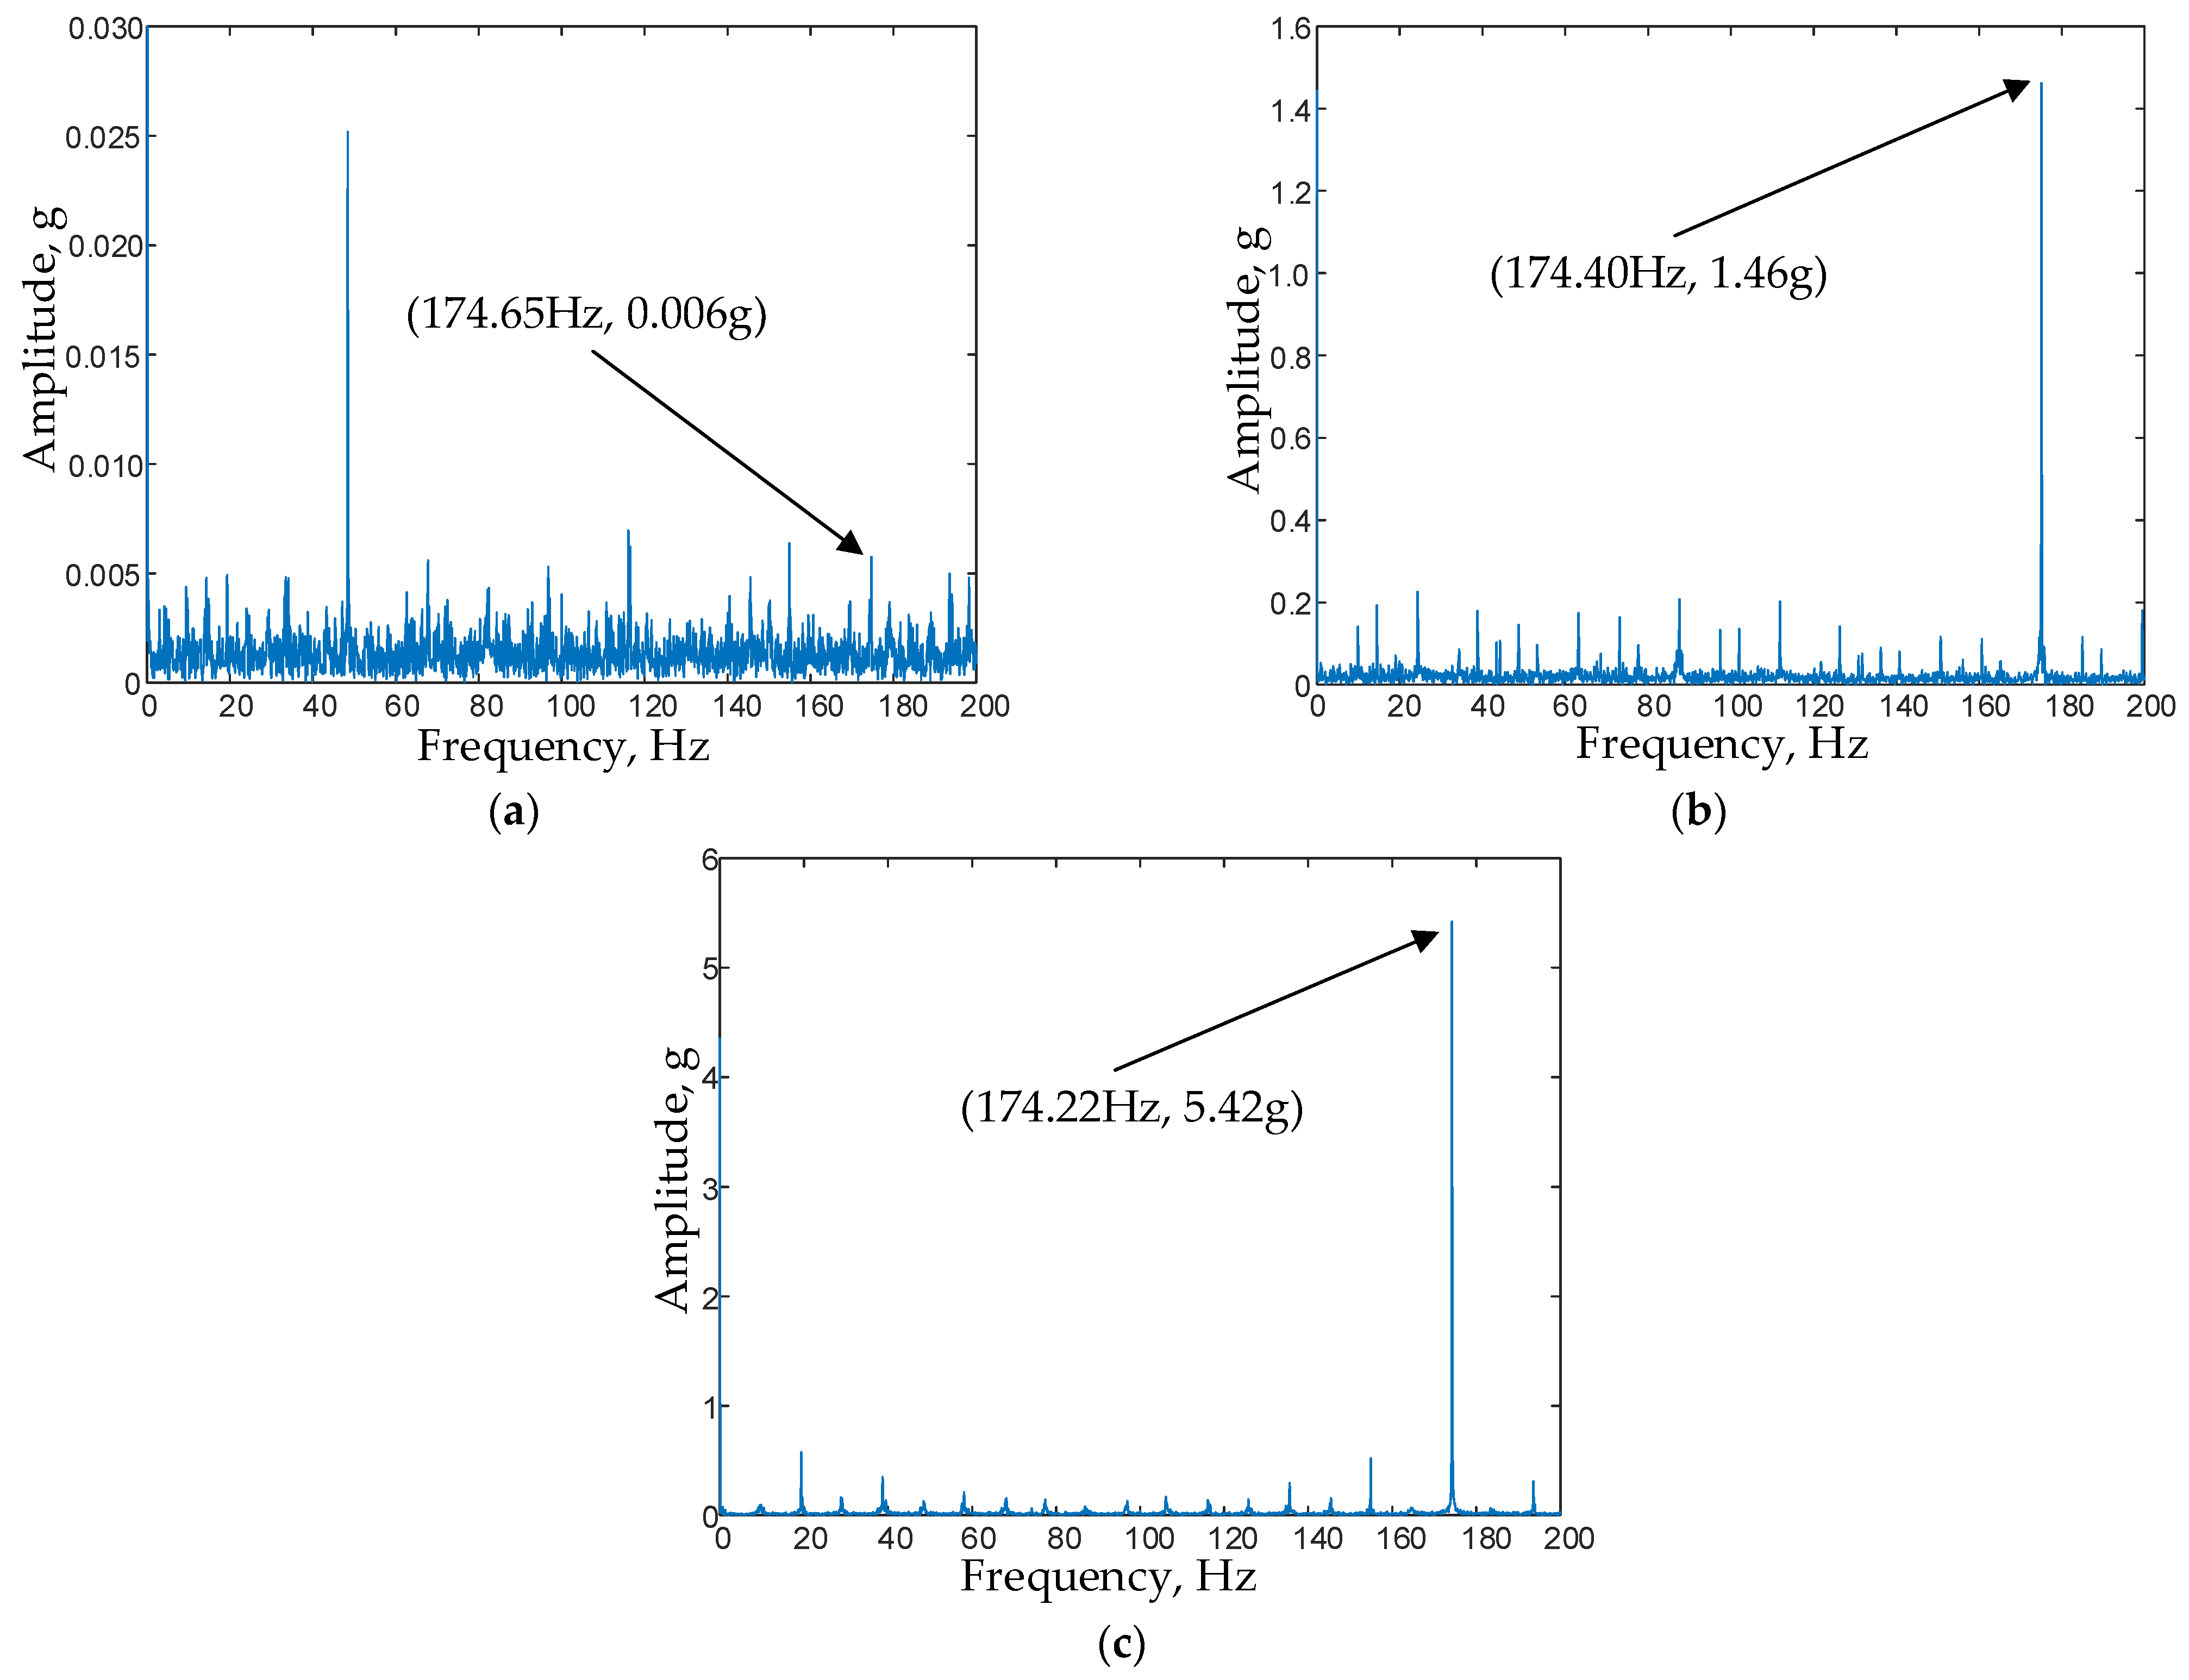
For the Y100L-2 IM, by comparing the graphs in Figure 4, it can be seen that the frequency domain amplitudes of the outer race fault characteristic components of vibration acceleration show a significant increasing trend, corresponding to the conditions of healthy, slight fault, and severe fault, detailed in Table 4 and Table 5. It can be concluded that the bearing fault diagnosis method based on vibration signal analysis is effective in terms of trends. In addition, the kurtosis coefficients of vibration acceleration and the RMS values of vibration velocity in Table 4 and Table 5 also demonstrate a significant increasing trend, corresponding to the same three conditions. Moreover, the concrete values are consistent with the evaluation criterion for the bearing states of acceptable and unacceptable in ISO 2372 (4.50 mm/s; see Table 1).
For the Y100L2-4 IM, the frequency domain amplitudes of the outer race fault characteristic components of vibration acceleration also show a significant increasing trend corresponding to the conditions of healthy, slight fault, and severe fault, as listed in Table 6 and Table 7. Hence it can be concluded that the bearing fault diagnosis method based on vibration signal analysis is effective in terms of trends. However, for specific values, the results turn out to be quite different than those of the Y100L-2 IM (refer to Table 4 and Table 5). For example, the amplitudes of the fault characteristic components are 0.002, 0.55, and 1.34 g, corresponding to healthy, slight fault, and severe fault conditions, respectively, when the IM has a full load. In contrast, the corresponding test results of the Y100L-2 IM are 0.006, 1.46, and 5.42 g, respectively.
The kurtosis coefficients of vibration acceleration corresponding to the three conditions are also given in Table 6 and Table 7. They present a trend of first dramatically increasing and then decreasing. More specifically, when the IM has a full load, the values surged from 3.1 to 57.3 and then decreased to 19.5; with a half-load, the values surged from 3.0 to 66.2 and then decreased to 18.9. This phenomenon is quite different from that of the Y100L-2 IM (refer to Table 4 and Table 5).
In Table 6 and Table 7, the RMS values of vibration velocity corresponding to the three conditions show a significant increasing trend. However, for the slight fault condition, the specific RMS values of vibration velocity when the IM has a full load and a half load are 2.93 and 2.71 mm/s, respectively. This is not consistent with the evaluation criterion for the bearing states of acceptable and unacceptable in ISO 2372 (4.50 mm/s; see Table 1). In other words, according to this criterion, the bearing state should be diagnosed as acceptable. Obviously, this diagnosis result deviates from the actual state of the bearing as being in slight fault conditions. Thus, a false diagnosis occurred, showing a faulty bearing as being healthy. This is different from the test results of the Y100L-2 IM (refer to Table 4 and Table 5). In addition, the specific RMS values of the vibration velocity of these two IMs are quite different. For example, the values are 1.95, 2.93, and 9.94 mm/s under healthy, slight fault, and severe fault conditions, respectively, when the Y100L2-4 IM has a full load. In contrast, the corresponding test results of the Y100L-2 IM are 4.08, 7.83, and 10.41 mm/s, respectively.
Therefore, with a different pole pair number and the same bearing type, rated power, center height, installation platform, driving mechanism, load, and other factors, the test results of the Y100L-2 IM and Y100L2-4 IM are still different. This implies that the pole pair number of the IM affects the performance of the bearing fault diagnosis method based on vibration signal analysis.
For the Y132M-4 IM, the kurtosis coefficients of vibration acceleration in Table 8 show an increasing trend, corresponding to the conditions of healthy and outer race fault. This result is the same as that of the Y100L-2 IM (refer to Table 4 and Table 5), but different from that of the Y100L2-4 IM, which first greatly increased and then decreased (refer to Table 6 and Table 7). More importantly, the kurtosis coefficient of the bearing vibration acceleration of this IM is relatively small; for example, in the case of a fault, the kurtosis coefficient is only 3.0. In engineering, the diagnostic threshold of a bearing fault is generally set as Ku = 4. Thus, a false diagnosis occurred, showing a faulty bearing as being healthy.
In Table 8, the RMS values of vibration velocity corresponding to the conditions healthy and outer race fault show a significant increasing trend. However, for the healthy condition, the specific RMS value of vibration velocity is 4.62 mm/s. This is not consistent with the evaluation criterion for the bearing states of acceptable and unacceptable in ISO 2372 (4.50 mm/s; see Table 1). In other words, according to the criterion, the bearing state will be diagnosed as unacceptable. Obviously, this diagnosis result deviates from the actual state of the bearing as being healthy. Thus, a false diagnosis, showing a healthy bearing as being faulty, is unavoidable. This is different from the test results of the Y100L-2 and Y100L2-4 IMs (refer to Table 4 and Table 5 and Table 6 and Table 7). In addition, the specific RMS values of vibration velocity of these three IMs are quite different. For example, for the fully loaded Y132M-4 IM, the RMS value of vibration velocity is 4.62 mm/s in the healthy condition. In contrast, the corresponding test results of the Y100L-2 and Y100L2-4 IMs are 4.08 and 1.95 mm/s, respectively.
In Table 8, the amplitudes of the vibration characteristic components corresponding to healthy and faulty conditions show an increasing trend. However, in terms of specific values, they are different from those of the Y100L-2 and Y100L2-4 IMs (refer to Table 4 and Table 5 and Table 6 and Table 7).
It is important to note that the Y132M-4 IM has a significantly greater mass than the Y100L-2 and Y100L2-4 IMs as well as a different bearing type (6308 versus 6206). Therefore, it can be concluded that both the mass and bearing type of the IM affect the performance of the bearing fault diagnosis method based on vibration signal analysis.
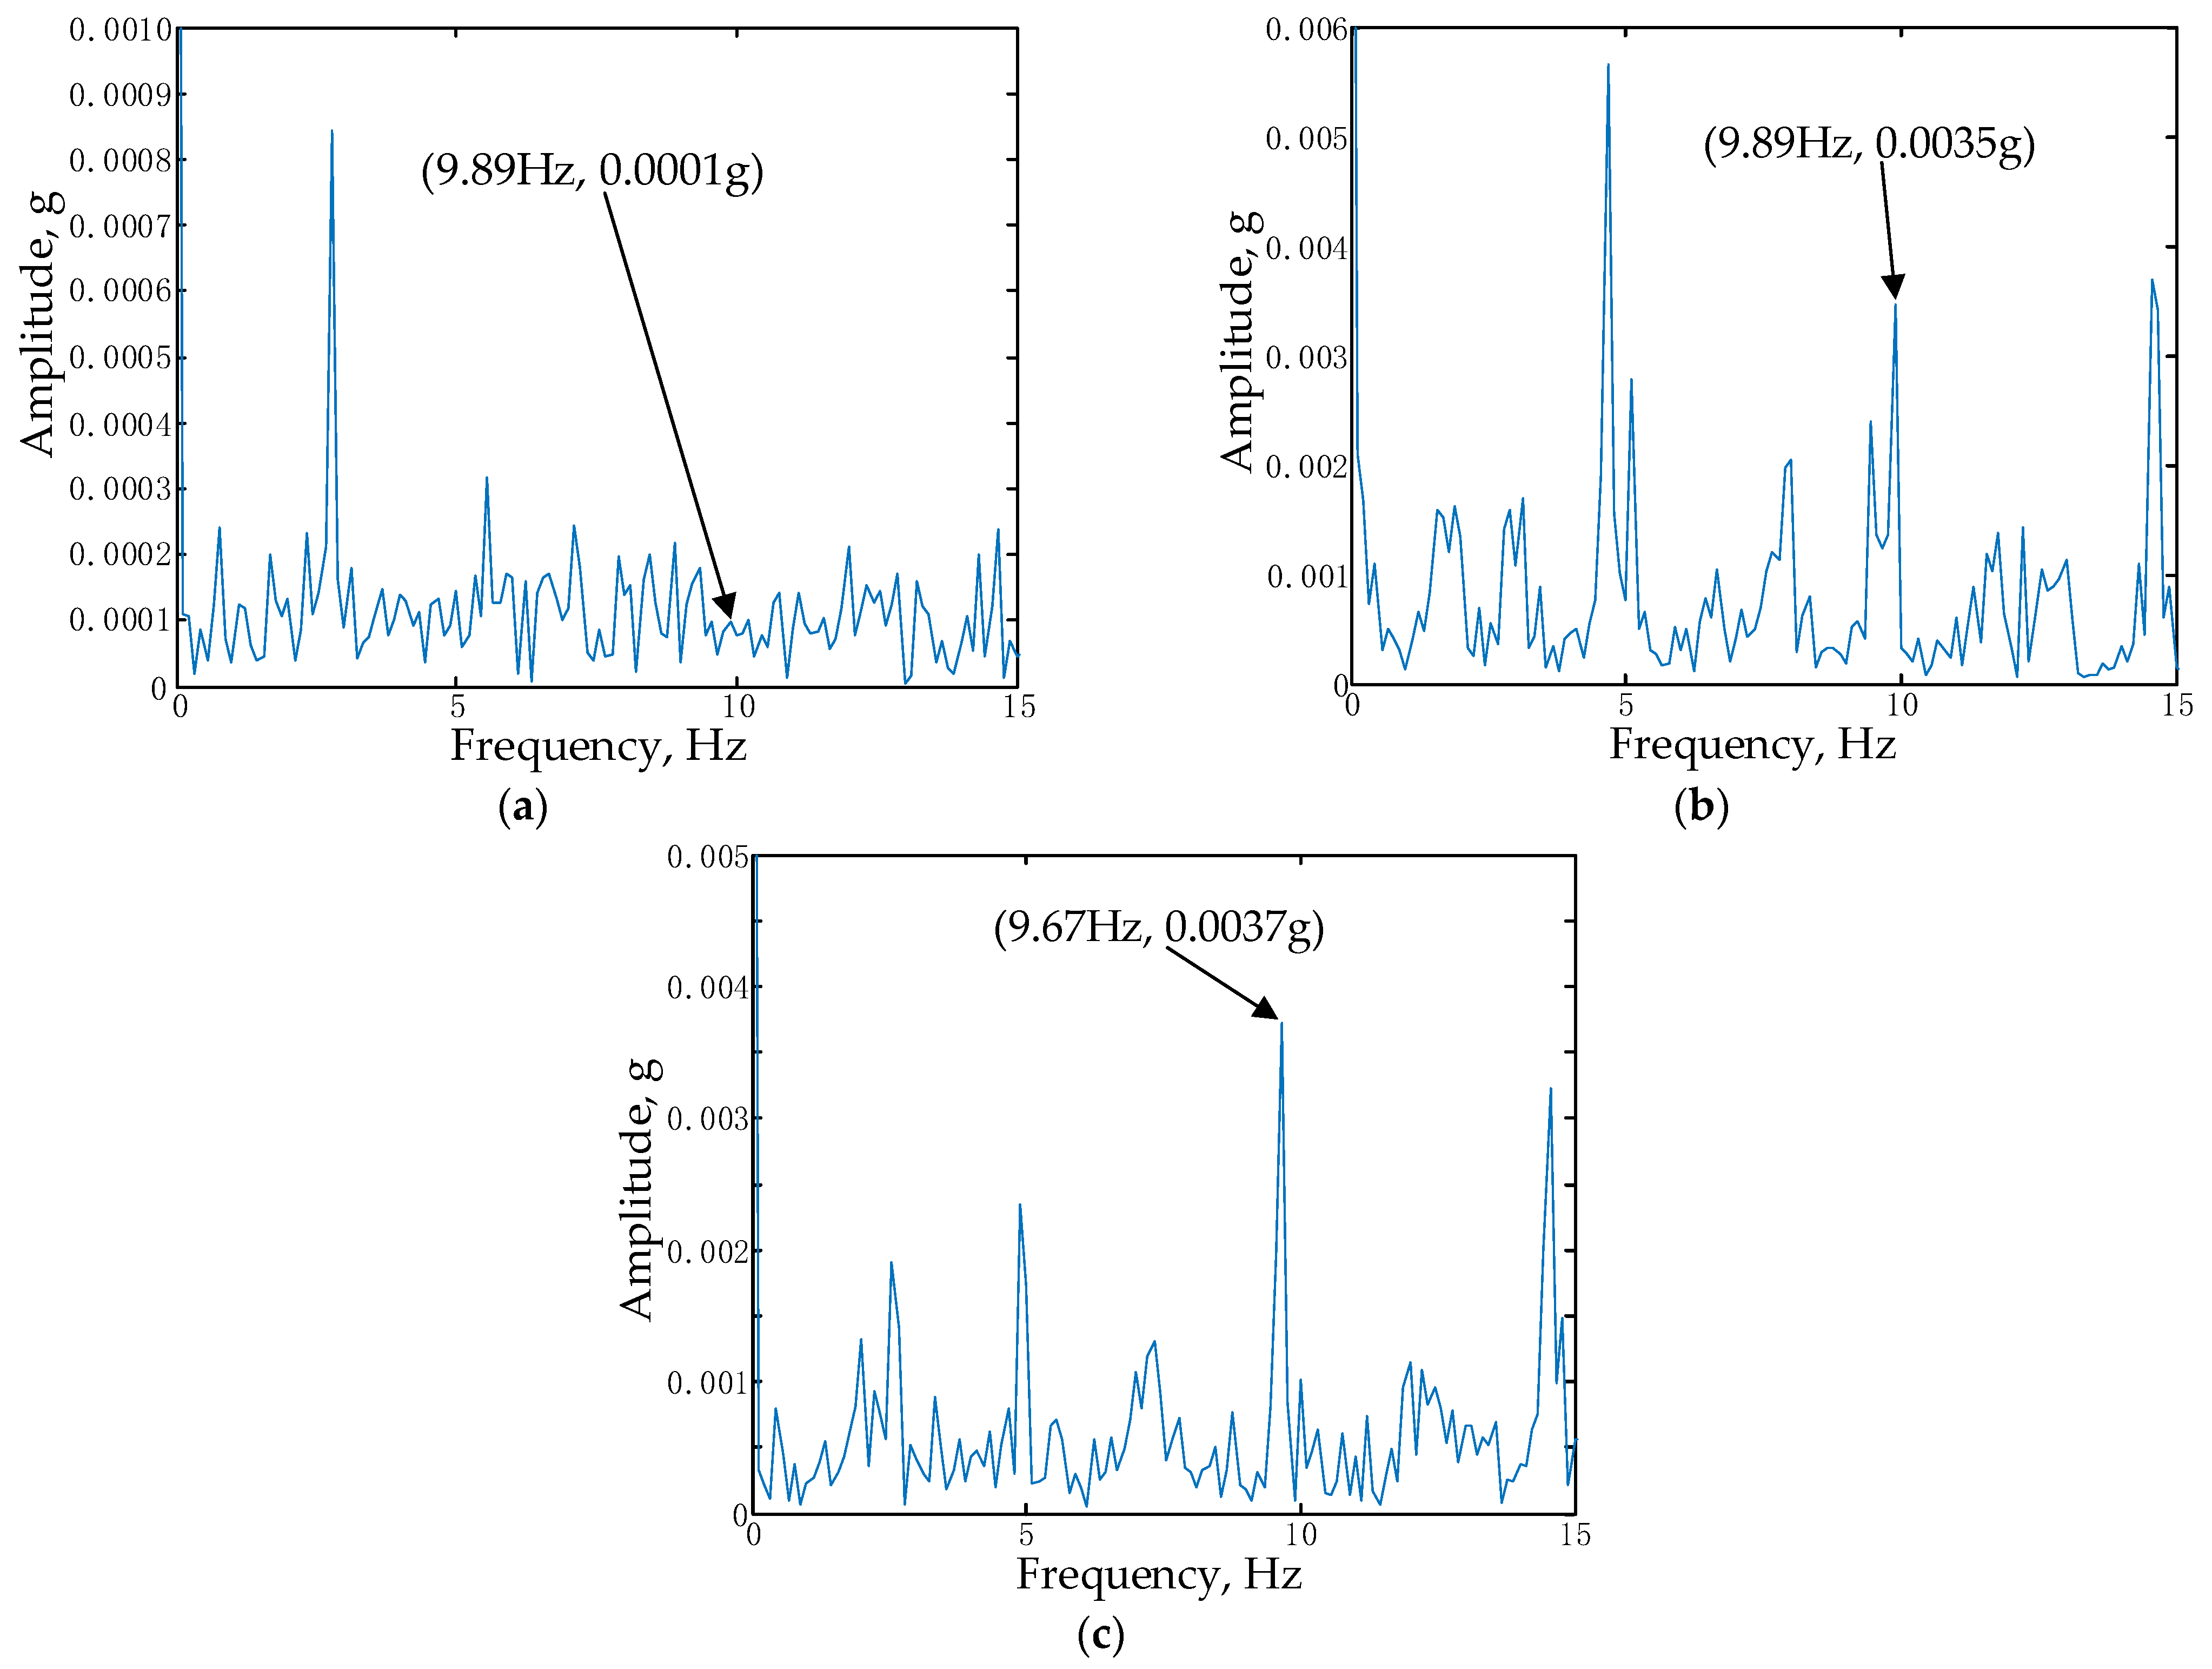
As for the cage fault diagnosis of the Y100L2-4 IM, by comparing the graphs in Figure 5, it can be seen that when the IM is fully loaded, the frequency domain amplitudes of the cage fault characteristic components show an increasing trend, corresponding to the conditions of healthy, slight fault, and severe fault, as detailed in Table 9. In addition, in terms of specific values, the frequency domain amplitudes of the cage fault characteristic components are far less than those of the outer race fault characteristic components (refer to Table 4, Table 6 and Table 8). For example, when the IM is fully loaded, the amplitudes are 0.0001, 0.0035, and 0.0037 g corresponding to the conditions of healthy, slight fault, and severe fault, respectively. In contrast, the corresponding results of the outer race fault diagnosis are 0.002, 0.55, and 1.34 g, respectively.
In Table 9, the kurtosis coefficients of vibration acceleration are all around 3.0, corresponding to the three conditions. This is quite different from the test result of the outer race fault diagnosis, which showed values that first dramatically increased and then decreased (refer to Table 6 and Table 7). In engineering, the diagnostic threshold of a bearing fault is generally set as Ku = 4. This may lead to a false diagnosis, showing a faulty bearing as being healthy. This means that the kurtosis coefficient of vibration acceleration is not sensitive and may even be ineffective for cage faults to some extent.
In Table 9, the RMS values of vibration velocity show an increasing trend corresponding to the three conditions. However, even under the severe fault condition, for the fully loaded IM, the specific RMS value of vibration velocity is only 2.45 mm/s. This is not consistent with the evaluation criterion for the bearing state in ISO 2372 (4.50 mm/s; see Table 1). In other words, according to the criterion, the bearing state will be diagnosed as acceptable. Obviously, this result deviates from the actual state of the bearing, that is, a severe cage fault. Thus, a false diagnosis would occur, showing a faulty bearing as being healthy. In addition, the specific RMS values of vibration velocity are quite different from the test results of the outer race fault diagnosis (refer to Table 6). For example, for the fully loaded IM, corresponding to the conditions of slight cage fault and severe cage fault, the RMS values of vibration velocity are 2.07 and 2.45 mm/s, respectively. In comparison, the test results of the outer race fault diagnosis are 2.93 and 9.94 mm/s, respectively. This implies that the contribution of a cage fault to the bearing vibration may be significantly smaller than that of an outer race fault.

5. Conclusions

The aim of this paper was to provide an experimental understanding of the diagnostic methodology for bearing faults in IMs and some improved rules on using it to reduce false diagnoses. The kurtosis coefficient of vibration acceleration and the RMS of vibration velocity and the resonant demodulated spectrum analysis of vibration acceleration are widely used in the engineering field for bearing fault diagnosis in IMs. In fact, they are the most representative bearing fault diagnosis methods based on vibration signal analysis. In this paper, many tests were carried out to evaluate their performance, and the following conclusions and rules are drawn:
  • In engineering, Ku and V are usually combined to diagnose bearing faults. The diagnostic threshold of a bearing fault is generally set as Ku = 4, and the diagnostic threshold for V is determined according to ISO 2372, such as V > 4.50 mm/s for small IMs < 15 kW. However, the test results in this paper show that such practices will likely lead to false diagnosis. Therefore, further clarification is needed to avoid false diagnosis as much as possible.
  • Conventional experience shows that Ku has both sensitivity (to faults) and stability (robust to non-fault factors, such as working conditions), as is generally accepted in engineering. However, the test results show that this is somewhat vague, so further clarification is needed.
    The test results clearly show that Ku is sensitive to bearing outer race faults of the Y100L-2 and Y100L2-4 IMs, but not as sensitive for the Y132M-4 IM, and not sensitive to cage faults of the Y100L2-4 IM. On the other hand, the stability of Ku (robust to non-fault factors, such as working conditions) also needs to be corrected. As the test results in this paper demonstrate, under the healthy condition, Ku showed stability (its values were approximately the same when the IM had a full load, half load, or no load). However, in the case of bearing faults, this kind of stability no longer holds.
  • At present, Ku = 4 is generally regarded as the diagnostic threshold for bearing faults. This means the following diagnostic rule applies: if Ku ≤ 4, the bearing is considered to be healthy; otherwise, the bearing is considered to be faulty.
    However, the test results in this paper show that even if Ku ≤ 4, the bearing might be faulty; if Ku > 4, the bearing is indeed faulty. Therefore, the above diagnostic rule should be improved as follows: if Ku > 4, the bearing is faulty (which can be assured), and if Ku ≤ 4, the status of the bearing is still undetermined and needs further investigation via some other method such as spectrum analysis.
  • Conventional experience shows that V has both sensitivity (to faults) and stability (robust to non-fault factors, such as working conditions), which is generally accepted in engineering. However, the test results in this paper show that such experience requires further discussion.
    V is indeed sensitive to bearing faults. That is, in comparison with the healthy condition, a bearing fault does lead to an increase in V, and the more serious the fault, the greater the increase. On the other hand, the stability of V (robust to non-fault factors, such as working conditions) needs to be clarified. As for the test results in this paper, V was stable only in some cases (its value was approximately the same when the IM had a full load, half load, or was idle), but in other cases, the stability was no longer valid.
  • At present, the threshold value of V is generally determined according to the ISO 2372 standard for bearing fault diagnosis, such as V > 4.50 mm/s for small IMs < 15 kW. This means the following diagnostic rule applies: if V ≤ 4.50 mm/s, the bearing is considered to be healthy; otherwise, the bearing is considered to be faulty. However, the test results in this paper show that even if V ≤ 4.50 mm/s, the bearing was not healthy but faulty, and if V > 4.50 mm/s, the bearing may not be faulty, but healthy.
  • The value of V is obviously affected by the pole pair number, mass, bearing type, and other factors.
  • The resonant demodulated spectrum analysis of vibration acceleration is always helpful for bearing fault diagnosis. This is because the amplitude of the fault characteristic component of vibration acceleration exhibits a significant increasing trend corresponding to the healthy and faulty conditions. Moreover, this kind of analysis is capable of identifying the bearing fault type.
In conclusion, the following suggestions are put forward to guide bearing fault diagnosis in engineering:
  • The use of Ku in bearing fault diagnosis
    If Ku > 4, the bearing can assuredly be confirmed as faulty; if Ku ≤ 4, the status of the bearing needs further investigation to be diagnosed, and using the combination of V and spectrum analysis is a good choice.
  • The use of V in bearing fault diagnosis:
    V is indeed sensitive to bearing faults. However, its value is obviously affected by the pole pair number, mass, bearing type, and other factors. Therefore, when using V for bearing fault diagnosis, the sample data of the diagnosed IM should be accumulated in advance (covering its different working conditions as much as possible).
  • In-depth exploration of the mechanism analysis:
    For now, only rough explanations can be given for some test results, which means that the mechanism of IM bearing faults and vibration still remains unclear. As pointed out in [18], it is necessary to further investigate the multi-physical field coupling relationship of electromagnetic–mechanical–fluid signals in the motor system, so as to reveal the interaction mechanism between the motor state, excitation, and structure.

Author Contributions

Conceptualization, Z.Z. and J.S.; data curation, W.L.; methodology, W.C. and W.L.; validation, Z.Z., J.S., and W.C.; writing—original draft, Z.Z.; writing—review and editing, W.C. and W.L. All authors have read and agreed to the published version of the manuscript.

Funding

This research was funded by the National Natural Science Foundation of China, grant number 51407193.

Data Availability Statement

The data presented in this study are available on request from the corresponding author. The data are not publicly available due to privacy restriction.

Conflicts of Interest

The authors declare no conflict of interest.

References

  1. Thorsen, O.V.; Dalva, M. A survey of faults on induction motors in offshore oil industry, petrochemical industry, gas terminals, and oil refineries. IEEE Trans. Ind. Appl. 1995, 31, 1186–1196. [Google Scholar] [CrossRef]
  2. Zhang, P.; Du, Y.; Habetler, T.G.; Lu, B. A survey of condition monitoring and protection methods for medium-voltage induction motors. IEEE Trans. Ind. Appl. 2011, 47, 34–46. [Google Scholar] [CrossRef]
  3. Ahmed, H.; Nandi, A.K. Condition Monitoring with Vibration Signals: Comprehensive Sampling and Learning Algorithms for Rotating Machines; Wiley-IEEE Press: Hoboken, NJ, USA, 2019. [Google Scholar]
  4. Wang, D.; Tsui, K.-L.; Miao, Q. Prognostics and health management: A review of vibration based bearing and gear health indicators. IEEE Access 2017, 5, 665–676. [Google Scholar] [CrossRef]
  5. Randall, R.B.; Antoni, J. Rolling element bearing diagnostics—A tutorial. Mech. Syst. Signal Process. 2011, 25, 485–520. [Google Scholar] [CrossRef]
  6. Smith, W.A.; Fan, Z.; Peng, Z.; Li, H.; Randall, R.B. Optimised spectral kurtosis for bearing diagnostics under electromagnetic interference. Mech. Syst. Signal Process. 2016, 75, 371–394. [Google Scholar] [CrossRef] [Green Version]
  7. Zheng, J.; Wang, X.; Pan, H.; Tong, J.; Zhang, J.; Liu, Q. The traverse Symplectic Correlation-Gram (TSCgram): A new and effective method of optimal demodulation band selection for rolling bearing. IEEE Trans. Instrum. Meas. 2021, 70, 3512915. [Google Scholar] [CrossRef]
  8. Osman, S.; Wang, W. A morphological Hilbert-Huang transform technique for bearing fault detection. IEEE Trans. Instrum. Meas. 2016, 65, 2646–2656. [Google Scholar] [CrossRef]
  9. Areias, I.A.S.; da Silva, L.E.B.; Bonaldi, E.L.; de Lacerda de Oliveira, L.E.; Lambert-Torres, G.; Bernardes, V.A. Evaluation of current signature in bearing defects by envelope analysis of the vibration in induction motors. Energies 2019, 12, 4029. [Google Scholar] [CrossRef] [Green Version]
  10. Sohaib, M.; Kim, J.-M. Fault diagnosis of rotary machine bearings under inconsistent working conditions. IEEE Trans. Instrum. Meas. 2020, 69, 3334–3347. [Google Scholar] [CrossRef]
  11. Niu, Y.; Fei, J. A sparsity-assisted fault diagnosis method based on nonconvex sparse regularization. IEEE Access 2021, 9, 59027–59037. [Google Scholar] [CrossRef]
  12. Chen, Z.; He, C.; Liu, Y.; Lu, S.; Liu, F.; Li, G. Incipient fault feature extraction of rolling bearing based on optimized singular spectrum decomposition. IEEE Sens. J. 2021, 21, 20362–20374. [Google Scholar] [CrossRef]
  13. Samanta, A.K.; Routray, A.; Khare, S.R.; Naha, A. Minimum distance-based detection of incipient induction motor faults Using Rayleigh quotient spectrum of conditioned vibration signal. IEEE Trans. Instrum. Meas. 2021, 70, 3508311. [Google Scholar] [CrossRef]
  14. Lu, Y.; Wang, Z.; Zhu, D.; Gao, Q.; Sun, D. Bearing fault diagnosis based on clustering and sparse representation in frequency domain. IEEE Trans. Instrum. Meas. 2021, 70, 3513914. [Google Scholar] [CrossRef]
  15. Sun, Y.; Yu, J. Adaptive k-sparsity-based weighted Lasso for bearing fault detection. IEEE Sens. J. 2022, 22, 4326–4337. [Google Scholar] [CrossRef]
  16. Lv, M.; Liu, S.; Chen, C. A new feature extraction technique for early degeneration detection of rolling bearings. IEEE Access 2022, 10, 23659–23676. [Google Scholar] [CrossRef]
  17. Immovilli, F.; Bellini, A.; Rubini, R.; Tassoni, C. Diagnosis of bearing faults in induction machines by vibration or current signals: A critical comparison. IEEE Trans. Ind. Appl. 2010, 46, 1350–1359. [Google Scholar] [CrossRef]
  18. Weiming, M. Thoughts on the development of frontier technology in electrical engineering. Trans. China Electrotech. Soc. 2021, 36, 4627–4636. [Google Scholar]
Figure 1. Test rig: (a) platform and (b) acquisition device and sensors.
Energies 16 00699 g001
Figure 2. Faulty bearings (6202) with outer race defects: (a) 1 mm wide groove and (b) 3 mm wide groove.
Energies 16 00699 g002
Figure 3. Faulty bearings (6206) with cage defects: (a) one gap and (b) two gaps.
Energies 16 00699 g003
Figure 4. Resonant demodulated spectra of the vibration acceleration signal of the Y100L-2 motor with a full load: (a) healthy; (b) slight outer race fault; (c) severe outer race fault.
Energies 16 00699 g004
Figure 5. Resonant demodulated spectra of the vibration acceleration signal of the Y100L2-4 motor with a full load: (a) healthy; (b) slight cage fault; (c) severe cage fault.
Energies 16 00699 g005
Table 1. Evaluation criteria for small IMs.
V (mm/s)Condition
1.80 < V ≤ 4.50Acceptable
V > 4.50Unacceptable
Table 2. Rated values and bearing types of tested motors.
Motor TypePn (kW)Un (V)In (A)Nn (r/min)Bearing Type
Y100L-233806.1228806206
Y100L2-433806.8014306206
Y132M-47.538015.4014406308
Table 3. Structural parameters of tested bearings.
Bearing TypePitch Diameter (mm)Ball Diameter (mm)Ball NumberContact Angle
(°)
6206469.52590
63086518.0180
Table 4. Bearing outer race fault diagnosis results of the Y100L-2 motor with a full load.
StatusKu (mm)V (mm)Characteristic Components
fouter (Hz)Amplitude (g)
Healthy3.14.08174.650.006
Slight fault5.97.83174.401.46
Severe fault7.610.41174.225.42
Table 5. Bearing outer race fault diagnosis results of Y100L-2 motor with a half load.
StatusKu (mm)V (mm)Characteristic Components
fouter (Hz)Amplitude (g)
Healthy2.94.01175.780.005
Slight fault5.87.86177.001.85
Severe fault7.810.17176.784.01
Table 6. Bearing outer race fault diagnosis results of the Y100L2-4 motor with a full load.
StatusKu (mm)V (mm)Characteristic Components
fouter (Hz)Amplitude (g)
Healthy3.11.9586.670.002
Slight fault57.32.9386.890.55
Severe fault19.59.9487.781.34
Table 7. Bearing outer race fault diagnosis results of the Y100L2-4 motor with a half load.
StatusKu (mm)V (mm)Characteristic Components
fouter (Hz)Amplitude (g)
Healthy3.01.5887.610.001
Slight fault66.22.7187.560.69
Severe fault18.98.7888.551.19
Table 8. Bearing outer race fault diagnosis results of the Y132M-4 motor with a full load.
StatusKu (mm)V (mm)Characteristic Components
fouter (Hz)Amplitude (g)
Healthy2.84.6270.220.002
Fault3.04.8370.220.023
Table 9. Bearing cage fault diagnosis results of the Y100L2-4 motor with a full load.
StatusKu (mm)V (mm)Characteristic Components
fouter (Hz)Amplitude (g)
Healthy3.11.959.890.0001
Slight fault3.02.079.890.0035
Severe fault3.12.459.670.0037
Disclaimer/Publisher’s Note: The statements, opinions and data contained in all publications are solely those of the individual author(s) and contributor(s) and not of MDPI and/or the editor(s). MDPI and/or the editor(s) disclaim responsibility for any injury to people or property resulting from any ideas, methods, instructions or products referred to in the content.

