Article

Assessing the Future wind Energy Potential in Portugal Using a CMIP6 Model Ensemble and WRF High-Resolution Simulations

1
Centre for the Research and Technology of Agro-Environmental and Biological Sciences (CITAB)—Department of Physics, Universidade de Trás-os-Montes e Alto Douro (UTAD), 5000-801 Vila Real, Portugal
2
Centre for Environmental and Marine Studies (CESAM)—Department of Physics, University of Aveiro, Campus Universitário de Santiago, 3810-193 Aveiro, Portugal
*
Author to whom correspondence should be addressed.
Energies 2023, 16(2), 661; https://doi.org/10.3390/en16020661
Submission received: 2 November 2022 / Revised: 20 December 2022 / Accepted: 1 January 2023 / Published: 5 January 2023
(This article belongs to the Topic Solar and Wind Power and Energy Forecasting)

Abstract

:
Future wind energy potential over Portugal is assessed, using wind speed data from a WRF regional simulation under the SSP5-8.5 scenario for 2046–2065 and 2081–2100. Data from a CMIP6 multi-model ensemble were also used to assess future changes in the Euro-Atlantic large-scale circulation. CMIP6 results have shown a southward displacement of the mid-latitude jet stream during winter, and a northward displacement during spring, summer, and autumn, which causes the northern winds to strengthen during summer along the north-western Iberian coast. Furthermore, in 2046–2065 the wind power density (WPD) should increase between 25% and 50% off the northwest coast of Portugal and in the Serra da Estrela mountain range during summer, which is in agreement with the CMIP6 global ensemble projections. Analyses of WPD’s 2046–2065 daily variability of offshore north-western Portugal reveal a variability increase during winter, spring and summer, as well as more intense extreme WPD events, and less intense extreme events during autumn. The WPD’s 2046–2065 inter-annual variability should increase off the northwest coast, and decrease along the central western and southern coasts, whereas it should increase in the entire studied area in 2081–2100, apart from the northern mountain regions and Cape Raso.

1. Introduction

As changes in the global climate and their negative impacts become increasingly noticeable worldwide, the reduction of greenhouse gas (GHG) emissions is, more than ever, urgent to mitigate even worse climate changes in the future. Aiming to reach a 55% reduction in net GHG emissions by 2030, the European Union (EU) has committed to achieve a 45% share of renewable energy sources in its total electricity consumption by that year [1]. Within the scope of the EU directives, Portugal has created its own National Climate and Energy plan (PNEC 2030), which establishes a greater target of a 47% share of renewable energy sources in its total electricity consumption by 2030 [2]. Among the EU states, Portugal is one of the best-positioned countries to achieve the 2030 targets. In 2020, this country consumed 50.78 TWh of electricity [3], from which the share of renewable energy in gross final energy consumption reached 34%, making it the 9th best EU country in this matter [4]. Still, 18.91 TWh of electricity was produced through fossil fuels, and approximately 3% of the electricity consumed was imported from other countries [3]. Therefore, there is still a long way to go to achieve the PNEC 2030 target.
Of all the installed capacity Portugal had in 2020, 25% was from wind power [5]. Wind power is the world’s second-biggest renewable energy source in terms of installed capacity, and it has been steadily growing in the last decade, particularly in the Asian Pacific region and Europe [6], and is seen as a reliable substitute for fossil fuels due to the wind turbines’ technological maturity, space efficiency, and comparatively low operating costs. Their environmental impact is quite low [7], as well as their impact on avian species, which depends on factors such as the location of the wind farm relative to migration paths, layout, and the illumination of the wind turbines [8]. Most wind farms (i.e., wind energy production facilities) are built on land, but considerable investments have been made recently in offshore wind farms, since offshore wind energy production benefits from the typically more intense and steady winds over water surfaces (with low roughness coefficients) and, therefore, it is a securer energy source. Still, the wind is highly variable, and because the wind energy potential varies with the wind speed cubed, small variations in the wind flow can cause strong impacts on the wind farms’ power generation [9]. Moreover, considering that wind farms have an average lifetime of 20 to 30 years, electricity production will become increasingly dependent on wind power, and electricity demand will grow in the future, it is essential to study the projected behaviour of the wind in the next decades under different climate change scenarios so that emerging challenges, such as finding the best locations for future wind farms and the repowering of older wind turbines, can be properly addressed in a timely manner [10]. Since energy companies want the best possible stability and profitability, studies should also assess the wind inter- and intra-annual variability [11]. Future wind data used in these studies are grounded on climate projections made by Global Climate Model (GCM) experiments. The climate change projections are based on anthropogenic forcing scenarios defined by the Intergovernmental Panel on Climate Change (IPCC) and are produced under the Coupled Model Intercomparison Project (CMIP), a collaborative climate modelling framework coordinated by the World Climate Research Programme (WCRP), currently in its 6th phase (CMIP6) [12].
Several studies have investigated the wind energy potential in Portugal and the best locations for wind farms. However, most of them were hindcast studies, based on reanalysis data and hindcast simulations. From the few existing studies investigating future wind resource changes in Portugal under climate change scenarios, Ref. [13] assessed the wind energy potential changes during 2041–2070 with wind speed (WS) data from a 20 km resolution COSMO-CLM model simulation. In that study, the authors have identified significant decreases in wind power potential over most of the Iberian Peninsula (IP), except for the Ebro valley and the western IP coast during summer. A northward displacement of the North Atlantic westerly winds during autumn and spring and the intensification of summer easterly winds were also reported. In 2018, Ref. [14] studied the application of EURO-CORDEX regional climate models (RCMs) in the projection of future winds over the IP for the near future, medium-range future and the end of the century, and found a WS and wind power decrease over most of the area, but an increase along the northern coast of Portugal and Galicia, mostly during summer. Additionally, these changes should strengthen with time. More recently, Ref. [15] investigated future wind changes over 26 cities of the IP during the end of the century, for the RCP8.5 scenario, using WRF (Weather Research and Forecasting) model simulations with initial and boundary conditions provided by the MPI-ESM-LR GCM and ERA-Interim reanalysis. A wind intensity reduction in the near-surface and 850 hPa levels was identified, as well as a summertime WS decrease and an increase in the remaining seasons at the 300 hPa level. Increases in the number of extreme wind events in northwestern IP were also identified. Additionally, in 2020, Ref. [16] applied bias-correction methods to future offshore wind energy projections from a EURO-CORDEX multi-model ensemble on the IP, under the RCP8.5 scenario, and investigated future wind power density (WPD) anomalies with the corrected projections. These projections showed annual WPD reductions in most of the western Iberian coast for near, mid and far future periods, except for the northwest coast in the mid and far future. Seasonally, the projections showed WPD increases during summer, along the entire Atlantic coast of the IP, and during winter, near the northwest coast. WPD decreases during spring and autumn were also found throughout the Atlantic coast, and in winter along the southern Atlantic coast.
Since the publication of these studies, CMIP advanced to its 6th phase, and future climate projections are based on updated climate change scenarios, so-called Shared Socioeconomic Pathways (SSP). SSPs are socioeconomic development scenarios used in preparation for the IPCC Sixth Assessment Report (IPCC AR6), associating GHG emissions’ paths until the year 2100 with different climate policies, thereby combining socioeconomic and technological development to more realistically represent societal development. This way, enhanced future climate projections can be produced. There are already some studies on future wind energy resources in different parts of the world based on the CMIP6 models’ projections and SSP scenarios, such as [17], which analysed future wind energy resources over Europe using multi-model ensemble projections. Nevertheless, a more detailed assessment of future wind energy resources over Portugal using the newest climate prediction models and climate change scenarios has not yet been made. Further, the previous studies considered the entire IP, or a specific location within the Portuguese coast, while using model simulations with relatively low spatial resolution. As such, it is necessary to improve the existing research on the future of wind energy in Portugal and the neighbouring North Atlantic Ocean with the newest climate change scenarios and models available, as well as higher spatial resolution simulations.
Hence, this study aims to evaluate the future wind energy potential in Portugal, mainly along the coast, using a WRF RCM simulation with 6 km of spatial resolution, under the SSP5-8.5 scenario, for medium-range and long-range future periods. To validate the dynamical coherency between the WRF simulation and GCM projections over the wider area of the Euro-Atlantic sector, an assessment of the future large-scale atmospheric circulation patterns over the North Atlantic region will also be undertaken for the same periods, using a CMIP6 multi-model ensemble.

2. Materials and Methods

2.1. Future Climate Projections

The future wind energy fluxes over the Portuguese coast and mainland under climate change were studied for the SSP5-8.5 scenario. This scenario assumes that socioeconomic development will continuously be based on fossil fuels throughout the century, leading to an energy-intensive lifestyle that allows for rapid technological and economic progress. Consequently, the environment will deteriorate rapidly, whilst the global population will begin to decline. The SSP5-8.5 scenario projects a radiative forcing of 8.5 W/m2 by 2100, which yields a global mean air temperature increase of 4.2 °C by the end of the century, relative to the 1850–1900 period [18].
The present study was divided into two parts. Firstly, using CMIP6 GCM projections, large-scale circulation changes over the North Atlantic were evaluated for 20-year medium-range and long-range future periods, relative to a 20-year reference period. For this purpose, daily sea level pressure (SLP) data, as well as daily WS data at the 10 m, 500 hPa and 250 hPa vertical levels, were downloaded through the Earth System Grid Federation (ESGF) data portal (https://esgf-node.llnl.gov/), from an ensemble of six CMIP6 GCMs, as is described in Table 1.
As the GCMs have different spatial resolutions, and they must share the same spatial grid for an ensemble-based evaluation of the future wind anomaly signal, all the models’ data grids were remapped to a common regular grid with 1.125° of horizontal resolution. Upon grid standardisation, all the data were aggregated into a multi-model ensemble (MME), a method that allows for more reliable results than single-model analysis, because it takes into account the model uncertainties. This was shown by several studies that compared single-model and multi-model statistics with observed data, such as [24,25,26].
Secondly, an assessment of WPD changes over mainland Portugal, and its coastal waters, was carried out for the same future periods, using three-dimensional daily WS data from a high-resolution WRF model simulation over this region, with 6 km of horizontal resolution (as described in Table 2), and initial and boundary conditions taken from the Max Planck Institute for Meteorology Earth System Model version 1.2 (MPI-ESM1.2-HR), part of the CMIP6 model collection. The selected 20-year periods are the same used in the IPCC AR6, i.e., 1995–2014, as the historical reference period; 2046–2065, as the medium-range future period; and 2081–2100, as the long-range future period.

2.2. Future Changes in Large-Scale Atmospheric Circulation over the North Atlantic

Before calculating the SLP and WS future anomalies, a validation of the simulated historical period data from all the CMIP6 models is needed to assess their ability to realistically represent the past wind climate over the North Atlantic during 1995–2014. To validate the CMIP6 models, ERA5 reanalysis data from the same period was used to calculate the overlap percentage (OP) and median differences between the CMIP6 ensemble SLP/WS and ERA5 SLP/WS data. The overlap between two data sets is defined as the size of their intersection divided by the size of the smallest data set [28].
As can be seen in Figures S1 and S2 (Supplementary Material), calculations have shown that the WS median differences at the 10 m level are lower than 1 m/s at most of the North Atlantic and the IP. At the 500 hPa level, WS median differences reach more than 2 m/s in the Northwest Atlantic region between latitudes 30° N and 40° N. At 250 hPa, WS median differences in the North Atlantic vary between 1 m/s and 3 m/s. The WS OP at the 10 m level reaches values between 60% and 80% in the majority of the North Atlantic. Rising in altitude, the WS OP values increase, and at 250 hPa OP values reach more than 90% in some North Atlantic regions below 40° N. Relative to SLP, Figure S3 shows that the median differences in the North Atlantic do not surpass 2 hPa and the OP is 100% in the entire studied area. Since in most of the North Atlantic the WS and SLP OP values are high, and the WS median differences observed are small compared to the wind speeds achieved at each level, we concluded that the CMIP6 models considered can realistically represent the wind climate and sea level pressures over the North Atlantic Ocean, and thus they were used in the next stages of this study.
After the models’ validation, the WS data were converted to kinetic energy per unit mass (KE, m2/s2) using Equation (1):
K E = 1 2 · W S 2
where WS is the wind speed. All the data were then grouped into an ensemble and the monthly median values of SLP and KE were calculated. Subsequently, the time series were divided into seasons, to identify future changes in intra-annual variability. The ensemble median of the 20-year monthly median values of each season was calculated. With the median values of each season for the three time periods, the differences between the future and reference periods were estimated. To evaluate their statistical significance, the Mann–Whitney non-parametric test was performed. This test evaluates the null hypothesis of two data samples (i.e., monthly median values from a certain season, for the future and reference periods) belonging to continuous distributions with equal medians, at a 5% significance level.

2.3. Future Changes in Wind Energy Potential over Portugal and Its Coastal Waters

The validation of the historical period data generated by the WRF RCM was required before any further analysis could be carried out. The validation consisted of calculating the median differences and OP between the historical period data, simulated with initial and boundary conditions provided by the MPI-ESM1.2-HR model, and another set of historical data from the same period, simulated with initial and boundary conditions from ERA5 reanalysis. Calculations have shown, across all Portuguese territory and nearby ocean, median differences lower than 0.8 m/s, and OPs higher than 90%, as can be seen in Figure S4, respectively. Therefore, the WRF model can realistically simulate the wind over Portugal and the Atlantic Ocean, thus enabling its application in the forthcoming analysis. To assess the future changes in wind energy potential over Portugal and its coastal waters, the WPD was calculated using Equation (2):
W P D = 1 2 · ρ · W S 3
where ρ is the air density (1.225 kg/m3 at 288.15 K and 1013.25 hPa). This value is a function of the virtual temperature at a constant pressure level and can be considered invariant for the present study purposes. W S is the wind speed at 100 m height, which was chosen because most of the wind turbines available today have a hub height of around 100 m. However, it should be mentioned that there are already wind turbines with a higher hub height, and it is expected that, until the end of the century, hub heights will continuously increase. Therefore, considering that within the planetary boundary layer the wind speed sharply increases with elevation, the WPD projections analysed herein underestimate the real WPD that could be harvested by wind turbines in the future.
Since there were no WS data available for the 100 m level, to obtain 100 m WS values it was necessary to interpolate the data from the nearest levels below and above 100 m. With the WS data converted to WPD, similar statistical methods to those mentioned in Section 2.2 were applied: seasonal median values of 100 m WPD were calculated for the entire 20-year periods, as well as absolute and relative differences between the future and reference periods. Then, the Mann–Whitney non-parametric test was performed to assess the statistical significance of the differences. WPD empirical distributions of the 20-year daily variability for each season were also studied over an ocean area off the coast of Viana do Castelo (north-western Portugal, shown in Figure 1), for the medium-range future period.
This area was chosen because it is where the single offshore wind farm currently running in Portugal, known as WindFloat Atlantic [29], is located, 20 km off the coast of Viana do Castelo. Therefore, it is important to evaluate how the wind farm’s productivity may be affected in the future. The future inter-annual variability of WPD was also assessed by analysing the anomalies in the inter-quartile range (i.e., the difference between the 75th and the 25th percentiles) of the WPD 20-year annual mean values. Alongside WPD, future anomalies in the wind direction were also calculated, using zonal and meridional wind components. The 20-year median direction in each season was calculated and the wind direction differences between the reference and future periods were eventually determined. An evaluation of the statistical significance of the wind direction anomalies with the Mann–Whitney non-parametric test was also performed.

3. Results and Discussion

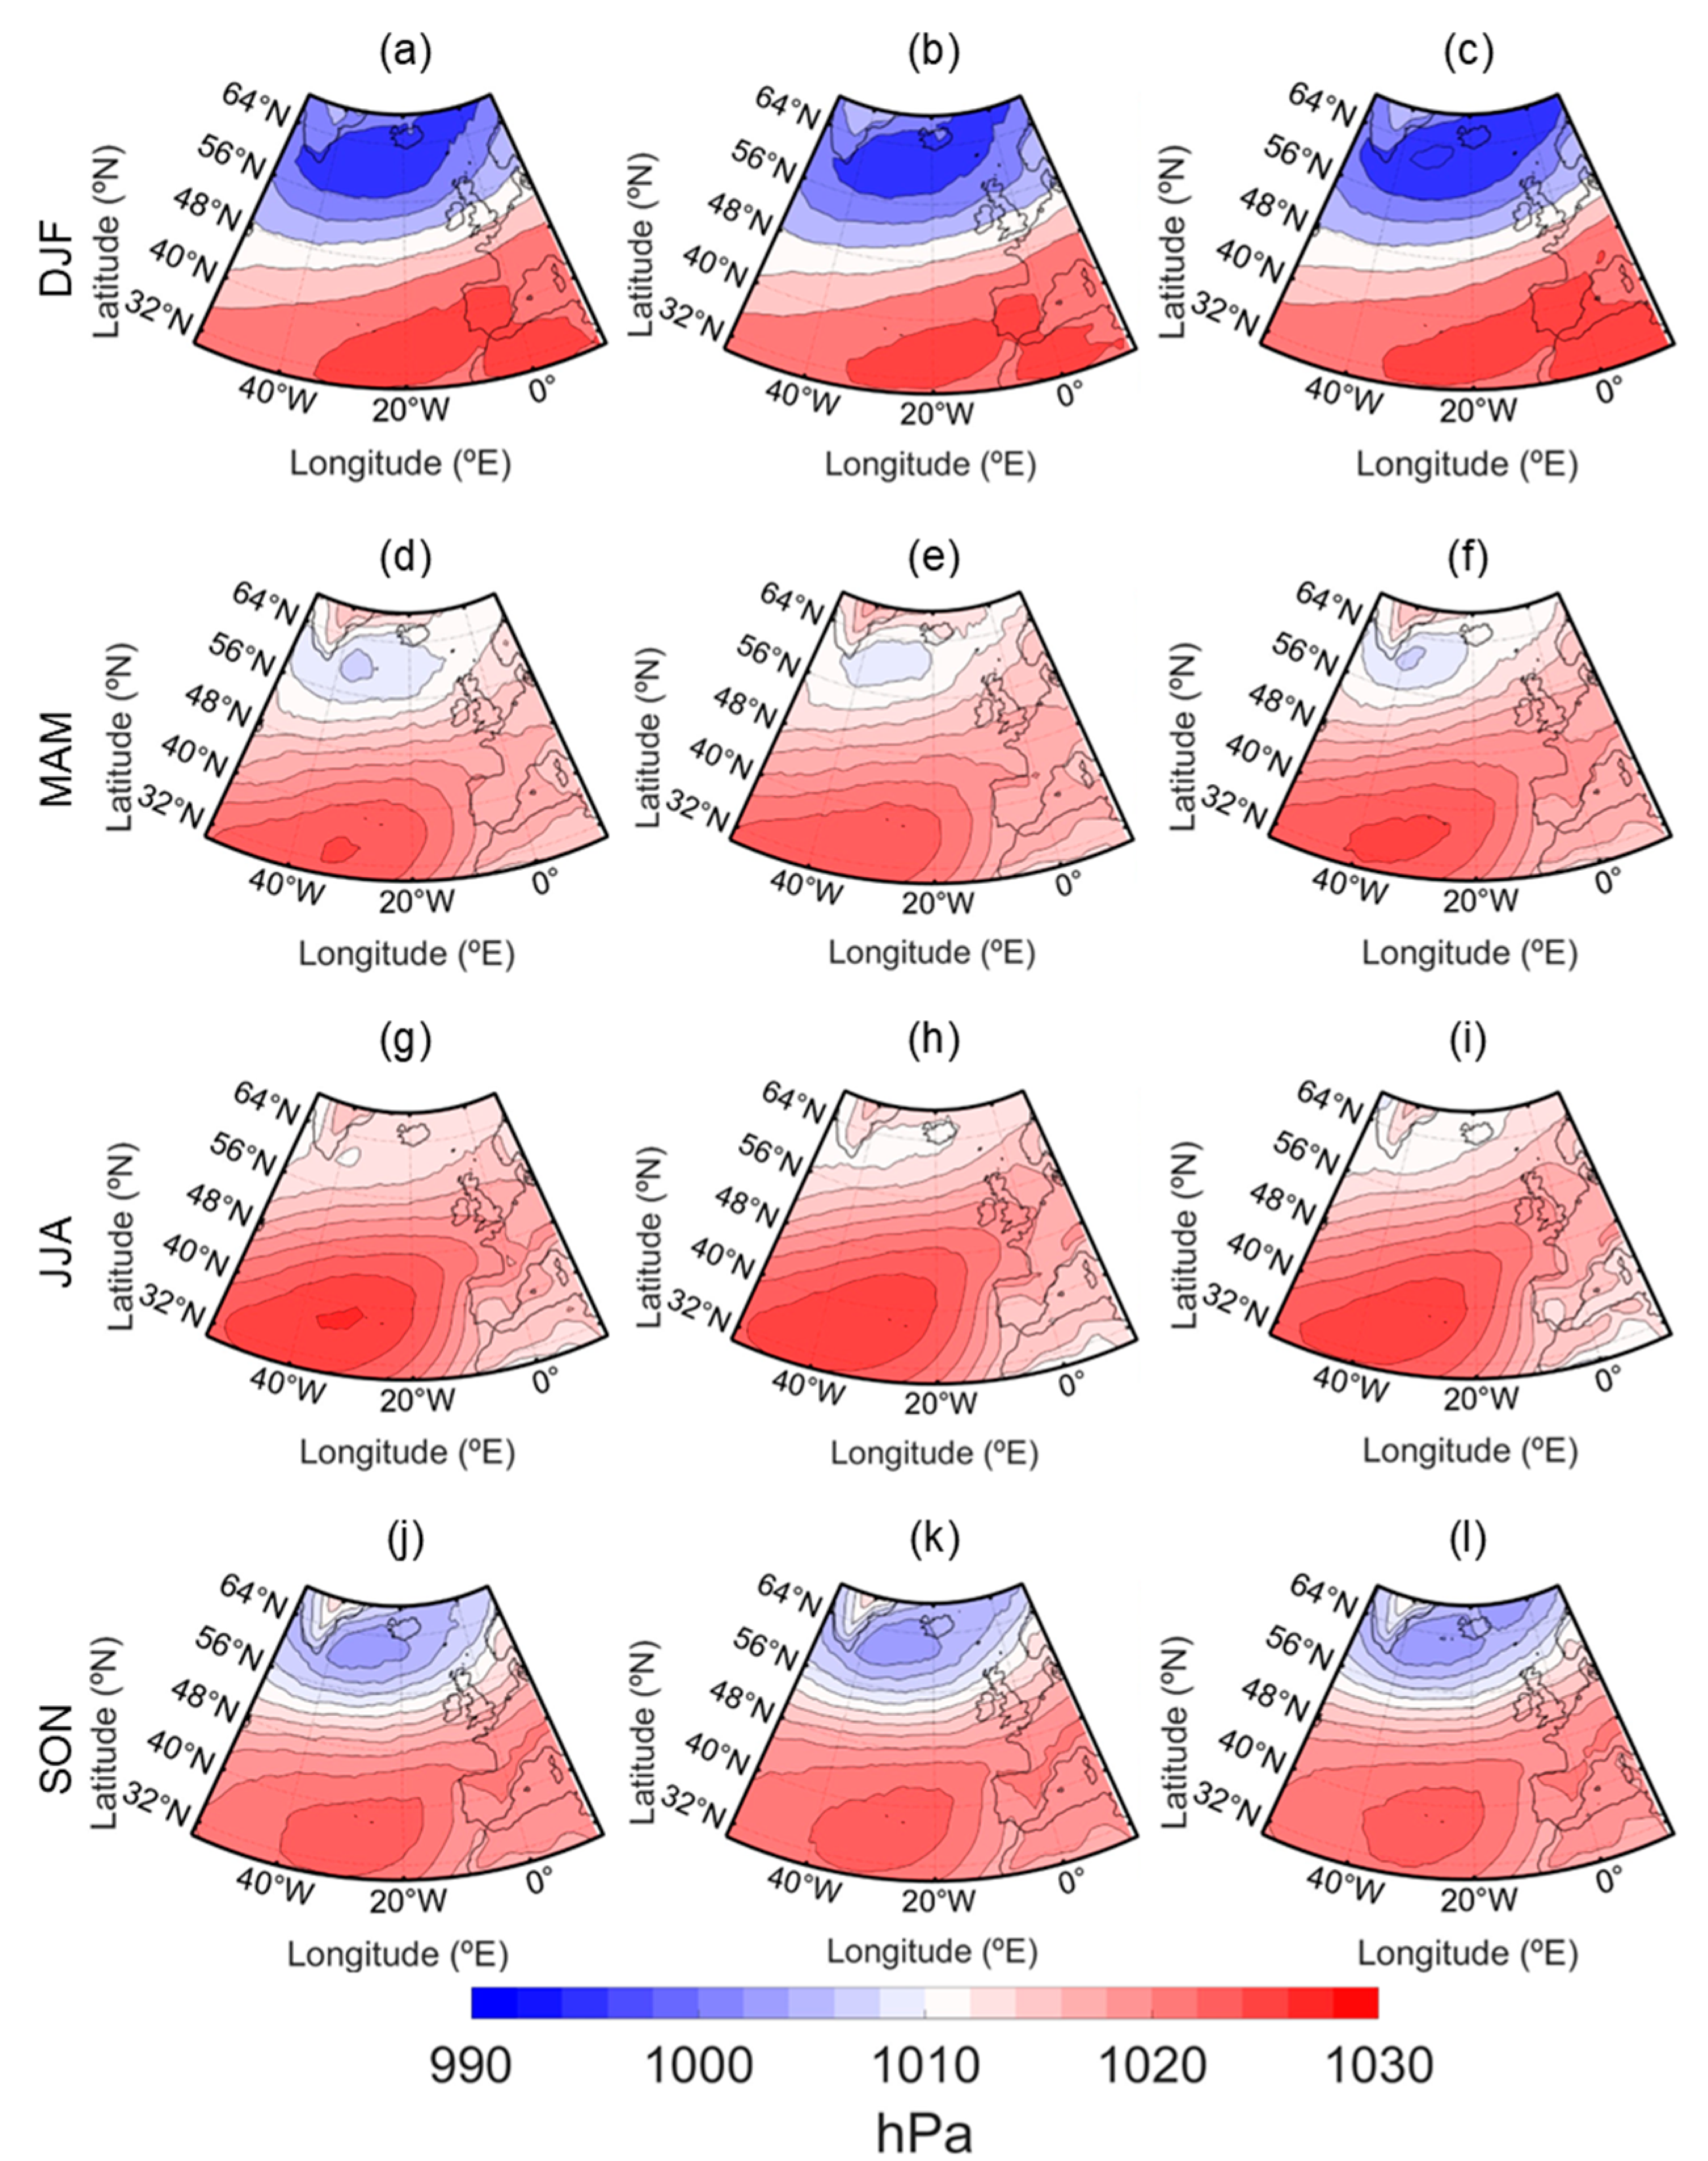
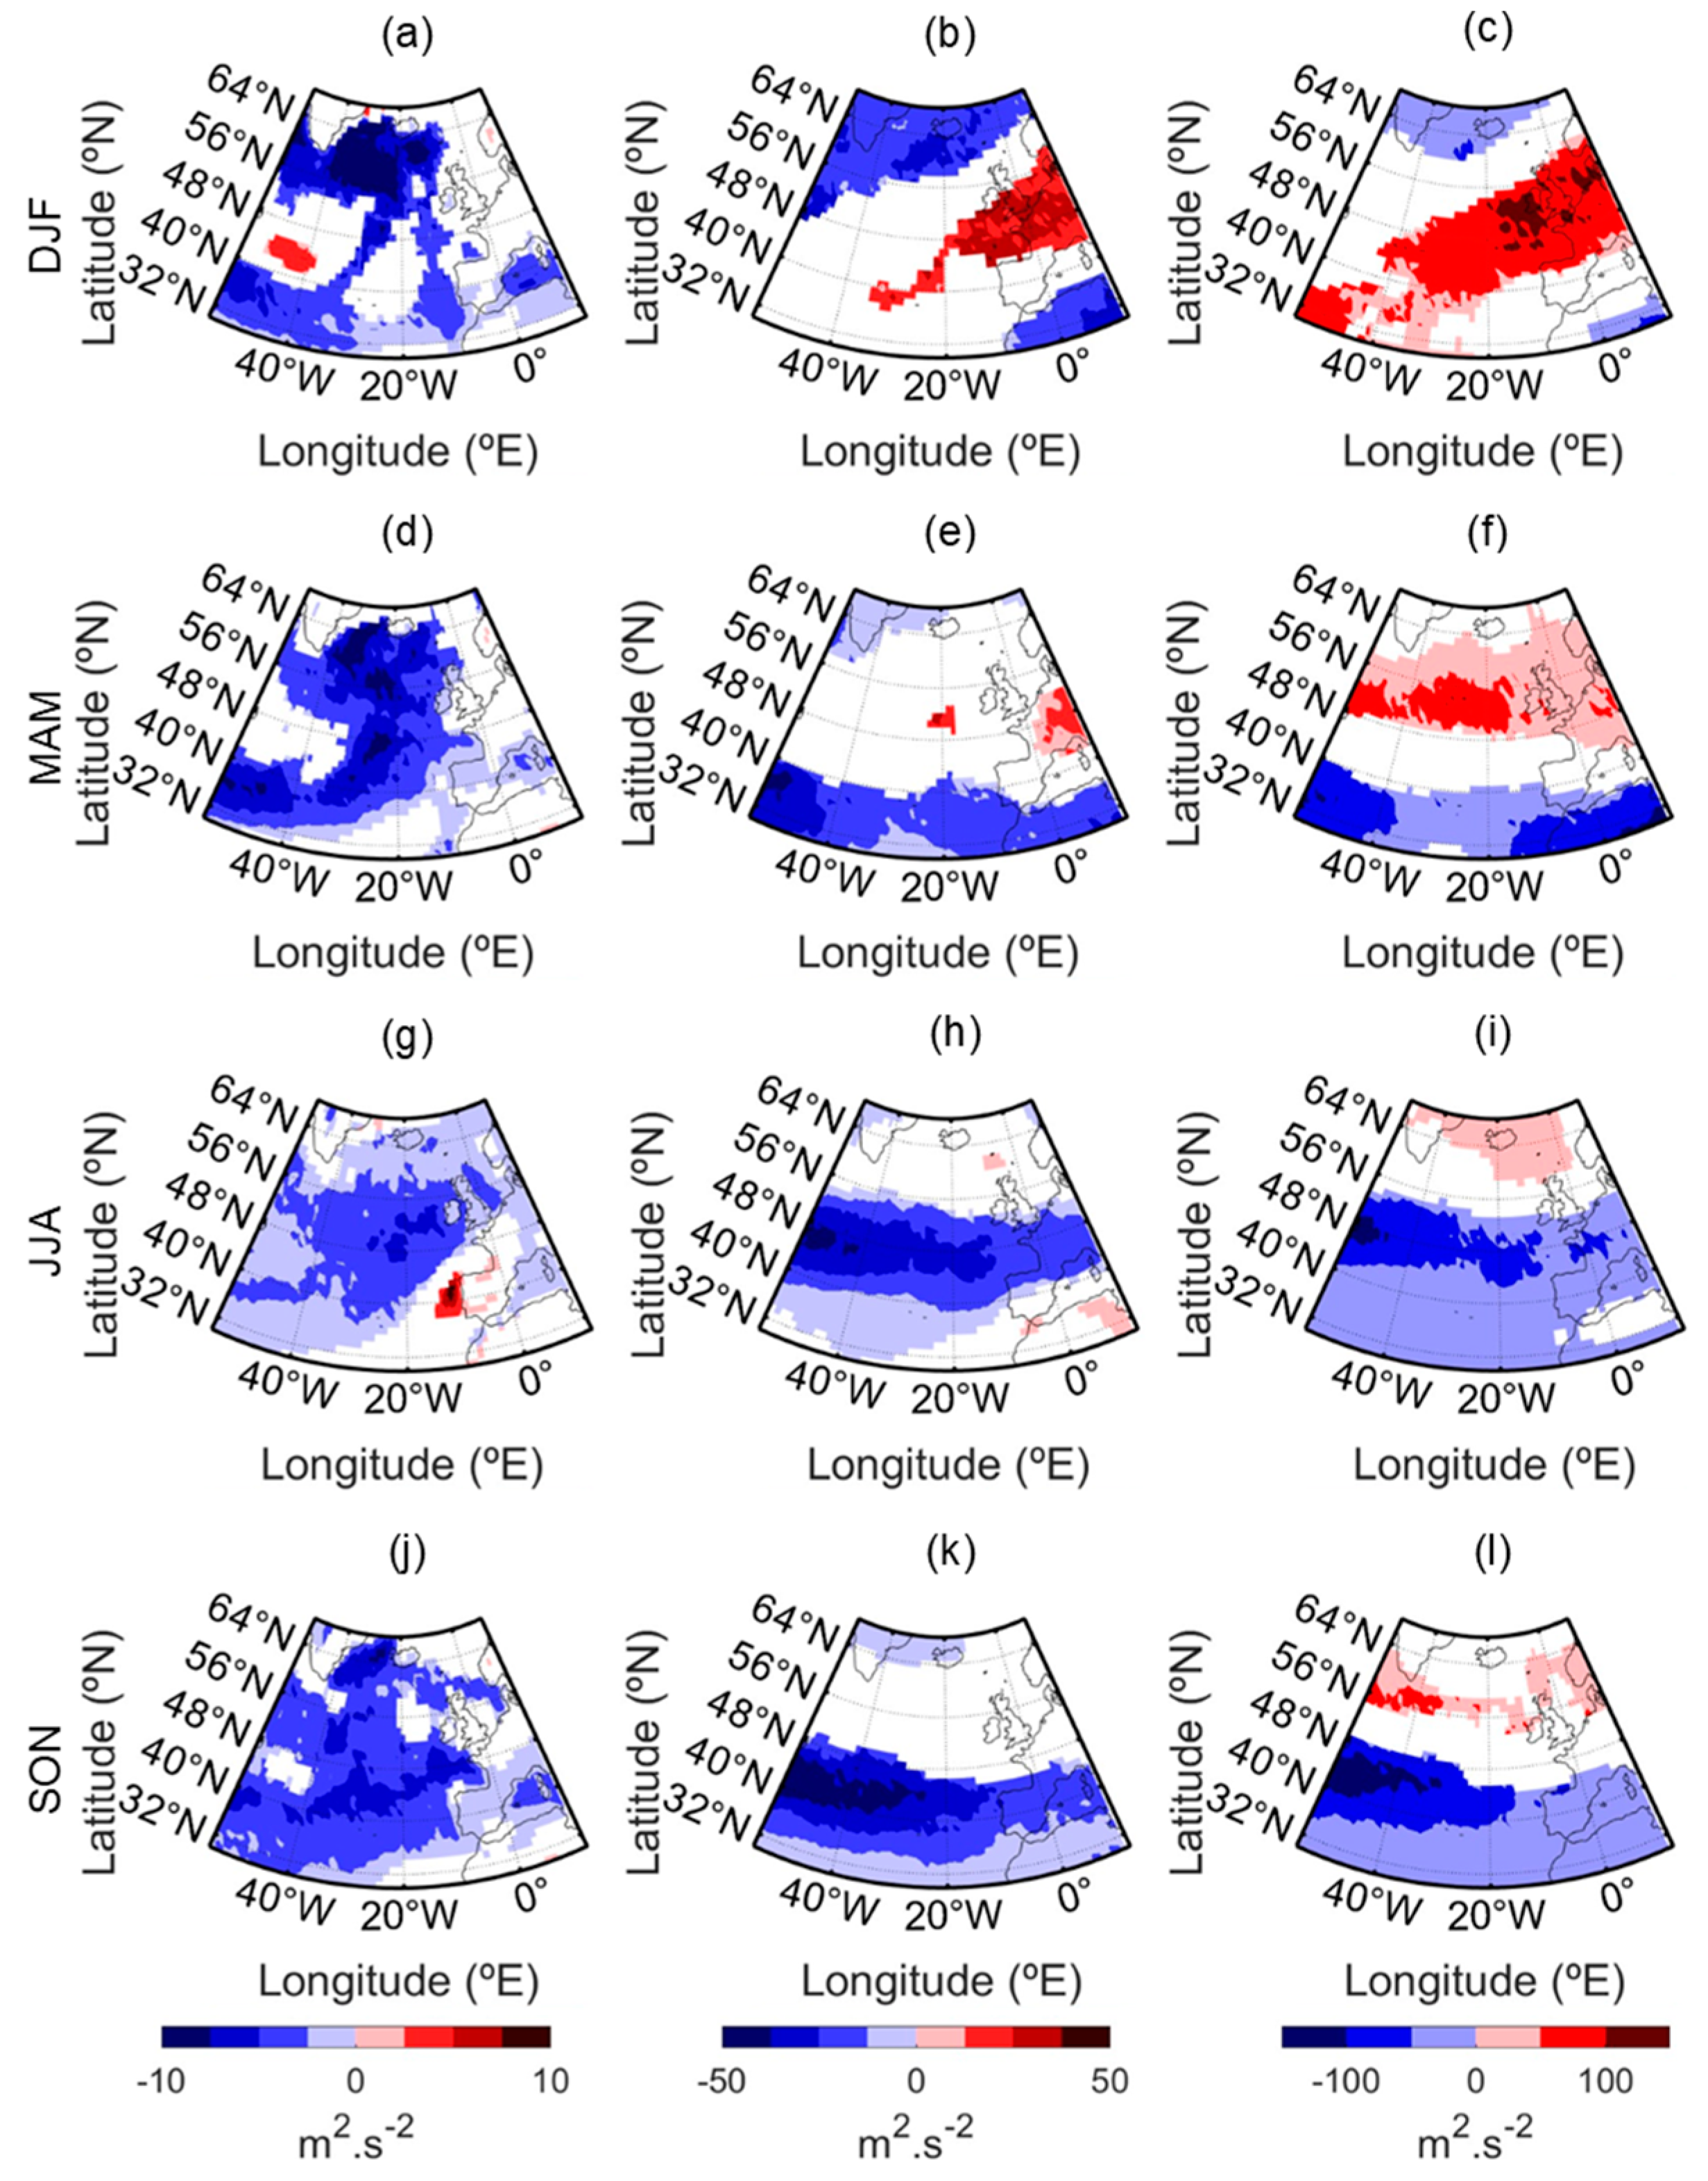
3.1. Future Changes in the Large-Scale Atmospheric Circulation over the North Atlantic Ocean

Figure 2 represents the seasonal median values of SLP over the Euro–Atlantic region for the reference period (1995–2014, left column), and future periods (2046–2065, middle column; 2081–2100, right column).
For the middle of the century, CMIP6 projections show a slight southward expansion of the Icelandic Low (IL) during winter, over Northern Europe, and a slight northward expansion of the Azores High (AH) during spring, summer, and autumn. A decrease in SLP at the AH centre during spring and summer, as well as an increase at the IL centre during spring, are also apparent. A closer inspection over the northern IP reveals a decrease in SLP during winter, due to a gathering of the higher pressures over the southern regions of the peninsula, accompanied by an expansion of higher pressures to the Gulf of Biscay and the Basque Country during spring. As for summer and autumn, the IP pressure distribution pattern remains similar to the reference period.
At the end of the century, during winter, the IL not only extends southwards but also eastwards, as does the AH. The southward IL expansion does not go as far as in the middle of the century. During autumn, the AH expands northwards, further than in the middle of the century, while during spring a northeast displacement is found over northern IP, western France, and the British Isles. In summer, the AH expands north-eastwards, over the British Isles and Scandinavia, but there is also a pressure decrease over the Mediterranean, the IP, and the AH centre. Considering these projections, the jet stream should be positioned further north during spring, summer and autumn, and further south during winter. Therefore, more intense winds should occur over Northern Europe during spring, summer and autumn, and over Central Europe during winter.
Figure 3 represents the seasonal median values of KE over the Euro–Atlantic region for 1995–2014, at 10 m, 500 hPa and 250 hPa levels.
At all levels, KE is larger during autumn and winter, when the mid-latitude isobars are closer to each other, thus with higher wind intensity. Looking closer at the IP’s western coast at the 10 m level, the KE is also higher during winter, particularly on the north-western coast. Hence, KE decreases in spring, and stabilizes during summer, until it decreases again in autumn. At the 250 hPa level, the location of the jet stream and its displacement between seasons is clear. During winter and spring, the jet stream’s core stays southwards of the 48° N parallel, while it stays northwards of 48° N during summer and autumn. In addition, the jet stream extends further east during the winter and autumn seasons.
Figure 4 represents the absolute anomalies of the seasonal median KE for 2046–2065, relative to 1995–2014, at the 10 m, 500 hPa and 250 hPa levels.
At the 10 m level, during all seasons, the anomalies are mostly negative and occur over the areas with higher KE in the reference period, in the Mediterranean and the Strait of Gibraltar. The negative anomalies at 10 m are stronger in winter and spring. Alongside the negative anomalies, there is also a positive anomaly north-westwards of the IP during summer, with values between 2.5 and 5.0 m2/s2. This anomaly demonstrates an intensification of the northerly wind regime, typical in this region during summer, which is driven by the northward displacement of the jet stream, thus inducing stronger north-easterly/easterly winds towards the Gulf of Biscay and the northern Iberian coast, sheltered by the Cantabrian Mountain Range, then circumventing the extreme northwest of the peninsula and leading to the north-westerly/northerly flow along the western coast.
At the 500 hPa and 250 hPa levels, during winter, there are large negative anomalies over the majority of the higher latitudes, along with positive anomalies over the Gulf of Biscay, Northern Spain, and France. During summer, the opposite occurs: negative anomalies cover the mid-latitudes, while smaller positive anomalies occur over the North Atlantic, between Scotland, Iceland and Norway. As for spring and autumn, the anomalies are mostly negative but limited to much smaller areas than those in winter and summer. Once again, the projections showed that, during 2046–2065, the jet stream should be positioned further south during winter and further north during summer.
Figure 5 represents the absolute anomalies of the seasonal median KE for 2081–2100, relative to 1995–2014, at the 10 m, 500 hPa and 250 hPa levels.
As in the 2046–2065 period, the anomalies at 10 m height are mostly negative, but cover a much larger area and are stronger than the anomalies in that period. In all seasons, the negative anomalies occur in almost the entire North Atlantic region. During winter and spring, they reach values of at least −10 m2/s2 at locations between Greenland, Iceland and the British Isles. There are also positive anomalies of about 2.5 to 5.0 m2/s2 in winter between the Azores and Newfoundland, whereas in offshore western IP in summer positive anomalies reach 10 m2/s2 or higher. There are also some weaker positive anomalies over the northern and southern IP.
In winter, at 500 hPa and 250 hPa, there are negative anomalies over North Africa and the subpolar regions, and major positive anomalies across the mid-latitudes. During spring, the negative anomalies over Africa expand to the entire North Atlantic region equatorward of 40° N, whereas the subpolar anomalies now emerge only over Greenland at the 500 hPa level. As for the positive anomalies, they are smaller than in winter, but still cover much of the mid-latitudes at 250 hPa, within the latitude belt 40–64° N.
In summer, at 500 hPa, the major negative anomalies occur between 40° N and 56° N over the Atlantic Ocean and into France, the IP and the British Isles. At 250 hPa, however, while the major anomalies also occur between 40° N and 56° N, the negative anomalies extend further south, reaching North Africa, and are higher than the 500 hPa anomalies. There are also positive anomalies at 500 hPa, over North Africa, the Gibraltar strait and the Faroe Islands, and, at 250 hPa, over Iceland, Greenland and the Norwegian Sea.
During autumn, projections have shown, at 500 hPa, a large band of negative anomalies, between 32° N and 48° N, occurring over the Atlantic Ocean, the IP, North Africa and the Mediterranean. At 250 hPa, this band of negative anomalies also occurs in the same regions. There are also positive anomalies between 56° N and 64° N, over the ocean, Scotland, Northern Ireland, Norway and Denmark.
Therefore, considering the observed projected anomalies for the North Atlantic pressure centres, as well as for the wind’s KE, it is expected that, in the mid-range future, the jet stream should be positioned further south during wintertime and further north during summertime. By the end of the century, it should become even more concentrated in the mid-latitudes during winter, and should also be positioned further north during spring, summer and autumn, although with less intensity during summer.

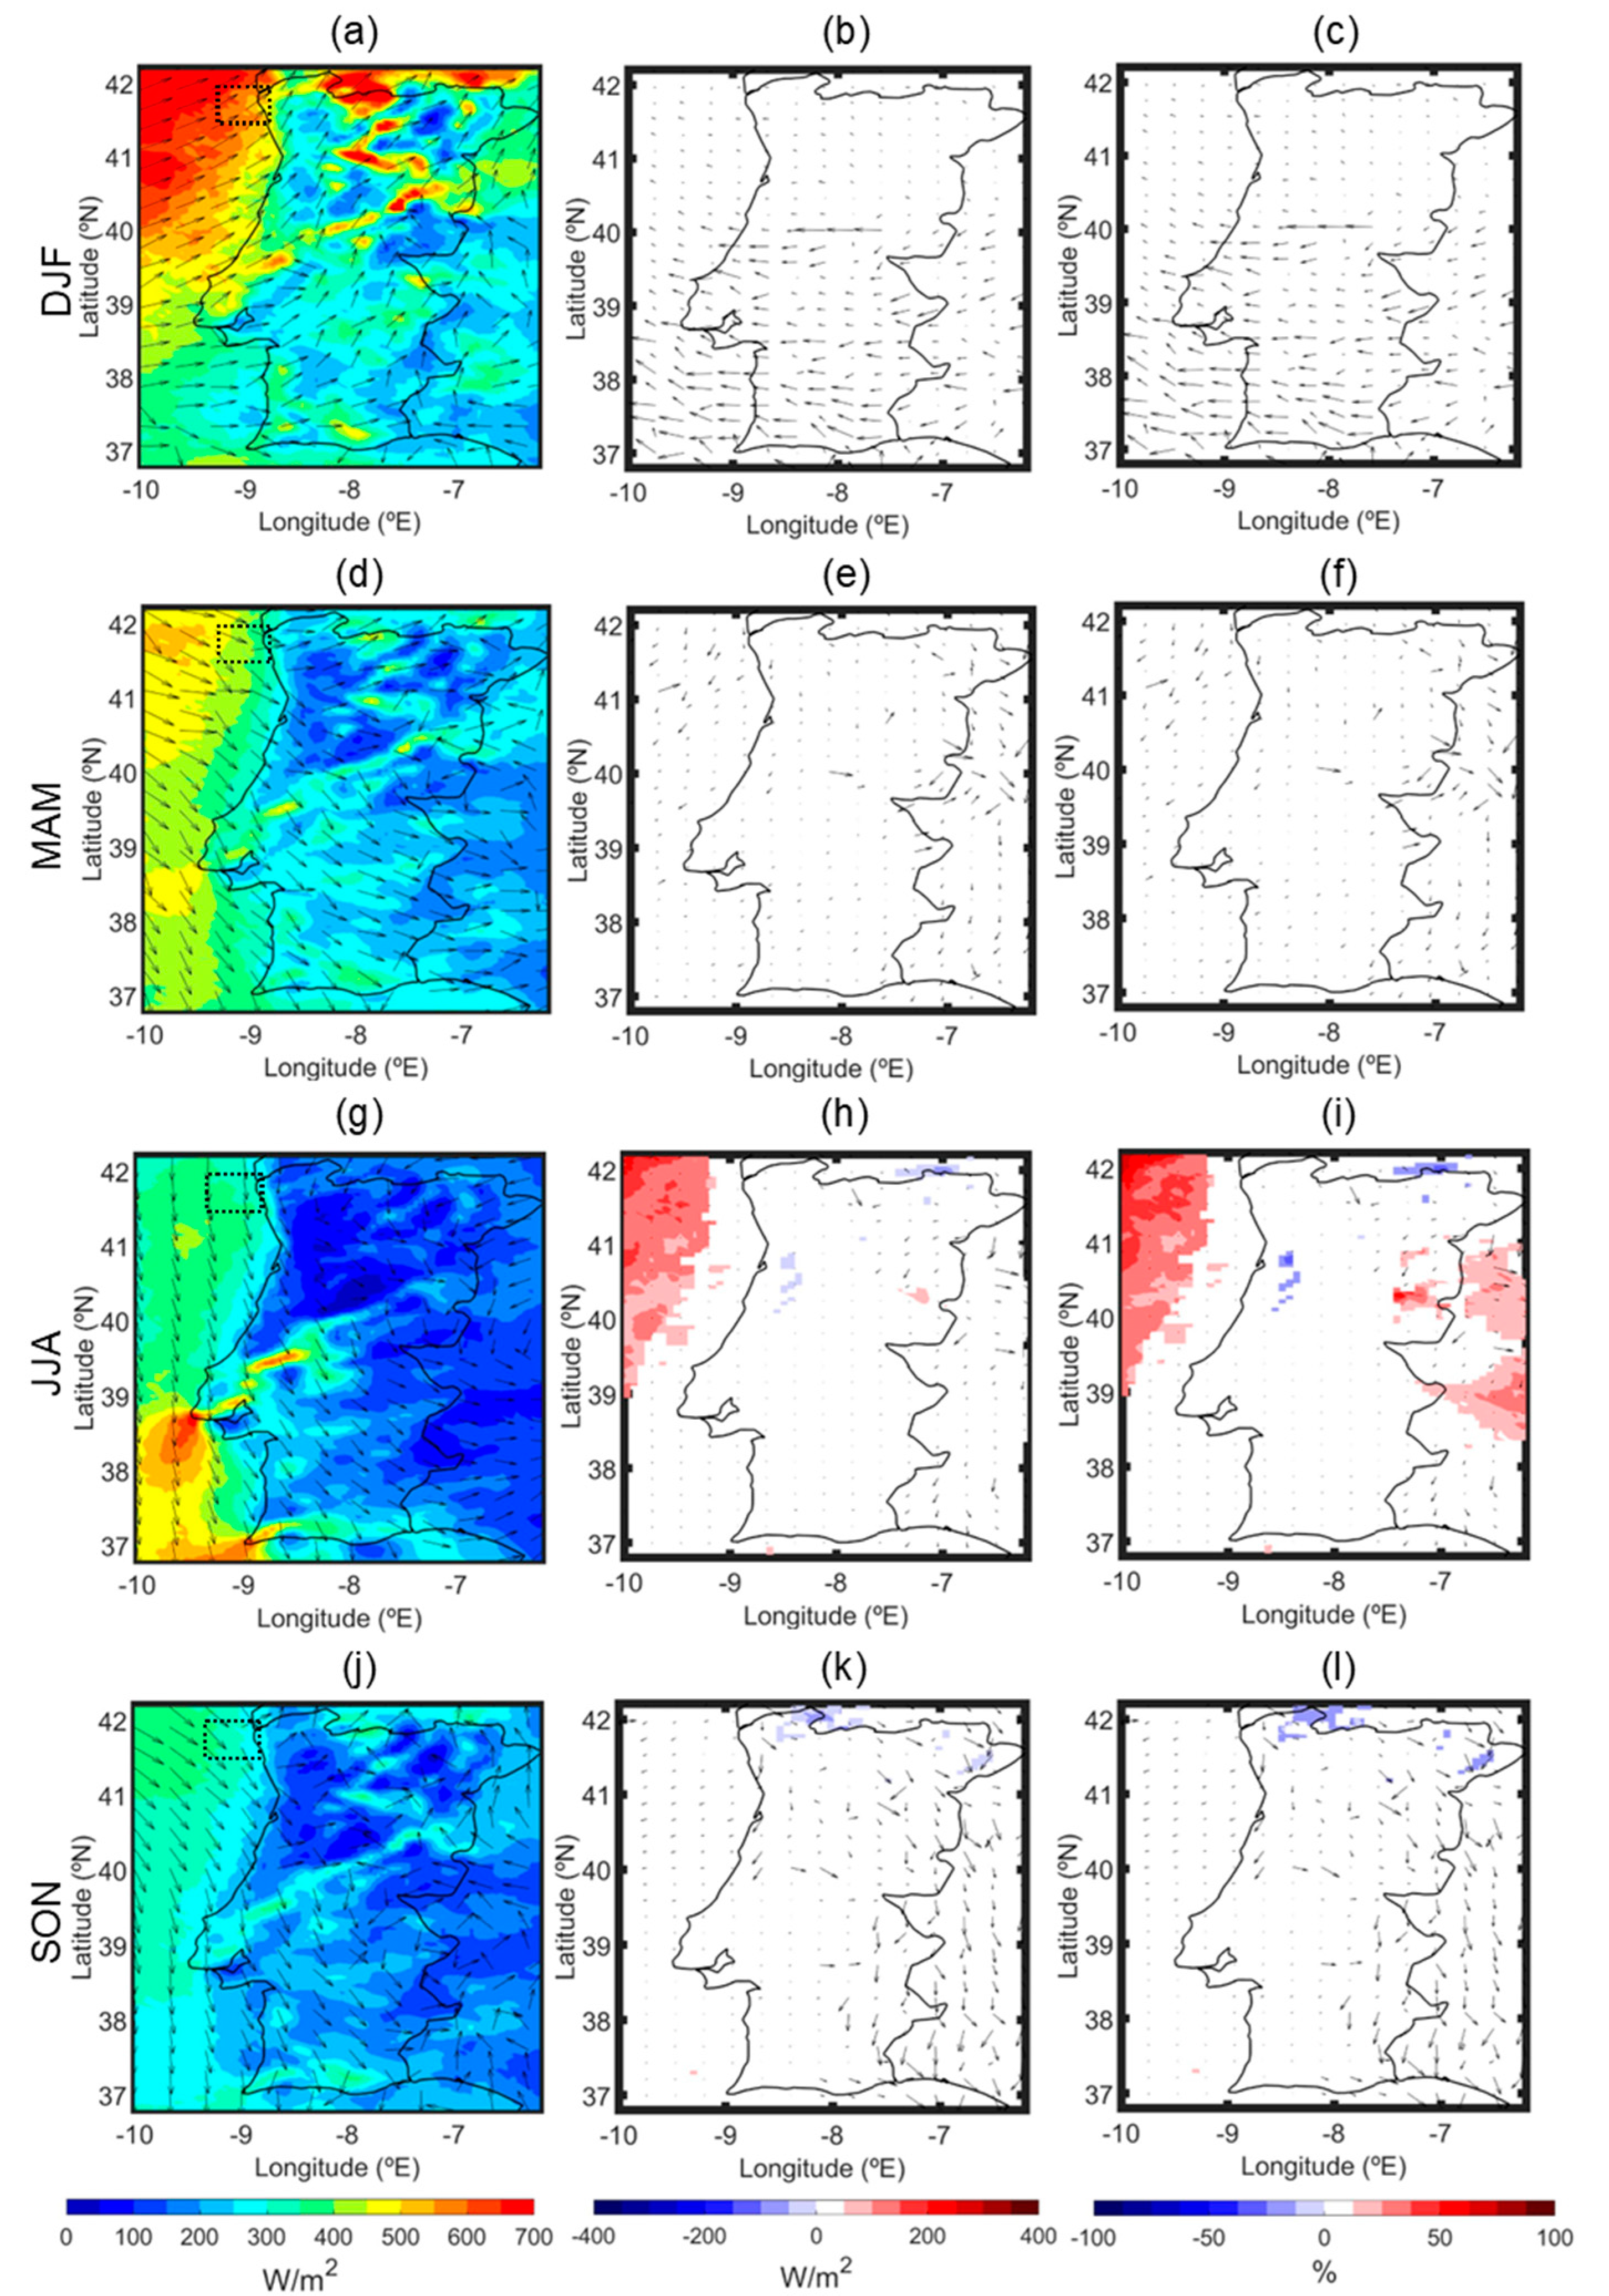
3.2. Future Changes in the Wind Energy Resource over Portugal and the Neighbouring Atlantic Ocean

3.2.1. Seasonal Changes in the 100 m Wind Power Density: Intra-Annual Variability

Figure 6 represents the seasonal median of WPD at 100 m height for 1995–2014 (Figure 6, left column), and corresponding absolute (Figure 6, middle column) and relative (Figure 6, right column) anomalies for 2046–2065, over Portugal and the nearby Atlantic Ocean.
For the reference period, the highest WPD values are found in winter, over the open seas northwest of Portugal, and also in the northern mountain regions. High values of WPD can also be found during summer, around Cape Raso and Cape St. Vincent. During spring and autumn, WPD values are lower, but the maximum values can still be found off the northwest coast and around the same capes. As for the anomalies in the 2046–2065 period, an overall look shows that statistically significant changes in WPD will only occur in the summer season, whereas wind direction anomalies will mainly occur during winter, in the southern half of the studied area. The changes occurring during summer are mainly WPD increases between 25% and 50% over the ocean off the northwest coast of Portugal. Thus, in the middle of the century, the summer winds over this part of the Atlantic should be almost as strong as the winter winds. There is also a WPD increase over the Serra da Estrela Mountain Range.
The wind direction anomalies during winter show a displacement of the wind vectors to the west, meaning that in 2046–2065 the winds over Southern Portugal, which mostly originated from the southwest during the reference period, will mostly come either from the south or southeast, depending on the size of the anomaly in each exact location.
When comparing the WPD 2046–2065 seasonal median absolute anomalies in Figure 6 with the 10 m KE seasonal median absolute anomalies for the same period shown in Figure 4, the summer KE positive anomalies near the IP are in the same location as the summer WPD positive anomalies, northwest of Portugal. Furthermore, similar to the WPD projections, the KE projections show no anomaly over continental Portugal during winter, spring, and autumn, though there are some negative KE anomalies off the south coast in the three seasons. These similarities between the GCM-ensemble and RCM projections highlight their dynamic consistency.
Figure 7 represents the seasonal daily variability of 100 m WPD for 1995–2014 (Figure 7, left side) and 2046–2065 (Figure 7, right side) over an area off the coast of Viana do Castelo (where the WindFloat Atlantic wind farm is located), represented by the dashed line in Figure 6. The changes in the number of extreme WPD occurrences are evaluated through the percentage of WPD values above 5000 W/m2, which is equivalent to a WS of 20 m/s.
Concerning the winter daily variability, which is when WPD is higher in the studied subarea during the reference period, the 2046–2065 projections display an increase in the 75th percentile and the maximum value of the variability range, as well as more extreme WPD values occurring during this season, reaching values above 12,000 W/m2. The median, 25th percentile and minimum values remain similar to the ones in the reference period. During summer, the 75th percentile and maximum value also increase, and the extreme WPD values become higher, reaching around 6000 W/m2, but now occurring fewer times. The median increases slightly. As for spring, the maximum value, the 75th percentile, and the extreme WPD values also increase. During autumn, the daily variability in 2046–2065 is very similar to the daily variability in the reference period, but the extreme values become lower. Both in spring and autumn, the number of extreme WPD occurrences slightly increases.
Overall, in the middle of the century, this offshore region northwest of Portugal may experience a WPD daily variability increase during winter, spring and summer, as well as more extreme WPD events occurring with even higher intensity, although the extreme WPD events are projected to be less intense during autumn. Together with the summertime WPD median increases seen in Figure 6, this could mean higher electricity production for offshore wind farms off the Portuguese northwest coast, yet it could also mean more production shortfalls. Although the anomalies in the number of extreme WPD occurrences are relatively small, the intensity of these events is higher, and therefore the WS can more often exceed the wind turbine’s maximum operating speed (which usually sits at 25 m/s).

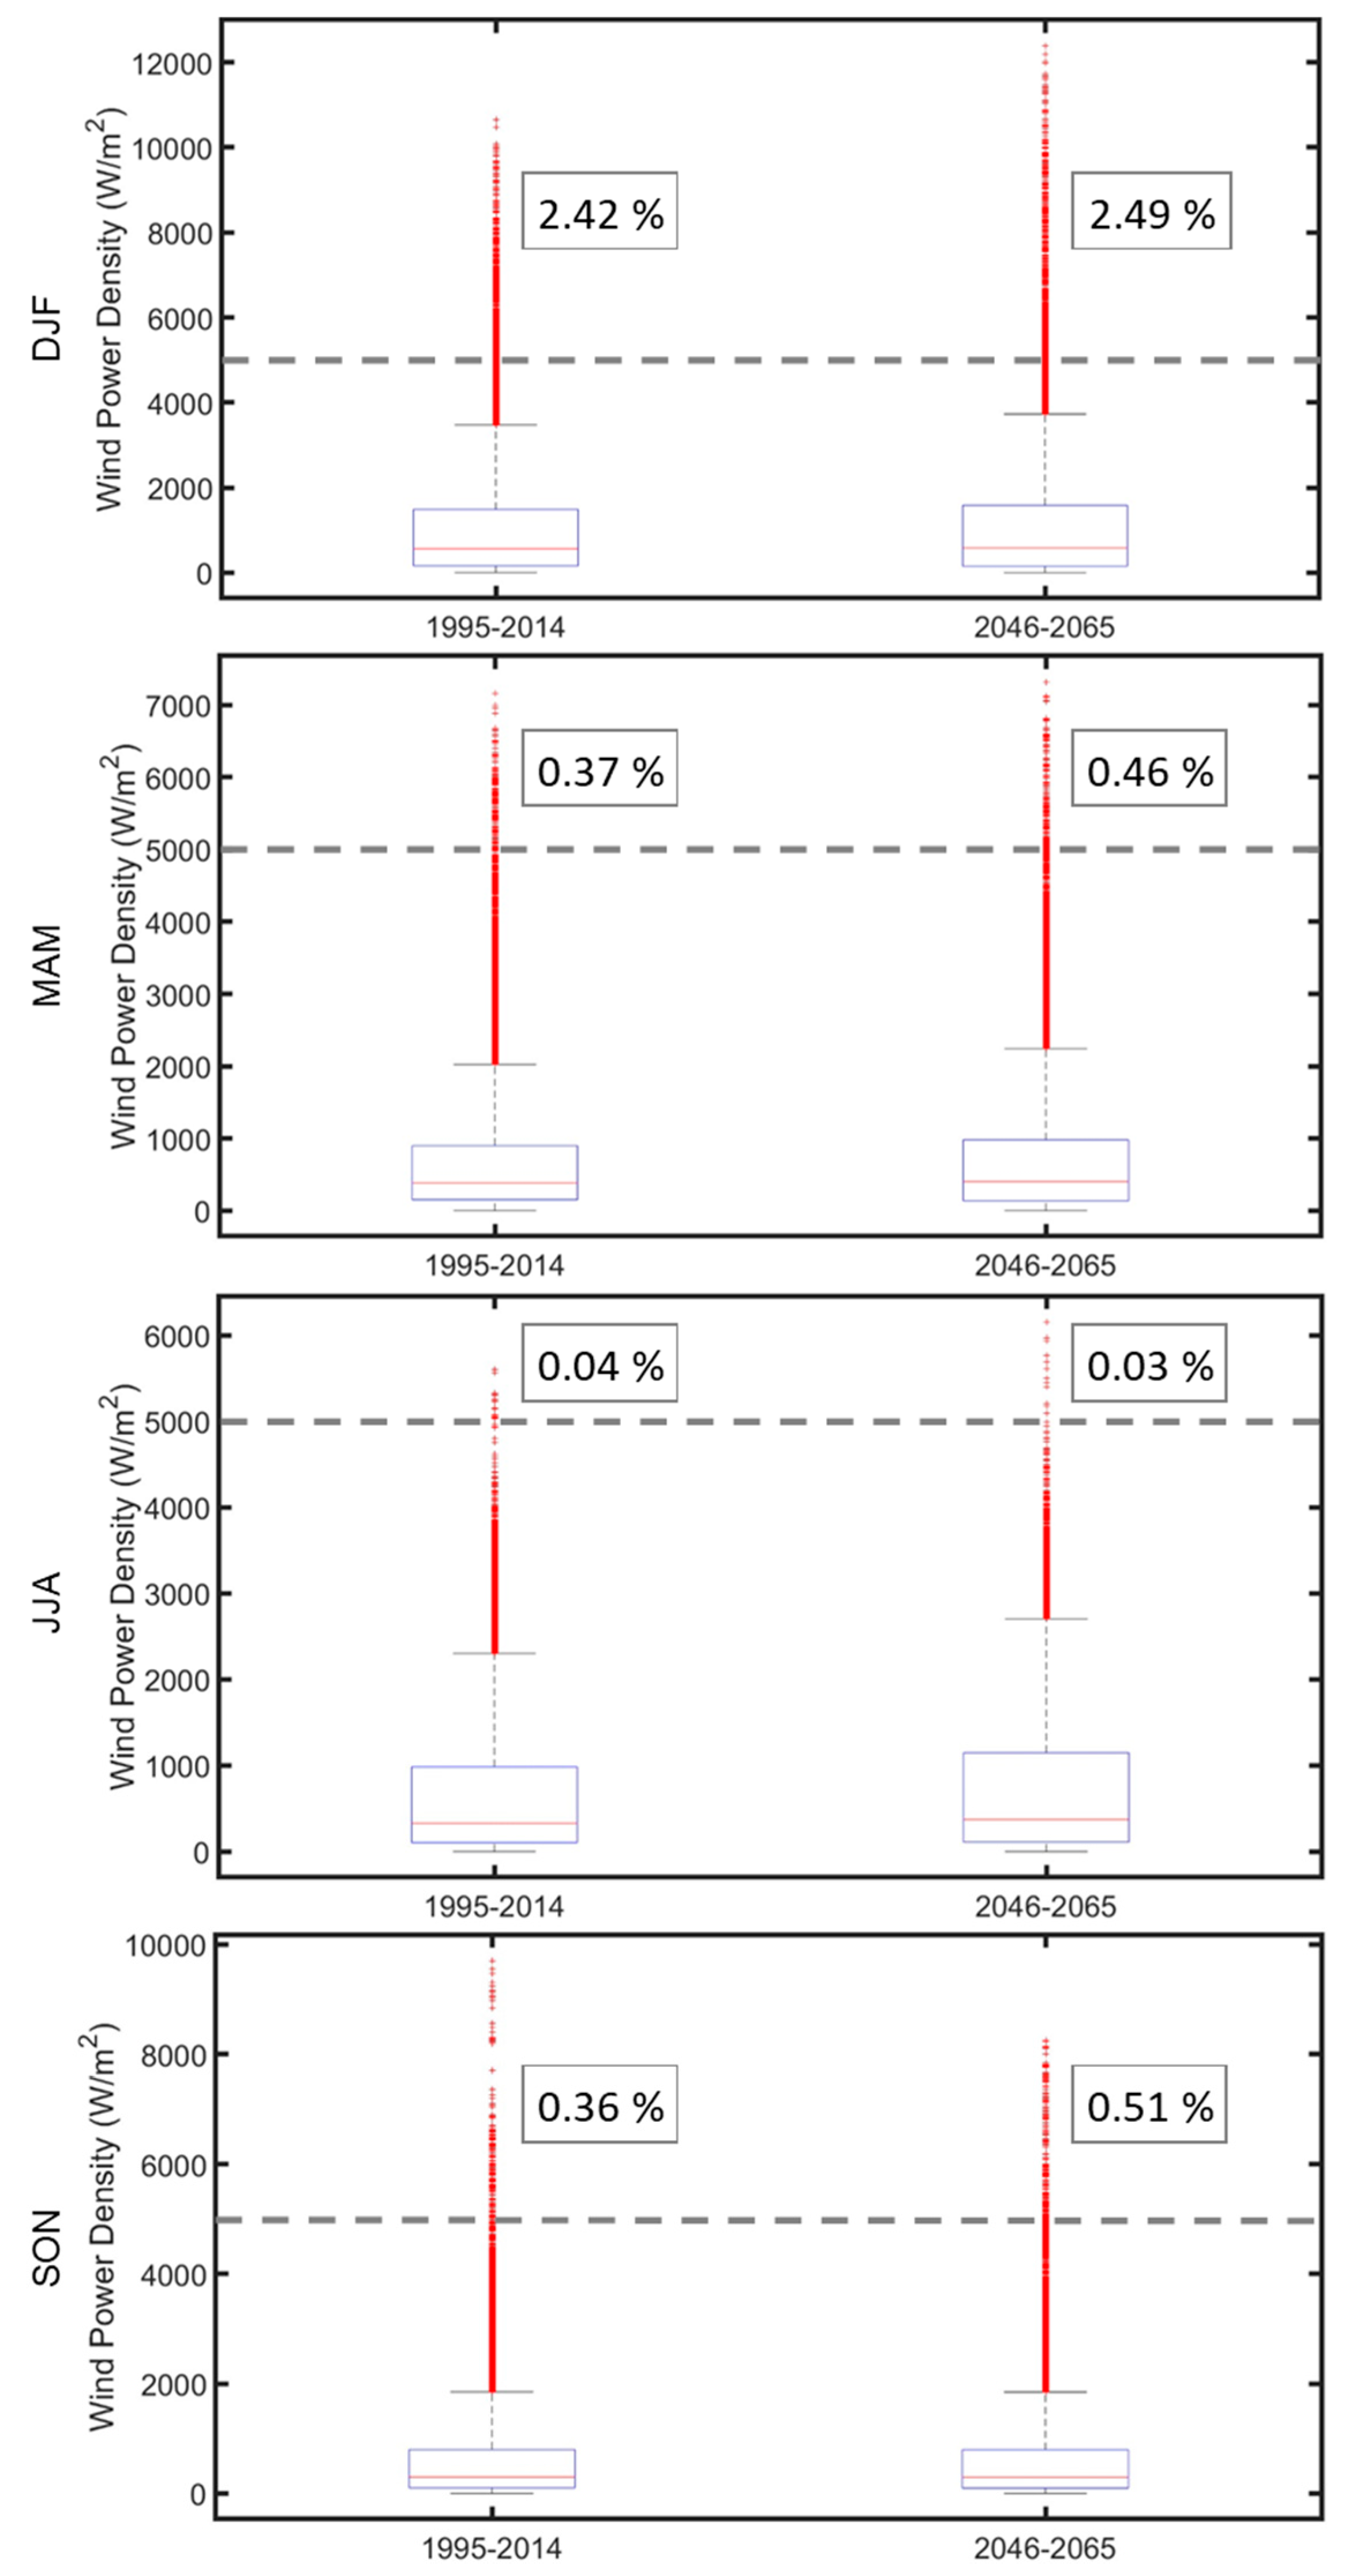
3.2.2. Changes in the 100 m Wind Power Density Inter-Annual Variability

Figure 8 represents the inter-annual variability of 100 m WPD for 1995–2014 (Figure 8a), and corresponding absolute (Figure 8, middle column) and relative (Figure 8, right column) anomalies for 2046–2065 (Figure 8b,d) and 2081–2100 (Figure 8c,e), over Portugal and the nearby Atlantic Ocean.
During the reference period, the peaks of inter-annual variability were located over northern mountain regions and the Atlantic Ocean near the northern border with Spain. Overall, the higher inter-annual variability values of WPD were found above the ocean.
In the middle of the century, projections highlight increases in inter-annual variability over the Atlantic Ocean, between 41° N and 42° N, and around Cape Espichel and Cape St. Vincent. Above land, variability increases are found in Serra da Estrela and several other mountain regions. All these increases are due to the increase of the 75th percentile value, as shown in Figure S5c. Despite these increases, the majority of the region undergoes a decrease in variability. The larger decreases are seen in the mountain regions between 41° N and 42° N; in southern Portugal; off the central Portuguese coast, near Cape Raso; and along the southern coast. The decreases in the northern mountain regions are due to a decrease in the 75th percentile (see Figure S5c), while the decreases over the ocean and the southern part of the country are mainly caused by an increase in the 25th percentile (see Figure S5a), except for the decreases along the southern coast, which are caused by a decrease in the 75th percentile.
At the end of the century, the inter-annual variability anomaly pattern changes completely compared with the middle of the century. During this period, projections show variability increases in almost the entire studied area, except for some northern mountainous regions and around Cape Raso, where inter-annual variability decreases. The largest relative increases are shown to occur around Cape St. Vincent, Cape Espichel, and Faro. There are also peak variability increases along the coast between Cape Carvoeiro and Cape Roca, and near Viana do Castelo.
The inter-annual variability increases in the mainland, mainly originating from a decrease in the 25th percentile (see Figure S5b), but for Cape St. Vincent and Viana do Castelo an increase in the 75th percentile is the cause of the variability increase (see Figure S5d); and in Cape Espichel, Faro, and between Cape Carvoeiro and Cape Roca, the variability increase is caused by both a 25th percentile decrease and a 75th percentile increase. The variability decrease around Cape Raso is due to a 25th percentile increase, and over the northern mountain regions variability decreases are, in general, caused by a 25th percentile increase and a 75th percentile decrease.

4. Conclusions

The present study aimed to assess the future wind energy potential along the Portuguese coast and mainland, using WS data from a WRF RCM simulation under the IPCC SSP5-8.5 scenario for the 2046–2065 and 2081–2100 future periods. A CMIP6 MME was also used for an assessment of the future large-scale atmospheric circulation patterns over the North Atlantic region.
An analysis of the future large-scale atmospheric circulation patterns over the Euro-Atlantic region with SLP and KE data from the CMIP6 MME allowed us to conclude that the mid-latitude eddy-driven jet stream is projected to intensify with time during winter, and to move further south in the middle of the century, eventually becoming concentrated in the mid-latitudes at the end of the century. During spring, summer and autumn, the jet stream should move further north with time due to a northward expansion of the Azores High, already discussed in studies such as [13,30]. It should also lose some intensity during summer by the end of the century. Therefore, more intense winds should occur over Northern Europe during spring, summer and autumn, and over Central Europe during winter. Furthermore, the jet stream displacement to the north during summer seems to cause an intensification of the northern winds along the northwest coast of the IP.
Furthermore, WPD future anomalies’ calculations have shown that, during the 2046–2065 period, statistically significant changes in WPD will only occur in the summer season, with WPD increases between 25% and 50% over the ocean off the northwest coast of Portugal, as well as increases over Serra da Estrela, during summer. Regarding the wind direction anomalies, they will mainly occur during winter, over Southern Portugal and the nearby ocean, and consist of a displacement to the west, meaning that during the middle of the century winds over Southern Portugal will mainly come either from the south or southeast, depending on the size of the anomaly in each exact location.
It was also observed that, during the 2046–2065 period, the 100 m WPD seasonal median absolute anomalies, obtained through the WRF regional simulations, have similar locations to the 10 m KE seasonal median absolute anomalies near the IP, calculated with the CMIP6 MME data. Thus, these similarities between the GCM-ensemble and RCM projections demonstrate the dynamical coherency between these simulations.
An analysis of the WPD seasonal daily variability in 2046–2065 over an offshore area near Viana do Castelo showed a variability increase during winter, spring and summer, as well as a slightly higher occurrence of extreme WPD events with even higher intensity, and less intense extreme WPD events during autumn.
For 2046–2065, projections have shown changes in the 75th and 25th percentiles of the WPD’s 20-year annual mean values, that will cause inter-annual WPD variability to:
  • Increase over the North Atlantic Ocean near the northwest coast of Portugal, around Cape Espichel and Cape St. Vincent, as well as in several mountain regions, due to the increase of the 75th percentile;
  • Decrease in the northern mountain regions, due to the decrease of the 75th percentile;
  • Decrease in the southern inland area and over the ocean, off the central coast, and near Cape Raso. This is due to the increase of the 25th percentile;
  • Decrease along the southern coast, caused by a decrease of the 75th percentile.
At the 2081–2100 period, projections have shown inter-annual WPD variability to:
  • Increase in almost the entire studied area, mainly due to a decrease of the 25th percentile;
  • Decrease in northern mountainous regions and around Cape Raso, mainly due to an increase of the 25th percentile.
When all the results are summarized, such as in Table 3, it can be concluded that the wind energy potential in the middle of the century should mainly increase offshore, during summer and offshore the northwest coast, where wind energy is already being harvested. A higher wind energy potential near existing wind farms implies that a higher electricity output could be achieved. However, considering the projected intra- and inter-annual WPD variability increases, and extreme WPD events with higher magnitude, it may also mean that offshore wind farms located along the northern Portuguese coast may suffer production shortfalls if the wind more frequently exceeds the wind turbines’ maximum operating speed.
The fact that the wind energy potential increase happens during summer means that it can help cover possible shortfalls in electricity production from hydropower plants, owing to the projected dryness conditions in Portugal, and more intense and frequent droughts [31,32,33]. A comparison with previous similar studies shows some common results: during summer, the intensification of easterly winds described in [13] is also seen here, through the intensification of the northern winds along the northwest coast of the IP. The WPD increase off the northwest coast of Portugal is similar to the increase in wind energy potential along the west coast of the IP described by that same study, and also by [14,16].
In forthcoming research, the analysis will be extended to the hourly and sub-hourly timescales, including an analysis of return periods for extreme events. Lastly, the present study provides further insights into the available wind renewable resource in future climates in Portugal, thereby contributing to the decision-making processes, namely the planning of new offshore wind power plants.

Supplementary Materials

The following supporting information can be downloaded at: https://www.mdpi.com/article/10.3390/en16020661/s1, Figure S1: Wind speed (WS, m/s) median differences between the CMIP6 ensemble and ERA5 data for 1995–2014, under SSP5-8.5; Figure S2: Wind speed (WS) overlap percentage (OP, %) between the CMIP6 ensemble and ERA5 data for 1995–2014, under SSP5-8.5; Figure S3: Sea level pressure (SLP, hPa) median differences (left side) and overlap percentage (OP, %, right side) between the CMIP6 ensemble and ERA5 data for 1995–2014, under SSP5-8.5; Figure S4: Wind speed (WS, m/s) median differences (left side) and overlap percentage (OP, %, right side) between the WRF MPI-based and ERA5-based simulations for 1995–2014, under SSP5-8.5; Figure S5: 25th and 75th percentile absolute anomalies of annual mean 100 m WPD (W/m2) for (a,c) 2046–2065 and (b,d) 2081–2100, under SSP5-8.5, relative to 1995–2014.

Author Contributions

Conceptualization, J.A.S. and D.C.; Data curation, A.C.; Formal analysis, A.C.; Funding acquisition, J.A.S.; Investigation, A.C.; Methodology, J.A.S. and D.C.; Project administration, J.A.S.; Resources, J.A.S. and D.C.; Software, A.C. and D.C.; Supervision, J.A.S. and D.C.; Validation, A.C.; Visualization, A.C.; Writing—original draft, A.C.; Writing—review and editing, J.A.S. and D.C. All authors have read and agreed to the published version of the manuscript.

Funding

This research was funded by the European Regional Development Fund, under project ATLANTIDA—Platform for the monitoring of the North Atlantic Ocean and tools for the sustainable exploitation of the marine resources (NORTE-01-0145-FEDER-000040), and also by the Portuguese Foundation for Science and Technology (FCT), under grant number UIDB/04033/2020.

Data Availability Statement

The data presented in this study are available on request from the corresponding author.

Acknowledgments

David Carvalho acknowledges the FCT for his researcher contract (CEECIND/00563/2020) and the FCT/MCTES for the financial support to CESAM (UIDP/50017/2020+UIDB/50017/2020), through national funds.

Conflicts of Interest

The authors declare no conflict of interest. The funders had no role in the design of the study; in the collection, analyses, or interpretation of data; in the writing of the manuscript; or in the decision to publish the results.

References

  1. European Commission. Renewable Energy Targets. 2022. Available online: https://energy.ec.europa.eu/topics/renewable-energy/renewable-energy-directive-targets-and-rules/renewable-energy-targets_en (accessed on 2 November 2022).
  2. APA. Plano Nacional de Energia e Clima (PNEC). Agência Portuguesa Do Ambiente (APA). 2020. Available online: https://apambiente.pt/clima/plano-nacional-de-energia-e-clima-pnec (accessed on 2 November 2022).
  3. APREN. APREN—Production. 2022. Available online: https://www.apren.pt/en/renewable-energies/production/ (accessed on 2 November 2022).
  4. Eurostat. Statistics | Eurostat. European Commission. 2022. Available online: https://ec.europa.eu/eurostat/databrowser/view/t2020_rd330/default/bar?lang=en (accessed on 2 November 2022).
  5. APREN. APREN—Power. 2022. Available online: https://www.apren.pt/en/renewable-energies/power/ (accessed on 2 November 2022).
  6. BP. Statistical Review of World Energy 2022, 71st ed.; BP: London, UK, 2022. [Google Scholar]
  7. Guezuraga, B.; Zauner, R.; Pölz, W. Life cycle assessment of two different 2 MW class wind turbines. Renew. Energy 2012, 37, 37–44. [Google Scholar] [CrossRef]
  8. Kaldellis, J.; Apostolou, D.; Kapsali, M.; Kondili, E. Environmental and social footprint of offshore wind energy. Comparison with onshore counterpart. Renew. Energy 2016, 92, 543–556. [Google Scholar] [CrossRef]
  9. Carvalho, D.; Rocha, A.; Gómez-Gesteira, M. Ocean Surface Wind Simulation Forced by Different Reanalyses: Comparison with Observed Data along the Iberian Peninsula Coast. Ocean Model. 2012, 56, 31–42. [Google Scholar] [CrossRef]
  10. De Simón-Martín, M.; de La Puente-Gil, Á.; Borge-Diez, D.; Ciria-Garcés, T.; González-Martínez, A. Wind energy planning for a sustainable transition to a decarbonized generation scenario based on the opportunity cost of the wind energy: Spanish Iberian Peninsula as case study. Energy Procedia 2019, 157, 1144–1163. [Google Scholar] [CrossRef]
  11. Pryor, S.; Barthelmie, R. Climate change impacts on wind energy: A review. Renew. Sustain. Energy Rev. 2010, 14, 430–437. [Google Scholar] [CrossRef]
  12. Eyring, V.; Bony, S.; Meehl, G.A.; Senior, C.A.; Stevens, B.; Stouffer, R.J.; Taylor, K.E. Overview of the Coupled Model Intercomparison Project Phase 6 (CMIP6) experimental design and organization. Geosci. Model Dev. 2016, 9, 1937–1958. [Google Scholar] [CrossRef] [Green Version]
  13. Santos, J.; Rochinha, C.; Liberato, M.; Reyers, M.; Pinto, J. Projected changes in wind energy potentials over Iberia. Renew. Energy 2014, 75, 68–80. [Google Scholar] [CrossRef]
  14. Santos, F.; Gómez-Gesteira, M.; deCastro, M.; Añel, J.A.; Carvalho, D.; Costoya, X.; Dias, J.M. On the accuracy of CORDEX RCMs to project future winds over the Iberian Peninsula and surrounding ocean. Appl. Energy 2018, 228, 289–300. [Google Scholar] [CrossRef]
  15. Martins, J.; Rocha, A.; Viceto, C.; Pereira, S.C.; Santos, J.A. Future Projections for Wind, Wind Shear and Helicity in the Iberian Peninsula. Atmosphere 2020, 11, 1001. [Google Scholar] [CrossRef]
  16. Costoya, X.; Rocha, A.; Carvalho, D. Using bias-correction to improve future projections of offshore wind energy resource: A case study on the Iberian Peninsula. Appl. Energy 2020, 262, 114562. [Google Scholar] [CrossRef]
  17. Carvalho, D.; Rocha, A.; Costoya, X.; deCastro, M.; Gómez-Gesteira, M. Wind energy resource over Europe under CMIP6 future climate projections: What changes from CMIP5 to CMIP6. Renew. Sustain. Energy Rev. 2021, 151, 111594. [Google Scholar] [CrossRef]
  18. Shukla, P.R.; Skea, J.; Reisinger, A.; Slade, R.; Fradera, R.; Pathak, M.; Al, A.; Malek, K.; Renée van Diemen, B.; Hasija, A.; et al. Climate Change 2022: Mitigation of Climate Change. Working Group III Contribution to the Sixth Assessment Report of the Intergovernmental Panel on Climate Change Summary for Policymakers; IPCC: Geneva, Switzerland, 2022.
  19. Cherchi, A.; Fogli, P.G.; Lovato, T.; Peano, D.; Iovino, D.; Gualdi, S.; Masina, S.; Scoccimarro, E.; Materia, S.; Bellucci, A.; et al. Global Mean Climate and Main Patterns of Variability in the CMCC-CM2 Coupled Model. J. Adv. Model. Earth Syst. 2019, 11, 185–209. [Google Scholar] [CrossRef] [Green Version]
  20. Lovato, T.; Peano, D.; Butenschön, M.; Materia, S.; Iovino, D.; Scoccimarro, E.; Fogli, P.G.; Cherchi, A.; Bellucci, A.; Gualdi, S.; et al. CMIP6 Simulations With the CMCC Earth System Model (CMCC-ESM2). J. Adv. Model. Earth Syst. 2022, 14, e2021MS002814. [Google Scholar] [CrossRef]
  21. Döscher, R.; Acosta, M.; Alessandri, A.; Anthoni, P.; Arsouze, T.; Bergman, T.; Bernardello, R.; Boussetta, S.; Caron, L.P.; Carver, G.; et al. The EC-Earth3 Earth system model for the Coupled Model Intercomparison Project 6. Geosci. Model Dev. 2022, 15, 2973–3020. [Google Scholar] [CrossRef]
  22. Gutjahr, O.; Putrasahan, D.; Lohmann, K.; Jungclaus, J.H.; von Storch, J.S.; Brüggemann, N.; Haak, H.; Stössel, A. Max Planck Institute Earth System Model (MPI-ESM1.2) for the High-Resolution Model Intercomparison Project (HighResMIP). Geosci. Model Dev. 2019, 12, 3241–3281. [Google Scholar] [CrossRef] [Green Version]
  23. Yukimoto, S.; Kawai, H.; Koshiro, T.; Oshima, N.; Yoshida, K.; Urakawa, S.; Tsujino, H.; Deushi, M.; Tanaka, T.; Hosaka, M.; et al. The Meteorological Research Institute Earth System Model Version 2.0, MRI-ESM2.0: Description and Basic Evaluation of the Physical Component. J. Meteorol. Soc. Jpn. Ser. II 2019, 97, 931–965. [Google Scholar] [CrossRef] [Green Version]
  24. Räisänen, J.; Palmer, T. A probability and decision-model analysis of a multimodel ensemble of climate change simulations. J. Clim. 2001, 14, 3212–3226. [Google Scholar] [CrossRef]
  25. Pierce, D.W.; Barnett, T.P.; Santer, B.D.; Gleckler, P.J. Selecting global climate models for regional climate change studies. Proc. Natl. Acad. Sci. USA 2009, 106, 8441–8446. [Google Scholar] [CrossRef] [Green Version]
  26. Carvalho, D.; Rocha, A.; Gómez-Gesteira, M.; Silva Santos, C. Potential impacts of climate change on European wind energy resource under the CMIP5 future climate projections. Renew. Energy 2017, 101, 29–40. [Google Scholar] [CrossRef]
  27. Skamarock, W.C.; Klemp, J.B.; Dudhia, J.; Gill, D.O.; Liu, Z.; Berner, J.; Wang, W.; Powers, J.G.; Duda, M.G.; Barker, D.M.; et al. A Description of the Advanced Research WRF Model Version 4.3; National Center for Atmospheric Research: Boulder, CO, USA, 2021. [Google Scholar] [CrossRef]
  28. Vijaymeena, M.; Kavitha, K. A survey on similarity measures in text mining. Mach. Learn. Appl. Int. J. 2016, 3, 19–28. [Google Scholar]
  29. EDP. Windfloat Atlantic Project. 2022. Available online: https://www.edp.com/en/innovation/windfloat (accessed on 2 November 2022).
  30. Cresswell-Clay, N.; Ummenhofer, C.C.; Thatcher, D.L.; Wanamaker, A.D.; Denniston, R.F.; Asmerom, Y.; Polyak, V.J. Twentieth-century Azores High expansion unprecedented in the past 1,200 years. Nat. Geosci. 2022, 15, 548–553. [Google Scholar] [CrossRef]
  31. Cardoso, R.M.; Soares, P.M.M.; Lima, D.C.A.; Miranda, P.M.A. Mean and extreme temperatures in a warming climate: EURO CORDEX and WRF regional climate high-resolution projections for Portugal. Clim. Dyn. 2019, 52, 129–157. [Google Scholar] [CrossRef]
  32. Molina, M.O.; Sánchez, E.; Gutiérrez, C. Future heat waves over the Mediterranean from an Euro-CORDEX regional climate model ensemble. Sci. Rep. 2020, 10, 8801. [Google Scholar] [CrossRef] [PubMed]
  33. Parente, J.; Pereira, M.G.; Amraoui, M.; Fischer, E.M. Heat waves in Portugal: Current regime, changes in future climate and impacts on extreme wildfires. Sci. Total Environ. 2018, 631, 534–549. [Google Scholar] [CrossRef] [PubMed]
Figure 1. Hypsometric chart of Portugal. The different colours represent the terrain elevation (m). Key locations for this study are marked by red circles.
Energies 16 00661 g001
Figure 2. Seasonal (winter: DJF, spring: MAM, summer: JJA, and autumn: SON) medians of SLP (hPa) for the reference period (1995–2014, left column (a,d,g,j)) and future periods (2046–2065, middle column (b,e,h,k); 2081–2100, right column (c,f,i,l)), under SSP5-8.5.
Energies 16 00661 g002
Figure 3. Seasonal (winter: DJF, spring: MAM, summer: JJA, and autumn: SON) median of KE (m2/s2) for the reference period (1995–2014), at 10 m (left column (a,d,g,j)), 500 hPa (middle column (b,e,h,k)) and 250 hPa (right column (c,f,i,l)) levels. Black lines in the left column panels correspond to the isobars (in hPa).
Energies 16 00661 g003
Figure 4. Absolute anomalies of the seasonal (winter: DJF, spring: MAM, summer: JJA, and autumn: SON) median KE (m2/s2) for 2046–2065, relative to 1995–2014 (Figure 3), at 10 m (left column (a,d,g,j)), 500 hPa (middle column (b,e,h,k)) and 250 hPa (right column (c,f,i,l)) levels, under SSP5-8.5.
Energies 16 00661 g004
Figure 5. Absolute anomalies of the seasonal (winter: DJF, spring: MAM, summer: JJA, and autumn: SON) median KE (m2/s2) for 2081–2100, relative to 1995–2014 (Figure 3), at 10 m (left column (a,d,g,j)), 500 hPa (middle column (b,e,h,k)) and 250 hPa (right column (c,f,i,l)) levels, under SSP5-8.5.
Energies 16 00661 g005
Figure 6. Seasonal (winter: DJF, spring: MAM, summer: JJA, and autumn: SON) median of 100 m WPD for 1995–2014 (left column (a,d,g,j), in W/m2), and corresponding absolute (middle column (b,e,h,k), in W/m2) and relative (right column (c,f,i,l), in %) anomalies for 2046–2065, under SSP5-8.5. Black arrows correspond to the respective seasonal median wind direction (1995–2014, left column) and wind direction anomaly (2046–2065, middle and right columns).
Energies 16 00661 g006
Figure 7. Seasonal (winter: DJF, spring: MAM, summer: JJA, and autumn: SON) daily variability of 100 m WPD off the coast of Viana do Castelo for the 1995–2014 reference period (left side) and 2046–2065 period (right side), under SSP5-8.5. The boxes indicate the percentage of WPD values above 5000 W/m2 (marked with dashed lines).
Energies 16 00661 g007
Figure 8. The 100 m WPD inter-annual variability (75th percentile minus 25th percentile of annual mean values) for 1995–2014 ((a), in W/m2), and corresponding absolute (middle column, in W/m2) and relative (right column, in %) anomalies for (b,d) 2046–2065 and (c,e) 2081–2100, under SSP5-8.5.
Energies 16 00661 g008
Table 1. CMIP6 GCMs: institution, horizontal and vertical resolutions, IPCC scenarios, time periods considered, and relevant references.
GCMInstitutionHorizontal ResolutionVertical LevelsIPCC ScenarioTime PeriodsReferences
CMCC-CM2-SR5Euro-Mediterranean Centre on Climate Change (CMCC), Italy1.25° lat × 0.938° lonSurface (10 m)
850 hPa
700 hPa
500 hPa
250 hPa
SSP5-8.51995–2014
2046–2065
2081–2100
[19]
CMCC-ESM2[20]
EC-Earth3EC-Earth-Consortium (12 European countries)0.703° lat × 0.703° lon[21]
EC-Earth3-Veg
MPI-ESM1.2-HRMax Planck Institute for Meteorology (MPI-M), Germany0.938° lat × 0.938° lon[22]
MRI-ESM2-0Meteorological Research Institute (MRI), Japan1.125° lat × 1.125° lon[23]
Table 2. WRF regional simulation: institution, horizontal and vertical resolutions, IPCC scenarios, time periods considered, and relevant references.
GCMInstitutionHorizontal ResolutionVertical LevelsIPCC ScenarioTime PeriodsReference
WRFNational Center for Atmospheric Research, USA6 km 33SSP5-8.51995–2014
2046–2065
2081–2100
[27]
Table 3. Summary of the results.
Pressure Centre AnomaliesJet streamWPD Seasonal MedianExtreme WPD Events
2046—2065Icelandic Low expansion to SE during DJF;
Azores High expansion to NE during MAM, JJA and SON.
DJF: southward displacement and intensification;
MAM, JJA and SON: northward displacement.
25% to 50% increase during JJA, offshore of the NW coastDJF, MAM and JJA: more intense events;
SON: less intense events.
2081—2100--
Disclaimer/Publisher’s Note: The statements, opinions and data contained in all publications are solely those of the individual author(s) and contributor(s) and not of MDPI and/or the editor(s). MDPI and/or the editor(s) disclaim responsibility for any injury to people or property resulting from any ideas, methods, instructions or products referred to in the content.

