1. Introduction
Traditional energy sources, such as fossil fuels and nuclear energy, have environmental, social and political problems because they are highly polluting. Due to the constant energy demand of the industrial sector and the increase in the use of electrical equipment in a variety of human activities, the demand for electrical energy has increased exponentially in recent decades. Renewable energy sources are sustainable alternatives to meet the need for electricity, provide the diversification of the matrix and increase energy security for countries in terms of supply. Options for generating renewable energy include hydraulic, biomass, wind, and solar [
1]. Among renewable sources, solar energy has great potential to contribute to the world’s demand for electricity, especially in countries with high levels of solar radiation. The world’s solar energy power in 2015 was 227 GW, and the prospect is to reach a power of 1362 GW by 2030,. This source encompasses large solar plants or parks, and distributed generation on the roofs of buildings [
2].
Photovoltaic cells have characteristic V-I curves that define their behavior under different operating conditions. The power of a solar cell is given by the product of the current and the voltage of the cell. The maximum power point (MPP) is the product of the voltage at the maximum point (VMPP) and current at the maximum point (IMPP) for which the power extracted from the photovoltaic system is maximum (PMPP). The maximum power point varies continuously, depending on factors such as the temperature of the solar cell and the irradiance conditions. To increase the competitiveness of PV energy with respect to other types, it is necessary to increase its efficiency, which is low, or reduce the costs. The MPP changes over time since it depends on the temperature and the level of irradiance; therefore, to make the photovoltaic modules operate close to the MPP point, the use of tracking algorithms is needed to be linked to a power converter, which is usually a direct current to direct current (DC/DC) device. The photovoltaic module then delivers specific current and voltage values that maximize power delivery.
To deal with nonlinear phenomena and achieve system stability with MPPT, many approaches have been proposed in the literature, such as techniques with adapted constant voltage [
3], fuzzy logic [
4,
5,
6], neural Networks [
7,
8], perturbation and observation (P&O) [
9,
10,
11,
12], and incremental conductance [
13,
14,
15].
The choice of technique depends on factors such as speed and accuracy in tracking, the level of complexity of the sensors used, and the cost of the necessary equipment. Conventional techniques, such as perturbation and observation, and incremental conductance, have easy implementation. Techniques based on artificial intelligence, such as particle swarm optimization, and ant colony optimization, as well as techniques based on fuzzy logic and artificial neural networks, have a greater degree of complexity and require greater computational effort [
16].
Regarding efficiency, two situations must be analyzed. When the system is subjected to homogeneous levels of irradiance, when all its modules receive the same value of solar power, conventional techniques are able to track the MPPT efficiently. However, when the modules receive different levels of irradiance in a condition known as partial shading or PSC (partial shading condition), the PV curve, due to the construction of the modules, has more than one power peak, one of which is a global peak and the others, with lower power values, are known as local peaks [
17].
In this condition, conventional techniques track the first peak found, which can be a global or a local one, resulting in a loss of power if tracking a local peak. Therefore, under PSC, it is preferable to use techniques capable of distinguishing the power level between the different peaks. In this case, the best examples are based on artificial intelligent concepts. Several algorithms are used to track the maximum power point, as already mentioned when they come across the LMPP points, and PSO (Particle Swarm Optimization), ACO (Ant Colony Optimizer), and Gray Wolf Optimization (GWO) algorithm are used to solve the problems associated with partial shading [
18,
19,
20].
In our research, new hybrid techniques were implemented experimentally and theoretically. The proposed optimization system, based on a meta-heuristic SA, conducts the operation of the boost converter to GMPP promptly and accurately under any of the shading conditions. To perform the MPPT, the SA algorithm is used separately. Its combination with the P&O, initiating the SA-P&O algorithms, boosts converter operation to GMPP under any of the conditions. To evaluate the performance of the SA and SA-P&O-based MPPT algorithms, a comparison was made with the traditional MPPT algorithm, i.e., the P&O method. The implemented MPPT techniques were compared and evaluated considering convergence time, the amplitude of the steady-state oscillations in the MPP, and the methods’ efficiencies during uniform irradiance and partial shading.
2. System Description
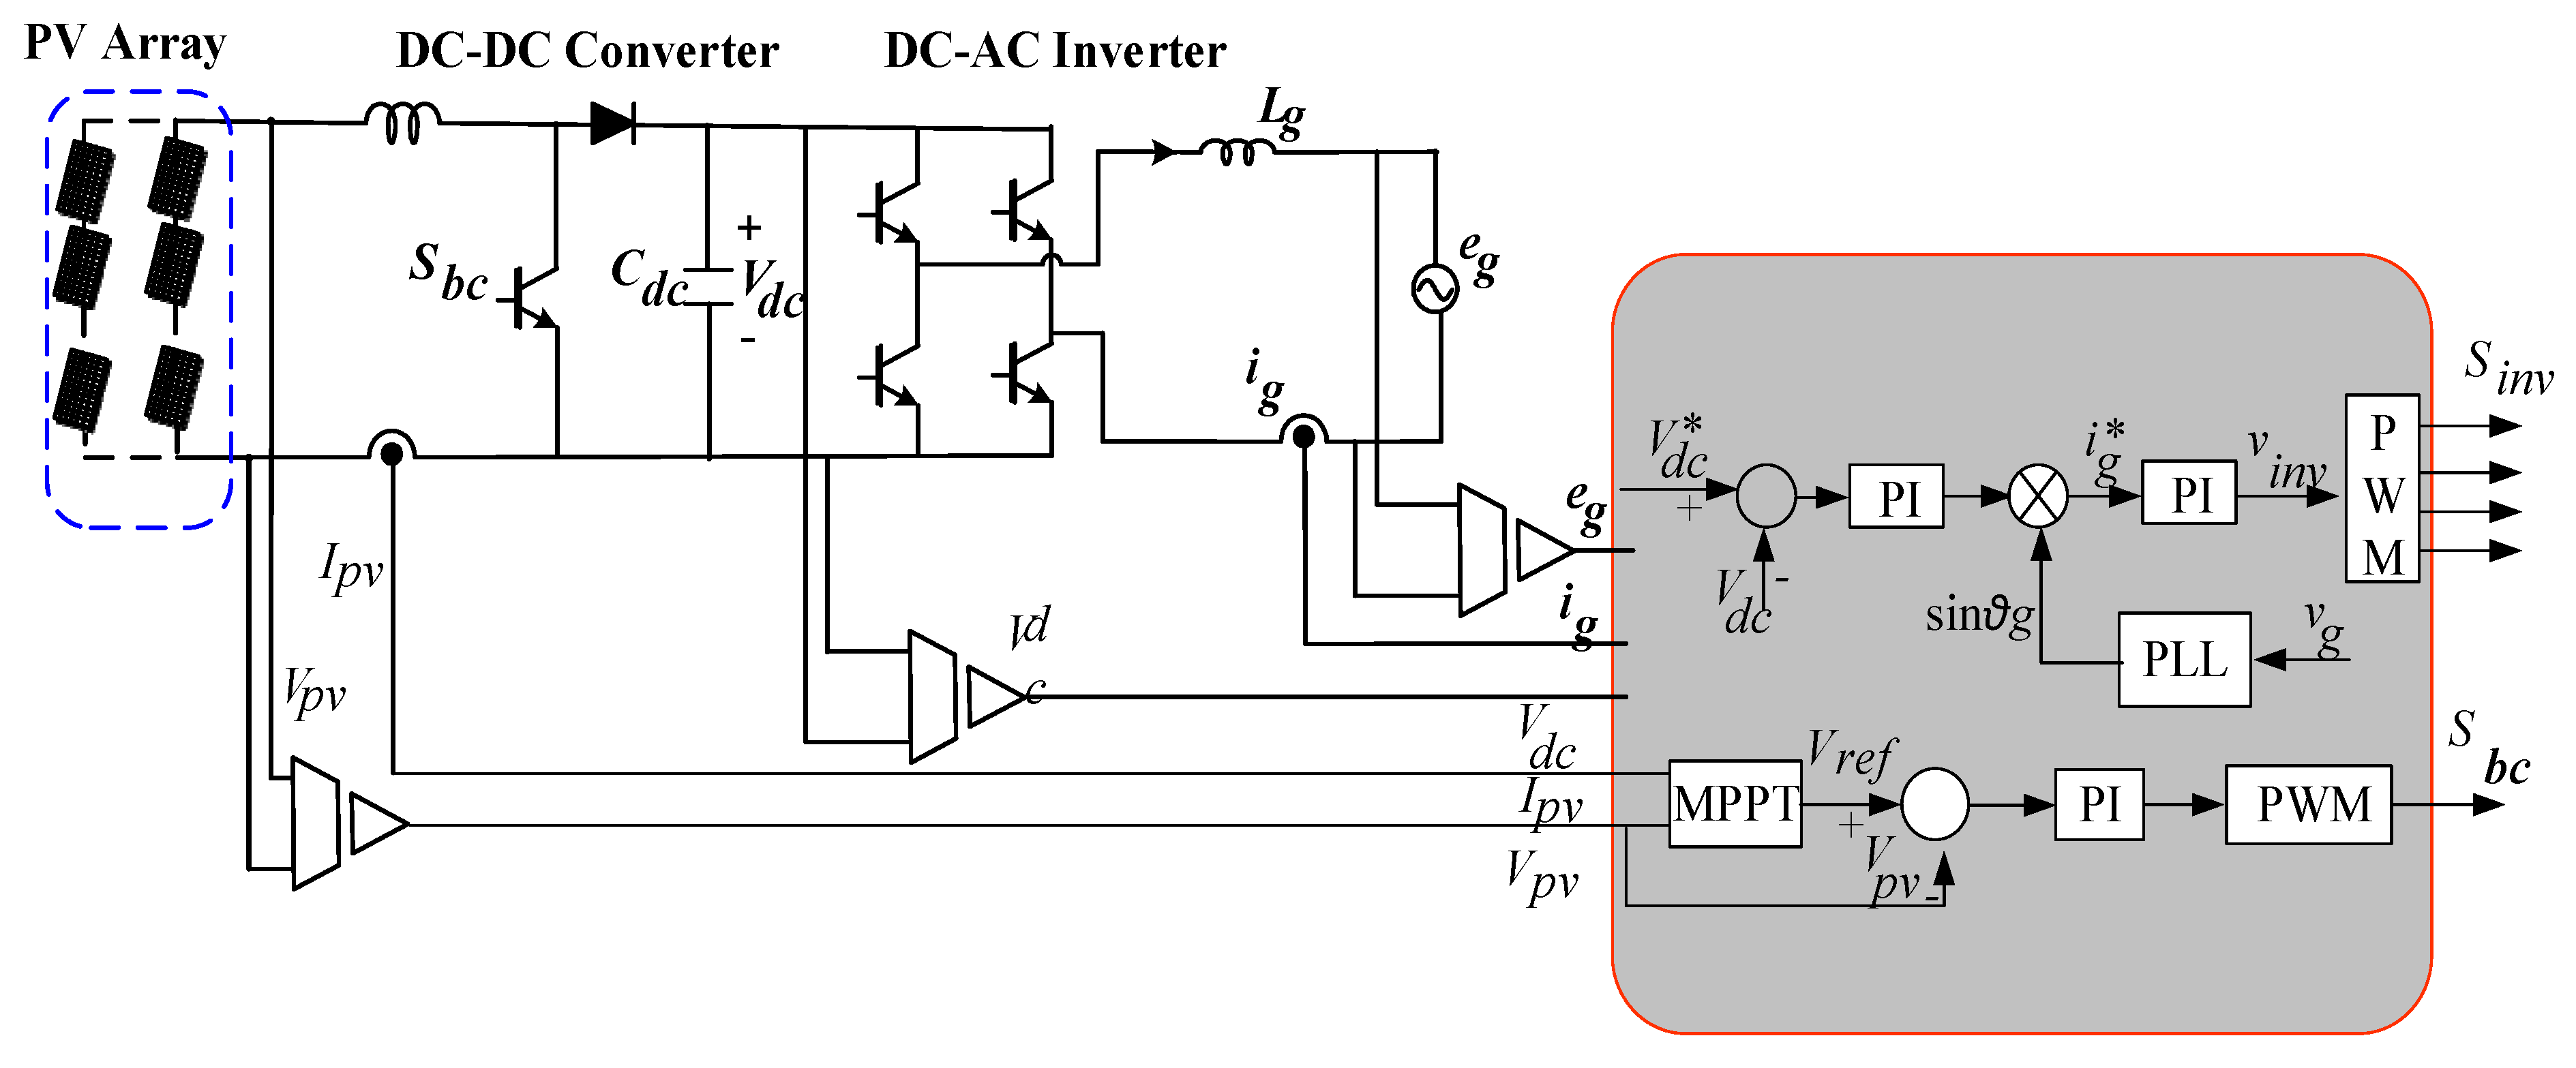
Figure 1 shows the PV system used in this study. The 60 Wp PV panel is connected by the DC-DC boost converter and a single-phase inverter for connection to the grid. A Voltage Source Inverter (VSI) is used to perform the DC/AC conversion, and a connection filter of the L type is used to connect the VSI to the grid.
The block diagram of the MPPT method is shown in
Figure 1, where
Ipv and
Vpv are the current and voltage measurements of the photovoltaic panel, respectively.
Vref is a reference current provided by the algorithm for operating the arrangement at maximum power, which is compared with the operating current of the
PV panel. The result of this comparison constitutes the input of a proportional integral (PI) controller that produces a modulation index of the PWM connected to the switching device of the boost converter connected to the photovoltaic array. In the double-stage PV system used in this work, the single-phase DC-AC inverter is responsible for both the voltage control of the DC bus and the current injected into the grid.
2.1. PV Model
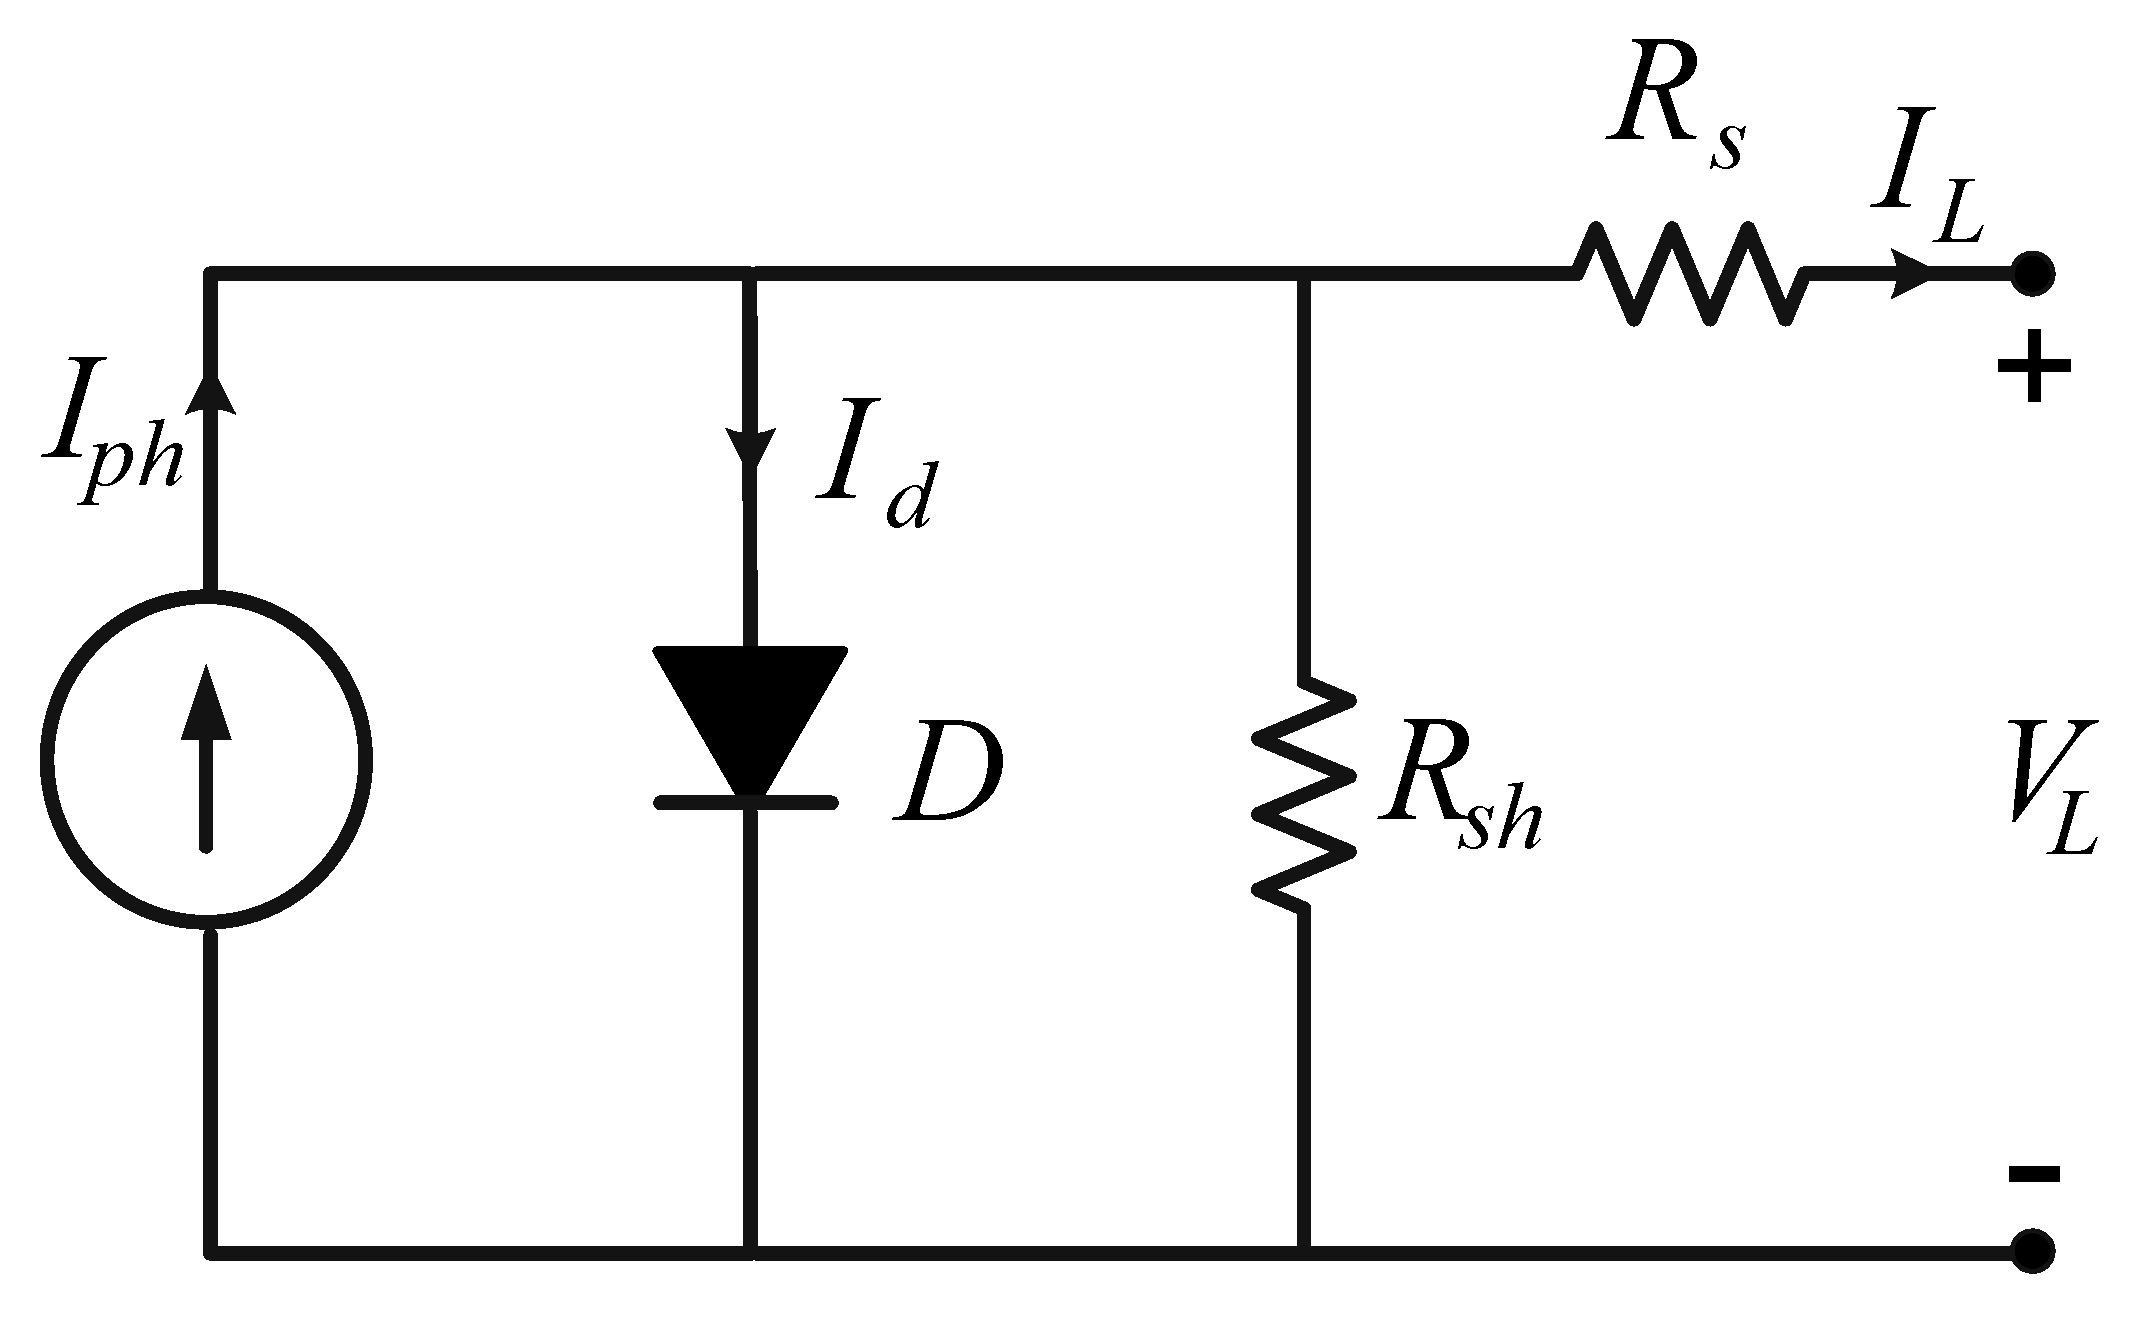
Solar cells are made of a semiconductor material, usually silicon (Si). Each cell has a thin layer of type n material and another with a greater thickness of type p material, forming the p-n junction. When exposed to photons from solar radiation, the electrons are energized, creating free charge carriers that move between the bands of the material, causing a potential difference between the cell terminals from the electric field, generating an electric current. The photocurrent effect is represented by a current source, as shown in
Figure 2, where
Rsh and
RS represent the parallel and the series resistance, respectively. Both are intrinsic elements of the cell [
21].
When the solar cell is irradiated with light, an equivalent circuit of the solar cell can be drawn, as shown in
Figure 2. At this time, the output current of the solar cell is as shown in Equation (1) [
22]:
where
Io is the leakage current or reverse saturation of the diode [A],
q is the electron charge (1.60217646 × 10
−19 C), k is the Boltzmann constant (1.3806503 × 10
−23 J/K),
T is the junction temperature p-n [K],
A is the diode ideality factor (1 ≤ to ≤ 2), NS is the number of cells connected in series, and
Vt is the panel thermal voltage given by:
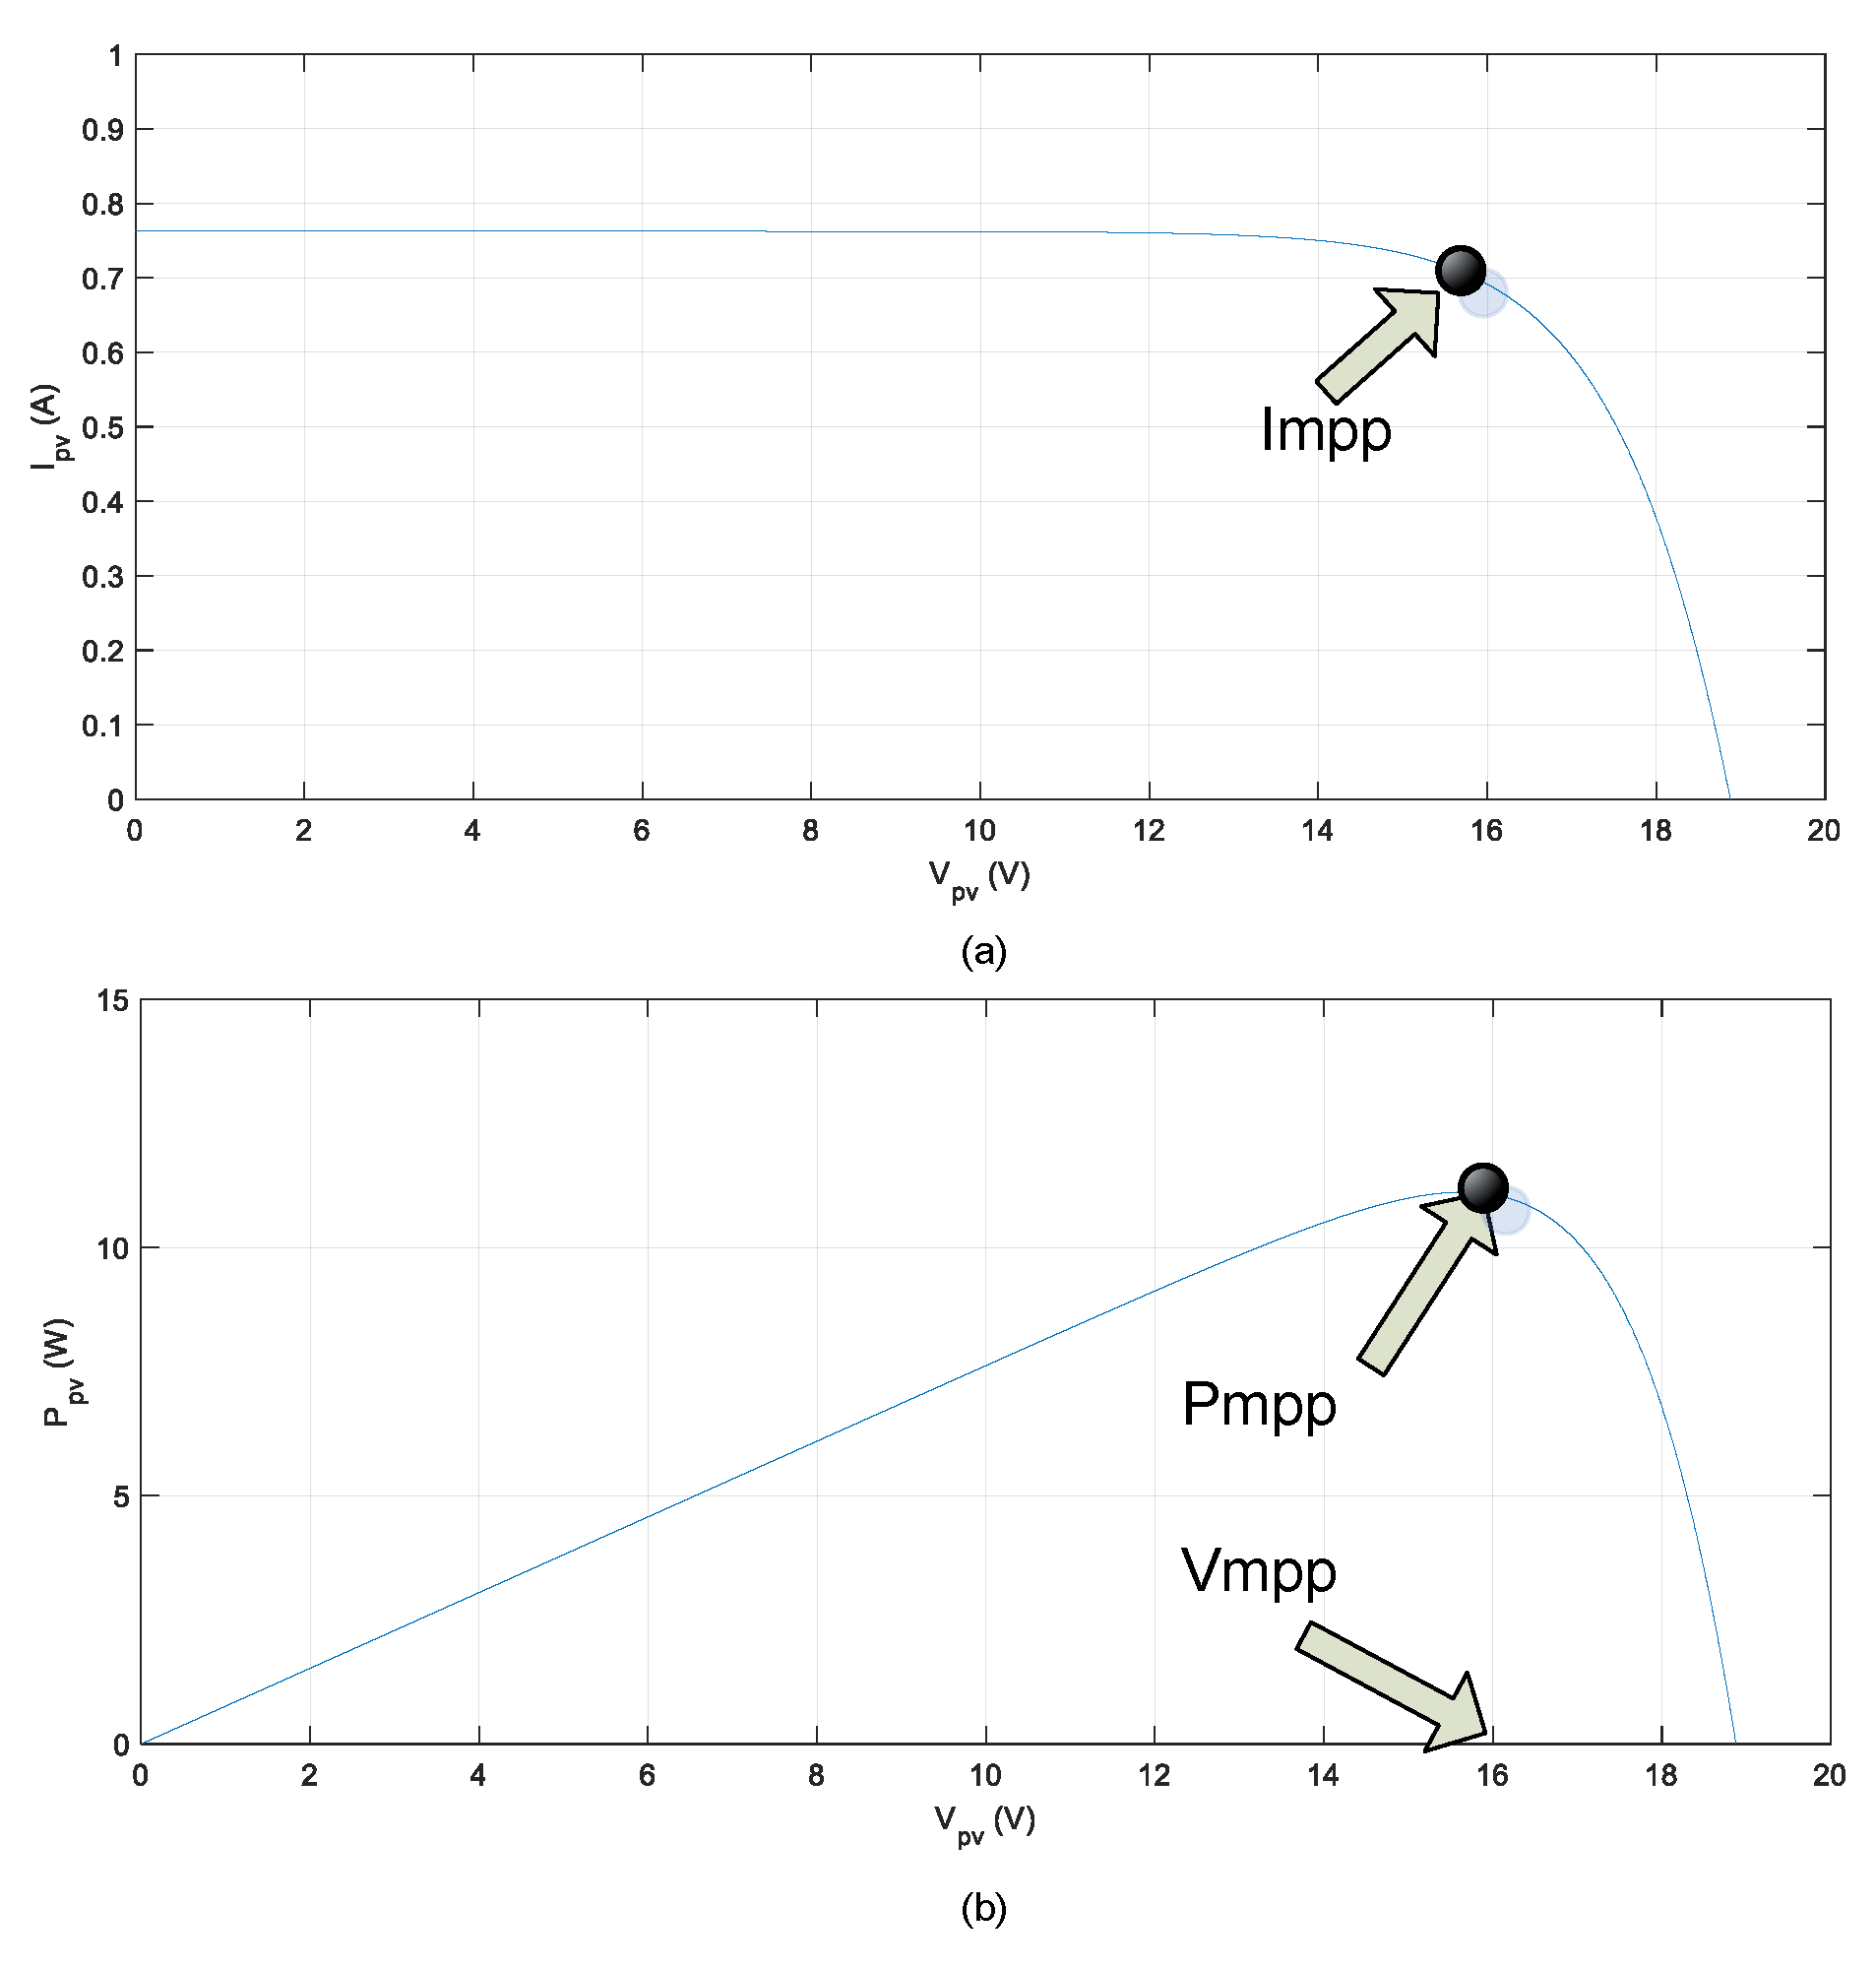
The behavior of a photovoltaic panel is thus described by two characteristic curves, current-voltage and power-voltage. These curves are usually available from the PV manufacturer and are of great importance because their values change according to the temperature and radiation conditions. The characteristics of the voltage-power and voltage-current characteristic curves of a photovoltaic module are shown, respectively, in
Figure 3a,b for radiation of 1000 W/m
2 and a temperature of 25 °C.
It is essential to highlight the five main points of the characteristic curves: the open-circuit voltage
Voc; the short-circuit current
Isc; maximum power
Pmax, and the maximum voltage and current values related to
Pmax,
Vmax, and
Imax. The appearance of the graph appearance in
Figure 3 varies with temperature and irradiation. On cloudy days, the irradiation is low, and the current produced is proportionately low. For days when the temperature is higher, the voltage decreases proportionately. Equations (3) and (4) show the dependency of the open circuit voltage on the PV open circuit voltage.
where,
Jsc =
Jph,
Voc is related to
Jsc and
Jo, and hence to the bandgap (E
g).
MPPT methods can be classified depending on different factors or characteristics that differentiate them from one another, such as their implementation complexity or convergence speed, which cause their efficiency to vary. There are a large number of characteristics by which methods can be classified.
Table 1 shows the main maximum power point monitoring methods according to their different characteristics.
2.2. Shading Effect
Throughout the day, variations in irradiation and temperature occur naturally. There are also situations, such as total or partial shading on the module due to clouds, trees, leaves, and buildings that cause sudden variations in these levels, as shown in
Figure 4. This causes power reduction. As the cells are usually connected in series, all modules are affected, in addition to causing the risk of damage to the modules due to the so-called hotspot that can lead to rupture of the glass and melting of polymers that are part of the module structure [
23].
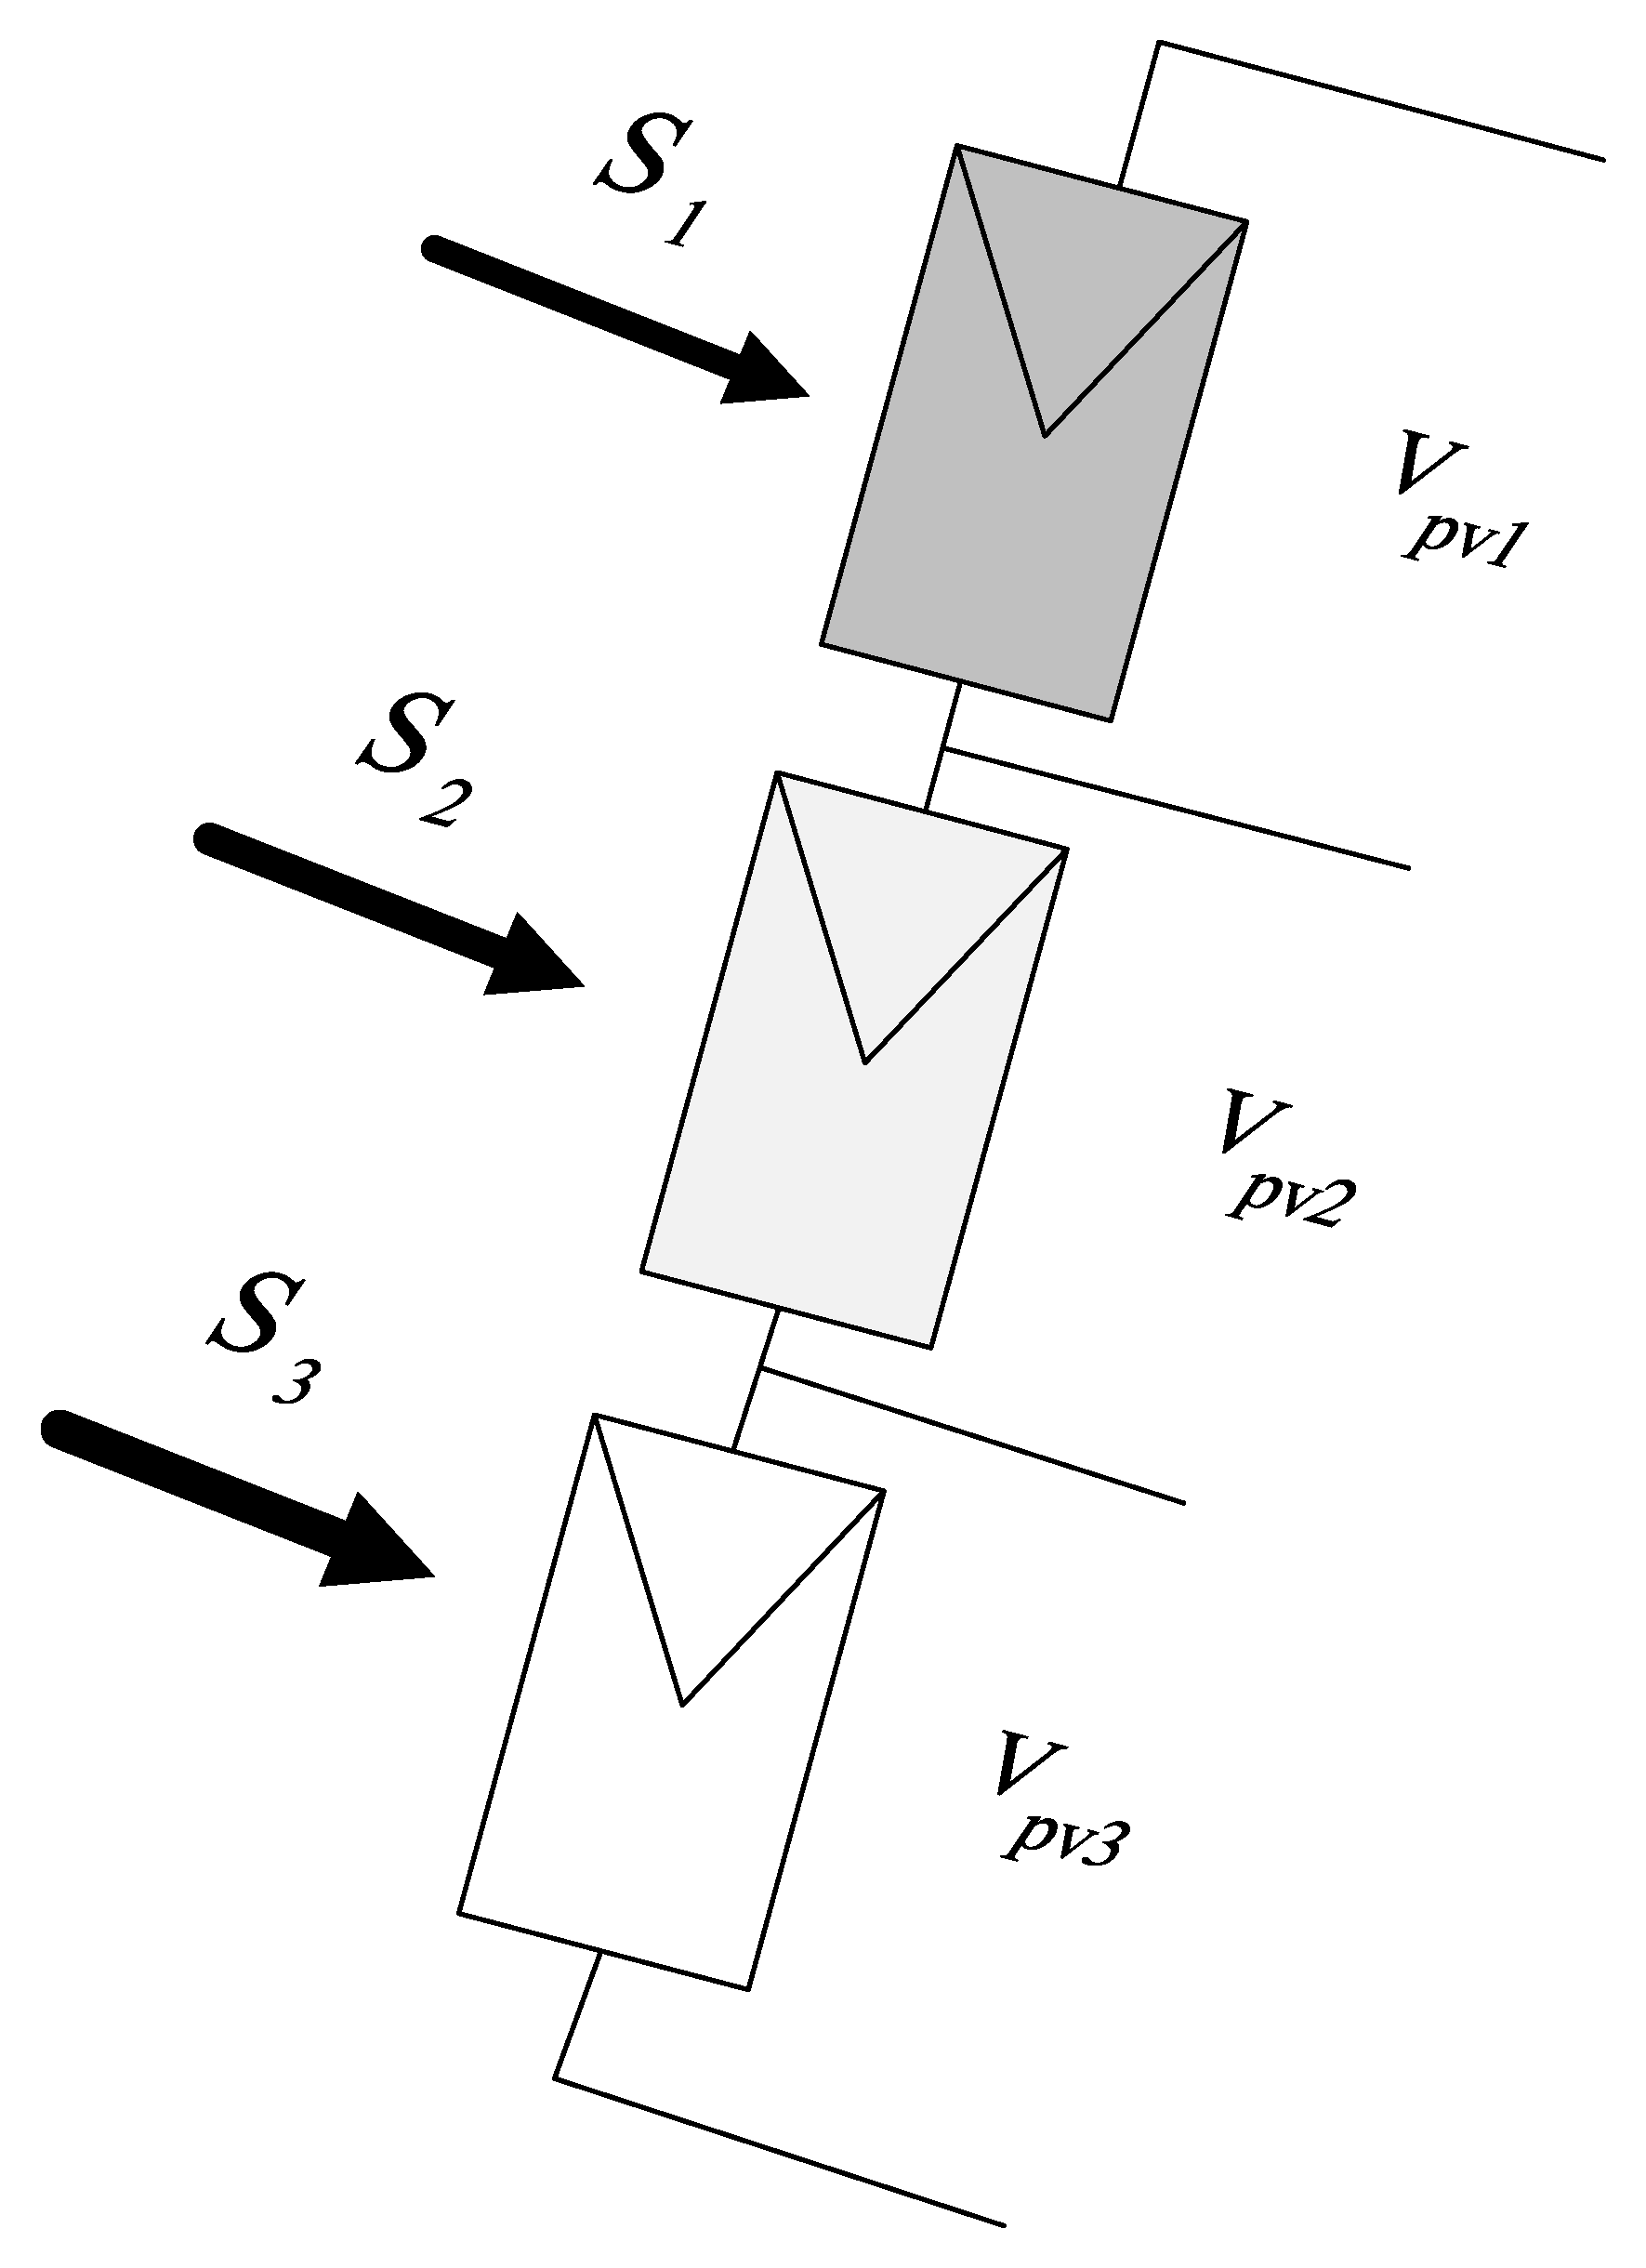
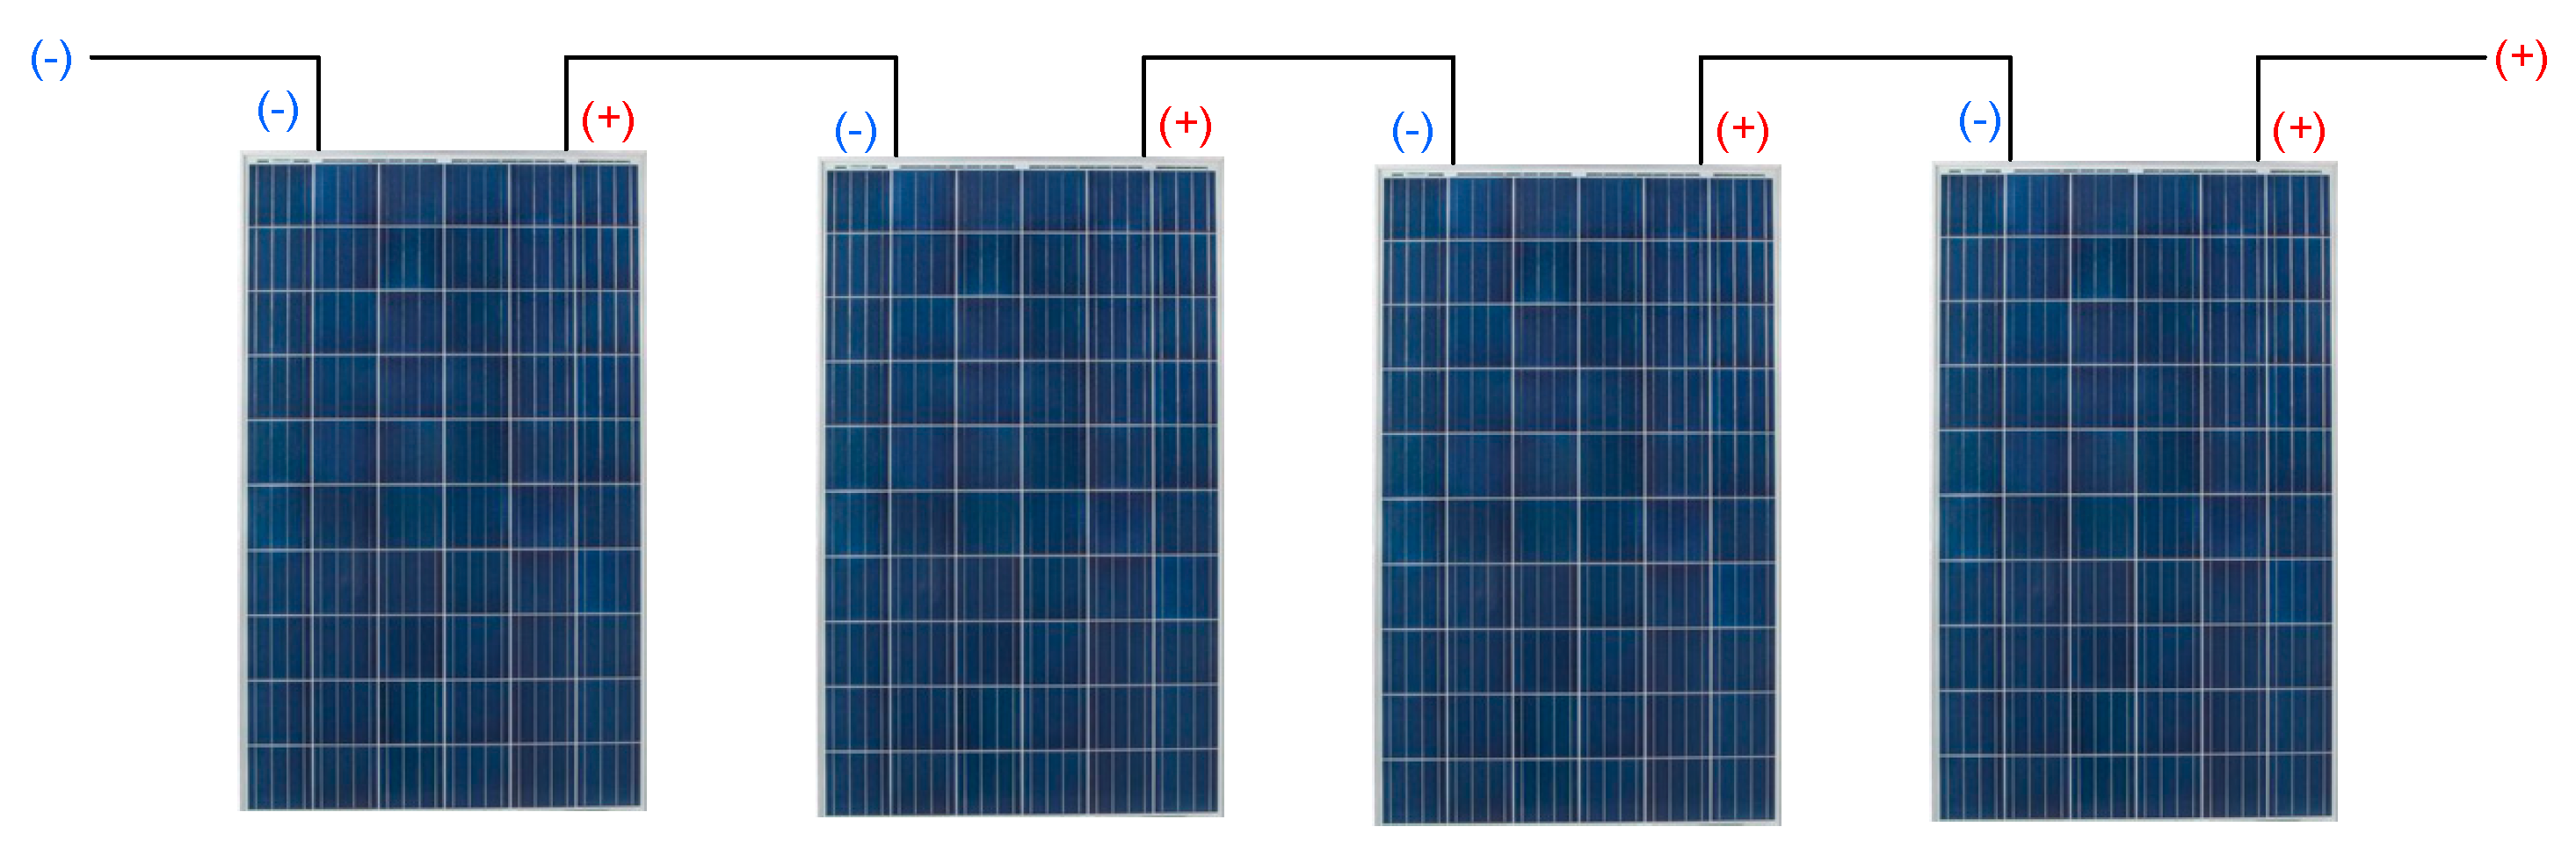
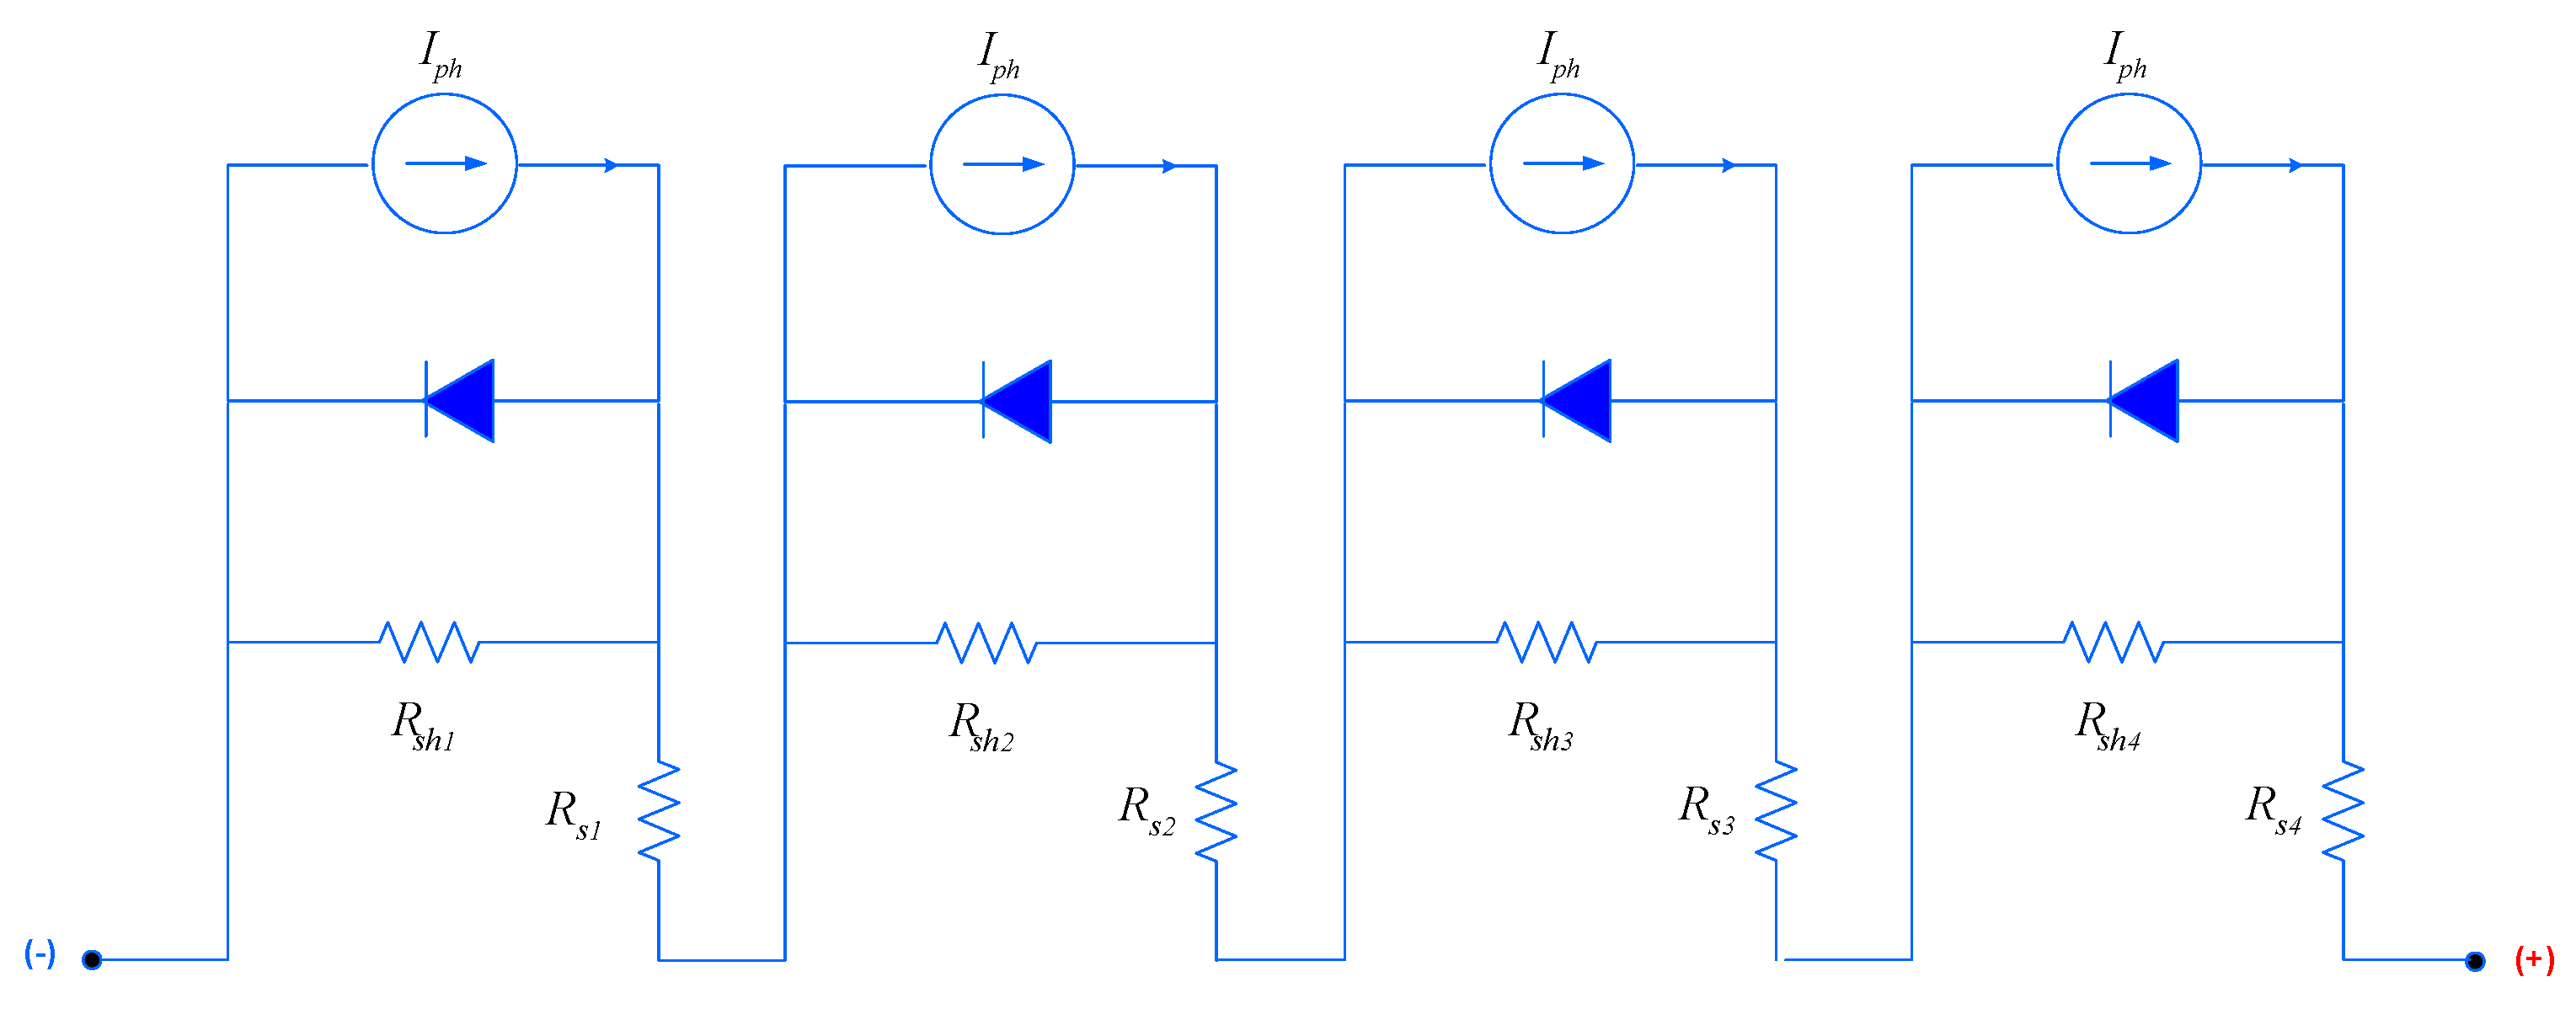
Continuing with the model of the equivalent circuit of the photovoltaic panel, the effect that partial shading has in photovoltaic systems is considered below. For this, four panels connected in series are shown (
Figure 5). The four panels, seen as an equivalent circuit, are also shown in
Figure 6. A photovoltaic module is partially shaded when it does not receive the total available irradiation in one or more modules in the chain. Some causes of this shading are trees, birds, snow, and buildings, among others.
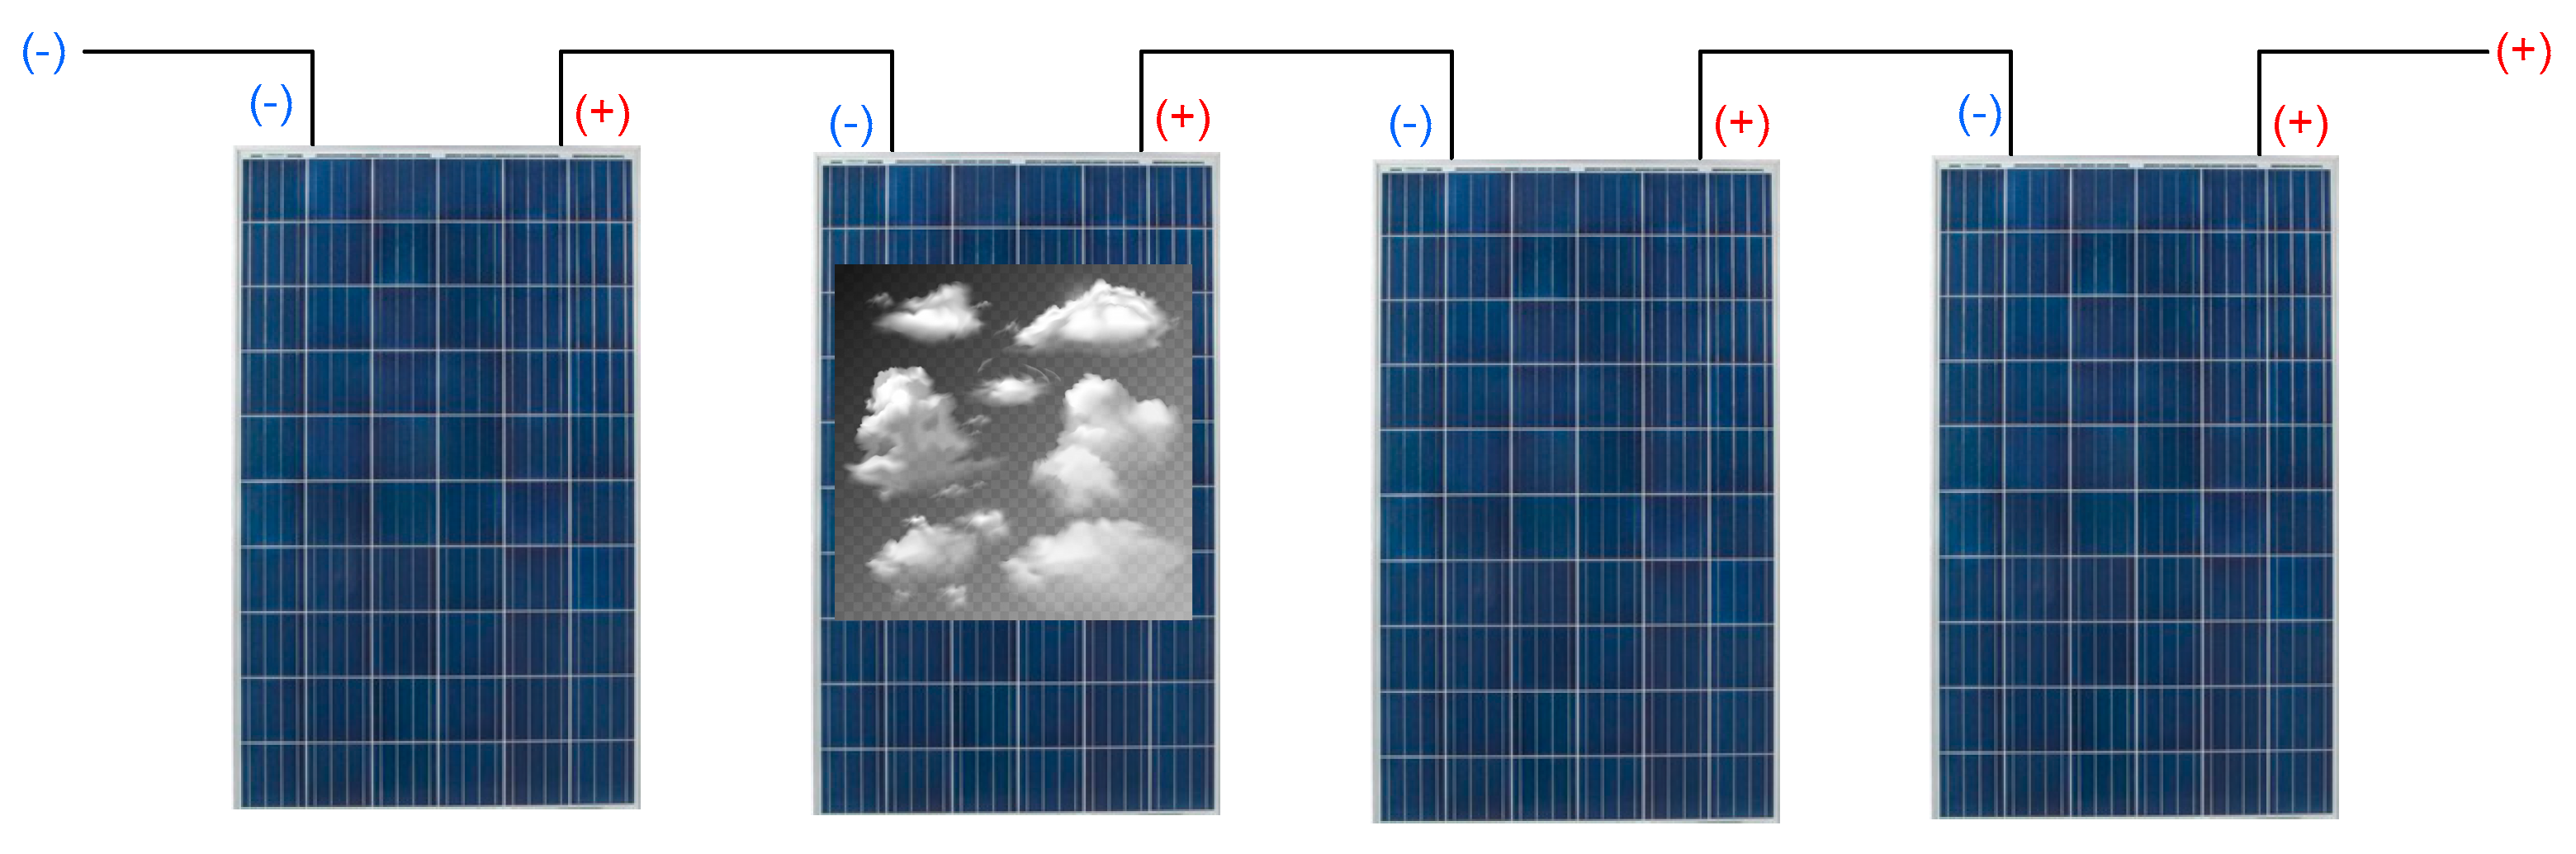
If we take the example of
Figure 6 and shade a panel of the array (
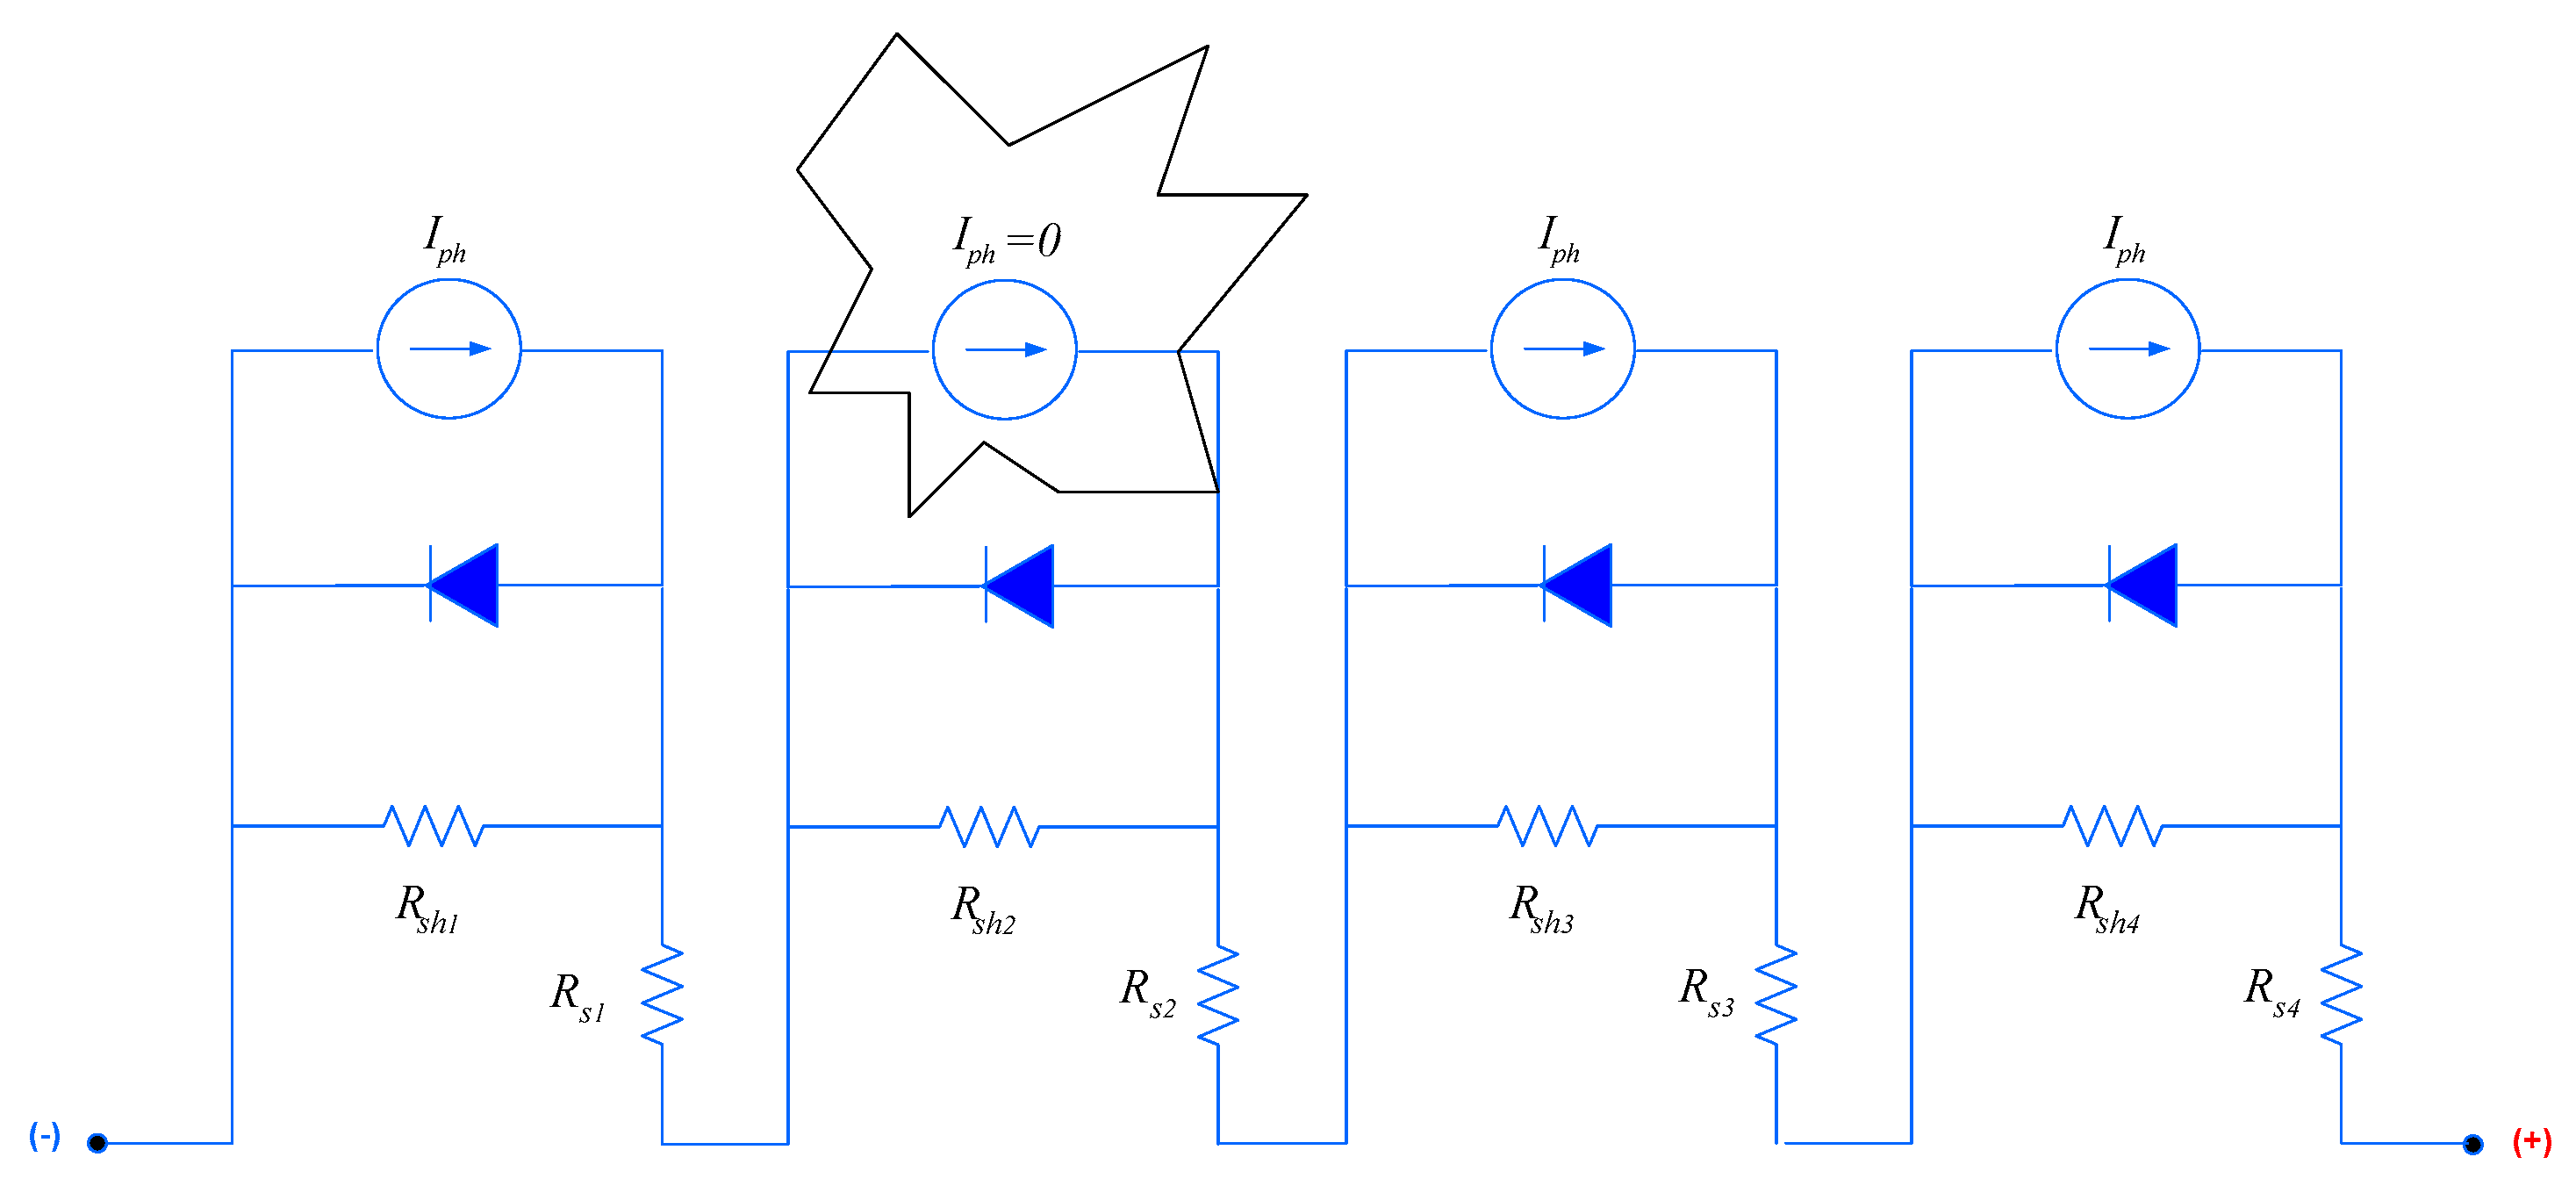
Figure 7), the shadow at module 2 does not allow the supply of current, and there is a limitation in its supply, so the equivalent circuit, in this case, would be the one shown in
Figure 8.
It can be seen that because the source does not receive radiation, it does not supply current and behaves like an open circuit, so the current flows through the resistance
Rsh2 (
Figure 9).
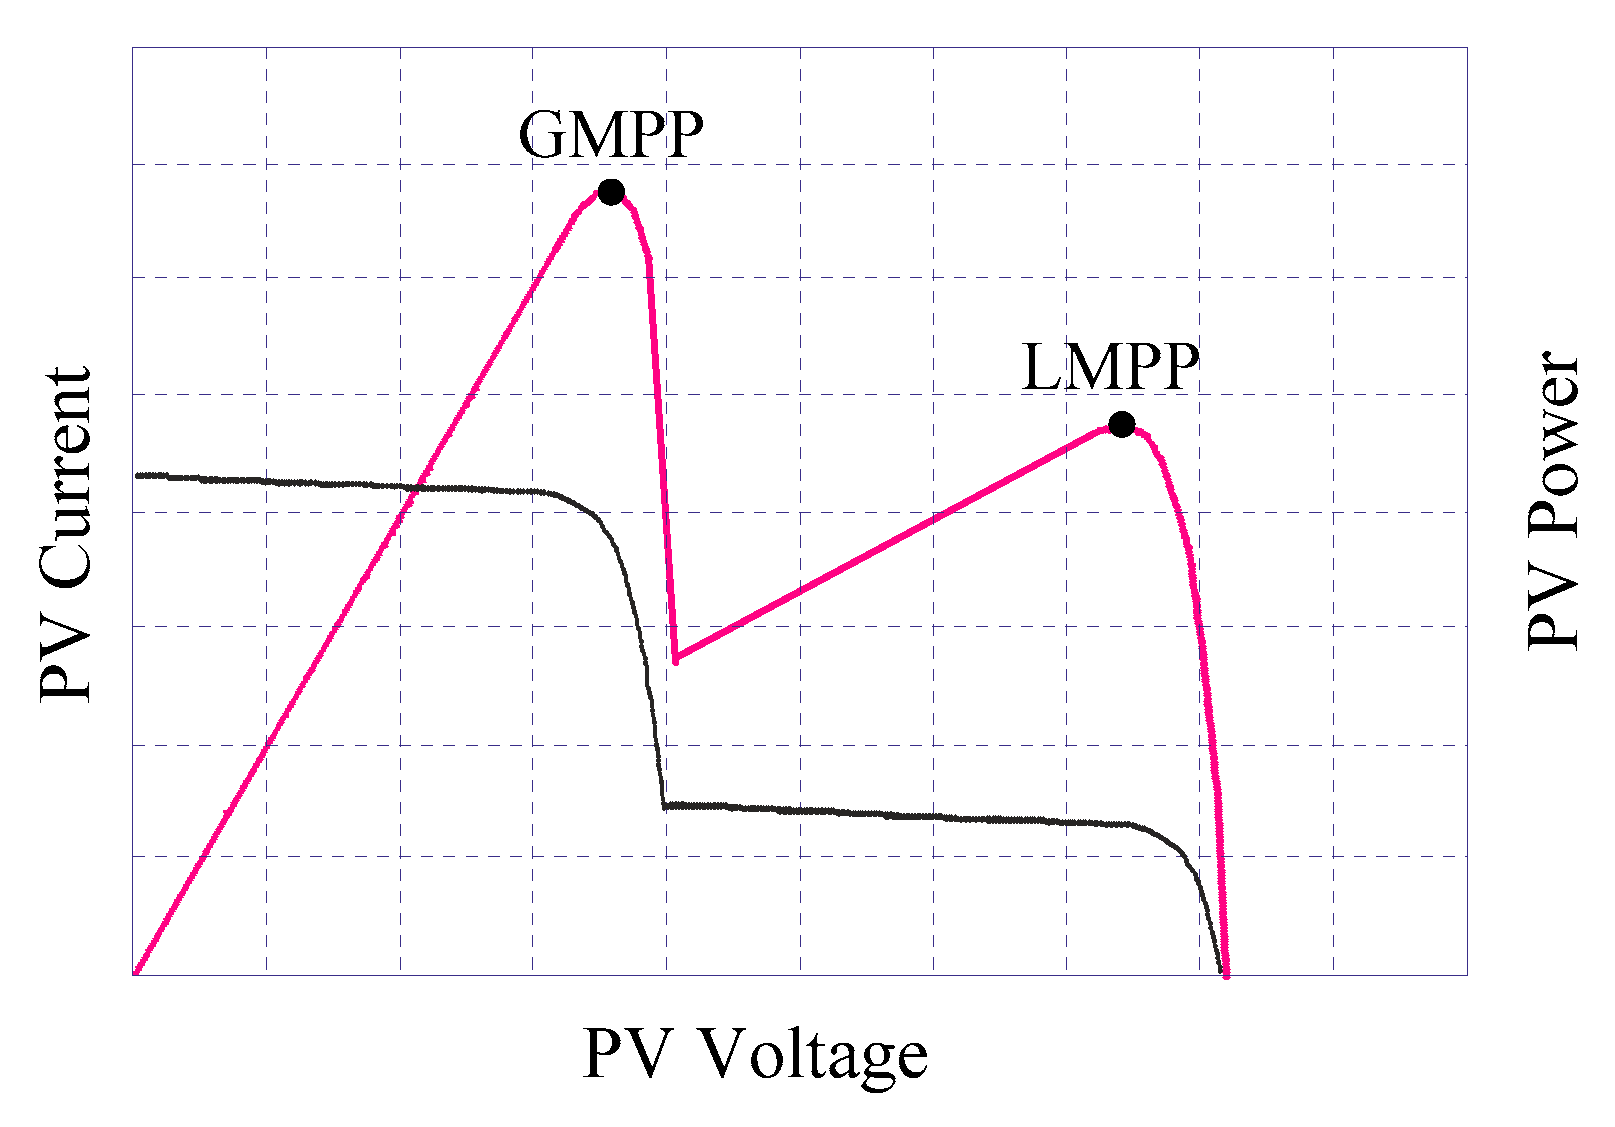
In
Figure 10, a characteristic curve is represented when some of a module’s cells are shaded. The algorithm needs to be robust and efficient to be able to detect the maximum power point and prevent it from being in a top call place. Due to partial shading, the modules have different IV curves. When they are connected in series or parallel, different IV curves are superimposed, generating an IV curve with multiple inflections and, consequently, a PV curve with various maximum power points, as shown in
Figure 10. Under the effect of PSC, the system has a considerable loss of control, which can become even more significant if it does not have a proper MPPT method.
3. MPPT Using Simulated Annealing
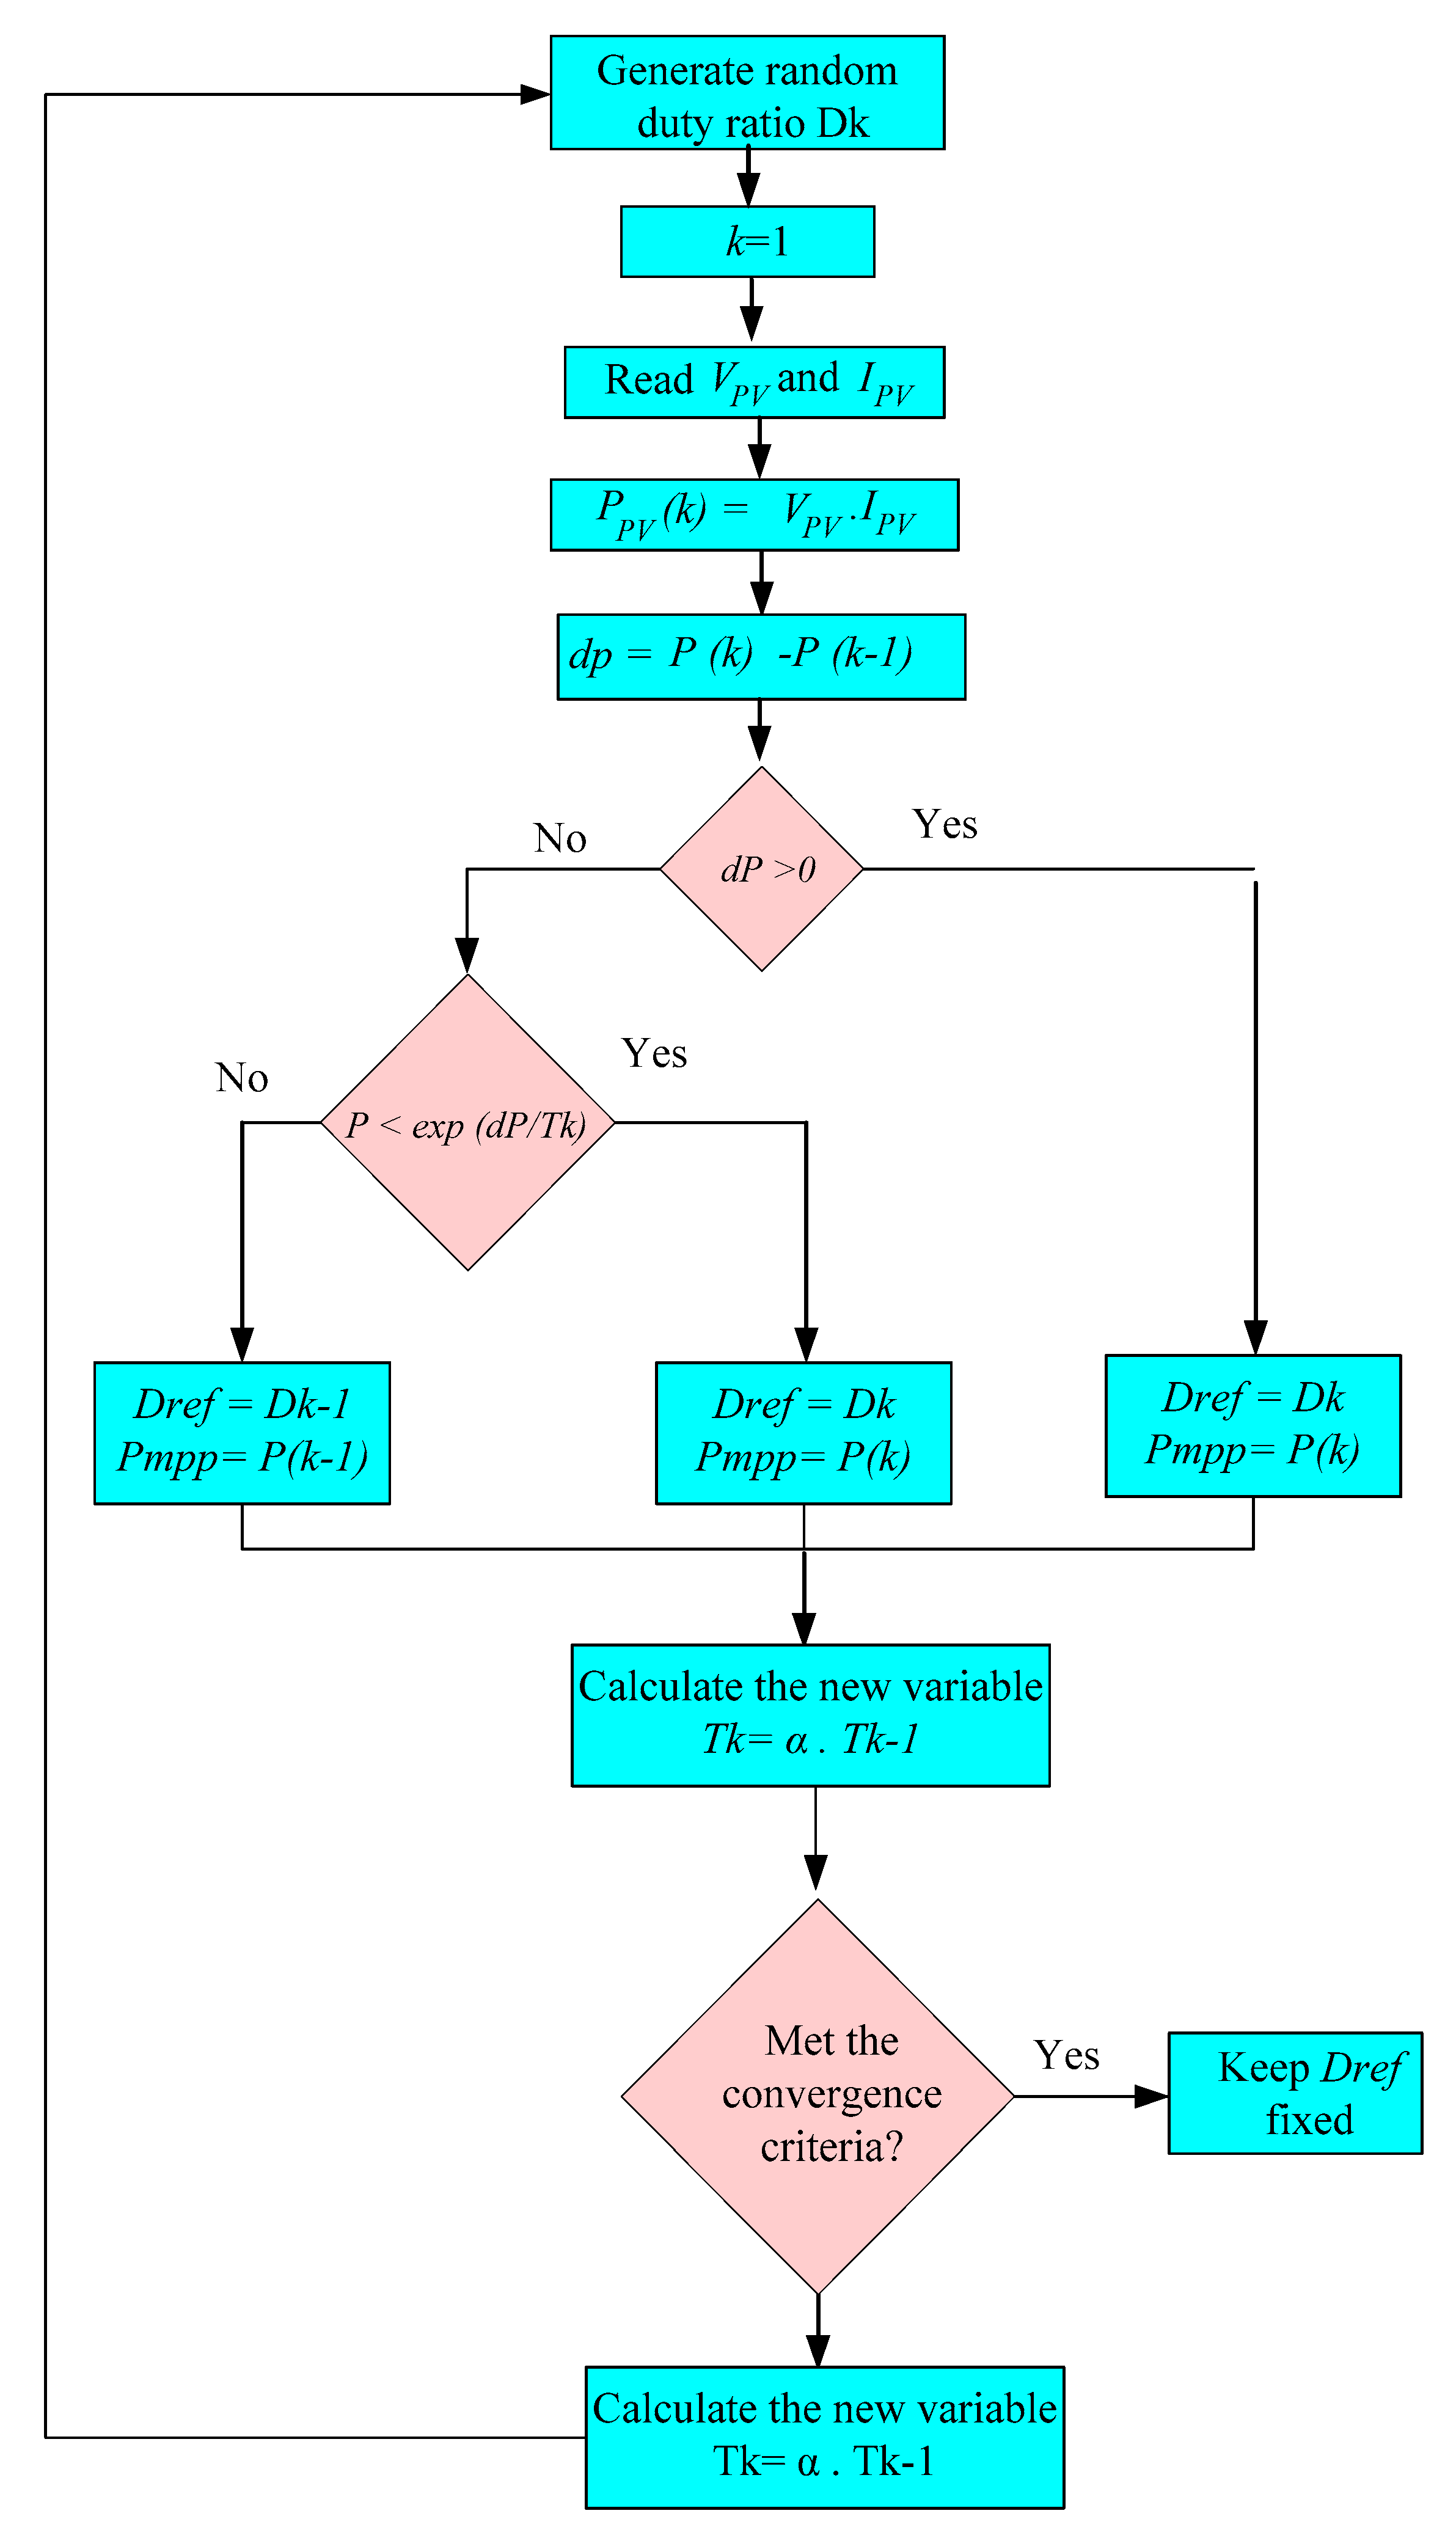
The simulated annealing method in
Figure 11 is based on a metallurgy technique, and involves controlled heating and cooling of a material. This technique aims to reduce defects by increasing the size of a material’s crystals.
The heating and cooling of the material affect the temperature and the free thermodynamic energy. Although the same decrease in temperature causes the same decrease in free thermodynamic energy, cooling at a given rate causes a more significant reduction in free energy.
This temperature reduction approach is implemented in the simulated annealing algorithm as it is the optimum solution [
24,
25,
26].
The method starts with a random solution, Pi and selects a neighboring solution Pk. After calculating the cost of the two solutions, their difference ∆P = Pk − Pi is calculated. If ∆P is less than zero, then the value of the objective function of the neighboring solution is better, and replaces the current solution Pi with Pk.
If ∆P is greater than or equal to zero, the solution with the worst result is accepted. The value of this probability decreases with the number of iterations. If the value of pr is more significant than a random number between zero and one, the solution with the worst result is accepted. This procedure is repeated until a stopping criterion is satisfied.
One of the main advantages of this algorithm is that it allows testing solutions that differ from those currently available. It thus minimizes the possibility of the energy generated by the system oscillating over a local maximum point indefinitely.
To extract the MPPT of a PV module, the probability of acceptance is given by [
27]:
where
Pk is the measured power,
Pi is the best power defined up to the time of the search, and the parameter
Tk corresponds to the current variable parameter with iterations (called temperature) of the search process. Several methods can define parameter reduction; however, there are two commonly used methods. One consists of geometric reduction, which is given by [
28,
29]:
where α < 1 is the geometric cooling constant
. Another method for updating the parameter
Tk was proposed by [
30], and calculated as follows:
where
β controls Lundy’s cooling schedule; however, regardless of how
Tk is updated, this method needs to be restarted when changes in the conditions of the environment occur. The first equation for
Tk is best used since there is no need to restart the calculations in the case of environmental changes.
3.1. Perturbation and Observation (P&O) Algorithm
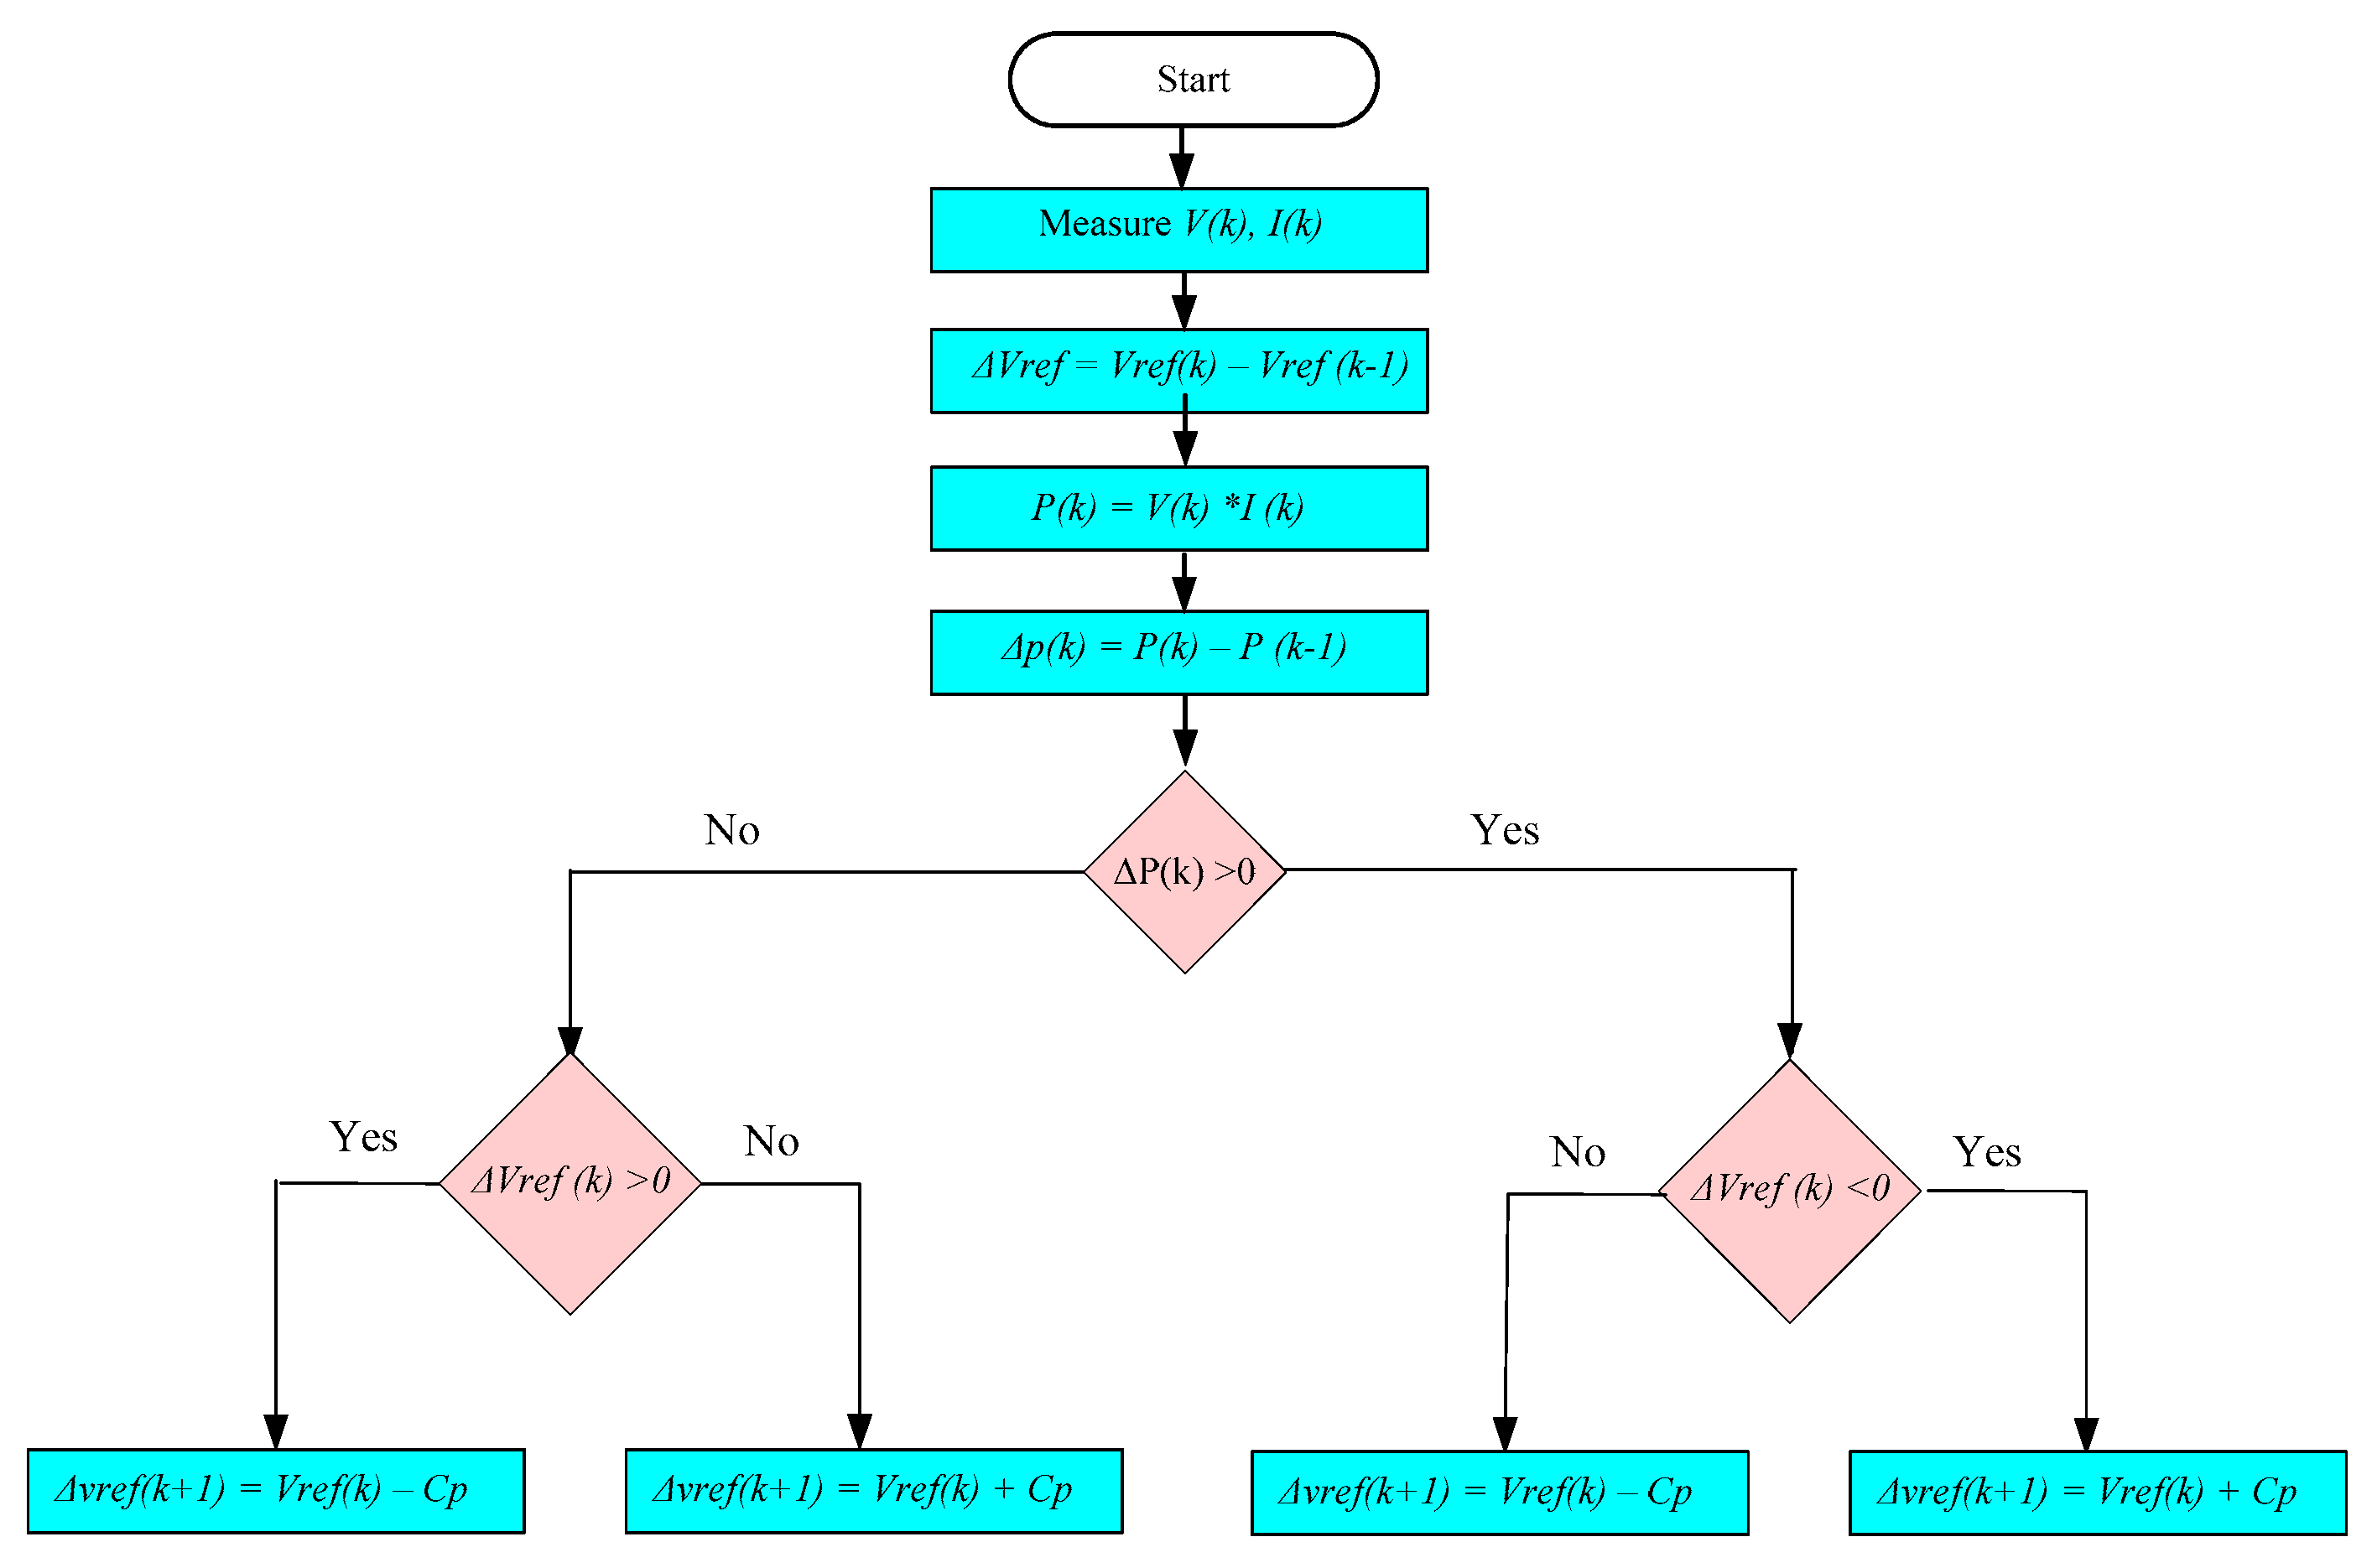
The P&O method is based on the modification of the trip ratio or duty cycle (D) of the boost converter that modifies the value of the current supplied by the photovoltaic panel. This method consists of monitoring the board operating voltage (
Vpv); for example, if the voltage rises (disturbance) and the power drawn by the load increases (observation) it means that the operating point has moved towards the maximum power point, at which point the operating voltage should be disturbed in the same direction. By contrast, if the power extracted by the load decreases, the operating point has moved in the opposite direction to the maximum power point as evidenced in the flow diagram in
Figure 12.
3.2. SA-P&O Algorithm
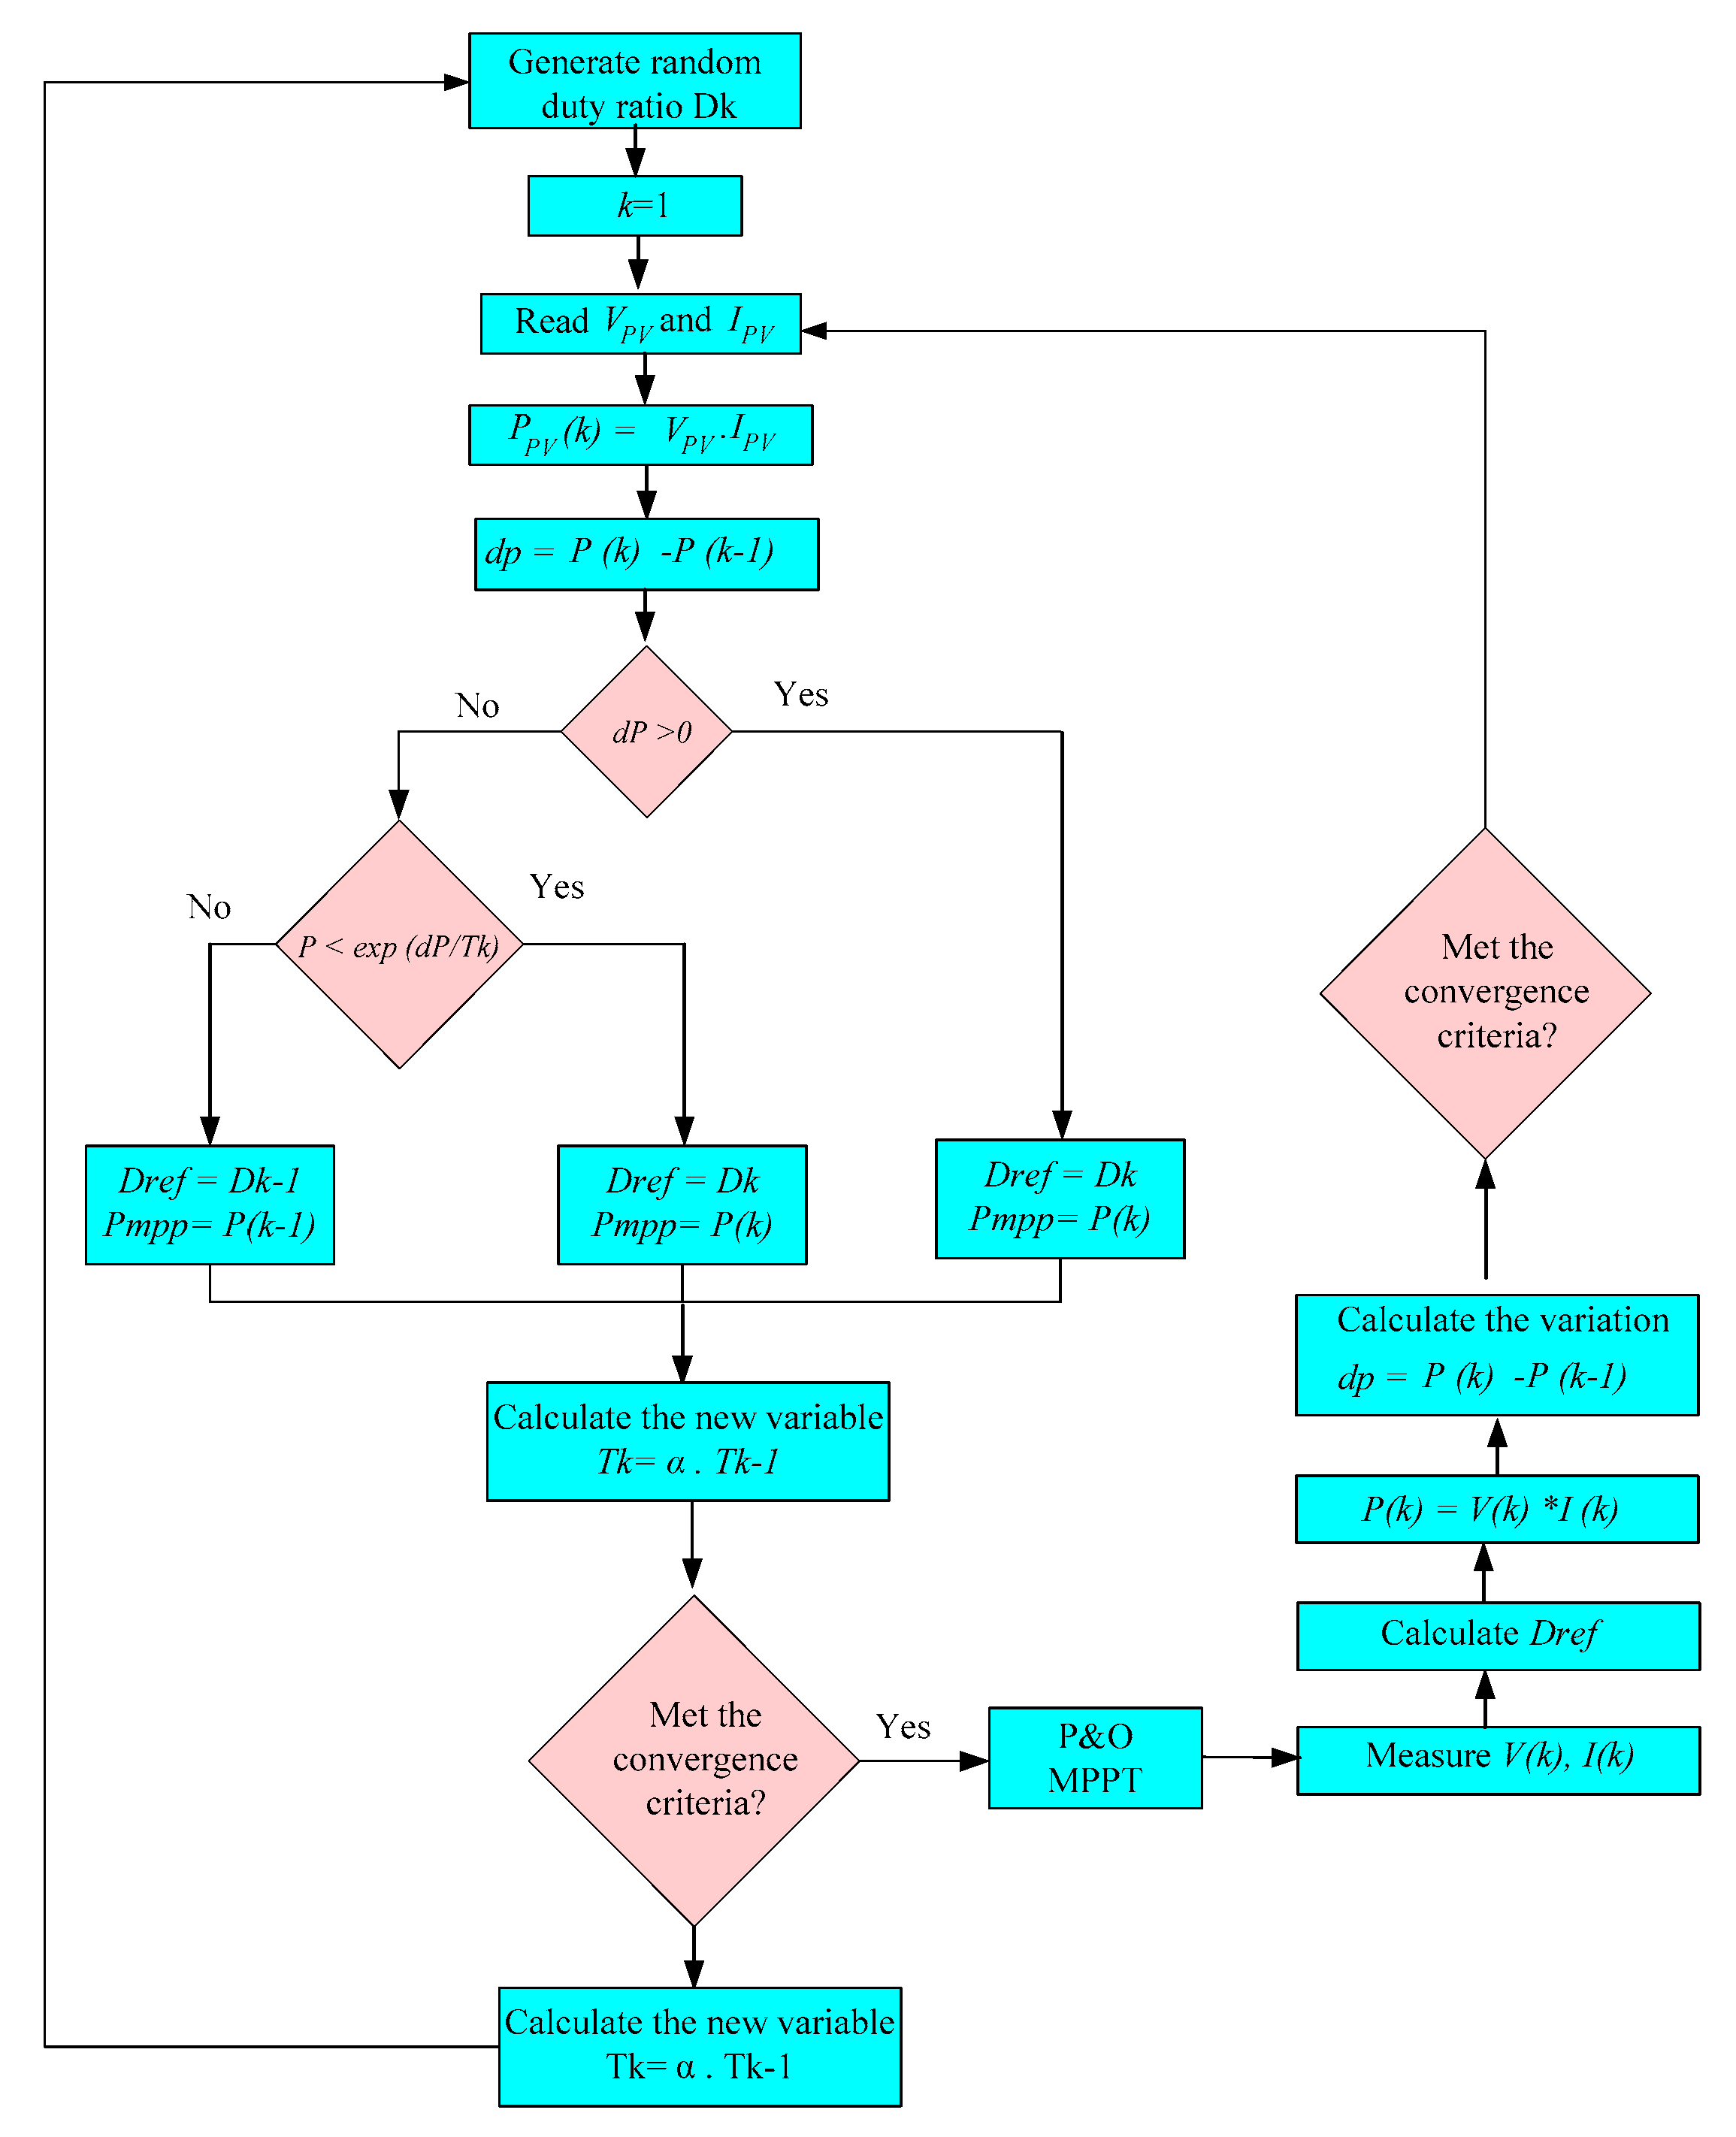
The SA-P&O algorithm uses the SA technique to reach a point close to the global maximum power point. Soon after finding it, the algorithm switches to the P&O method, which starts with referencing the best power point found defined by the SA method.
Figure 13 shows the flowchart for this algorithm, the SA-P&O MPPT.
Figure 13 shows the SA-P&O hybrid MPPT algorithm.
4. Results and Discussion
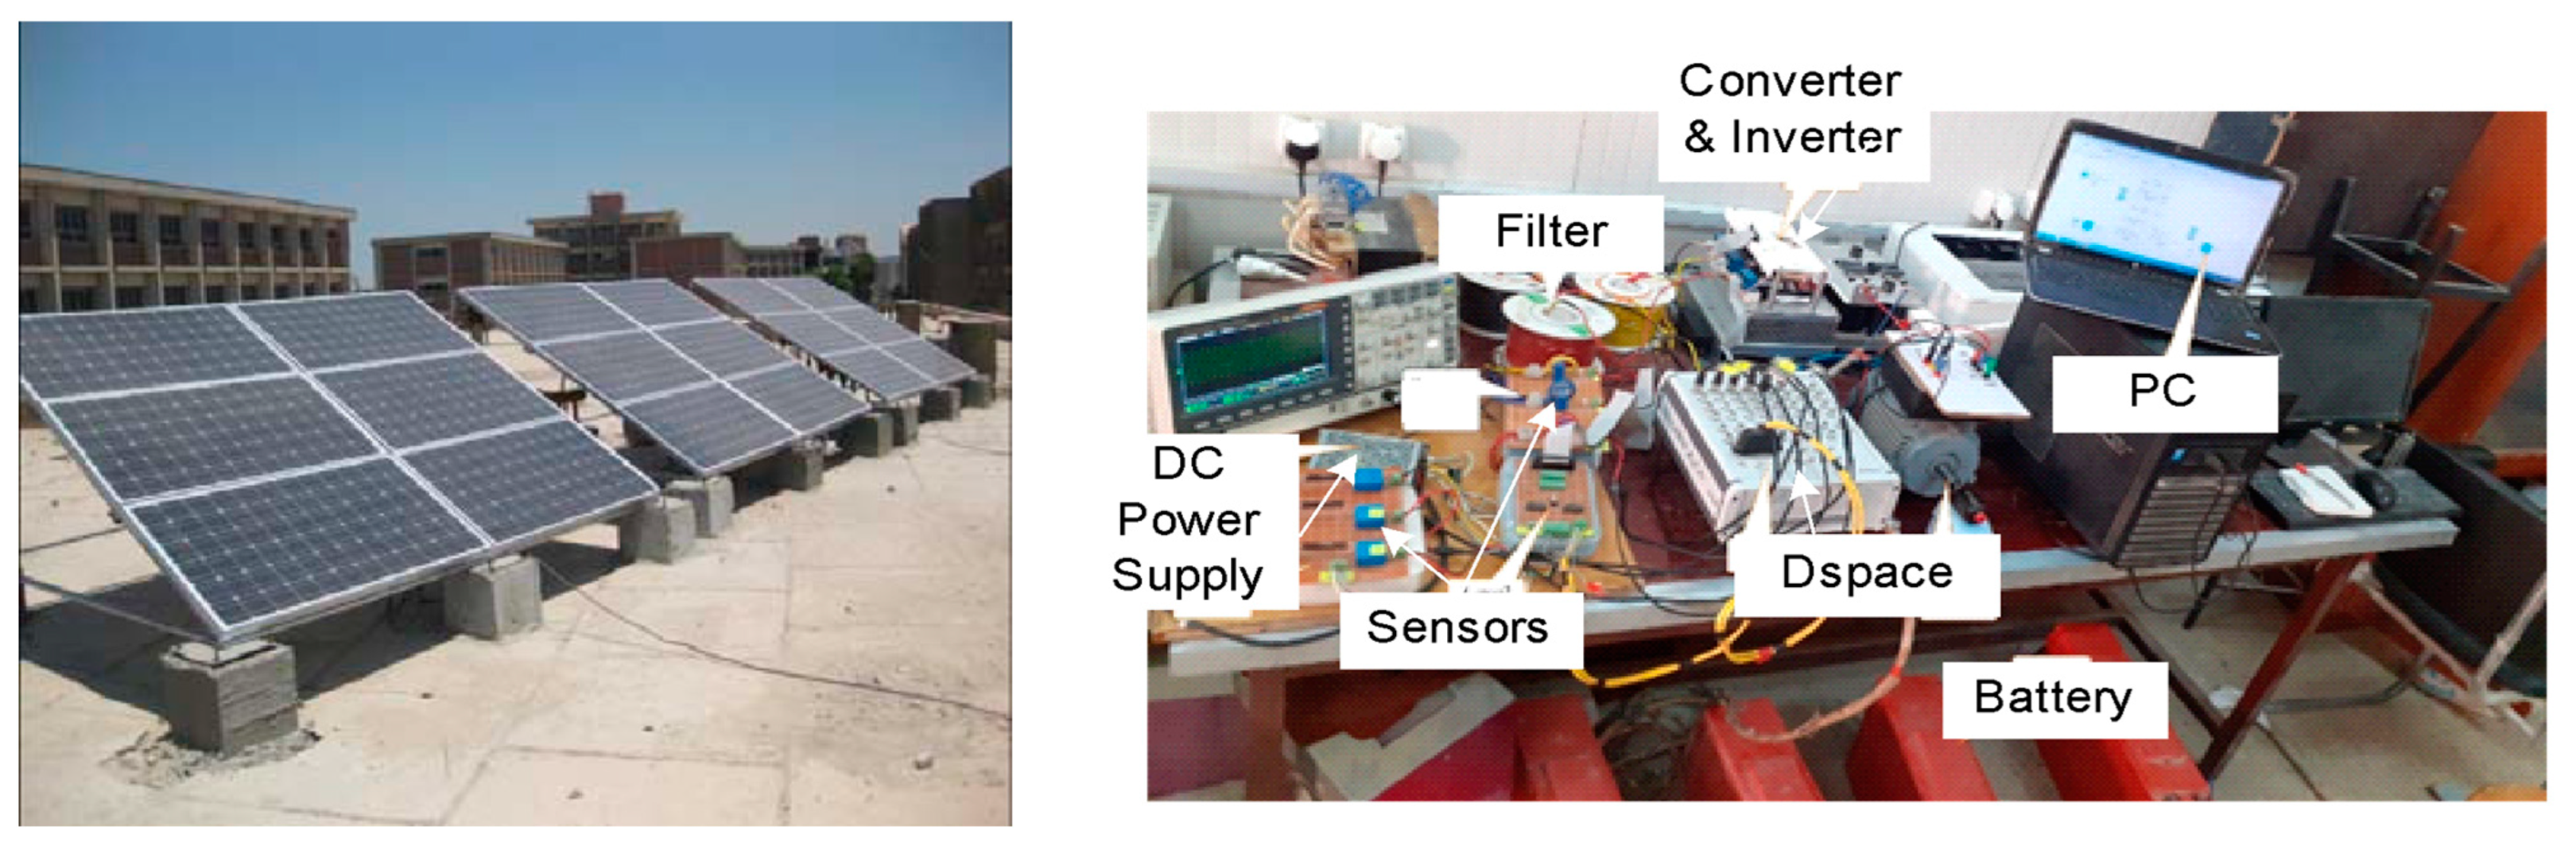
The performance of the SA-P&O-based MPPT algorithm was evaluated using experimental results for the system configuration shown in
Figure 14. An empirical analysis was performed using Microlabbox for the implementation of the MPPT, a DC-DC boost converter, a DC/AC converter to adapt the voltage to the connection grid utility, and a passive L filter were used. The SA-P&O-based MPPT algorithm was compared to the traditional P & O-based MPPT algorithm. Both MPPT algorithms were compared considering the following cases: (1) the photovoltaic arrangement operates in STC (as shown in
Figure 5), and case (2) when the photovoltaic arrangement works under partial shading conditions (as shown in
Figure 7). In the latter case, two photovoltaic panels were partially shaded, in which the first was subjected to 300 W/m
2 solar radiation, while the second was subjected to 500 W/m
2 solar radiation.
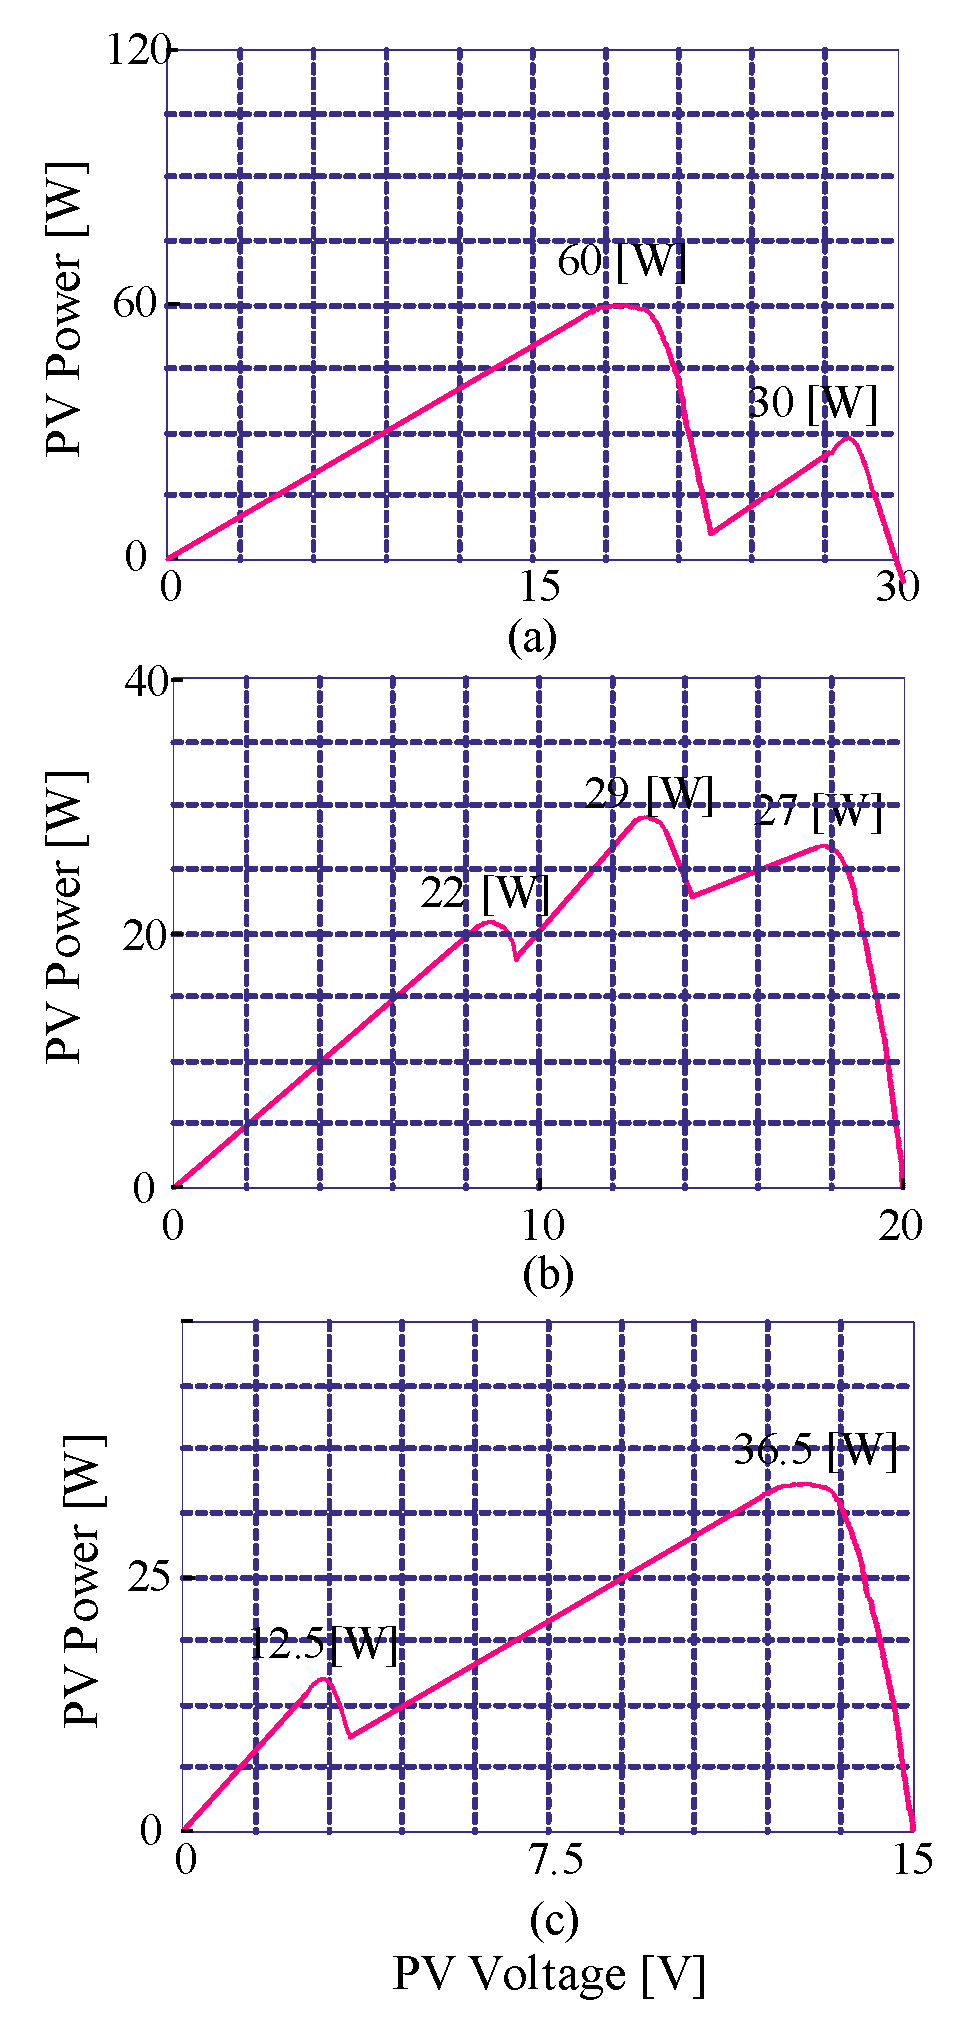
The MPPT algorithms were evaluated under two different operating conditions of the PV system.
Figure 15a shows the first testing condition characteristic curves (case 1) of the PV module,
Figure 15b shows the characteristic curves for case 2, and
Figure 15c shows case 3. A transparent sheet covered parts of the PV array to simulate partial shading with different patterns in cases 1, 2, and 3.
The experimental results presented in this section show the power extracted from the PV array and the voltage and current at the array’s output terminals obtained for each MPPT algorithm.
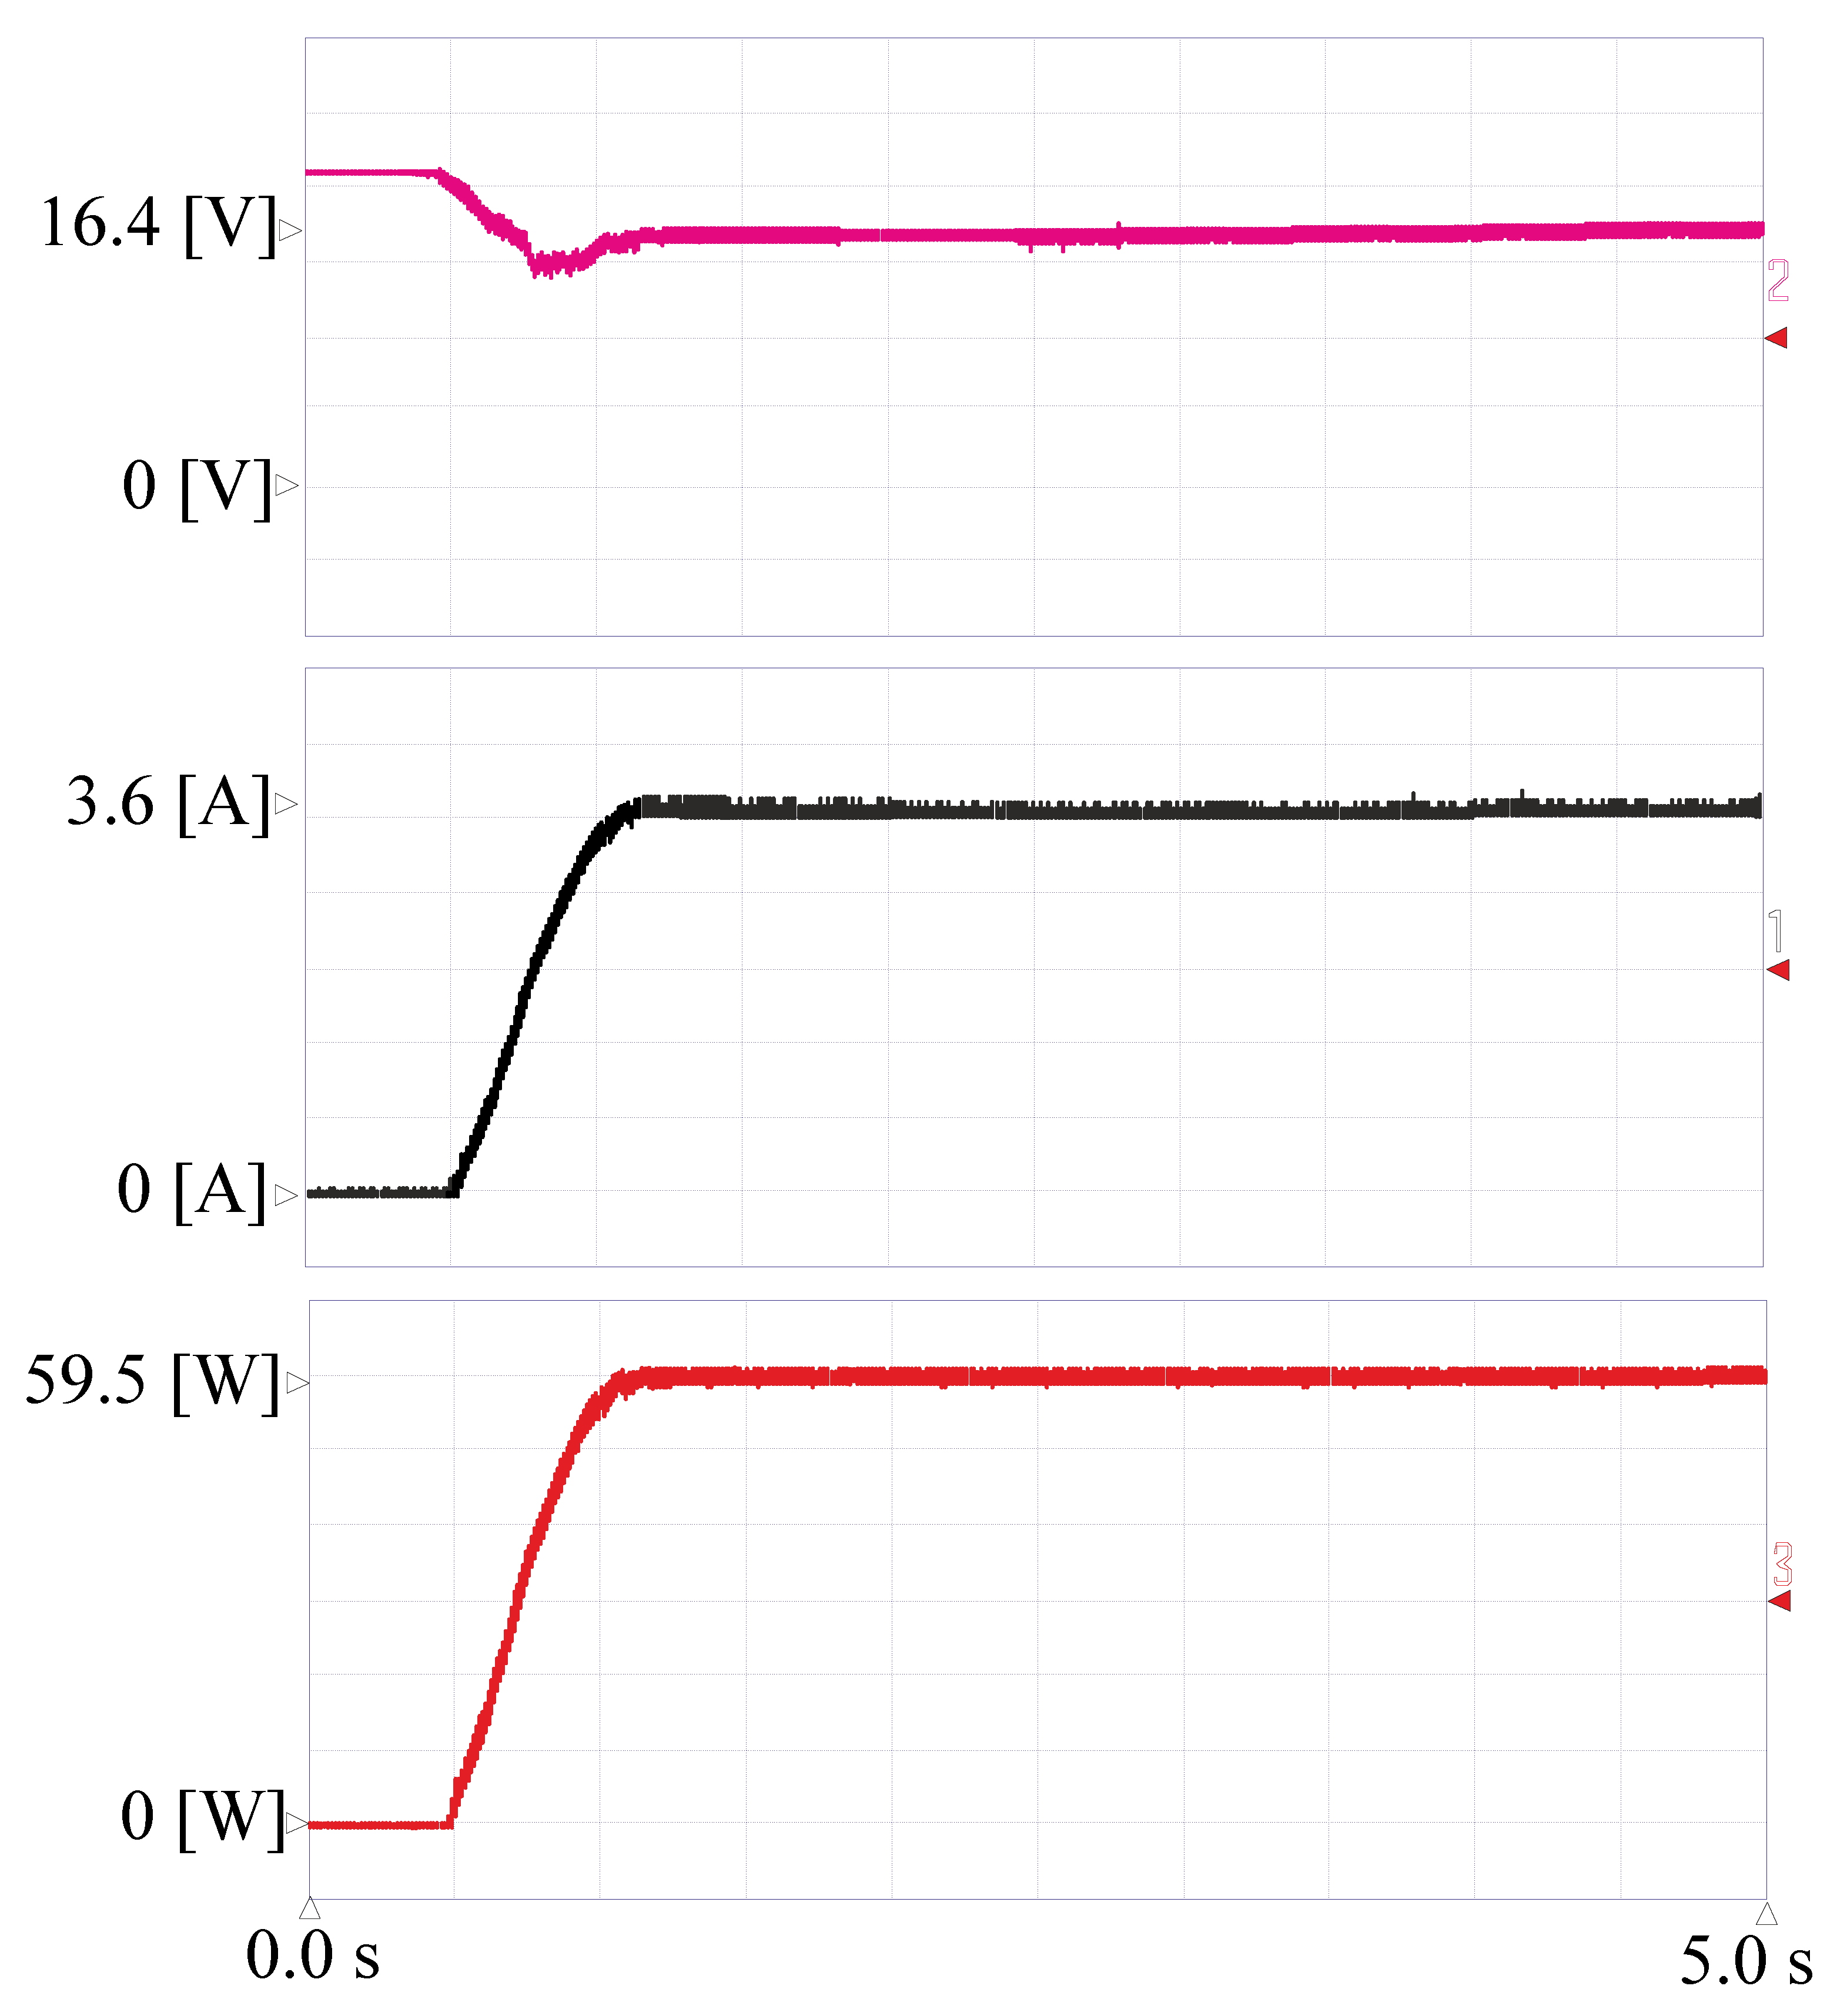
Figure 16 illustrates the power extracted from the PV array operating under partial shading conditions using the P&O algorithm. As shown in
Figure 15, the characteristic curve Ppv × Vpv has one GMPP and two LMPP, with the GMPP equal to 60 W and the LMPP equal to 30 W. The P&O method reached the GMPP first and maintained this value.
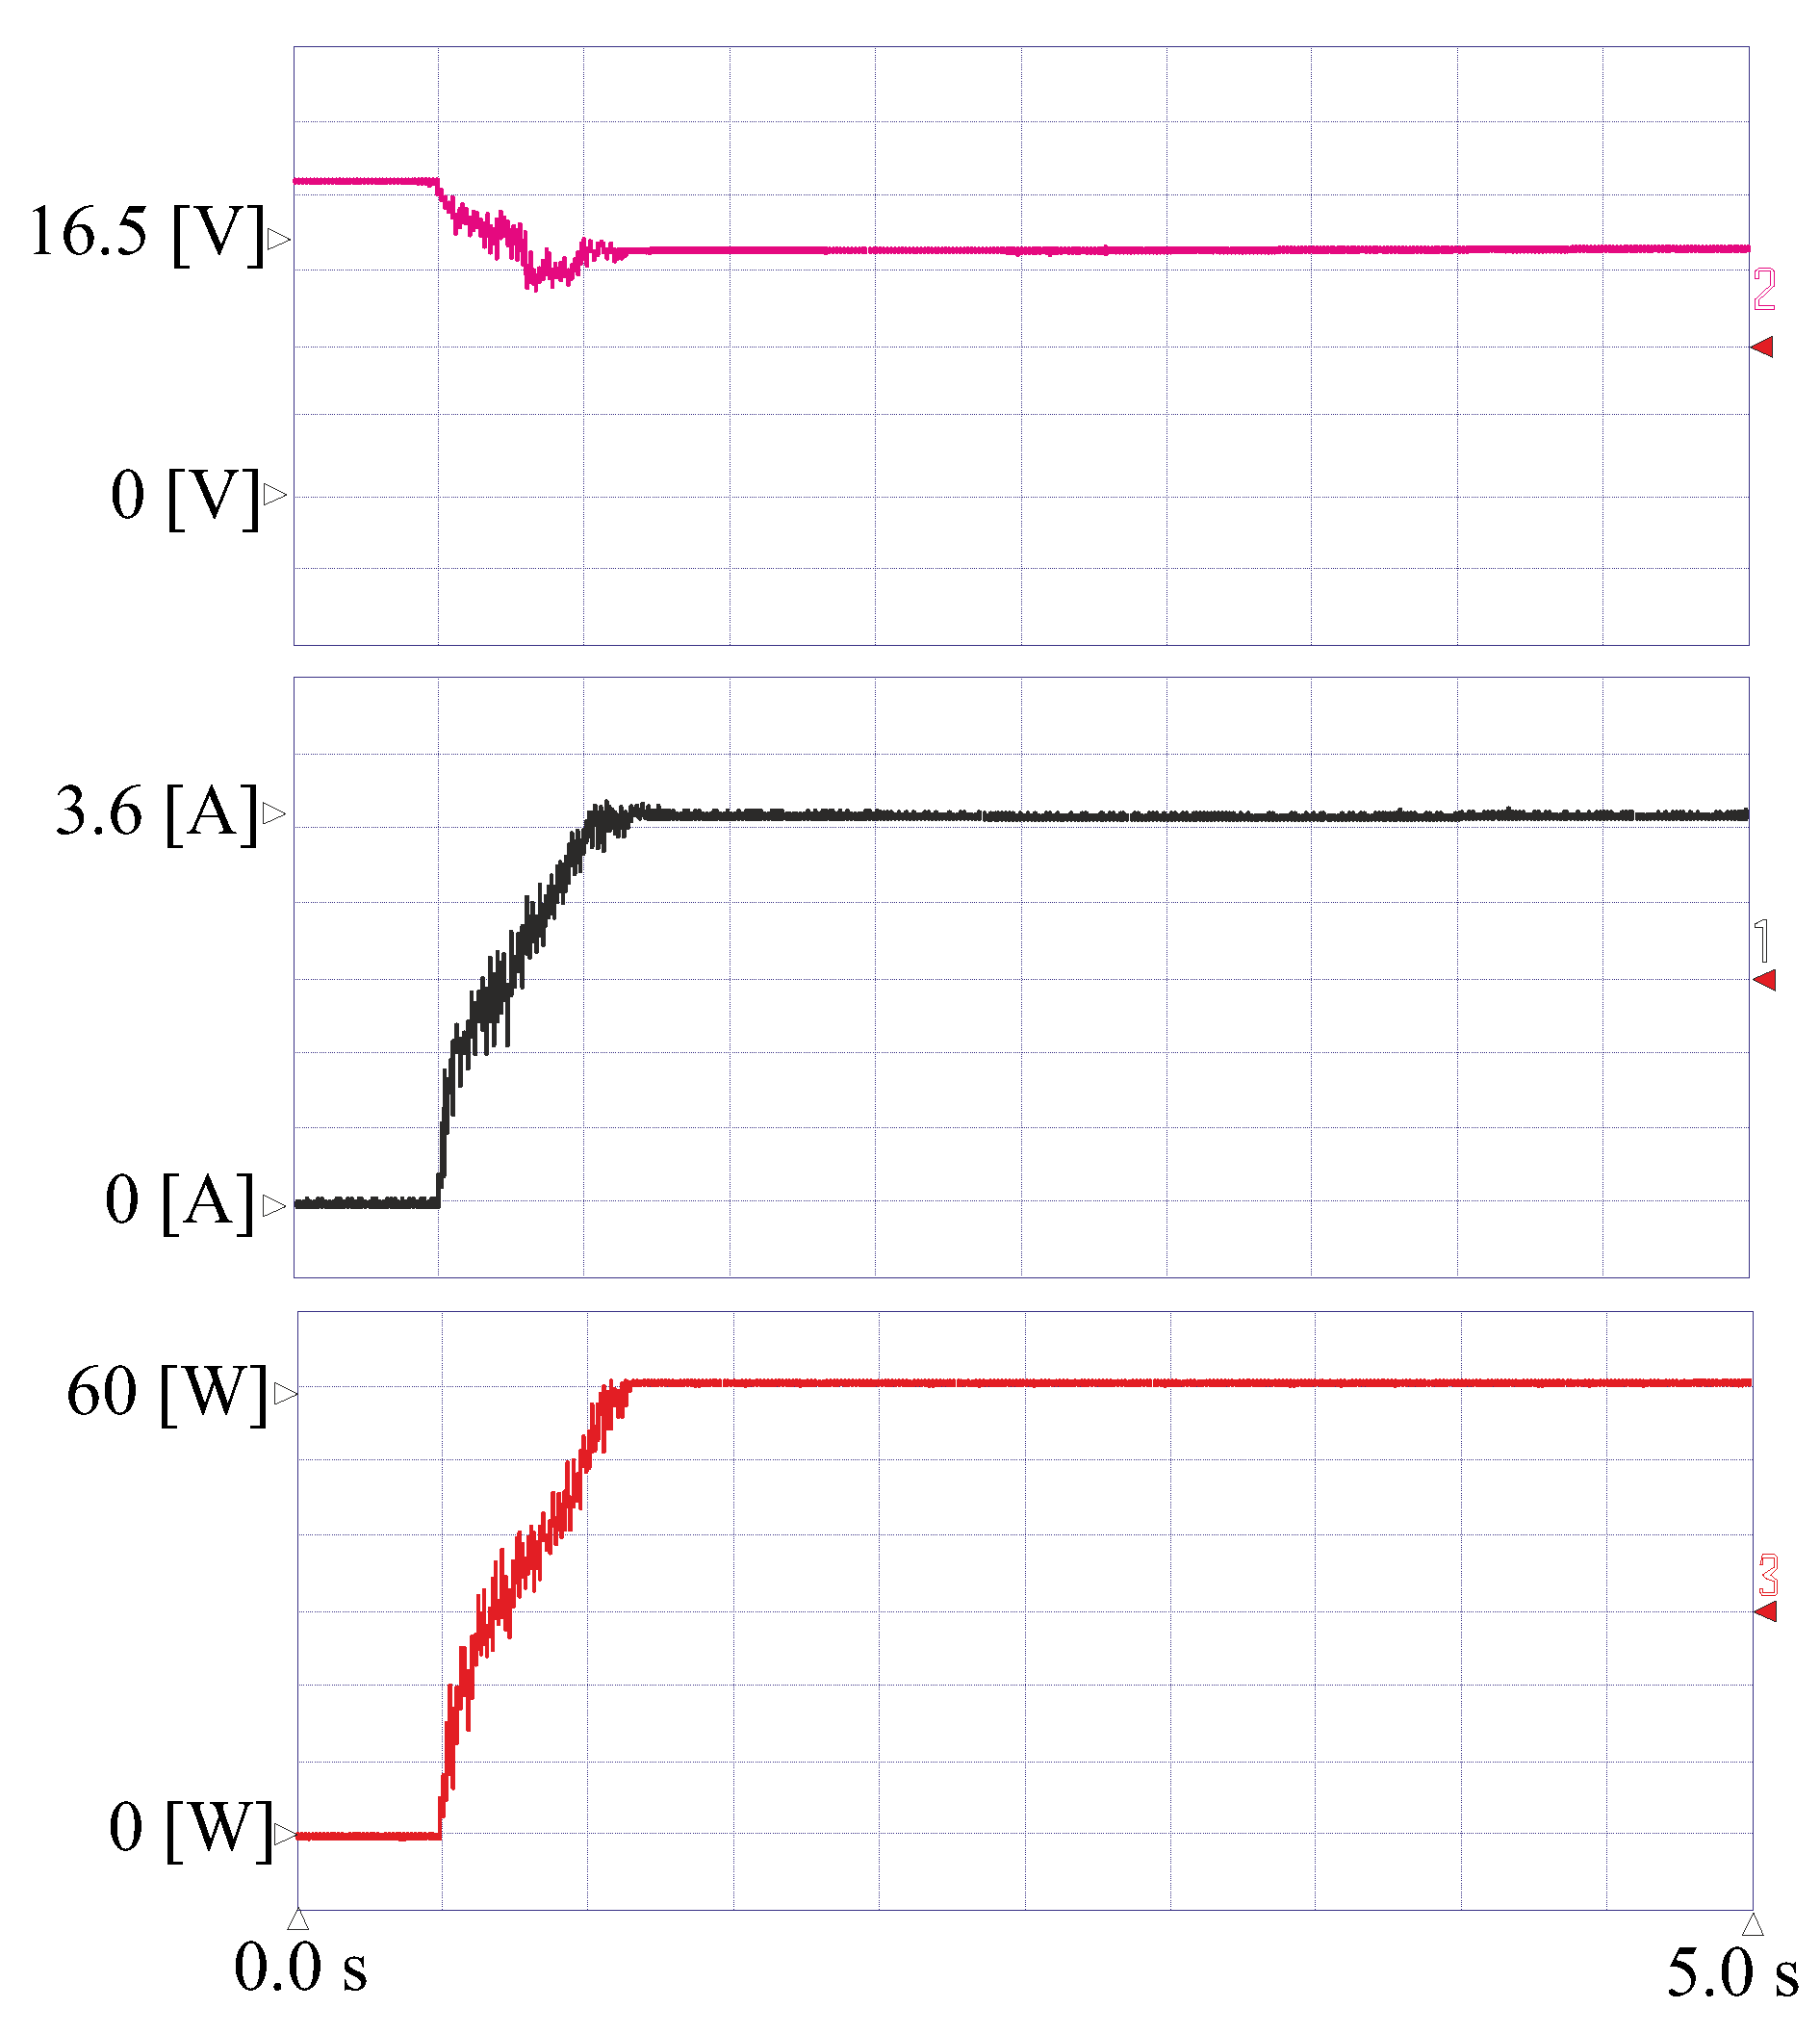
Figure 17 shows the power extracted from the PV array for the SA-based MPPT algorithm. GMPP was achieved, and the method produced a power of 60 W. In addition, this MPPT method resulted in reduced power fluctuations in steady-state. The results demonstrate that the SA-P&O-based MPPT algorithm can quickly convert to GMPP when the PV array operates under partial shading conditions. In addition, the proposed MPPT method consistently showed less power fluctuation and greater efficiency in tracking when compared to the traditional method (P&O).
Figure 16 and
Figure 17 show that the P&O method takes longer to achieve the MPPT and suffers from steady-state ripples more than the SA-P&O.
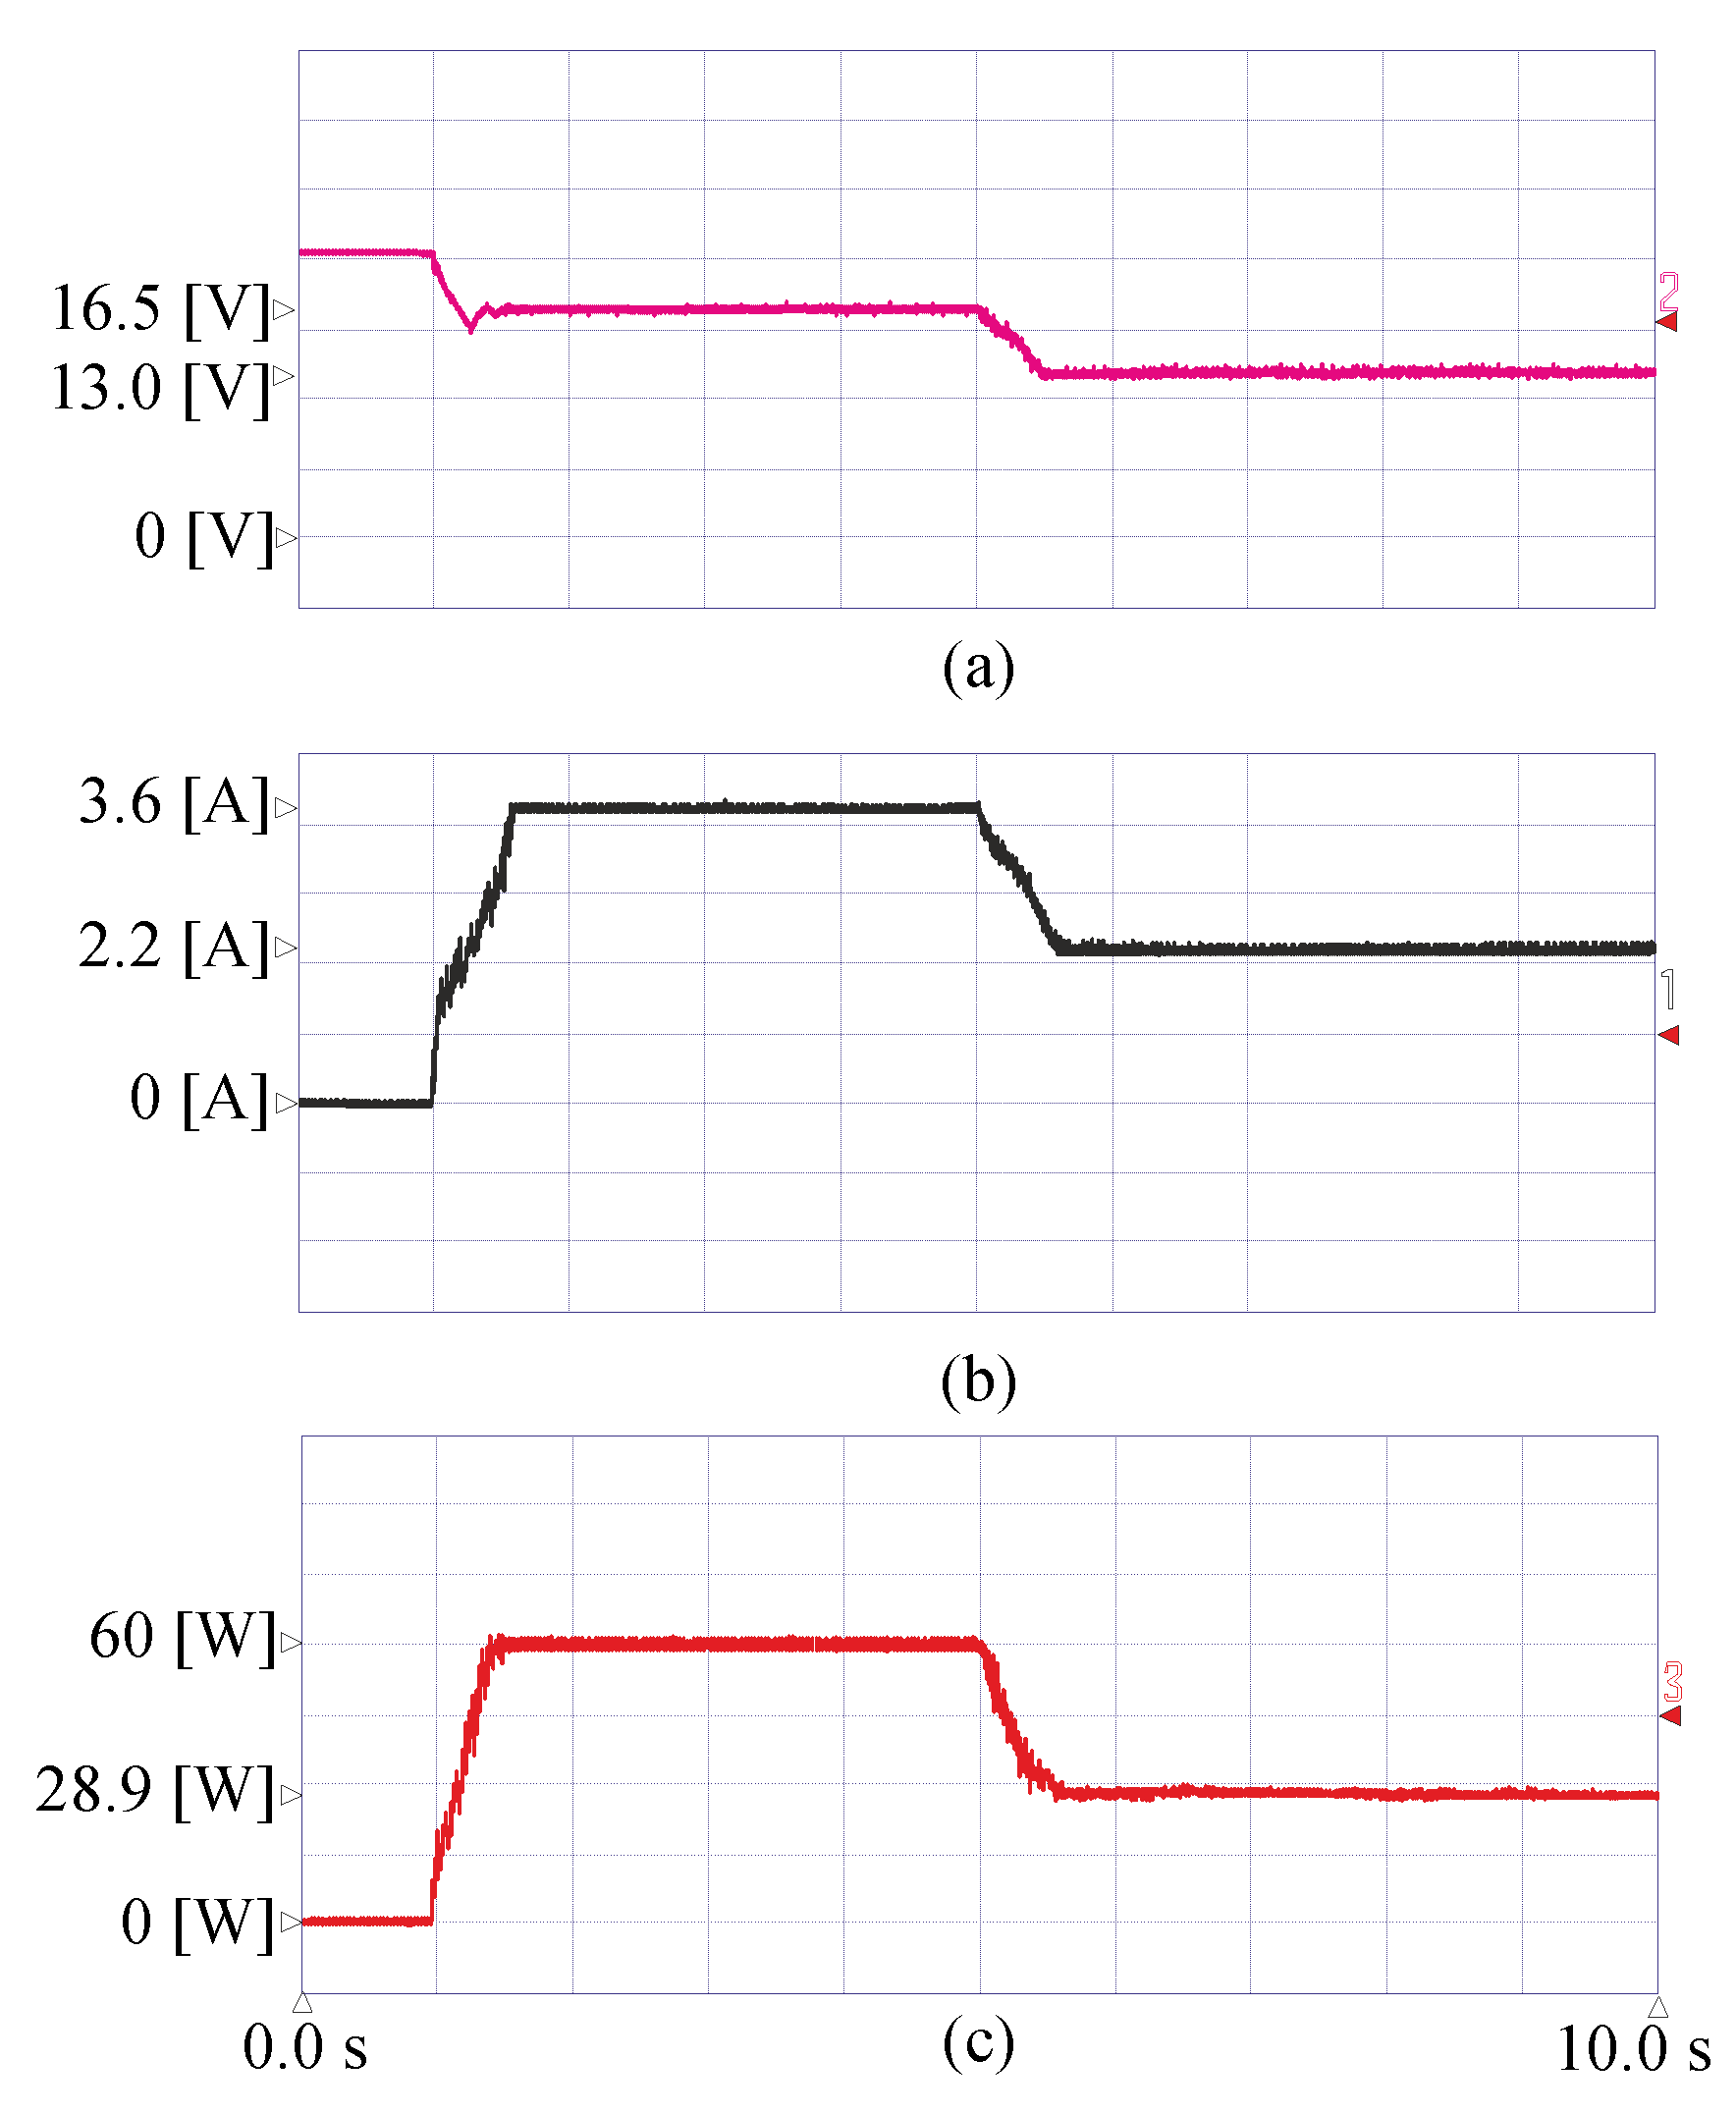
Figure 18 shows the PV voltage, current, and power when the SA-P&O method was used under partial shading conditions when the maximum local and global forces, respectively, were 22 W and 29 W. GMPP was achieved with low power oscillation and short convergence time. Experimental results involving power, voltage, and current of the PV array of the P&O method are shown in
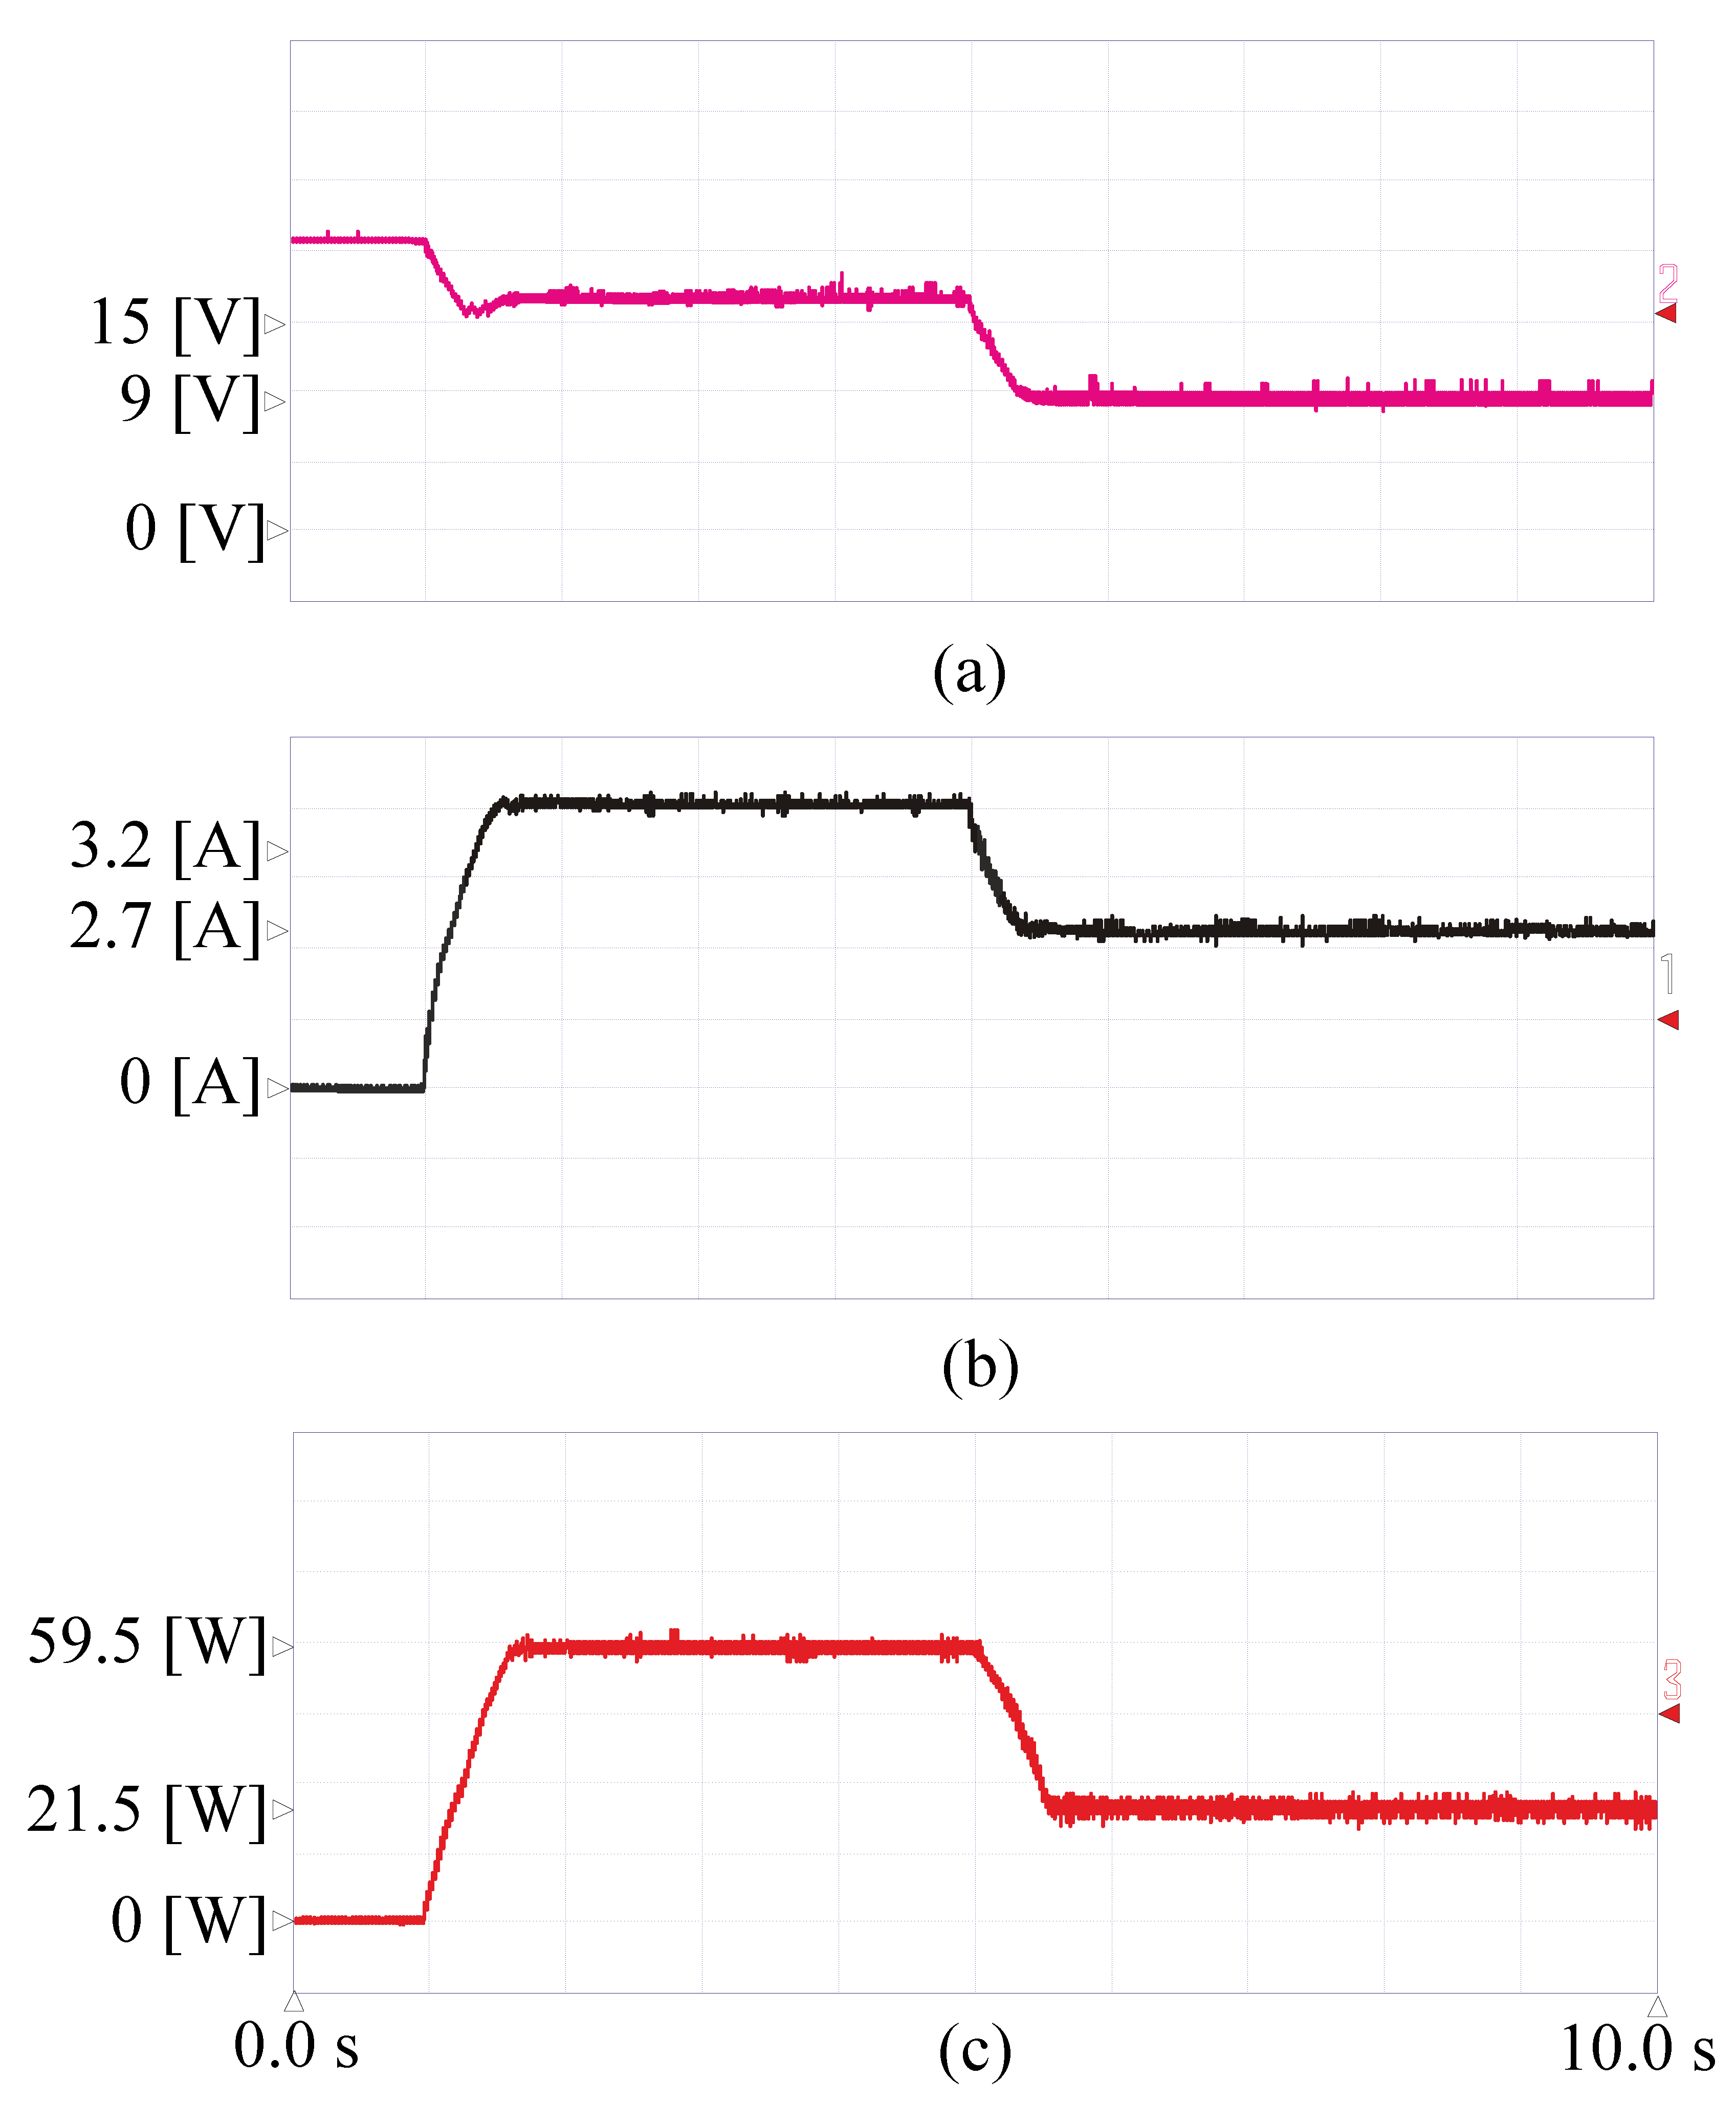
Figure 19. The results indicates that the MPPT algorithm based on the P&O way did not reach the GMPP, becoming fixed at an LMPP of 22 W. Moreover, the MPPT algorithm showed more significant power fluctuations and had the longest convergence time.
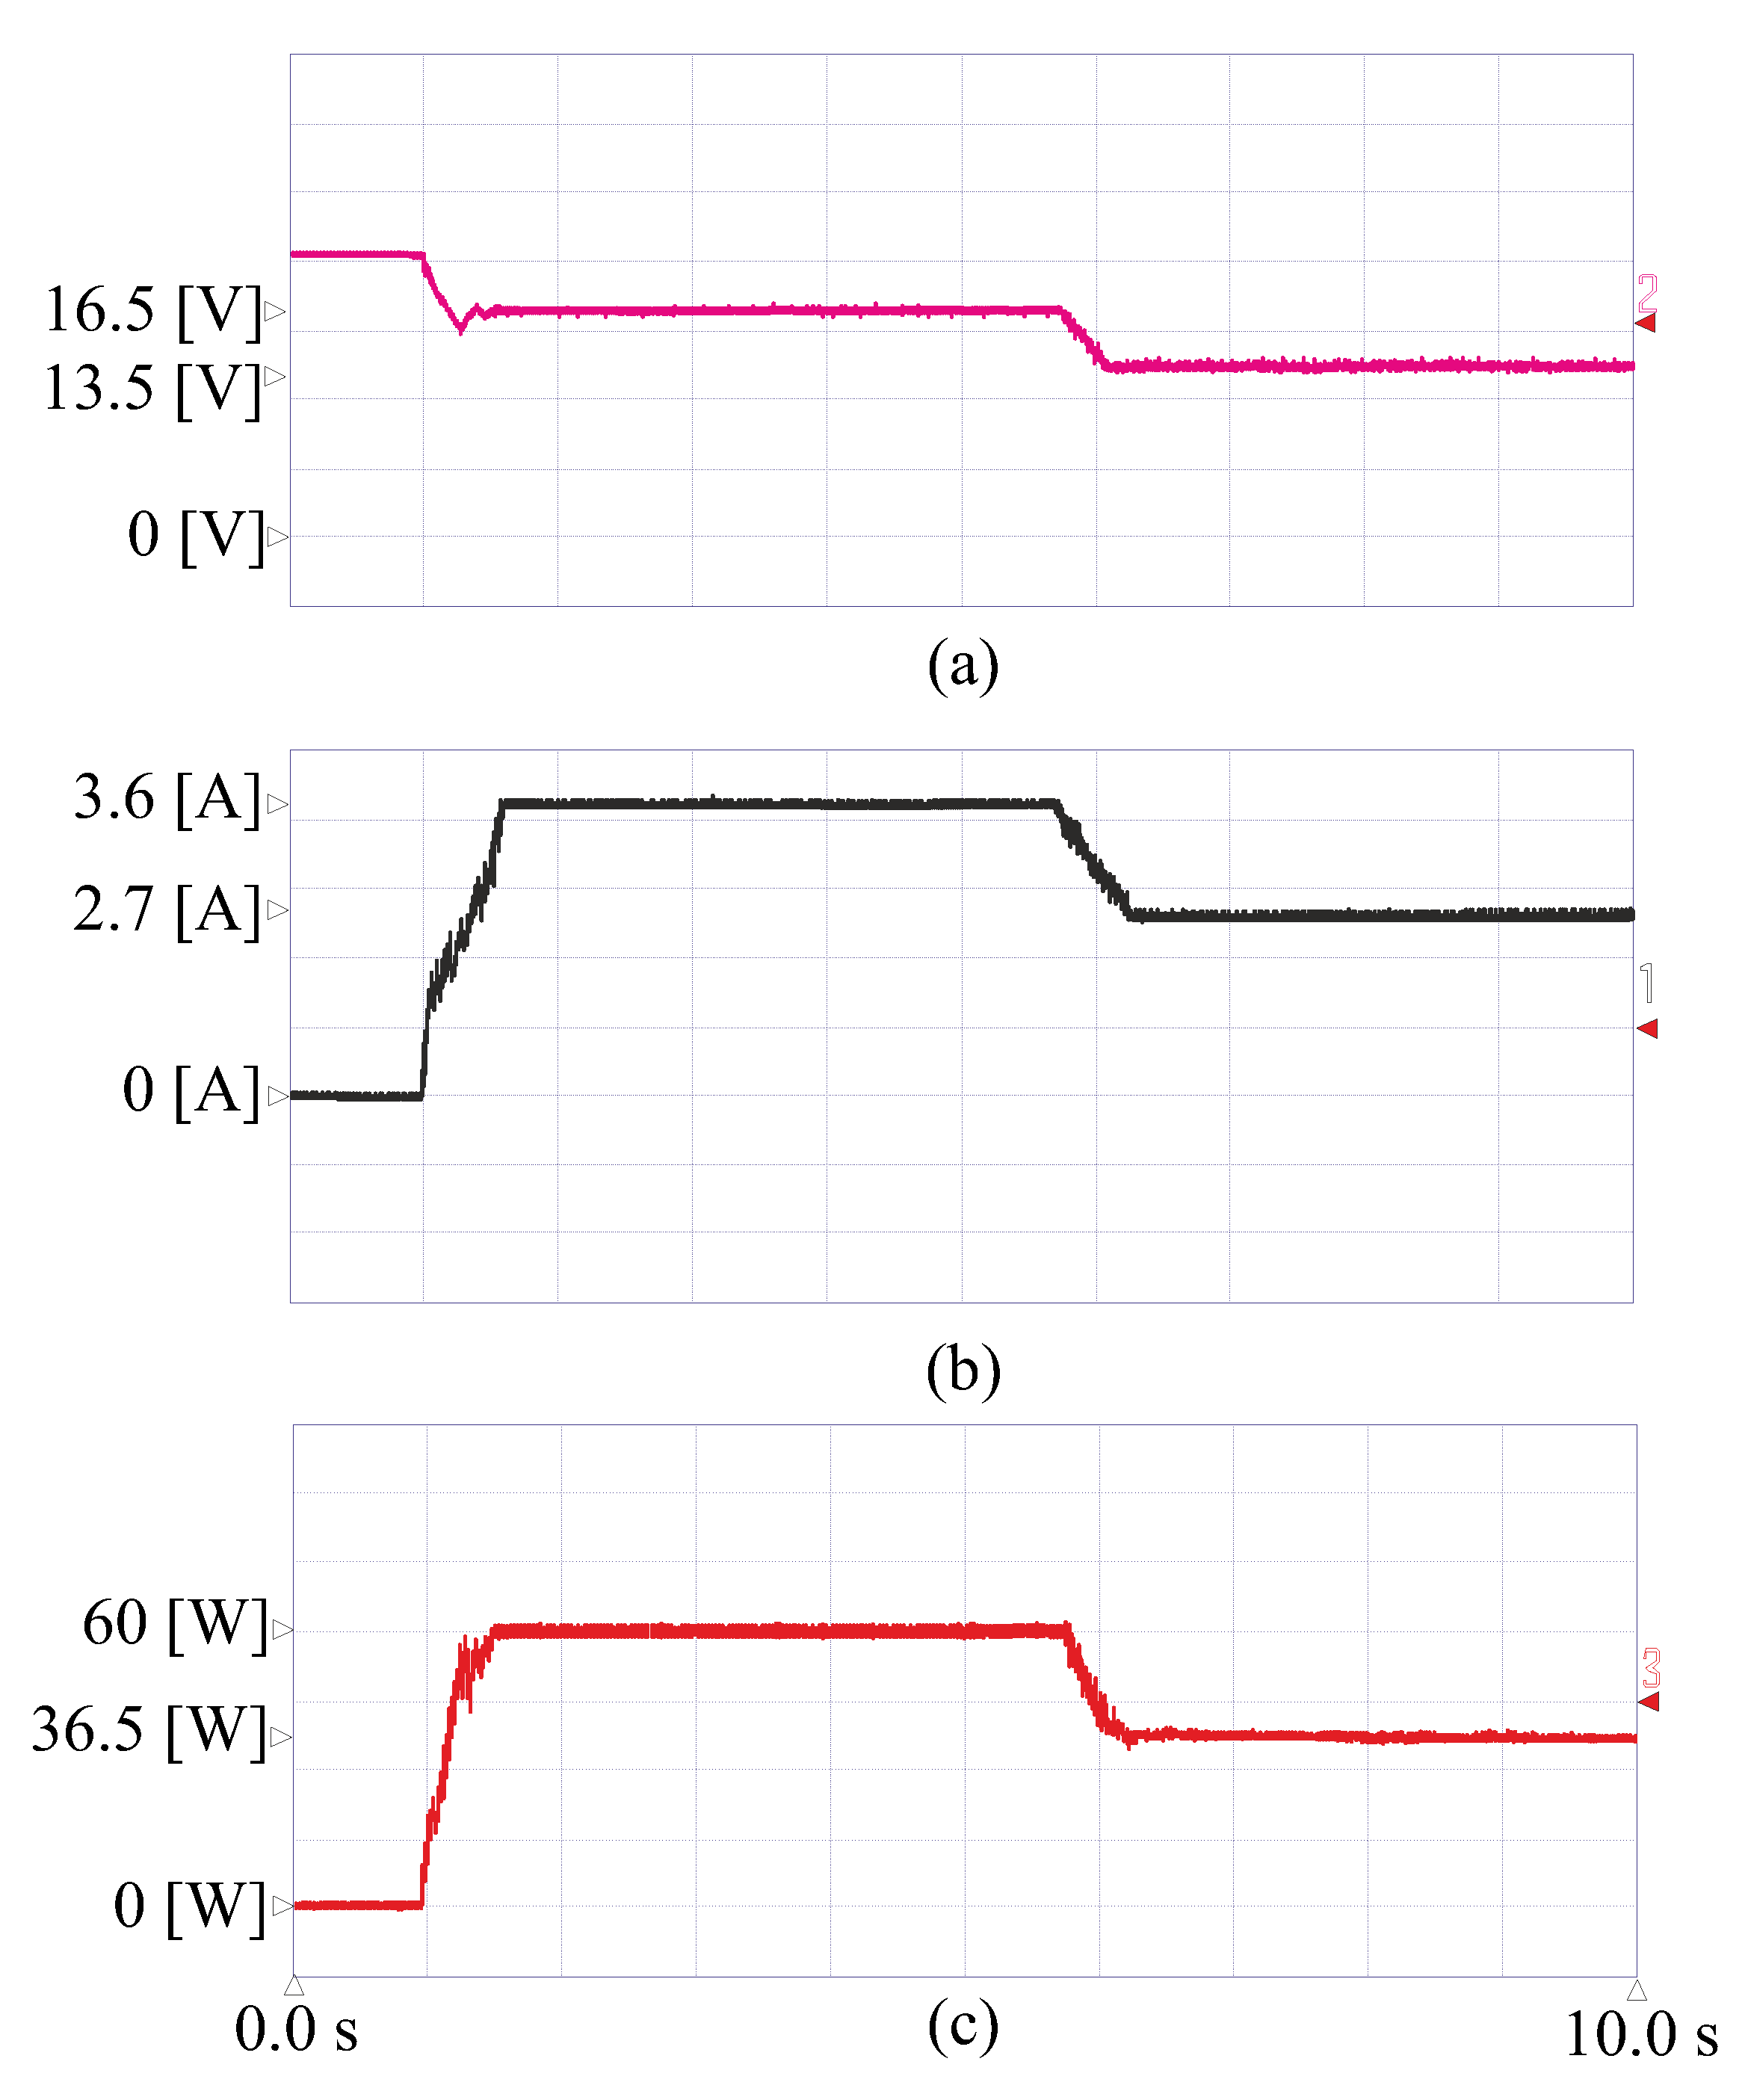
In case 3, the PV array was exposed to nominal irradiance, and then a part of the PV was covered by the transparent sheet. The method tracked the global MPP at 36.5 W without fixing on a local MPP, as shown in
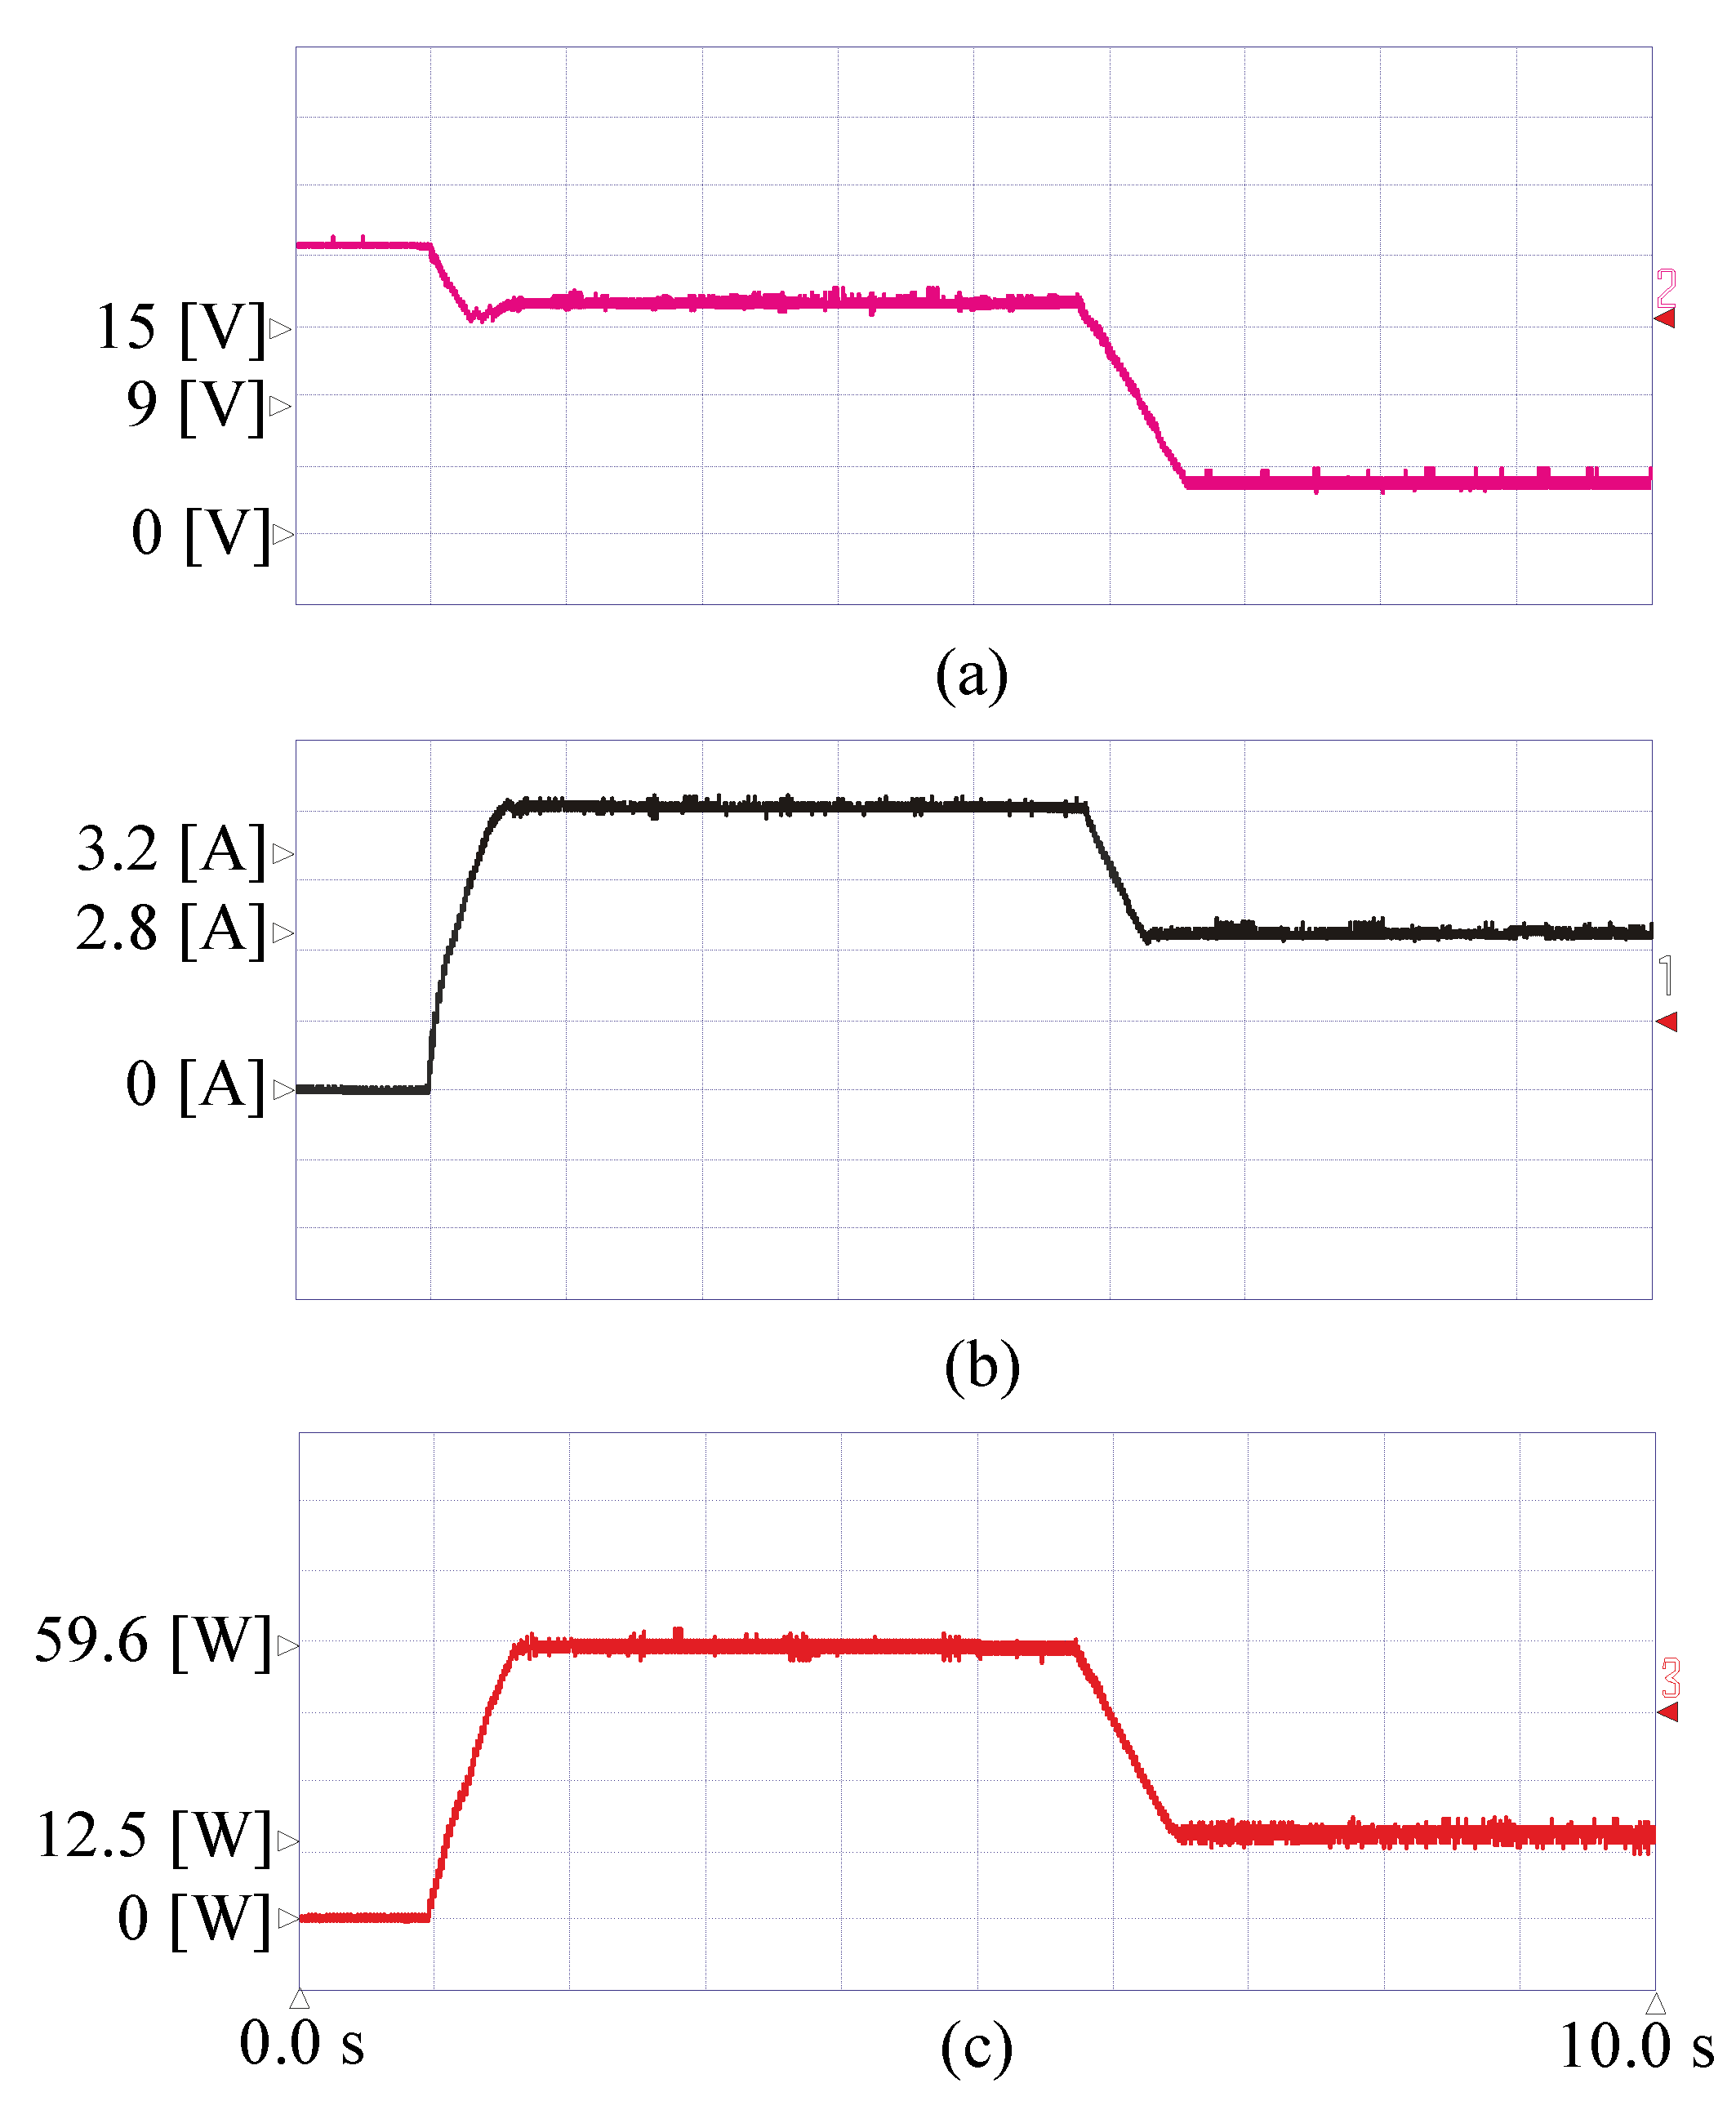
Figure 20. However, the P&O process fixed on local MPP tracking at 12.5 W and failed to find the global MPP, as shown in
Figure 21.
By comparing the performance of P&O and SA-P&O methods, it was found that the tracking time was reduced by 18.5% when the latter method was used, and the most important advantage was avoiding the LMPP.
5. Conclusions
We present the results of implementing an SA-P&O-based MPPT algorithm for extracting the maximum power from photovoltaic arrays. The efficiency of the MPPT algorithm was validated by comparison with the MPPT P&O algorithm. From the results obtained using computational simulation, it was demonstrated that the SA-P&O-based MPPT algorithm was able to quickly converge to GMPP when the photovoltaic arrangement was operating in STC, and when it is subjected to partial shading conditions. In addition, use of the SA-P&O-based MPPT algorithm resulted in reduced power oscillations in steady-state and greater tracking efficiency in the search of the GMPP.
Therefore, the SA-P&O-based MPPT method has an excellent performance in dealing with local and global maximums in PV systems subjected to partial shading, maximizing the system’s overall efficiency. Since our approach simulated conditions of real irradiation, our results indicate excellent applicability of the technique to any PV system for delivering maximum power output regardless of irradiation conditions and shading. As demonstrated quantitatively, the proposed optimization method allows attainment of the best possible power, which can guarantee maximum energy production from an entire PV system, with the shortest financial return time for the investor.
Our results show that the SA-P&O method followed the GMPP efficiently in all STC and PSC operating conditions and reduced transient periods, which increased the generated energy and reduced the convergence time under all operating conditions. In addition to the accurate converge to GMPP, SA-P&O requires fewer parameters than other metaheuristics methods. The disadvantages of the proposed method are oscillations around the MPP, and the complex computations required.
Author Contributions
Conceptualization, A.G.A.-K., I.I.E.-S. and A.R.; methodology, A.G.A.-K., I.I.E.-S. and A.R.; software, A.G.A.-K. and I.I.E.-S.; validation, A.G.A.-K., I.I.E.-S., and S.M.; formal analysis, A.G.A.-K., I.I.E.-S., A.R. and S.M.; investigation, A.G.A.-K., I.I.E.-S. and A.R.; resources, A.G.A.-K., I.I.E.-S. and A.R.; data curation, A.G.A.-K., I.I.E.-S. and A.R.; writing—original draft preparation, S.M., A.G.A.-K., I.I.E.-S. and A.R.; writing—review and editing, S.M. and A.R. Visualization, A.G.A.-K. Supervision, A.G.A.-K., I.I.E.-S. and A.R. All authors have read and agreed to the published version of the manuscript.
Funding
This research received no external funding.
Data Availability Statement
Not applicable.
Acknowledgments
The authors would like to express their gratitude for international collaboration between the UK, UAE and Egypt.
Conflicts of Interest
The authors declare no conflict of interest.
References
- Almutairi, A.; Abo-Khalil, A.G.; Sayed, K.; Albagami, N. MPPT for a PV Grid-Connected System to Improve Efficiency under Partial Shading Conditions. Sustainability 2020, 12, 10310. [Google Scholar] [CrossRef]
- Brito, M.A.G.; Galotto, L.; Sampaio, L.P.; de Azevedo Melo, G.; Canesin, C.A. Evaluation of the main MPPT techniques for photovoltaic applications. IEEE Trans. Ind. Electron. 2012, 60, 1156–1167. [Google Scholar] [CrossRef]
- Premkumar, M.; Sumithira, T.R.; Sowmya, R. Implementation of Solar PV Based Microconverter with Optimal Mppt Control. J. Electr. Eng. 2018, 18, 1–12. [Google Scholar]
- Abo-Khalil, A.G.; Lee, D.C.; Seok, J.K.; Choi, J.W.; Kim, H.K. Maximum Power Point Tracking for Photovoltaic System Using Fuzzy Logic Controller. In Proceedings of the KIPE Conference, The Korean Institute of Power Electronics, Hyundai Seongwoo Resort, Gangwon, Republic of Korea, 14–17 June 2003; Volume 2, pp. 503–507. [Google Scholar]
- Yu, B.G.; Abo-Khalil, A.G.; Matsui, M.; Yu, G. Sensorless Fuzzy Logic Controller for Maximum Power Point Tracking of Grid- Connected PV system. In Proceedings of the International Conference on Electrical Machines and Systems ICEMS, Tokyo, Japan, 15–18 November 2009. [Google Scholar]
- Jately, V.; Arora, S. Performance Investigation of Hill-Climbing MPPT Techniques for PV Systems Under Rapidly Changing Environment. In Intelligent Communication, Control and Devices. Advances in Intelligent Systems and Computing; Singh, R., Choudhury, S., Gehlot, A., Eds.; Springer: Singapore, 2018; p. 624. [Google Scholar] [CrossRef]
- Jately, V.; Arora, S. An efficient hill-climbing technique for peak power tracking of photovoltaic systems. In Proceedings of the 2016 IEEE 7th Power India International Conference (PIICON), Bikaner, India, 25–27 November 2016; pp. 1–5. [Google Scholar] [CrossRef]
- Veerachary, M.; Senjyu, T.; Uezato, K. Neural-network-based maximum-power-point tracking of coupled-inductor interleaved-boost converter- supplied PV system using fuzzy controller. IEEE Trans. Ind. Electron. 2003, 50, 749–758. [Google Scholar] [CrossRef] [Green Version]
- Elgendy, M.A.; Zahawi, B.; Atkinson, D.J. Assessment of perturb and observe MPPT algorithm implementation techniques for PV pumping applications. IEEE Trans. Sustain. Energy 2012, 3, 21–33. [Google Scholar] [CrossRef]
- Masood, B.; Siddique, M.S.; Asif, R.M.; Zia-ul-Haq, M. Maximum power point tracking using hybrid perturb & observe and incremental conductance techniques. In Proceedings of the 2014 4th International Conference on Engineering Technology and Technopreneuship (ICE2T), Kuala Lumpur, Malaysia, 27–29 August 2014; pp. 354–359. [Google Scholar]
- Ahmed, J.; Salam, Z. An enhanced adaptive P&O MPPT for fast and efficient tracking under varying environmental condition. IEEE Trans. Sustain. Energy 2018, 9, 1487–1496. [Google Scholar]
- Hohm, D.P.; Ropp, M.E. Comparative study of maximum power point tracking algorithms. Prog. Photovolt. Res. Appl. 2003, 11, 47–62. [Google Scholar] [CrossRef]
- Jately, V.; Azzopardi, B.; Joshi, J.; Venkateswaran, V.; Sharma, A.; Arora, S. Experimental Analysis of hill-climbing MPPT algorithms under low irradiance levels. Renew. Sustain. Energy Rev. 2021, 150, 111467. [Google Scholar] [CrossRef]
- Putri, R.I.; Wibowo, S.; Rifa’i, M. Maximum power point tracking for photovoltaic using incremental conductance method. Energy Procedia 2015, 68, 22–30. [Google Scholar] [CrossRef] [Green Version]
- Hameed, W.I.; Sawadi, B.A.; Muayed, A. Voltage Tracking Control of DC-DC Boost Converter Using Fuzzy Neural Network. Int. J. Power Electron. Drive Syst. 2018, 9, 1657. [Google Scholar] [CrossRef]
- Hussein, K.H.; Muta, I.; Hoshino, T.; Osakada, M. Maximum Photovoltaic Power Tracking: An Algorithm for Rapidly Changing Atmospheric Conditions. IEE Proc. Gener. Transm. Distrib. 1995, 142, 59–64. [Google Scholar] [CrossRef]
- Abo-Khalil, A.G.; Yu, G.Y. Current Estimation-based Maximum Power Point Tracker of Grid Connected PV. In Proceedings of the 10th International Conference on Power Electronics and Drives Systems (PEDS), Kitakyushu, Japan, 22–25 April 2013. [Google Scholar]
- Kottas, T.L.; Boutalis, Y.S.; Karlis, A.D. New maximum power point tracker for PV arrays using fuzzy controller in close cooperation with fuzzy cognitive networks. IEEE Trans. Energy Convers. 2006, 21, 793–803. [Google Scholar] [CrossRef]
- Abo-Khalil, A.G.; Lee, D.C.; Choi, J.W.; Kim, S.G. Maximum Power Point Tracking Controller Connecting PV System to Grid. Korean Inst. Power Electron. J. 2006, 6, 226–234. [Google Scholar]
- Yu, G.Y.; Abo-Khalil, A.G.; Matsui, M.; Yu, G.J. Support Vector Regression Based Maximum Power Point Tracking for PV Grid-Connected System. In Proceedings of the 2009 34th IEEE Photovoltaic Specialists Conference (PVSC), Philadelphia, PA, USA, 7–12 June 2009. [Google Scholar]
- Eltamaly, A.M.; Al-Saud, M.S.; Abo-Khalil, A.G. Photovoltaic maximum power point tracking under dynamic partial shading changes by novel adaptive particle swarm optimization strategy. Trans. Inst. Meas. Control. August 2019, 42, 104–115. [Google Scholar] [CrossRef]
- Pilakkat, D.; Kanthalakshmi, S. An improved P&O algorithm integrated with artificial bee colony for photovoltaic systems under partial shading conditions. Sol. Energy 2019, 178, 37–47. [Google Scholar]
- Eltamaly, A.M.; Al-Saud, M.S.; Abo-Khalil, A.G. A Novel Bat Algorithm Strategy for Maximum Power Point Tracker of Photovoltaic Energy Systems Under Dynamic Partial Shading. IEEE Access 2020, 8, 10048–11006. [Google Scholar] [CrossRef]
- Harrag, A.; Messalti, S. Variable step size modified P&O MPPT algorithm using GA-based hybrid offline/online PID controller. Renew. Sustain. Energy Rev. 2015, 49, 1247–1260. [Google Scholar]
- Seyedmahmoudian, M.; Rahmani, R.; Mekhilef, S.; Oo, A.M.; Stojcevski, A.; Soon, T.K.; Ghandhari, A.S. Simulation and hardware implementation of new maximum power point tracking technique for partially shaded PV system using hybrid DEPSO method. IEEE Trans. Sustain. Energy 2015, 6, 850–862. [Google Scholar] [CrossRef]
- Chao, R.M.; Nasirudin, A.; Wang, I.K.; Chen, P.L. Multicore PSO operation for maximum power point tracking of a distributed photovoltaic system under partially shading condition. Int. J. Photoenergy 2016, 2016, 9754514. [Google Scholar] [CrossRef] [Green Version]
- Elhaddad, Y. Combined Simulated Annealing and Genetic Algorithm to Solve Optimization Problems. World Acad. Sci. Eng. Technol. 2012, 6, 1047–1049. [Google Scholar]
- Eltamaly, A.M.; Al-Saud, M.S.; Abo-Khalil, A.G. A novel scanning bat algorithm strategy for maximum power point tracker of partially shaded photovoltaic energy systems. Ain Shams Eng. J. 2020, 11, 1093–1103. [Google Scholar] [CrossRef]
- Sharma, A.; Sharma, A.; Jately, V.; Averbukh, M.; Rajput, S.; Azzopardi, B. A Novel TSA-PSO Based Hybrid Algorithm for GMPP Tracking under Partial Shading Conditions. Energies 2022, 15, 3164. [Google Scholar] [CrossRef]
- Jately, V.; Bhattacharya, S.; Azzopardi, B.; Montgareuil, A.; Joshi, J.; Arora, S. Voltage and Current Reference Based MPPT Under Rapidly Changing Irradiance and Load Resistance. IEEE Trans. Energy Convers. 2021, 36, 2297–2309. [Google Scholar] [CrossRef]
Figure 1.
PV grid-connected system.
Figure 1.
PV grid-connected system.
Figure 2.
PV equivalent circuit [
21].
Figure 2.
PV equivalent circuit [
21].
Figure 3.
Characteristic curves of a photovoltaic module: (a) voltage-current curve, (b) voltage-power curve.
Figure 3.
Characteristic curves of a photovoltaic module: (a) voltage-current curve, (b) voltage-power curve.
Figure 4.
PV under partial shading.
Figure 4.
PV under partial shading.
Figure 5.
Series connection of photovoltaic panels.
Figure 5.
Series connection of photovoltaic panels.
Figure 6.
Equivalent circuit of photovoltaic panels.
Figure 6.
Equivalent circuit of photovoltaic panels.
Figure 7.
Partial shading in photovoltaic panels.
Figure 7.
Partial shading in photovoltaic panels.
Figure 8.
Equivalent circuit of photovoltaic panels with partial shading.
Figure 8.
Equivalent circuit of photovoltaic panels with partial shading.
Figure 9.
Current circulation when partial shading occurs.
Figure 9.
Current circulation when partial shading occurs.
Figure 10.
PV V-I and V-P characteristics under partial shading.
Figure 10.
PV V-I and V-P characteristics under partial shading.
Figure 11.
Flowchart of the SA technique.
Figure 11.
Flowchart of the SA technique.
Figure 12.
Flowchart of the P&O technique.
Figure 12.
Flowchart of the P&O technique.
Figure 13.
Flowchart of the SA-P&O technique.
Figure 13.
Flowchart of the SA-P&O technique.
Figure 14.
PV system setup.
Figure 14.
PV system setup.
Figure 15.
PV characteristics: (a) case 1, (b) case 2, (c) case 3.
Figure 15.
PV characteristics: (a) case 1, (b) case 2, (c) case 3.
Figure 16.
Experimental results of P&O MPPT for case 1.
Figure 16.
Experimental results of P&O MPPT for case 1.
Figure 17.
Experimental results of SA-P&O MPPT considering case 1.
Figure 17.
Experimental results of SA-P&O MPPT considering case 1.
Figure 18.
Experimental results of SA-P&O MPPT considering Case 2 (a) PV voltage, (b) PV current, and (c) PV power.
Figure 18.
Experimental results of SA-P&O MPPT considering Case 2 (a) PV voltage, (b) PV current, and (c) PV power.
Figure 19.
Experimental results of P&O MPPT considering Case 2. (a) PV voltage, (b) PV current, and (c) PV power.
Figure 19.
Experimental results of P&O MPPT considering Case 2. (a) PV voltage, (b) PV current, and (c) PV power.
Figure 20.
Experimental results of SA-P&O MPPT considering Case 3. (a) PV voltage, (b) PV current, and (c) PV power.
Figure 20.
Experimental results of SA-P&O MPPT considering Case 3. (a) PV voltage, (b) PV current, and (c) PV power.
Figure 21.
Experimental results of P&O MPPT considering Case 3. (a) PV voltage, (b) PV current, and (c) PV power.
Figure 21.
Experimental results of P&O MPPT considering Case 3. (a) PV voltage, (b) PV current, and (c) PV power.
Table 1.
Main characteristics of the maximum power point tracking methods.
Table 1.
Main characteristics of the maximum power point tracking methods.
| Method | Analog or Digital | Setting Parameters | Speed of Convergence | Implementation Complexity | Parameters Sensed | Method Type | Cost |
|---|
| P&O | Both of them | No | It varies | High | Voltage and current | Direct | High |
| Inc Conductance | Digital | No | It varies | High | Voltage and current | Direct | High |
| Ripple Correlation Control | Analog | Yes | Fast | High | Voltage and current | Direct | High |
| Maximization of voltage or current on load | Analog | No | Fast | Low | Voltage | Direct | Low |
| Curve fitting | Digital | Yes | Varies | Low | Voltage and current | Indirect | Low |
| Look-up table | Digital | Yes | Average | Average | Voltage and current | Indirect | Low |
| Factional open circuit voltage | Both | Yes | Average | Average | Voltage and current | Indirect | Low |
| Factional short circuit voltage | Both | Yes | Average | Average | Voltage and current | Indirect | Low |
| Fuzzy logic | Digital | Yes | Fast | High | Voltage and current | Both | High |
| Neural Network | Digital | Yes | Fast | Average | Voltage and current | Both | High |
| PSO, ACO, GWO, SA. | Digital | Yes | Fast | High | Voltage and current | Both | High |
| Disclaimer/Publisher’s Note: The statements, opinions and data contained in all publications are solely those of the individual author(s) and contributor(s) and not of MDPI and/or the editor(s). MDPI and/or the editor(s) disclaim responsibility for any injury to people or property resulting from any ideas, methods, instructions or products referred to in the content. |
© 2023 by the authors. Licensee MDPI, Basel, Switzerland. This article is an open access article distributed under the terms and conditions of the Creative Commons Attribution (CC BY) license (https://creativecommons.org/licenses/by/4.0/).


