Article

Uncertainty Covered Techno-Enviro-Economic Viability Evaluation of a Solar Still Water Desalination Unit Using Monte Carlo Approach

1
Faculty of Mechanical Engineering-Energy Division, K.N. Toosi University of Technology, No. 15–19, Pardis St., Mollasadra Ave., Vanak Sq., P.O. Box 19395-1999, Tehran 1999 143344, Iran
2
Department of Chemical Engineering, University of Guilan, Rasht P.O. Box 41996 13776, Iran
3
Department of Mechanical Engineering, University of Hawaii at Manoa, Holmes Hall, Honolulu, HI 96822, USA
4
Department of Applied Mathematics, Illinois Institute of Technology, Chicago, IL 60616, USA
5
Department of Enterprise Engineering, University of Rome Tor Vergata, Via Del Politecnico 1, 00133 Rome, Italy
*
Author to whom correspondence should be addressed.
Energies 2023, 16(19), 6924; https://doi.org/10.3390/en16196924
Submission received: 21 August 2023 / Revised: 19 September 2023 / Accepted: 21 September 2023 / Published: 2 October 2023
(This article belongs to the Special Issue Selected Papers from the 16th Conference 'Air, Heat and Energy')

Abstract

:
Due to much lower initial and operating costs, as well as a great environmental and energy performance, there has been a growing tendency towards the application of solar still desalination systems to deal with water scarcity issues. By taking advantage of higher investments and providing incentives to policy makers, the application could be even broader. In order to convince the policy makers and investors, it is important to provide a clear and realistic overview of the technical, economic, and environmental viability of solar stills, and several studies have evaluated them from different viewpoints. Nonetheless, the economic and environmental factors have uncertainties, which have not been taken into account. Therefore, this study uses the Monte Carlo approach to consider the effects of the uncertainty of inflation and discount rates, in addition to emission factors, on the system’s techno-enviro-economic viability. The study is performed by covering cost per liter (CPL) and the annual saving of CO2 (SCO2) as the most important key techno-economic and environmental indicators of the system. The results show that the best probability distribution functions for inflation, discount, and emission factors are normal, log-normal, and their summation, respectively. Furthermore, both SCO2 and CPL are found to have considerable uncertainty. The former has a variation ranging from 317.7 to 427.9 g, while the corresponding values for the latter are 0.0212 to 0.0270 $ · L−1, respectively. With the amounts of 0.1716 and 0.1727, the values of 378.9 g and 0.0245 $ · L−1 are the values with the highest chance of occurrence for SCO2, as well as for CPL, respectively.

1. Introduction

Water scarcity is a pressing global issue that affects millions of people worldwide [1]. It affects not only health but also the economic and environmental issues [2]. With population growth, climate change, and unsustainable water usage practices, the availability of freshwater resources is dwindling rapidly [3]. As a result, it has become imperative to explore alternative solutions to meet the ever-increasing demand for clean, potable water [4]. One such solution is water desalination, a process that converts seawater or brackish water into fresh water [5].
Among the available desalination technologies, solar stills possess distinct advantages over others, making them an attractive option [6]. In solar stills, water purification takes place through evaporation and condensation [7]. Their simplicity, low maintenance, energy efficiency, environmental friendliness, scalability, resilience, and cost-effectiveness contribute to their viability as a decentralized and reliable source of clean water [8]. As advancements continue to enhance their efficiency and performance, solar stills have the potential to play a significant role in alleviating water scarcity and promoting sustainable water management globally [9].
Solar still technologies have been investigated in recent years in several research works in order to find better economic, energy, and environmental performances. For instance, the research of Shoeibi et al. [10] focused on optimizing solar stills for efficient fresh water production from salty water. It highlighted the significance of economic, environmental, and carbon credit analyses in solar desalination studies. Various techniques and designs were reviewed, compared for fabrication cost, exergo-economic analysis, CO2 reduction, and enviro-economic impact. The reported water production costs ranged from USD 0.0014 to USD 0.29 per liter, with substantial CO2 mitigation (up to 1129.53 tons) in systems combining solar stills, photovoltaic/thermal technology, and solar collectors. The study aided researchers in identifying cost-effective and eco-friendly solar still designs. Additionally, the study of Ref. [11] investigated the altitude impact and compared active/passive types at different elevations for the Tochal region over 7 days in July 2018. Similar geometry was used, with active systems incorporating thermoelectric modules and a photovoltaic panel. Higher altitude correlated with enhanced exergy efficiency and evaporative exergy in active systems. The heat transfer coefficients varied significantly. Economically, the water costs differed. Energy matrices favored Tehran’s passive system for shorter payback times. Active systems excelled in CO2 mitigation. Enviro-economic and exergo-economic parameters favored Tehran due to the extended yearly operation.
As another example, Tuly et al. [12] aimed at modifying a double solar still using different methods, including nano-PCM (nanoparticle mixed PCM), PCM (phase change material), HCF (hollow circular fin), and ISR (internal sidewall reflector). An active still and a passive still were compared. The results revealed a 51.8% productivity increase with ISR, HCF, and PCM, further increasing by 21.5% when nano-PCM was introduced. Nano-PCM notably improved energy and exergy efficiencies by 20.1% and 25%. It also reduced the costs per unit of water and mitigated 3.65 tons of CO2 emissions. The exergetic sustainability indicators were assessed, showing improvements across the cases. Shatar et al. [13] improved passive solar stills with coated condensation covers and thermoelectric cooling. In an investigation of changing thermoelectric power (36 and 12 W) against a reference in tropical Malaysia, they analyzed the fresh water yield, energy, exergy, and environmental and economic aspects. A 126% increase in fresh water production with 36 W cooling and a 44% energy efficiency boost were observed. However, exergy efficiency dropped by 25%. Coated glass solar stills showed 6.55-year payback time, mitigated 2.97 tonnes of CO2, and achieved a 0.036 USD/liter cost with 36 W cooling. The exergo-economic and enviro-economic values were 4.64 kWh/USD and USD 83.21, respectively.
Sonawane et al. [14] investigated enhancing solar still productivity through varied design parameters. They employed computational fluid dynamics (CFD) and COMSOL® Multiphysics to study the effects of different absorber materials on a single-slope solar desalination unit. Effective emissivity factored in water absorption. Economic, exergo-economic, and CO2 mitigation aspects were considered. The study highlighted black toner-coated solar stills, showing notable improvements in productivity, exergy, and evaporative heat transfer. The CO2 mitigation reached 31.4 tons, with an enviro-economic parameter of USD 455.3. The minimum CPL was USD 0.0066 per L. Hassan et al. [15] also studied single-slope solar still performance across saline mediums, analyzing productivity, energy, exergy, economics, and enviro-economics. The modified solar still with forced-water cooling and sand in the basin (MSS + FW + SD) achieved 26 and 36% increases in daily yield in winter and summer, respectively, in comparison to the conventional type. The economic results showed that MSS + U had the highest cost (0.053 USD/L), while MSS + FW + SD had the lowest (0.032 USD/L).
Moreover, Bait et al. [16] proposed a solar still with a collector (tubular type) for water desalting. They conducted enviro-economic, exergy, and economic analyses, while comparing the results to those of a conventional solar still. The findings showed that the modified system had an estimated annual yield of ~550 kg/m² compared to the ~400 kg/m² of the traditional system. The exergy efficiencies for the passive and active systems were ~7%/~30% and ~11%/~41%, respectively. Economic analysis revealed the distilled water cost and payback periods, favoring the modified still. The enhanced solar unit proved feasible due to increased water production and space efficiency. Another investigation was carried out by Sharshir et al. [17]; they enhanced a conventional solar still performance using environmentally friendly materials: floating coal, cotton fabrics, and carbon black nanoparticles. These additives improved heat localization, capillarity, and thermal conductivity. Three modified cases were evaluated in comparison to a reference system. The improved system showed the maximum enhancements in fresh water production, as well as exergy and efficiencies. Additionally, it reduced production cost by ~25% and increased CO2 pollutant mitigation by around ~128%, demonstrating feasible and eco-friendly outcomes. In addition, in the work conducted by Dhivagar et al. [18], a solar still with one slope utilizing disc magnets (DMSS) and block magnets (BMSS) was analyzed in terms of productivity and economic and enviro-economic aspects in Coimbatore city, India. Magnet integration in the basin notably improved daily productivity, with the BMSS outperforming the DMSS. The BMSS had ~6 and 14% more hourly productivity in comparison to the DMSS and the conventional solar still (CSS), respectively. Economic analysis also indicated that the BMSS and DMSS had shorter estimated payback periods (3.6 and 3.5 months) than the CSS (4.5 months). The CO2 emissions were higher for the BMSS and DMSS compared to the CSS, demonstrating the significant enhancement in solar still performance through saline water magnetization.
Sharon et al. [19] introduced and assessed a compact hybrid solar still in India. Integrating basin and vertical diffusion stills, they explored factors like area ratios, the diffusion gap, and the impact of shading on performance. The optimal flow rate of the feed water, the depth of the basin, the diffusion gap, and the absorber area ratio were determined. Exergetic destruction and efficiency and the potential for enhancement were reported for each component. The hybrid system excelled in winter, with max productivity and thermal and exergy efficiency at ~14 kg/d, ~56%, and ~7%. The price of water varied from 1.10 to 3.83 INR/L. The unit exhibited promising practical potential due to balanced condensate yield, affordability, and environmental benefits. Furthermore, Nazari and Daghigh [20] developed a solar still with a concentrator box (parabolic dish) with a thermoelectric duct of condensation, omitting the glass cover. The vapor generated in the basin was pulled by a fan into the condensing duct with thermoelectric modules. They assessed the system’s parameters, reporting an enhanced distilled water yield and the energy and exergy efficiencies in the optimal setup with an active fan operation. The price of fresh water and the payback period were 0.0056 USD/kg/m2 and 114 days. The system demonstrated positive financial and environmental outcomes and produced safe drinking water.
The literature survey indicated that in all the reviewed studies certain (specified) values for the economic and environmental indicators have been reported. It made the point clear that, to the best of authors’ knowledge, there has been the following gap in the literature:
  • All the conducted analyses, including the economic and environmental assessments, have been conducted by considering a constant value for the input effective factors, such as inflation and discount rates, as well as the emission factor in the future. Nonetheless, there is no complete certainty about the value of these parameters since the economic condition may be different from the predictions due to the unexpected issues. This is the same for the emission factor because newer technologies were developed with better or worse performances than the imposed vision.
The indicated gap is addressed in this study, where the novelty is as follows:
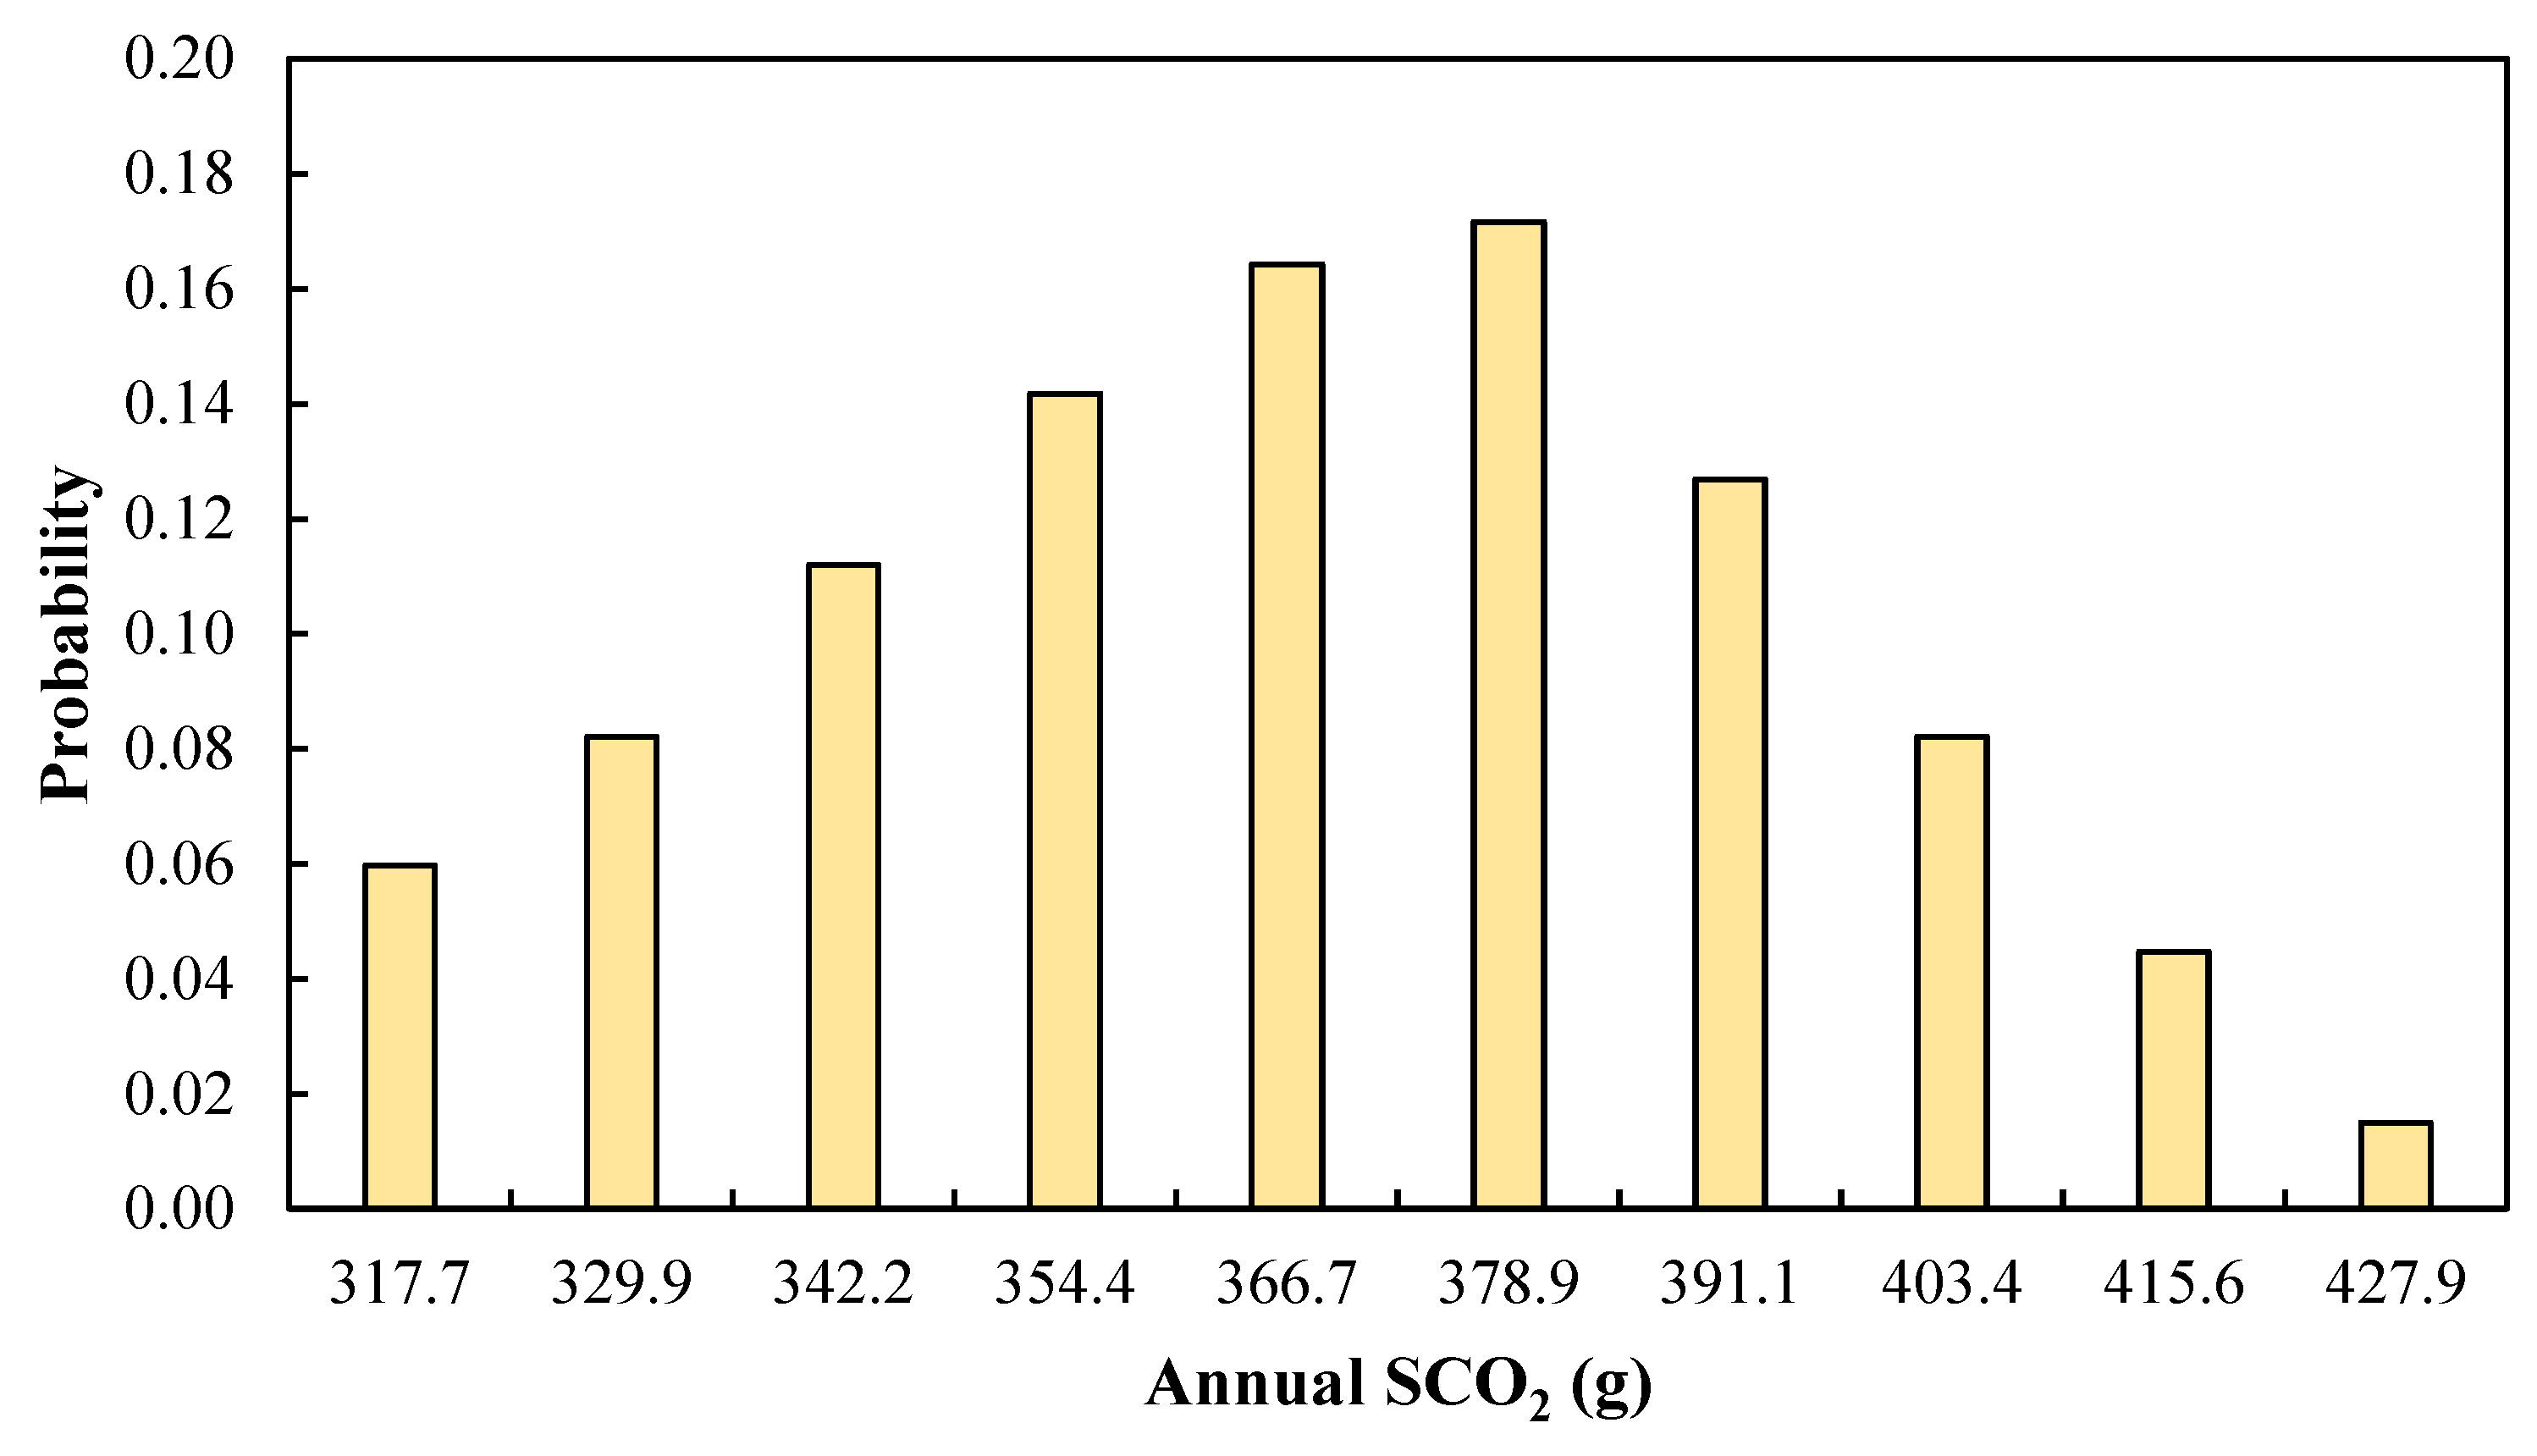
  • The uncertainty of discount and inflation rates, as well as the emission factor, was taken into account. The Monte Carlo method, as an advanced methodology to consider the uncertainty, was employed. It leads to the obtaining of the probability profiles of the performance indicators instead of a constant value for them. The cost per liter (CPL) and the annual saving of CO2 (SCO2) are the investigated performance indicators. They are the two main performance criteria of a solar still.
In fact, the proposed approach of this study could be used to perform calculations for the installation of a solar still in the future, i.e., when the process is in the design stage, or when asking for support from the government or investors (such as when the system is going to be installed in 6 months, 1 year, or another time from now). Because the future values for the inflation and discount rates, as well as the CO2 emission factor, are not known with certainty, their uncertainty could be modeled using the Monte Carlo method. As indicated in the paper, the Monte Carlo approach finds the uncertainty by fitting the best probability function to the real historical data. Then, by following the indicated stages, it introduces a probability distribution for each performance indicator, and in that way, it considers the uncertainty of inflation and the discount rates, as well as CO2 emission factor at the time of the installation of a solar still in the future. The main novelty of this paper is the use of the Monte Carlo approach to consider the uncertainty of the three fundamental parameters and to superimpose them to determine the uncertainty of CPL and the annual SCO2. Based on the conducted literature survey, none of the previous studies, apart from this work, took into account the uncertainty of the three fundamental parameters when they performed calculations for the installation of a solar still in the future. Nonetheless, the current study does take these parameters into account, and for that reason, it uses the Monte Carlo approach to consider the uncertainty of the three indicated fundamental parameters in the calculation of CPL and the annual SCO2; this is the contribution of this investigation.
An emerging solar still technology with sun tracking and side mirrors, which have much higher efficiency compared to the conventional types of solar still, has been selected, and the investigation was conducted using the available experimental data the authors obtained in their previous research work for the city of Tehran, Iran. The methodology is described in Section 2. The results of the application of the discussed methodology are provided in Section 3. The conclusions are given in Section 4.

2. Methodology

This section shares the details about the employed methodology. First, the system is introduced in Section 2.1. Then, the method for calculating the performance indicators is discussed in Section 2.2. In Section 2.3, the way that the Monte Carlo approach is employed for modeling uncertainty in the studied system is explained.

2.1. Description of System

The investigated solar still is shown in Figure 1. The design is furnished with wheels (indicated by number 1 in Figure 1) and a solar collector (introduced by number 2 in Figure 1). Water from the basin (introduced by number 3 in Figure 1) is directed to the solar collector through a pumping mechanism (consisting of pipes and a pump, which are shown by numbers 4 and 5 in Figure 1, respectively), which elevates its temperature. Subsequently, the heated water is circulated into the solar collector parts, including the tank (shown by number 6 in Figure 1), and returned to the basin, which is exposed to direct solar radiation and reflection from the side mirrors (shown by number 7 in Figure 1). This exposure facilitates the evaporation of a portion of the basin’s water. The inclusion of wheels allows the dynamic positioning of the still to optimize solar radiation absorption at each time step.
The evaporated water then reaches the sloped glass surface, where it condenses back into its liquid state. However, it is important to note that the water in the basin is currently neither salty nor brackish. The resulting fresh water is accumulated and suitable for drinking or other designated applications. The original design was introduced by the research team, as documented in Ref. [21]; its superiority is highlighted from both technical and economic standpoints.
Tehran was chosen as the location of this case study. This city is one of the biggest cities in the world, with a population exceeding 14 million people, according to Ref. [22]. The city suffers from severe water scarcity issues, while some economic issues put significant constraints on the development of conventional water treatment technologies [23]. Therefore, the application of high-efficiency solar stills, like that of the proposed design of Ref. [21], is thought to be a practical economic solution to deal with the issue.
The final point is that the fresh water production of a solar still is lower than that of its rivals. Nonetheless, the cost of the still is much lower than that of the rivals, and for that reason, it is the best solution to be employed for domestic applications in the rural or remote areas which do not have access to pipeline or fresh water, especially in the developing countries. For that reason, they have drawn attention in recent years, and many studies have been conducted to investigate them, including the cited references in the literature review. Another advantage of solar stills is that they are more environmentally friendly in comparison with most of the commercialized products, which are either fossil fuel- or electrical energy-driven technologies [24].

2.2. Performance Indicators

2.2.1. Fresh Water Production

The amount of produced power by a solar still is experimentally available from the previous study of the research team, i.e., Ref. [21], for city of Tehran, which is also used for this investigation. The monthly profile is reported in Figure 2. More information about the details of the experiments, including the specifications of the measuring devices, are also found in Ref. [21].

2.2.2. Cost per Liter (CPL)

Cost per liter, which is known by the abbreviation CPL, expresses how much the production of each liter of fresh water by a solar still costs. As checking the literature has shown, the cost per liter (CPL) has been the most common economic indicator of a solar still and other desalination systems, and other studies also conduct economic analyses at the same level. CPL clearly indicates the economic status of the system, and for that reason, it has been employed not only in science but also in commercial applications (as the literature review has proven). A similar concept could be seen in the electricity production applications, where the levelized cost of electricity (LCOE) is used. The mathematical formula to calculate CPL is:
C P L = C T O T F W P a n n u a l
where CTOT and FWPannual indicate the total cost and annual fresh water production, respectively. The latter is determined using the recorded experimental data, which are found in Figure 1, while the former is computed based on Equation (2):
C T O T = C I P P + C O P M A C S A L
The first term is CIPP, which is the initial purchase price of the system. Based on Ref [24], the initial purchase price of the solar still, which has an area of 1.4 m2, is USD 374.66. COPMA and CSAL denote operating and maintenance and salvage costs. Both are estimated as a fraction of the initial purchase price: the first is 15%, and the second is 20% of that.
The economic calculations are conducted by taking the time value of the money into consideration, i.e., Equation (3):
P W ( C , i , j , t ) = C ( 1 + i ) t 1 ( 1 + j ) t
According to Equation (3), the present worth of money C, which is either paid or gained at the time t from the time origin, could be determined as a function of C and t, in addition to the inflation and discount rates, which are indicated by i and j, respectively. t starts from the time of the installation of the system.

2.2.3. CO2 Saving

When a solar still is employed, fuel is saved due to its not being consumed in a conventional water desalination unit. This means that fuel and, consequently, CO2 are saved due to the application of the solar still. The amount, indicated by SCO2, could be obtained based on Equation (4):
S C O 2 = F W P × f d e s , c o n v × u C O 2 , N G
FWP is the fresh water production, while f d e s , c o n v and u C O 2 , N G are the required energy for water desalination by a conventional system and CO2 emission per unit of fuel, i.e., the natural gas. f d e s , c o n v is considered to be 1.075 kWh·m−3 [25], while for u C O 2 , N G a distribution is assumed for the Monte Carlo calculations, as discussed in the next part. One more point to mention is that based on the discussion conducted in Ref. [24], the embodied CO2 emissions of a solar still are much lower than the annual CO2 saving of the still. Consequently, this could be neglected.

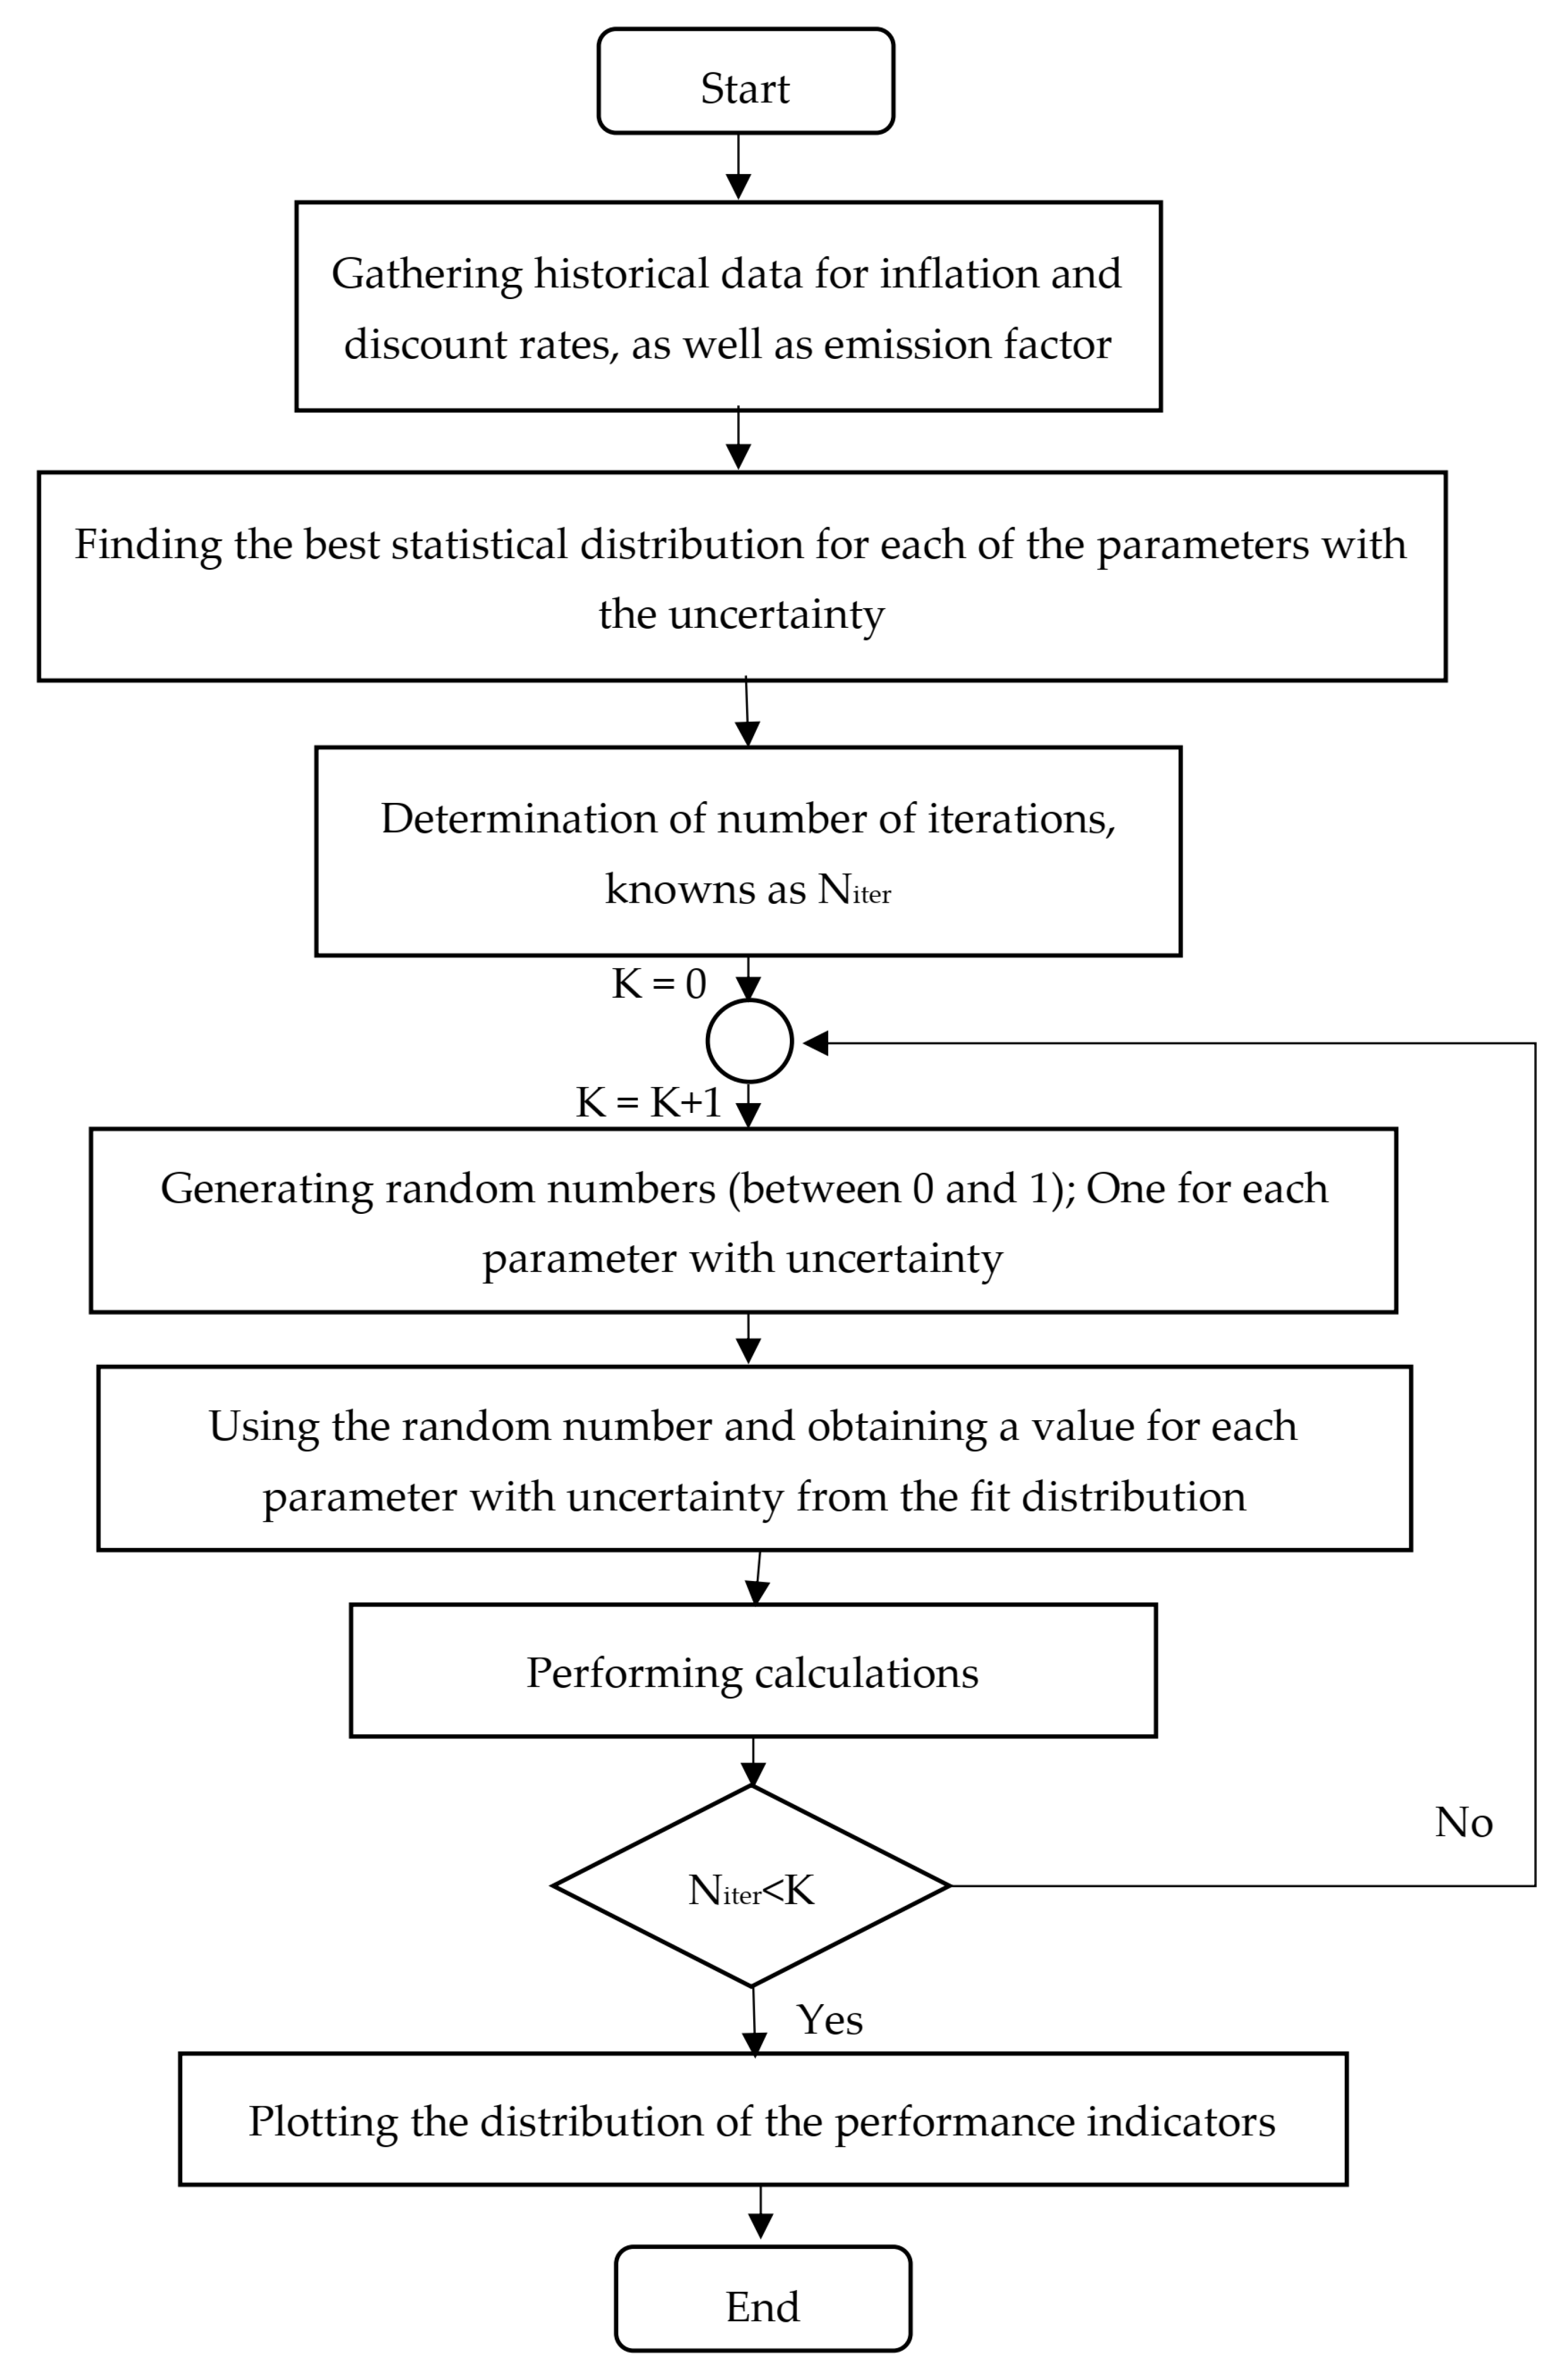
2.3. Monte Carlo Approach

In this study, the uncertainty of the inflation and discount rates, as well as u C O 2 , N G , is considered using the Monte Carlo approach. The process flow chart of the employed Monte Carlo approach, which was mentioned in this part, is provided in Figure 3. Performing calculations with the Monte Carlo approach includes six steps:
1.
First, the historical data for these three parameters are found. For economic indicators, Ref. [26] is used. On the other hand, the information found in Ref. [27] is utilized for u C O 2 , N G .
2.
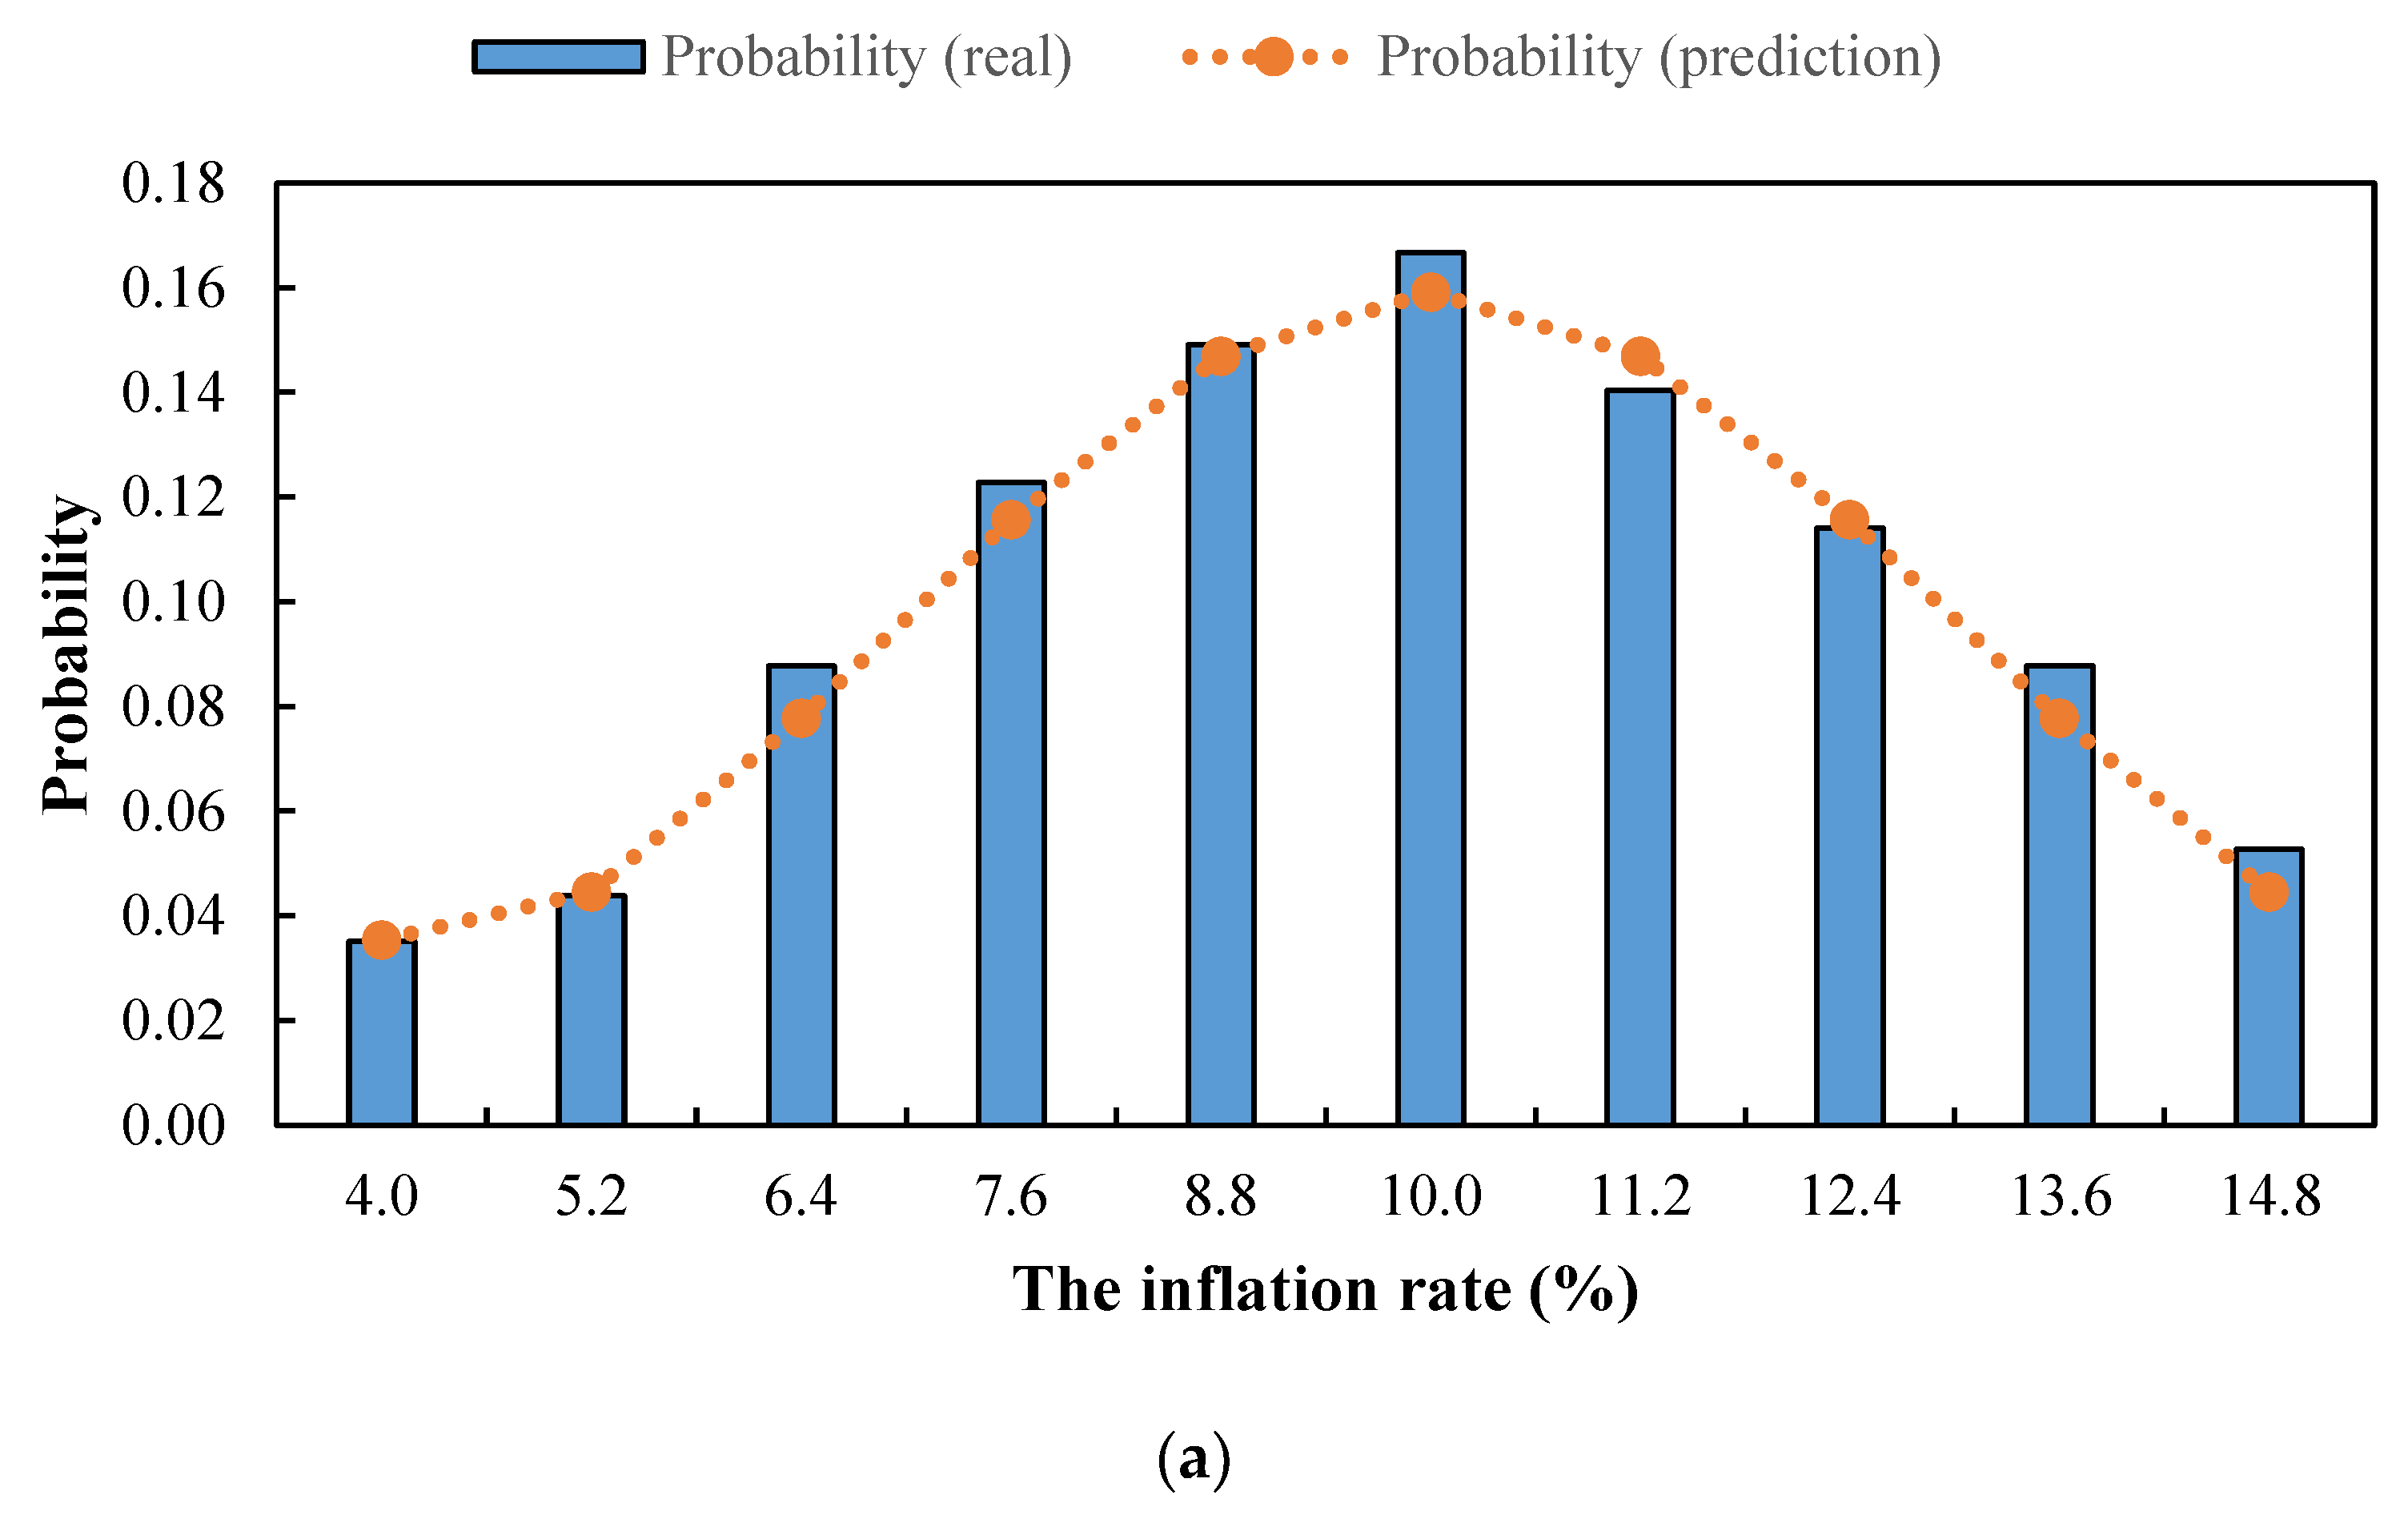
Then, the historical data are used to find the best distribution functions for the three indicated parameters, which are plotted in Figure 4 (in the next part). The processes of finding the adjusting parameters for each distribution and the related error analyses took place on the MATLAB interface.
3.
In the next stage, the number of iterations is determined. Here, the value of 2000 is considered for the number of iterations.
4.
For each iteration, three random numbers are generated. Each random number is between 0 and 1. Then, each of these three random numbers is made equal to the cumulative distribution function (CDF) for one of the parameters with the uncertainty. By solving the equation, the corresponding value of the parameter with the uncertainty is obtained.
5.
Next, the obtained values derived from solving the equations in stage 4 are used as the values of inflation, the discount rate, and the CO2 emission factor, and the calculations are made using them to find the corresponding values of both SCO2 and CPL. The SCO2 and CPL values are stored for each iteration.
6.
Finally, using the stored data in stage 5, the distribution plots of the performance criteria, which are SCO2 and CPL, are drawn as the output.
As mentioned, the calculations were made using the developed codes in the MATLAB software program. The reason for choosing MATLAB is that this software program contains robust toolboxes and pre-defined functions for different purposes, including statistical analysis.
In order to obtain the exact result, the accurate economic and environmental effect is critical. Therefore, the well-known economic and environmental models for conducting the calculations are employed while the input data for the modeling are from the reliable data sources. The economic indicators are from the data available on the website of the Central Bank of Iran (CBI) [28], while for the environmental parameters, the information found on the website of the Iranian Department of Environment (IDOE) [29] is utilized.

3. Results

The extracted historical data, in addition to the best found fit for each of the three investigated variables, i.e., inflation and discount rates, as well as u C O 2 , N G , are presented in Figure 4. Figure 4a indicates that the normal distribution is the best fit for the inflation rate, where a mean value of around 10% and a standard deviation of around 2.5% are observed. The highest and lowest probabilities also belong to the ranges with the centers of 10.0 and 4.0%, with the values of 0.167 and 0.035, respectively.
However, the distribution for the discount rate is not normal, and it follows a log-normal shape, as Figure 4b shows. The log-normal distribution for the discount rate tends more towards the lower values, where the peak probability is seen for the discount of 6%, with a value of 0.177. The values of 1, 2, 3, and 4% further to the right side, i.e., with discount values of 7, 8, 9, and 10%, have the probability values of 0.131, 0.085, 0.070, and 0.045, respectively. The corresponding values for the shift left from the center are 0.162, 0.123, 0.108, and 0.077, respectively. This means the ratios of 1.24, 1.45, 1.54, and 1.71 between discount rates of 5 and 7%, 4 and 8%, 3 and 9%, and 2 and 10%, respectively.
Based on Figure 4c, u C O 2 , N G is something in between, for which the summation of a normal and log-normal distribution brings the best condition. The value around 0.179 kg · (kWh)−1 could be introduced as the mean value. The range is also from 0.140 to 0.210 kg · (kWh)−1, while the maximum and minimum probabilities are found for the mean value, i.e., 0.179 kg · (kWh)−1, and both extreme sides, i.e., 0.140 and 0.210 kg · (kWh)−1. The values for them are 0.157 and 0.047, respectively.
It was found that variables like inflation and discount rates, as well as u C O 2 , N G , have considerable uncertainty. Likewise, taking the uncertainty for the economic and energy indicators of a solar still is also of great importance, as Figure 5 and Figure 6 show. Figure 5 and Figure 6 provide the distribution of CPL and the annual SCO2, respectively.
Based on Figure 5, CPL has an almost normal distribution, with the average of 0.0241 $ · L−1, and a standard deviation of 0.0019 $ · L−1. Bearing in mind that among the indicators, inflation has a normal distribution, while discount is closer to the log-normal shape, it was found that inflation makes a greater contribution to the uncertainty of CPL. The uncertainty of CPL is also 0.0058 $ · L−1, which comes from the point at which it varies from 0.0212 to 0.0270 $ · L−1. The obtained value for the uncertainty of CPL indicates a considerable variation range.
For SCO2, like CPL, the uncertainty is considerable, which can be observed in Figure 6. Therefore, as with some other renewable energy-driven systems whose uncertainties have been studied in the past (like renewable energy electrification systems with storage units [30], microgrid renewable energy power connected systems [31], and wind turbines [32]), uncertainties are significant, and they should not be neglected. Figure 6 indicates that there is an uncertainty of 110.2 g for SCO2, where the lower and upper limits are 317.7 and 427.9 g. The ranges with centers of 378.9, 366.7, and 354.4 g have the top, second, and third highest levels of probability, with the values of 0.1716, 0.1618, and 0.1418, respectively. The lowest levels of probability are also seen for the values close to the upper limit. The ranges with the centers of 415.6 and 427.9 g have the probabilities of 0.0448 and 0.0149, respectively. For this case, the shape is similar to that of u C O 2 , N G since it has the strongest impact among the three investigated criteria.

4. Conclusions

High levels of uncertainty were observed for the economic indicators, namely inflation and the discount rate, as well as the CO2 emissions of natural gas. This is similar to what has been seen for other energy systems, such as renewable energy electrification systems with storage units [30], microgrid renewable energy power connected systems [31], and wind turbines [32]. According to the results for the investigated case, in which a solar still was used in Tehran, Iran, a range from 4.0 to 14.8% for inflation and a range from 2.0 to 11.0% for the discount rate were found. The CO2 emissions of natural gas also had a variation range of 0.140 to 0.210 kg · (kWh)−1. Such uncertainty in the effective input variables was also accompanied by a considerable uncertainty in cost per liter (CPL) and the annual CO2 saving (SCO2). CPL had a variation range between 0.0212 and 0.0270 $ · L−1, while the corresponding value for the annual SCO2 was from 317.7 to 427.9 g. The highest probabilities for these two performance indicators were also 0.1727 and 0.1716, which were seen for CPL and the annual SCO2 at 0.0245 $ · L−1 and 378.9 g, respectively. Therefore, when considering uncertainty (distribution) instead of an exact value for the input variables (like inflation and the CO2 emission factor of natural gas) and, consequently, the performance indicators (such as CPL and annual SCO2), it was found necessary to obtain realistic results. One of the suggested avenues for future research involved conducting studies in other countries and comparing the results. Another potential topic for the future studies is the comparison of the employed technology in this work (single slope) with other technologies (e.g., double slope).

Author Contributions

Conceptualization, S.S., A.B. and A.S.; methodology, S.S. and A.B.; software, S.S. and F.D.; validation, A.S.; formal analysis, S.S. and A.B.; investigation, A.B., F.D. and A.S.; resources, A.B. and A.S.; data curation, F.D.; writing—original draft preparation, S.S. and A.B.; writing—review and editing, F.D. and A.S.; visualization, A.B. and A.S.; supervision, A.S.; project administration, A.S.; All authors have read and agreed to the published version of the manuscript.

Funding

This research received no external funding.

Data Availability Statement

Data will be available upon the reasonable request from the corresponding author.

Acknowledgments

The authors would like to sincerely thank the efforts of all members of Energies journal who have been involved in processing this paper, including pre-submission, submission, and proofing stages. In particular, the authors’ deep appreciation is extended to the internal editors for their kind, warm, supportive, and responsible behavior. The authors would like to also acknowledge the valuable assistance provided by the AI language model from OpenAI in generating ideas and preliminary text for the motivation and literature review sections of the introduction part of this manuscript. The content generated by the AI model served as a starting point and was subsequently reviewed, edited, and refined by the authors to align with the objectives and context of this publication. We affirm that all intellectual contributions have been made by the human authors in compliance with academic and ethical standards. Other parts of the work have all been completely written as the authors’ original.

Conflicts of Interest

The authors declare no conflict of interest.

References

  1. Abu El-Maaty, A.E.; Awad, M.M.; Sultan, G.I.; Hamed, A.M. Innovative Approaches to Solar Desalination: A Comprehensive Review of Recent Research. Energies 2023, 16, 3957. [Google Scholar] [CrossRef]
  2. Dabiri, D.; Dehghan Banadaki, M.; Bazargan, V.; Schaap, A. Numerical investigation of moving gel wall formation in a Y-shaped microchannel. SN Appl. Sci. 2023, 5, 105. [Google Scholar] [CrossRef]
  3. Ghamati, E.; Kariman, H.; Hoseinzadeh, S. Experimental and Computational Fluid Dynamic Study of Water Flow and Submerged Depth Effects on a Tidal Turbine Performance. Water 2023, 15, 2312. [Google Scholar] [CrossRef]
  4. Dabiri, D.; Saadat, M.; Mangal, D.; Jamali, S. Fractional rheology-informed neural networks for data-driven identification of viscoelastic constitutive models. Rheol. Acta 2023. [Google Scholar] [CrossRef]
  5. Dhivagar, R.; Deepanraj, B.; Mohanraj, M.; Ong, H.C. Second law based thermodynamic analysis of crushed gravel sand and biomass evaporator assisted solar still. Sustain. Energy Technol. Assess. 2022, 52, 102160. [Google Scholar] [CrossRef]
  6. Hamwi, H.; Al-Suwaidan, M.S.; Al-Naser, A.A.; Al-Odwani, A.; Al-Sammar, R.; Aldei, S.A. A Pilot Study of Micro Solar Still Technology in Kuwait. Energies 2022, 15, 8530. [Google Scholar] [CrossRef]
  7. Nemoianu, I.V.; Dragomirescu, C.G.; Manescu, V.; Dascalu, M.-I.; Paltanea, G.; Ciuceanu, R.M. Self-Organizing Equilibrium Patterns of Multiple Permanent Magnets Floating Freely under the Action of a Central Attractive Magnetic Force. Symmetry 2022, 14, 795. [Google Scholar] [CrossRef]
  8. Feria-Díaz, J.J.; López-Méndez, M.C.; Ortiz-Monterde, L.; Médina-Salgado, B.A.; Perez-Rosas, N.C. Performance Evaluation of Solar Still in Veracruz, Mexico Gulf Coastline. Water 2022, 14, 1567. [Google Scholar] [CrossRef]
  9. Sztekler, K.; Mika, Ł. Increasing the Performance of an Adsorption Chiller Operating in the Water Desalination Mode. Energies 2021, 14, 7743. [Google Scholar] [CrossRef]
  10. Shoeibi, S.; Rahbar, N.; Abedini Esfahlani, A.; Kargarsharifabad, H. A comprehensive review of Enviro-Exergo-economic analysis of solar stills. Renew. Sustain. Energy Rev. 2021, 149, 111404. [Google Scholar] [CrossRef]
  11. Parsa, S.M.; Rahbar, A.; Javadi, Y.D.; Koleini, M.H.; Afrand, M.; Amidpour, M. Energy-matrices, exergy, economic, environmental, exergoeconomic, enviroeconomic, and heat transfer (6E/HT) analysis of two passive/active solar still water desalination nearly 4000m: Altitude concept. J. Clean. Prod. 2020, 261, 121243. [Google Scholar] [CrossRef]
  12. Tuly, S.S.; Islam, M.S.; Hassan, R.; Das, B.K.; Sarker, M.R.I. Investigation of a modified double slope solar still integrated with nanoparticle-mixed phase change materials: Energy, exergy, exergo-economic, environmental, and sustainability analyses. Case Stud. Therm. Eng. 2022, 37, 102256. [Google Scholar] [CrossRef]
  13. Shatar, N.M.; Sabri, M.F.M.; Salleh, M.F.M.; Ani, M.H. Energy, exergy, economic, environmental analysis for solar still using partially coated condensing cover with thermoelectric cover cooling. J. Clean. Prod. 2023, 387, 135833. [Google Scholar] [CrossRef]
  14. Sonawane, C.; Alrubaie, A.J.; Panchal, H.; Chamkha, A.J.; Jaber, M.M.; Oza, A.D.; Zahmatkesh, S.; Burduhos-Nergis, D.D.; Burduhos-Nergis, D.P. Investigation on the Impact of Different Absorber Materials in Solar Still Using CFD Simulation—Economic and Environmental Analysis. Water 2022, 14, 3031. [Google Scholar] [CrossRef]
  15. Hassan, H.; Yousef, M.S.; Ahmed, M.S.; Fathy, M. Energy, exergy, environmental, and economic analysis of natural and forced cooling of solar still with porous media. Environ. Sci. Pollut. Res. 2020, 27, 38221–38240. [Google Scholar] [CrossRef]
  16. Bait, O. Exergy, environ–economic and economic analyses of a tubular solar water heater assisted solar still. J. Clean. Prod. 2019, 212, 630–646. [Google Scholar] [CrossRef]
  17. Sharshir, S.W.; Ismail, M.; Kandeal, A.W.; Baz, F.B.; Eldesoukey, A.; Younes, M.M. Improving thermal, economic, and environmental performance of solar still using floating coal, cotton fabric, and carbon black nanoparticles. Sustain. Energy Technol. Assess. 2021, 48, 101563. [Google Scholar] [CrossRef]
  18. Dhivagar, R.; Mohanraj, M.; Deepanraj, B.; Murugan, V.S. Assessment of single slope solar still using block and disc magnets via productivity, economic, and enviro-economic perspectives: A comparative study. Environ. Sci. Pollut. Res. 2022, 29, 50951–50959. [Google Scholar] [CrossRef]
  19. Sharon, H. Energy, exergy, environmental benefits and economic aspects of novel hybrid solar still for sustainable water distillation. Process Saf. Environ. Prot. 2021, 150, 1–21. [Google Scholar] [CrossRef]
  20. Nazari, S.; Daghigh, R. Techno-enviro-exergo-economic and water hygiene assessment of non-cover box solar still employing parabolic dish concentrator and thermoelectric peltier effect. Process Saf. Environ. Prot. 2022, 162, 566–582. [Google Scholar] [CrossRef]
  21. Sohani, A.; Hoseinzadeh, S.; Berenjkar, K. Experimental analysis of innovative designs for solar still desalination technologies; An in-depth technical and economic assessment. J. Energy Storage 2021, 33, 101862. [Google Scholar] [CrossRef]
  22. City Population. The Population of Tehran. 2023. Available online: http://www.citypopulation.de/en/iran/prov/admin/23__tehr%C4%81n/ (accessed on 10 June 2023).
  23. Razeghi, M.; Hajinezhad, A.; Naseri, A.; Noorollahi, Y.; Moosavian, S.F. Multi-criteria decision for selecting a wind farm location to supply energy to reverse osmosis devices and produce freshwater using GIS in Iran. Energy Strategy Rev. 2023, 45, 101018. [Google Scholar] [CrossRef]
  24. Sohani, A.; Delfani, F.; Fassadi Chimeh, A.; Hoseinzadeh, S.; Panchal, H. A conceptual optimum design for a high-efficiency solar-assisted desalination system based on economic, exergy, energy, and environmental (4E) criteria. Sustain. Energy Technol. Assess. 2022, 52, 102053. [Google Scholar] [CrossRef]
  25. DESWARE: Encyclopedia of Desalination and Water Resources. Energy Requirements of Desalination Processes. Available online: https://www.desware.net/Energy-Requirements-Desalination-Processes.aspx#:~:text=Theoretically%2C%20about%200.86%20kWh%20of,the%20type%20of%20process%20used (accessed on 10 October 2021).
  26. Central Bank of the Islamic Republic of Iran. Inflation and Discount Rates during the Past Years: From 2000 to 2022. 2023. Available online: https://www.cbi.ir/ (accessed on 11 June 2023).
  27. Azizi, S.; Radfar, R.; Nikoomaram, H.; Rajabzadeh Ghatari, A. Dynamic modeling to analyze the impacts of carbon reduction policies, Iran’s electricity industry. Environ. Monit. Assess. 2023, 195, 350. [Google Scholar] [CrossRef]
  28. Central Bank of the Islamic Republic of Iran. The Historical Data for Inflation and Discount Rate in Iran. Available online: https://www.cbi.ir/simplelist/1589.aspx (accessed on 15 July 2023).
  29. The Iranian Department of Environment. The Historical Data about the Environmental Indicators in Iran. Available online: https://bpita.doe.ir/portal/home/?1391581/%D8%A2%D9%85%D8%A7%D8%B1 (accessed on 27 July 2023).
  30. Wang, W.; Yuan, B.; Sun, Q.; Wennersten, R. Application of energy storage in integrated energy systems—A solution to fluctuation and uncertainty of renewable energy. J. Energy Storage 2022, 52, 104812. [Google Scholar] [CrossRef]
  31. Ali Dashtaki, A.; Mehdi Hakimi, S.; Arezoo, H.; Derakhshani, G.; Abdi, B. Optimal management algorithm of microgrid connected to the distribution network considering renewable energy system uncertainties. Int. J. Electr. Power Energy Syst. 2023, 145, 108633. [Google Scholar] [CrossRef]
  32. Ramírez, F.J.; Villena-Ruiz, R.; Honrubia-Escribano, A.; Pérez-Barroso, A.; Gómez-Lázaro, E. Assessment of different end-of-life strategies for wind power plants under uncertainty. Energy Convers. Manag. 2022, 270, 116158. [Google Scholar] [CrossRef]
Figure 1. The solar still design investigated here [21].
Energies 16 06924 g001
Figure 2. Fresh water production of the studied solar still, experimentally measured.
Energies 16 06924 g002
Figure 3. Flow chart of the employed Monte Carlo methodology in this study.
Energies 16 06924 g003
Figure 4. The found distributions for the indicated parameters: (a) inflation; (b) discount; (c) u C O 2 , N G . The economic and environmental data are from Ref. [28] and Ref. [29], respectively.
Energies 16 06924 g004aEnergies 16 06924 g004b
Figure 5. Distribution of CPL obtained by the employed Monte Carlo approach.
Energies 16 06924 g005
Figure 6. Distribution of SCO2 obtained by the employed Monte Carlo approach.
Energies 16 06924 g006
Disclaimer/Publisher’s Note: The statements, opinions and data contained in all publications are solely those of the individual author(s) and contributor(s) and not of MDPI and/or the editor(s). MDPI and/or the editor(s) disclaim responsibility for any injury to people or property resulting from any ideas, methods, instructions or products referred to in the content.

