Article

Improving the Feed-in Tariff Policy for Renewable Energy Promotion in Ukraine’s Households

1
International Economic Relations Department, Sumy State University, 40007 Sumy, Ukraine
2
Department of Economics, Entrepreneurship and Business Administration, Sumy State University, 40007 Sumy, Ukraine
3
Estonian Entrepreneurship University of Applied Sciences, 11415 Tallinn, Estonia
4
Department of Applied Sciences, Academy of Applied Sciences Mazovia, 08-110 Siedlce, Poland
5
Department of Business Economics and Administration, Sumy State Makarenko Pedagogical University, 40000 Sumy, Ukraine
6
Department of Enterprise Management, AGH University of Krakow, 30-059 Krakow, Poland
7
Department of Economics and Entrepreneurship, National Technical University of Ukraine “Igor Sikorsky Kyiv Polytechnic Institute”, 03056 Kyiv, Ukraine
*
Author to whom correspondence should be addressed.
Energies 2023, 16(19), 6773; https://doi.org/10.3390/en16196773
Submission received: 16 August 2023 / Revised: 16 September 2023 / Accepted: 19 September 2023 / Published: 22 September 2023
(This article belongs to the Special Issue Sustainable and Low Carbon Development in the Energy Sector)

Abstract

:
This paper deals with improving the feed-in tariff policy for green energy advancement in Ukraine’s households based on assessing the economic efficiency of investment project implementation under the current state support mechanisms. This study was conducted for solar and wind power plants with different installed capacities. The Levelized Cost of Electricity and the payback period for such power plants were calculated considering the ongoing feed-in tariffs and discount rates determined by various equity and debt capital ratios. The results showed that the state support provides attractive payback periods for solar and wind power plants with an installed capacity of ≥30 kW. In comparison, 5 kW solar power plants and wind power plants with a capacity of up to 10 kW are not paid off during the power plants’ lifecycle. It confirmed that the ongoing energy policy in Ukraine’s residential sector is still designed to obtain profits by the owners of generating facilities by selling the excess electricity. In the meantime, its main goal—providing households energy independence—has been levelled. To resolve the issues caused by such a state support model, a methodical approach to improve the feed-in tariff calculation is proposed. In addition, recommendations for reconsidering other policy measures to ensure effective renewable energy development in the residential sector have been made.

1. Introduction

Countries worldwide consider renewable energy (RE) development as a crucial tool in resolving the problem of growing energy demand and mitigating climate change consequences. In addition, deploying RE facilities plays a significant role in ensuring the energy security of the world’s countries, which is especially relevant under recent geopolitical events. Nowadays, achieving ambitious goals for RE transition directly depends on state support. The understanding of this is reflected in the establishment by the countries of indicative targets for increasing the green energy portion in the final energy consumption and the implementation of state support mechanisms to encourage energy production by renewable energy resources (RES) [1,2,3].
Along with promoting RE development in the industrial sector, countries’ governments also seek to foster the use of RES in the residential sector. The most common motivational tool used in the residential sector for RE adoption is the feed-in tariff (FIT). The widespread use of the FIT and its adaptation to the goals and needs of national policies have led to the appearance of a number of its variations, in particular, the fixed FIT, front-end-loaded FIT, adjusted FIT, premium FIT, etc. [4,5]. The effectiveness of the FIT as an incentive tool is confirmed by the rapid deployment of RE facilities in countries where it is used. Thus, the introduction of the FIT into the household sector has had a remarkable impact on deploying solar energy in Germany [6], the UK [7], China [8], and other countries [9,10]. At the same time, despite the fact that the main goal of increasing green electricity has been achieved, RE promotion with the help of generous FITs has led to some challenges, the main of which include an increase in state expenditures for compensating payments for FITs and technical limitations of the electricity grids [6,7]. It has contributed to the revision of the FIT policy, which, in most countries, caused uncertainty regarding the future trends in RE development or a decrease in the pace of RE facilities installation in the household sector [7,11].
It should be noted that Ukraine was no exception, and, since 2014, it has implemented an energy policy for RE promotion in households as part of the energy strategy, where the primary economic tool is the fixed FIT [12,13]. However, despite certain successes in developing small-scale-RE distributed energy generation, state policy in this sector cannot be called effective. The result of its implementation was the rapid development of only solar photovoltaic (PV) systems, which became possible due to the high rates of the FIT. The pursuit of profits from selling the excess electricity at the high FIT has led to some abuses by the household owners. Cases of increasing the capacity of the generating facilities beyond the permitted value, setting the inverter equipment to the maximum output (which has negative consequences for the electrical equipment of neighboring consumers), and installing solar PV systems without or with low-level electricity consumption have been recorded repeatedly. Thus, the electricity consumption in about 40% of households with installed solar PV systems is less than 10 kWh/month, while the average electricity consumption in Ukrainian households, as of 2020, was 168 kWh (or 954 kWh with electricity heating) [14].
Because of the considerable growth of solar power plants and the aforementioned manipulations, the payments of the transmission system operator to cover the difference between the FIT and the market electricity price are increasing annually, which ultimately falls on other consumers as an additional financial burden. Therefore, in 2020, such expenses amounted to UAH 2.26 billion; moreover, in 2021, it increased to UAH 4.07 billion [15]. In addition, the over incentives for solar energy have led to disparities in RE facilities deployment in households. Thus, although the FIT also applies to the electricity produced by wind power plants, due to the higher rates of solar power (which for a long time ensured a payback period of 3.3–4.5 years [16,17]), households preferred to invest in solar power plants.
Considering the above, it can be concluded that the main focus of the RE policy in the residential sector has not been placed on ensuring household energy independence, due to their electricity production, but on obtaining significant profits by the owners of RE power plants owners by selling the unconsumed excess electricity. This energy policy model has resulted in several challenges and abuses in the household sector. Thus, it is evident that the current approaches for fostering RE in the residential sector should be revised for further effective green energy transition. Given the above, this paper’s primary focus will be on evaluating the cost of the electricity produced by RE power plants and the payback period based on the current FIT rates and discount rates determined by the different ratios of equity and debt capital involved in investment project implementation. Based on the obtained results, recommendations regarding improving the methodology for calculating the FIT and the state policy for fostering RE facilities deployment in Ukraine’s households will be given. Figure 1 presents the main steps of the research algorithm.
The article structure is as follows: Section 2 presents a literature review regarding the researched subject. In Section 3, we analyze policy for fostering RE in the residential sector of Ukraine and its impact on RE facilities deployment. Section 4 describes the research methods. In Section 5, we discuss the obtained research results and propose approaches for improving the methodical approaches for FIT rates calculation and give policy recommendations for effective RE development in the household sector. Section 6 contains conclusions and points to potential areas of further study.

2. Literature Review

Many research papers are dedicated to RE development, including investment issues [18,19,20,21,22], the identification of drivers and barriers for the effective deployment of RE facilities [23,24,25], the evaluation of economic, environmental, social, and other benefits from RE project implementation, etc. [26,27,28]. Two main research blocks can be distinguished when adopting RE in the residential sector. The first concerns the analysis of the support schemes for stimulating RE development, comparing their effectiveness, and assessing their impact on installing RE facilities in households. The second focuses on the role of socio-demographic, housing, environmental, and other factors influencing the decisions of the household owners to install RE power plants.
Many studies focus on the fact that the economic mechanisms aimed at encouraging green electricity production play a crucial role in RE development. Nowadays, tools such as FIT, net metering, and net billing are most widely used to promote green energy development in the household sector, while the RE portfolio standards, green auctions, and tender systems are primarily used in the industrial sector [29,30]. The state support schemes play a unique role at the initial stage of RE technology development, due to their inability to compete with conventional methods in market conditions. Considering the trends towards a gradual decrease in electricity production cost based on RES, the value of economic incentives is somewhat reduced; however, the state support for RE promotion in households still plays a considerable role in most countries.
Thus, the research results obtained by Jacksohn and et al. [31] prove that the decisions of German households to invest in RE projects are mainly influenced by economic factors. The authors found a clear relationship between the investment decision and the anticipated profit from the investment activity. At the same time, socio-demographic factors, housing characteristics, and environmental issues do not significantly impact household owners’ decision making.
Lan et al. [9] investigated the impact of state policy measures, particularly the FIT, on stimulating solar energy deployment in Australian households. The study results show that the readiness of household owners to invest in solar PV systems increases with the growing FIT rates. The authors concluded that the FIT rates should be as high as possible in the early stages of RE technology development. In contrast, at later stages, they can be appropriately reduced. For more effective stimulation and a reduction in the financial pressure on the government budget, combining the FIT with the lending policy with low interest rates is advisable.
The study results of Guta [32] demonstrate that, in Ethiopia, high household revenue directly affects RE technology adoption in the residential sector, as financial ability allows household owners to pay for their initial cost. Among other factors, household membership in energy cooperatives, access to credit, and education policy increase the probability of investing in RE. These results are confirmed by a study conducted in Kenya [33], where the authors added to the above factors, other socio-economic and demographic characteristics, that positively influence decision making regarding RE projects implementation, in particular, increasing household size, family status, and age of the household owners.
In turn, a study by Etongo and Naidu [34] has proven that age, education, and family size, which were significant in the abovementioned studies, are not crucial for solar energy technology adoption in Seychelles’ households. The primary motivating factors for solar PV systems installation in the Seychelles are cost saving, energy security, and environmentally friendly perceptions. Meanwhile, low electricity tariffs, the high investment cost of solar PV systems, credit conditions, and a long payback period for investment projects are the main obstacles to investing in solar energy. According to a study by Štreimikienė and Baležentis [35], despite the willingness of Lithuanian household owners with higher revenues and educational status to pay higher prices for green electricity, there are other factors besides these in making investment decisions. The main factors of the willingness of Lithuanian households to invest in green energy projects are the awareness of RES and environmental issues. Thus, there is a particular regional difference in the critical factors influencing households’ investment in RE facilities. Therefore, when developing public policy, it is necessary to consider each country’s peculiarities.
Braito and et al. [36] studied personal, social group, and psychological patterns of investment in RE within the framework of different energy policy models. The authors investigated contrasting state support policies for solar energy promotion in households, particularly the high financial initiatives in Italy’s province versus the lower ones in Austria. The authors concluded that the financial incentives directly impact solar PV system development in the households of both countries, as both individual and collective investors seek to receive economic benefits. However, the authors emphasized the importance of balanced economic support and its combination with non-monetary initiatives, as overly generous financial incentives in Italy may supplant households’ preferred non-financial motivation, which can lead to a decrease in solar PV systems installation after the expiration of the state incentives.
Solar energy in Ukraine’s households may face similar risks, since the stimulation of its development for a long period was based on high financial support and virtually no non-monetary initiatives. As a result, there is a strong link between the economic support level and solar power plants deployment in households. At the same time, some economic entities, in particular, higher education institutions, do not have the opportunity to take advantage of such economic incentives. As a result, the level of RES involvement in electricity production by them is practically absent. However, even without state economic support, implementing such projects can ensure significant economic, ecological, and social gains [28]. Thus, generous economic incentives may carry potential risks with a sharp change in regulatory approaches in the future, which are inevitable amid the increasing green electricity share and financial burden to support such measures. In addition, they can reduce the motivation of other economic entities whose conviction to invest in RE is based on non-monetary initiatives. These studies confirm this statement [37,38], where the authors note that, in addition to the direct price effect, monetary support indirectly influences in the form of the crowding out specific groups or reducing the internal motivation to provide public goods constantly.
This study contributes to the scientific literature by conducting an in-depth cost evaluation of the electricity produced by small solar and wind power plants in the residential sector of Ukraine. The research examines the payback periods under various scenarios and considers different discount rates alongside the prevailing FITs. By offering a comprehensive assessment of these crucial factors, this paper enhances our understanding of the economic viability of RE investments in Ukraine’s households.
Furthermore, this study sheds light on the efficiency of the economic support for RE development, particularly in the residential sector. It quantifies the benefits and highlights the potential risks associated with overpromotion, where economic incentives may be compromised. This nuanced analysis provides policymakers and stakeholders with valuable insights for refining RE policies and FIT methodologies.
Moreover, this research identifies the pivotal conditions that signal the need for timely adjustments in RE management, thereby helping to ensure the sustainability of green energy initiatives. By offering recommendations grounded in empirical data, this study aims to guide informed decision making, fostering responsible and sustainable RE development in Ukrainian households while minimizing potential pitfalls.

3. State Support Policy and Its Impact on Renewable Energy Facility Deployment in Ukraine’s Households

The state policy for promoting RE development was introduced in Ukraine in 2009; however, the economic mechanisms to encourage green electricity production were only applied to the industrial sector. In 2014, the legislation was amended, and it was extended to include the household sector.
Thus, under the Law of Ukraine “On Alternative Energy Sources” [13], the primary motivational tool is the FIT—a tariff under which the state purchases the excess electricity produced by the RE power plants of households that is not consumed for their own needs.
Starting from 2014, households have been allowed to implement solar and wind power plants with a total capacity of ≤30 kW. Since the beginning of 2019, considering the substantial demand for installing solar PV systems, their allowed capacity has been reconsidered up to 50 kW, providing that they are placed on the roofs and/or building facades and other facilities without using agricultural land. However, the specified legal norm was valid only until the end of 2019, after which it was cancelled. Starting in 2019, the FIT began to apply to hybrid wind–solar power plants with a capacity of up to 50 kW [13].
To protect the owners of the RE facilities from possible inflation, the FITs are recalculated to the EUR exchange rate and are revised quarterly, pursuant to the official rate of the National Bank of Ukraine (NBU). It should be noted that the household revenue from selling the excess electricity at the FIT is taxable. The tax amount is 19.5%, of which 18% is personal revenue tax and 1.5% is military levy.
The FIT for promoting RE deployment in households has been established until 1 January 2030. The state guarantees to buy all of the electricity unconsumed for household needs.
Further to the FIT, households can use some tax and customs benefits during RE project implementation [39,40], namely, the waiver of payment of value-added tax (VAT) and customs fees when purchasing equipment for installing the RE power plants.
In addition, households can use special credit lines, particularly “Green Energy” of Oschadbank and “Eco Energy” of Ukrgasbank. Thus, under the above programs, households can receive a loan to purchase and install RE power plants. According to the credit terms, the minimum first instalment that households must pay is 15% of the cost of the goods and services. The credit term is from 1 to 6 years. The maximum loan amount is UAH 1 million. The loan rate depends on the loan term and the amount of the first instalment [41,42].
Implementing the above support mechanisms increased the household sector’s investment attractiveness; however, only solar PV systems have acquired dynamic development (Table 1).
Thus, the data in Table 1 show that, as of the end of 2021, 44,888 small solar PV systems, with a cumulative installed capacity of 1205 MW, were installed. It should be noted that such growth was ensured by the high FITs for the solar PV systems, the payments for which are included in the electricity tariffs. Thus, considering that Ukraine’s budget does not provide for special sources for financing the expenses under the FIT, the increase in green energy share places an additional financial burden on the electricity consumers.
At the same time, wind energy in households is practically not developing. By the end of 2021, only four wind power plants, with a cumulative installed capacity of 57 kW, were commissioned. The main reason for this was the higher FIT rate for solar power plants, which made the solar energy segment extremely attractive to investors. One more barrier to wind energy deployment in households was the long-term absence of the FIT for hybrid wind–solar power plants. Thus, until 2019, due to the difference in the FITs, installing hybrid wind–solar plants required the registration of two electricity production metering points, which was not profitable. Hence, households preferred solar power plants instead of hybrid wind–solar plants. To resolve this issue, the FIT for combined wind–solar power plants was introduced in 2019. However, after four months, its rate was reduced by 25%, making their installation economically unattractive and the plans for such energy facilities development declarative [45].
Given the above, it can be argued that, despite certain achievements, the state policy for RE promotion in Ukrainian households cannot be called effective. The main problem was the focus of the FIT on the purposeful sale of the excess electricity, which caused the rapid PV systems installations but, at the same time, led to problems with the financing of the payments under the FIT. In turn, due to the imperfect energy policy, wind energy in Ukraine’s households is practically not developing.
Since green energy transition remains one of the state’s priorities for the coming years, and its pace depends largely on the efficiency of the energy policy, the revision of approaches to forming support measures is becoming particularly relevant. In the household sector, where the primary motivational tool is the FIT, methodical approaches to calculating its rates for RE facilities considering their installed capacities, the RE technologies used, and the structure of the investment expenditures should be improved.

4. Methods

To balance the interests of households and the state, the FIT rates for RE power plants should be based on assessing the economic efficiency of such projects implementation. To determine the required level of state support, we will estimate the electricity production cost, the current rates of the FITs, and the RE projects’ payback periods.
The cost of electricity produced by household RE power plants will be evaluated based on the Levelized Cost of Electricity (LCOE) method. The LCOE demonstrates the fixed electricity cost during a power plant’s lifecycle, which equates the total discounted expenditures for its construction and operation to the total discounted revenue from selling electricity [46]. The calculation of LCOE will be based on the following indicators: investment, operating and decommissioning expenditures, the amount of electricity produced, and the discount rate. Considering these indicators, the formula will be as follows:
L C O E   = t = 0 n   ( ( I t + Q t + D t ) · 1 + r   t   )           t = 0 n   ( E t · 1 + r   t ) ,
where LCOE is the fixed cost of electricity production throughout the lifecycle of a power plant, UAH/kWh; Et is the amount of produced electricity by the power plant in the t-th year, kWh; It is the investment expenditures in the t-th year, UAH; Qt is the operating and maintenance expenditures in the t-th year, UAH; Dt is the decommissioning expenditures in the t-th year, UAH; n is the lifecycle of the power plant, years; r is the discount rate; and t is the year of realization of the investment project.
To calculate the discount rate, we will use the following formula of weight average cost of capital (WACC) [47]:
W A C C = K s · W s + K d ·   W d ,
where Ks is the equity cost for the investment project realization, unit share; Ws is the equity share by the balance, unit share; Kd is the debt cost for the investment project implementation, unit share; and Wd is the debt share by the balance, unit share.
Next, to assess the economic feasibility of the current FITs, we will calculate their rates and determine the projects’ payback periods based on them.
The minimum FIT rate is calculated following the resolution of the NCSREPU No. 1817, dated 30 August 2019 [48]. Thus, according to [48], the fixed minimum FIT rate ( F I T m i n , UAH per 1 kWh without VAT) is determined by the following formula:
F I T m i n = T 2009 · k F T E 2009   ,
where T 2009 is the electricity tariff for households as of January 2009; k F T is the FIT coefficients, which are defined by [12]; and E 2009 is the exchange rate of UAH to EUR as of 1 January 2009.
Quarterly, the minimal FIT rates are reviewed by the NCSREPU by recalculating them relative to the EUR exchange rate as of 1 January 2009.
The discounted revenue for the project will be calculated based on the FIT validity period, the average amount of electricity consumption by the household, and the market price of electricity under the methodology presented in [49]. Next, these will be used for calculating the projects’ payback periods according to the following formula [50]:
D P P = m + I Ʃ S m I n c m + 1 · ( 1 + r ) m + 1 ,
where DPP is the discounted payback period of the investment project, years; IΣ is the total discounted investment expenditures for the project, given at the time of the start of the investment, UAH; Sm is the total discounted revenue determined as a cumulative sum until the inequality is satisfied: Sm < IΣ < Sm + 1, where m is the number of complete years when the discounted revenues, determined as the cumulative sum, are less than the discounted investment expenditures; (m + 1) is the year when the discounted revenue, determined as a cumulative sum, will be higher than that of the discounted investment expenditures, UAH; and Incm+1 is the project’s revenue in the (m + 1)-th year, UAH.
Based on assessing the economic efficiency of RE project implementation in households, we will offer an improved methodology to calculate the FIT rates and the terms of state support to ensure the balance of interests for the households and the state. A conceptual map of creating an effective FIT for green energy facilities in households is presented in Figure 2.

5. Result and Discussion

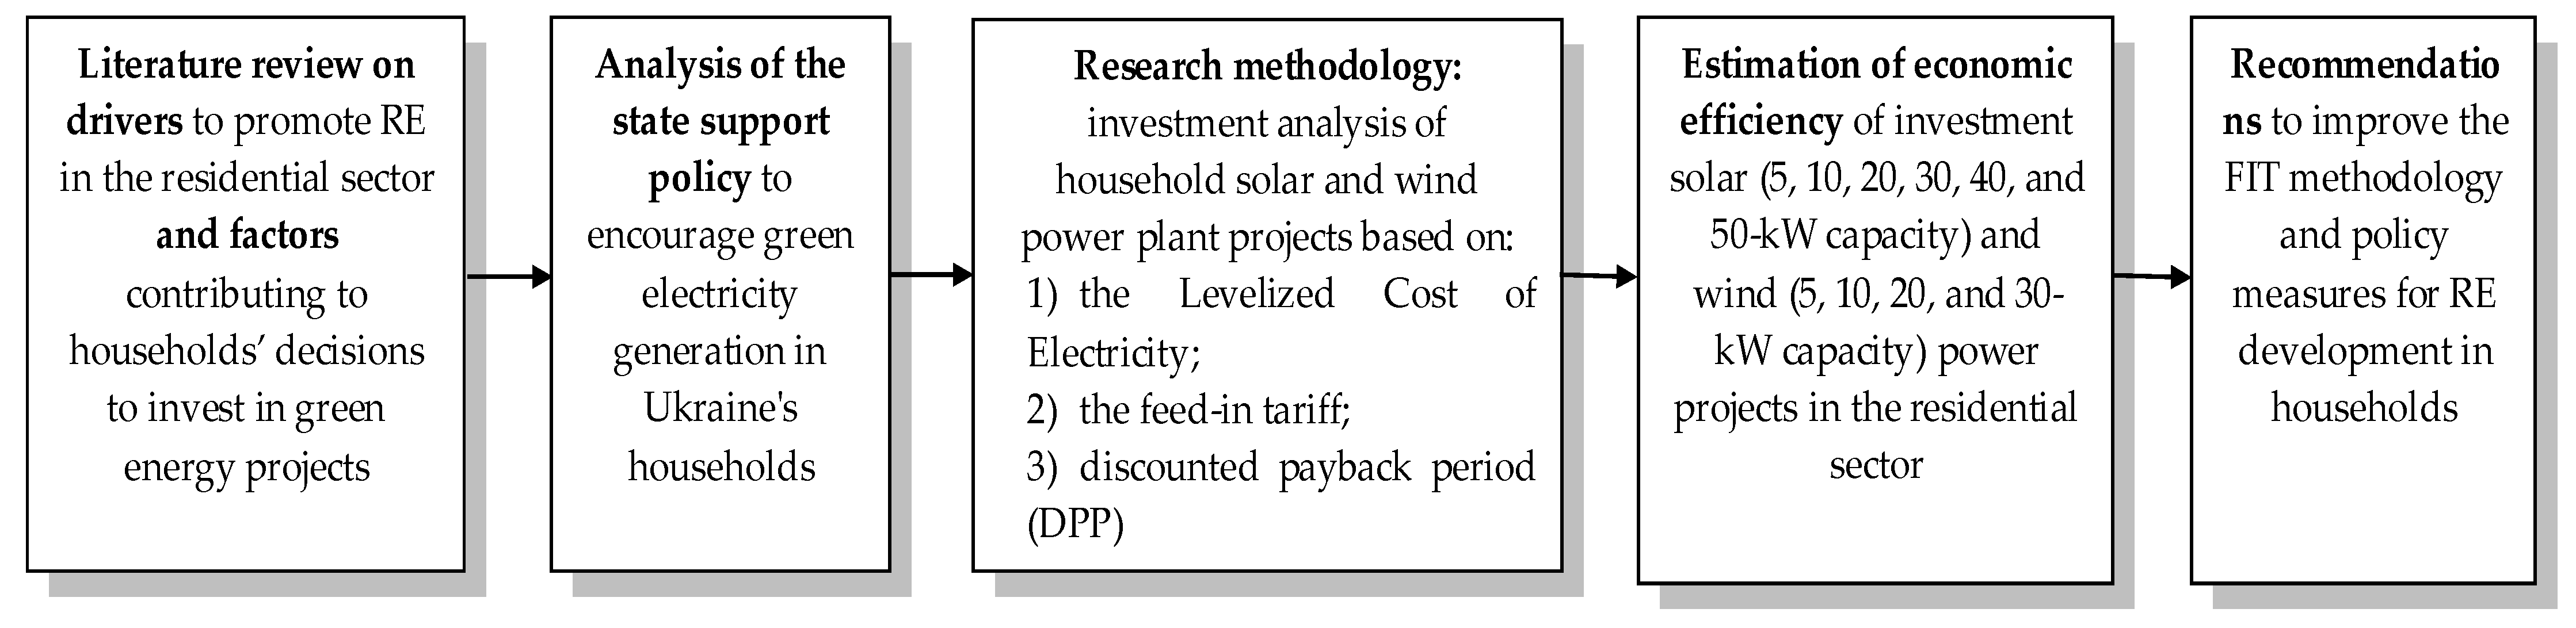
5.1. Evaluation of the Cost of Electricity Produced by RE Power Plants in Ukraine’s Households and Investment Projects’ Payback Periods Based on the Current FIT Rates

This study will calculate the LCOE for household solar power plants with installed capacities of 5, 10, 20, 30, 40, and 50 kW and wind power plants with installed capacities of 5, 10, 20, and 30 kW. The specified capacity range corresponds to the households’ most common power plants and is also determined by the current (0–30 kW) and former (0–50 kW) legal limits. The difference in the selected capacities of the RE facilities is due to the productivity factor of wind power plants, which is 2–3 times higher than that of productivity factor of solar power plants [51]. It is worth noting that the main focus of state support should be providing households with their own electricity and not obtaining profits from the sale of their surpluses at the FIT. Given this, extending state support mechanisms in the household sector to wind power plants with a capacity >30 kW is impractical. In the meantime, as mentioned above, starting from 2019, the FIT was applied to solar PV systems with a capacity of up to 50 kW, providing that they are located on building roofs or facades, without using agricultural land. However, at the end of 2019, the FIT for solar power plants whose installed capacity is between 30 and 50 kW was canceled. In this study, we will estimate the cost effectiveness of such RE projects in order to conclude the feasibility of repealing this legislative norm.
It is noteworthy that the datasets of the solar and wind power plant projects differ somewhat, as they depend on various factors (the solar insolation and wind speed in the region of the RE power plant installation, the technical characteristics of the solar panels and wind generators, etc.); therefore, for calculations in this research, their averaged data were taken, shown in Table 2 [52,53,54,55,56,57,58,59].
It is worth mentioning that the data in Table 2 concerning the electricity production amount will be adjusted for the production reduction factor, which for solar power plants is 0.8% annually [60] for wind power plants is 0.2% annually [61]. The operating and decommissioning expenditures in this study were determined as 1% and 5% of the investment expenditures, respectively [62], and the lifecycle of both types of power plants was determined to be 25 years [63].
Under this study, the cost of electricity production by the RE power plants will be calculated considering various options for the structure of the investment expenditures, as follows: (1) on the condition that the investment projects are implemented entirely with the investor’s funds; and (2) on the condition of attracting own and credit resources for five years within the framework of the Ukrgasbank “Eco Energy” program in the following ratios of 75:25, 50:50, and 25:75, respectively, which will affect the size of the discount rate.
To calculate the discount rate, the equity cost will be determined as the alternative investments in deposits for individuals in the national currency. For this aim, we analyzed the deposit rates in UAH in the most reliable banks in Ukraine based on their stability rating [64]. As of the beginning of June 2023, the following banks offered such annual rates for deposits in UAH for individuals: Credit Agricole—12%, Raiffeisen—12.5%, and Kredobank—14% [65]. Thus, Kredobank offered the highest rate, and it will be used to determine the equity cost.
The cost of the debt capital will be calculated according to the “Eco Energy” credit line. Therefore, subject to attracting credit resources for 5 years with the first instalment payments of 25%, 50%, and 75%, the annual interest rates on the loan are 20.99%, 19.59%, and 18.69%, respectively [42].
Thus, the discount rate calculated according to Formula (2), provided that the investment projects are implemented entirely with the investor’s funds, is 14%, provided that own and credit funds are attracted in the following ratios: 25:75—19.2%, 50:50—16.8%, and 75:25—15.2%.
The LCOE values for the electricity produced by the RE power plants in households, considering different discount rates, are shown in Table 3.
Next, we will compare the obtained LCOE values and the current FIT rates at which the households sell the excess electricity. We will calculate the FIT rates using Formula (3). As mentioned above, the minimum FIT rate is based on the FIT coefficients for the RE power plants, which are shown in Table 4.
As seen in Table 4, the FIT coefficients depend on the generating facility’s commissioning date. They tend to decrease due to the reduction in the cost of equipment, materials, and components for such power plants, which directly affects the electricity production cost.
In this study, the calculation will be carried out for the RE power plants commissioned in 2023; accordingly, the coefficient for the power plants commissioned from 1 January 2020 to 31 December 2024 will be used. As evidenced by the data in Table 4, from 2020 the FIT does not apply to solar power plants with installed capacity between 30 and 50 kW. It is worth noting that, in 2019, the FIT coefficients were the same for the solar PV systems with with an installed capacity of ≤30 kW and those whose capacity is between 30 and 50 kW. Given this, to conclude regarding the feasibility of cancelling the FIT for this category of generating facilities, a coefficient of 3.02 will be used for the 40- and 50-kW solar PV systems. To carry out the FITs recalculation relative to the EUR exchange according to algorithm given in [48], the exchange rate of UAH 3983 for EUR 100 will be used [66]. Table 5 includes the obtained results.
Next, we will calculate investment projects’ payback periods according to Formula (4), based on the following factual data and assumptions:
A household consumes 168 kWh of electricity per month (corresponding to the average monthly electricity consumption by Ukrainian households) [14]) and sells the excess electricity at the FIT. Since the support scheme for RE promotion based on the FIT is valid until 31 December 2029, after its expiration, the electricity will be realized at the market price. When calculating cash flows, savings from the electricity expenditures received by the household as a result of their own production and consumption for their own needs will be considered. If the production is not enough to cover the household’s own needs, then the revenue from the power plant is calculated as the amount of electricity cost savings based on the produced amount;
The electricity tariff for households as of 1 June 2023 was UAH 2.64/kWh [67];
As mentioned above, the revenue from selling electricity at the FIT is taxable at a cumulative rate of 19.5% [39].
The results of the calculations of the payback periods of RE investment projects are given in Table 6.
The results of the calculation of the RE investment projects’ payback periods in Ukraine’s households proved the existence of an economic effect depending on the project’s size. A reduction in investment and operating expenditures as the capacity of an RE power plants increases determines a more attractive payback period for projects with the maximum allowed capacity. Although it is an incentive for households that have the opportunity to implement large-scale projects, a certain category of households, in particular, those that do not have enough financial resources or the ability to install such generating facilities following the requirements of the law, cannot use this incentive. At the same time, for households with an electricity consumption of 2016 kWh/year, 5 kW solar power plants and wind power plants with a capacity of up to 10 kW are not paid off during their lifecycle. The payback period is unattractive for 10 kW solar and 20 kW wind power plants. When attracting a debt capital at 50% or more, the projects are not paid off. Given the above, it is reasonable to gradate the FIT rates in accordance with the RE power plants’ installed capacity. This will allow households with different revenue levels to have equal opportunities to invest in RE power plants.
The primary purpose of deciding to invest in micro RE projects is to ensure household energy autonomy, since the excess electricity for 5–10 kW RE power plants, i.e., that not consumed for the households’ needs, is insignificant. Therefore, supporting such projects should become a priority task of household energy policy. In the meantime, the payback periods of 20-, 30-, 40-, and 50-kW solar power plants and wind power plants with a capacity of 30 kW remain pretty attractive. Implementing solar power plant projects with 40–50 kW capacity is the most profitable. In our opinion, the decision to cancel the FIT for such generating facilities was not logical, because they can significantly contribute to achieving the indicative goals for increasing the green electricity share in the country’s energy consumption. However, the FIT rates for such generating capacities must be significantly adjusted in order to avoid excess profits by their owners and an increase in the financial burden on the final consumers, at the expense of which payments are made under the FIT. At the same time, for identical reasons, the FIT rates for 20- and 30-kW solar power plants also need some adjustment.
In addition, the obtained results have demonstrated the existing imbalance in the payback periods of solar and wind power plants. The difference between their payback periods is quite significant, which will likely continue to contribute to the predominance of solar power plants in households. Therefore, the adjustment of state support should be based on the priority of particular RE technology development, considering the evaluation of the economic, ecological, and social gains from its implementation. The development of hybrid solar–wind power plants is optimal, which will allow the attraction of both energy resources to electricity production. Therefore, the economic justification of the FIT for such plants is highly relevant.
As for acceptable payback periods for RE investment projects in the residential sector, world experience shows that they are usually, at most, 10 years. For example, for solar power plants in the US, the indicators fluctuate within 10–12 years [68] and 16–22 years in the United Kingdom [69]. In the meantime, the average payback period of small wind power plants in the US is 15 years [70], and, in Poland, when they are located in areas with the best wind speed, it is 13 years [71]. In our opinion, Ukraine should be guided by world experience, ensuring, by economic incentives, a payback period of RE plants of different installed capacities of 10–13 years. This approach to investment policy is logical in terms of the gradual reorientation of state policy towards the energy autonomy of households and the reduction in financial pressure on the final electricity consumers amid the dynamically increasing green electricity share in the country’s energy mix.
Thus, it can be concluded that effective RE development in households requires improving the methodology for the FIT calculation. We believe that the optimal FIT rates should ensure a payback period of investment projects of 10–13 years. With a lifecycle of RE power plants of 25 years, such a payback period will allow households to receive profits from the sale of the excess electricity for a reasonably long period after reaching the break-even point. On the one hand, it will allow to maintaine the investment attractiveness of the sector, and on the other hand, it will reduce the financial pressure on the final electricity consumers.

5.2. Methodical Approaches to Determine the Optimal FIT Rates and Policy Recommendations for Effective RE Development in Ukraine’s Households

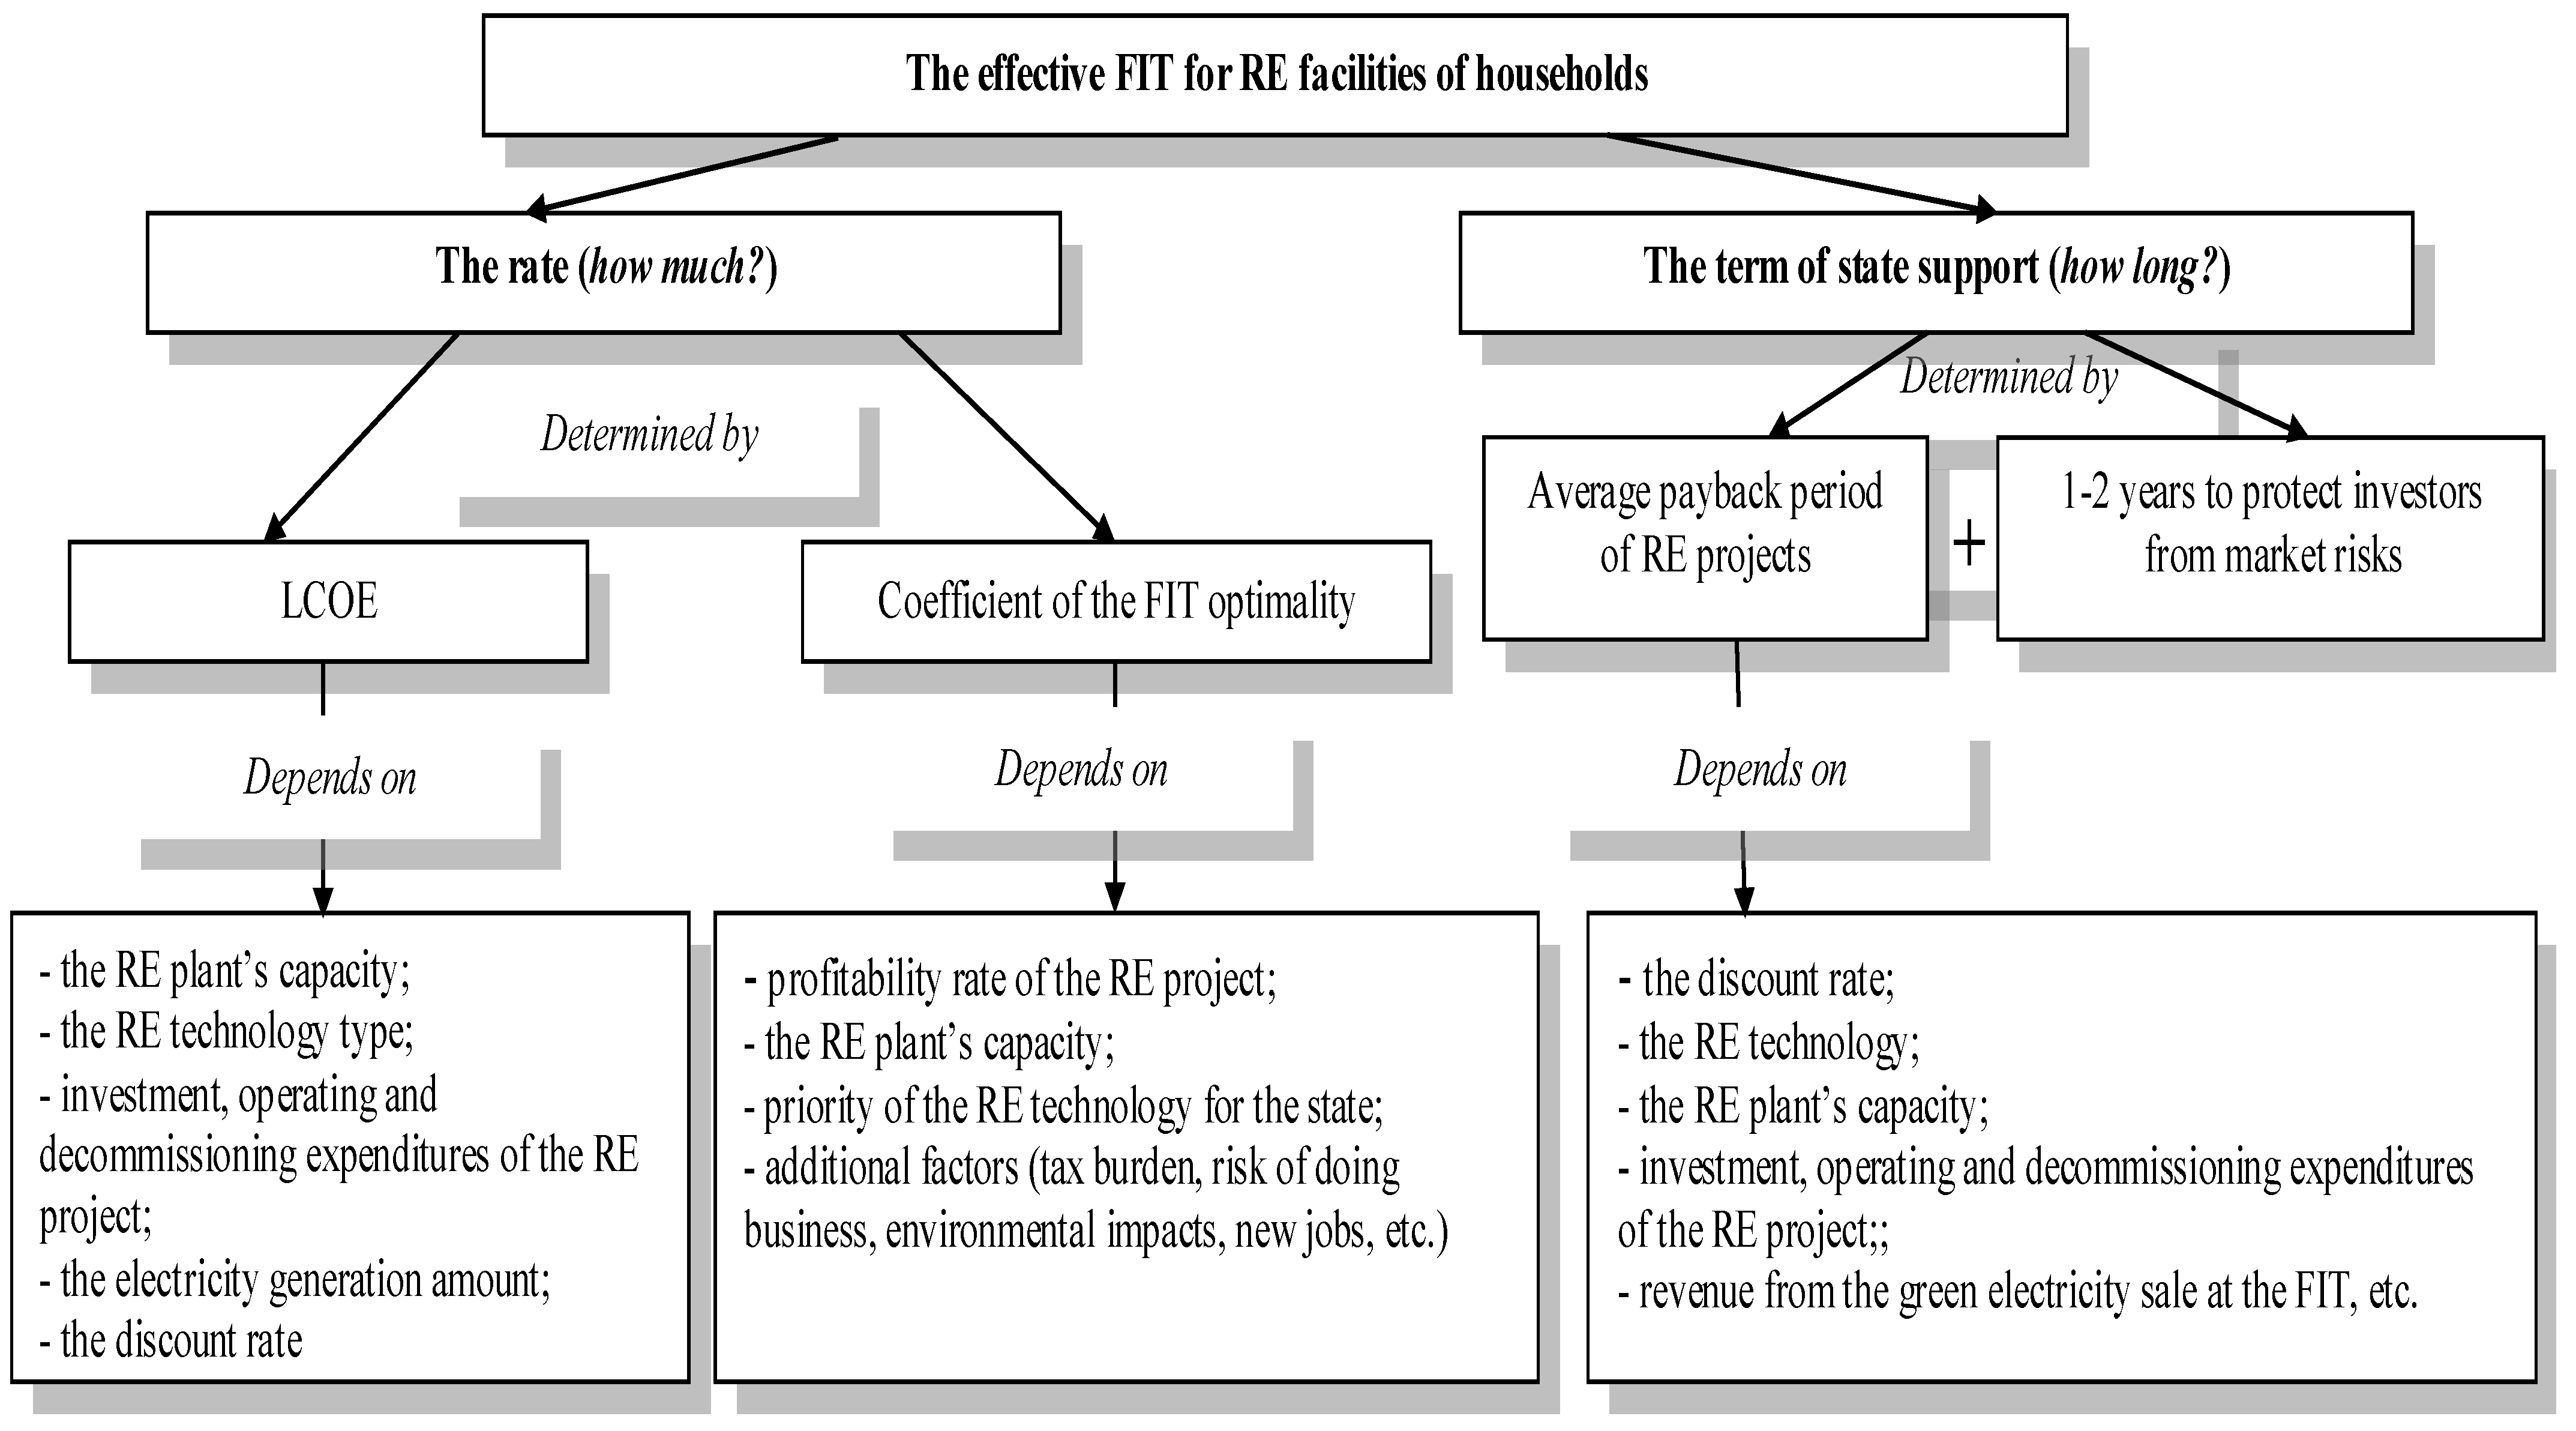
To improve the methodology of the FIT calculation, we suggest using modernized methodical approaches to determine the optimal FIT rates outlined in [72] and adjusted to the specifics of the residential sector. Thus, it is advisable to calculate the optimal rate of the FIT for the i-th RE technology in the t-th year (FITopt_it) for the household sector by the following formula:
F I T o p t _ i t = L C O E i t × k o p t _ i t ,
where L C O E i t is the fixed electricity production cost throughout the power plant lifecycle, which uses the i-th RE technology commissioned in the t-th year, UAH/kWh (calculated according to Formula (1)), and k o p t _ i t is the coefficient of optimality of the FIT for the household sector for the i-th RE technology in the t-th year, which is determined according to the following formula:
k o p t _ i t = j = 1 n ( 1 + k i t j ) ,
where k i t is a coefficient that considers the impact of the j-th factor, which determines the economic, social, and environmental effects of the i-th RE technology development in the t-th year for the households, and n is the number of factors considered.
It is reasonable to include the profitability of the RE power plant, its capacity, and the priority of the i-th RE technology development for the state as part of the main influencing factors. The range of recommended values for k i t j , from the main influencing factors, is presented in Table 7. The higher the k i t j , the greater the influence of the particular factor on the FIT rate.
In addition to the abovementioned main factors, other factors may be considered, due to which the state can adjust the final FIT rates for various RE technologies, encouraging or restraining the development of some of them. Such factors may include economic and financial (tax burden and the risk of doing business for the i-th RE technology), environmental (environmental effect of the i-th RE technology), social (creation of new jobs), etc.
The advantage of the proposed approach is flexibility in adjusting the FITs for different RE technologies depending on the needs and goals of the state policy. The FITs, calculated according to the proposed methodological approach, must be reviewed periodically, at least once every three years, due to the trends in reducing the cost of RE technologies. Additionally, as in the case of the current methodology, the FITs must be converted into EUR to insure the RE plants’ owners against possible inflation.
Along with determining the reasonable FIT rates in the household sector, the issue of the validity period of such a state support scheme is significant. It should be sufficient to ensure the return on the investment, but minimal to avoid overspending the state budget or/and that of the final electricity consumers. We believe such a validity period should be established according to the formula “average payback period of projects + 1–2 years” according to the particular RE technology and the group of installed capacity. Adherence to the average payback periods will allow us to return the main part of the funds to the RE power plants’ owners, and an additional 1–2 years will protect the investors from market risks and guarantee confidence in the profitability of the started projects. It is worth noting that the updated methodology for the FIT calculation should only be used for new RE energy power projects in order to maintain the confidence of the existing RE power plants owners.
It is worth noting that, for a more effective implementation of the FIT policy for RE development in the residential sector, improving other policy measures, particularly financial and credit mechanisms, is advisable. As evidenced by the calculation results given in Section 5.1, the credit resources cost, which is reflected in the discount rate, significantly impacts the projects’ payback periods. Despite the availability of credit programs for financing RE projects in Ukraine’s households, the interest rates on loans are not affordable, especially in the absence of the ability of the households’ owners to pay a significant part of the down payment. Given this, the government should pay attention to improving the existing and developing new affordable loan programs, in particular, the formation of syndicated lending lines that will allow the accumulation of finance of banks of Ukraine and the European Bank for Reconstruction and Development, whose credit lines are already are open in Ukraine for RE projects in the industrial sector, but currently do not extend to the residential sector [73].
Another approach that can ensure the accumulation of the necessary funds to implement RE projects is the formation of energy cooperatives. It should be noted that Ukraine has already created legislation for energy cooperative formation, and, since 2019, the FIT has been introduced for the RE power plants implemented under such energy associations [74]. However, implementing RE projects within the framework of such cooperation has not gained significant popularity. The main barrier is the population’s lack of awareness of this issue. Therefore, the government should focus on the popularization of the advantages of creating energy cooperatives and informing about the economic, ecological, and social gains from implementing RE projects.
The cost of technologies directly affects the payback period of RE investment projects and, therefore, the FITs rate. One of the approaches to make them cheaper is state support for Ukrainian enterprises, which can produce equipment for the RE industry. It should be noted that two powerful factories in Ukraine have provided a full cycle of solar PV systems production—from growing the silicon to assembling the solar panels. However, the introduction in 2019 of benefits for the import of foreign-made solar panels negatively impacted their competitiveness. As a result of the introduction of such benefits, the prices of the imported panels became 20% lower than the domestic ones. As a result, enterprises were forced to reorient their activities mainly to the assembly of panels in Ukraine from imported equipment [75]. A stimulus for the development of the industry could be the spread of the legislative norm regarding the allowance to the FIT for the use of Ukrainian-made equipment for RE project implementation, which currently applies to industrial RE power plants but does not apply to RE facilities in the residential sector [12].
It should be noted that promoting RE development based on the FIT calculated according to the proposed methodology should be used in the transition period—from the current FIT model to a new support scheme for households to ensure further RE development without state support. Such mechanisms can be net metering or net billing, which are focused on covering exclusively a household’s own electricity consumption and do not require additional financial expenses from the state or from other consumers.
Net metering is a mechanism that allows the owners of RE power plants to store the excess electricity in the country’s energy grid and use it when the need arises. Net billing is a variation of net metering that works on a similar principle. The difference is that the excess electricity supplied to the grid, instead of kWh, is counted in monetary equivalents, according to the electricity price at the time of the supply. Thus, under net billing, the consumers receive a cash deposit for the excess electricity supplied into the grid, which can then be used to pay for the electricity consumed by them in subsequent periods, provided that the need for electricity exceeds the amount of its production.
A significant barrier to the effective implementation of the mentioned mechanisms can be the continuation of subsidizing electricity prices for Ukrainian households. This is because low electricity tariffs do not encourage household owners to invest in RE projects and negatively affect the profitability of their implementation under net metering/net billing support schemes. It is worth noting that, although, since June 2022, the electricity tariff for households in Ukraine has been increased to UAH 2.64/kWh (EUR 0.065/kWh), it remains extremely low compared to the tariffs in other European countries (for example, as of the beginning of 2023, in Greece it was EUR 0.18/kWh, in Italy—EUR 0.17/kWh, and in Switzerland—EUR 0.15/kWh [76]). Adopting decisions regarding the metering/net billing introduction should be preceded by creating favorable organizational and economic conditions under which these mechanisms will allow households to transit to prosumerism without state incentives.

6. Conclusions

RE development is one of the key priorities of government energy policy, therefore, the issue of its promotion, including that in the household sector, is given considerable attention at the national level. To foster electricity production from RES in the household sector, the fixed FIT was introduced, the high rates of which promoted the rapid deployment of RE facilities. However, in addition to the significant contribution of households to increasing the green energy share, several shortcomings of this approach to the promotion can be stated today. The foremost of these was the pursuit of additional profits from selling the excess electricity at the FIT and, as a result, a rapid increase in the financial pressure on the final consumers, by which payments under this tariff are compensated.
Thus, the current model of the FIT for households mainly encourages them to maximize the supply of electricity from the RES to the grid for profit, and the primary goal of the state policy—ensuring household energy autonomy—has become of secondary importance. Understanding this led to the decision of the state authorities to revise the FIT rates downwards. However, their economic validity today requires additional study, which formed the basis of this study.
The obtained results have proven that the current FIT rates must be adjusted, as they cannot ensure effective RE development in the residential sector. While the FIT does not ensure payback for 5- or 10-kW solar power plants and wind power plants with a capacity of up to 10 kW, it remains pretty attractive for 20-, 30-, 40-, and 50-kW solar power plants and 30-kW wind power plants. Given that 5–10 kW power plants best satisfy the energy needs of households, the current FITs continue to stimulate the achievement of their owners’ profits from selling the excess electricity to the grid.
To resolve this issue, this paper proposes a methodical approach to improve the FIT calculation based on assessing the LCOE and influencing factors that determine the economic, social, and environmental effects of the specific RE technology. The main influencing factors include the profitability of the RE power plant, its capacity, and the priority of the particular RE technology development for the state. If necessary, the main factors can be supplemented with additional ones (level of tax burden, environmental effect, etc.) depending on the state policy goals.
Other essential directions toward the improvement of state incentives for RE development in households in the short term should be measures aimed at improving the access to attracting and reducing investment expenditures for RE project implementation, particularly for developing affordable loan programs, stimulating the creation of energy cooperatives, and the domestic production of equipment for the RE sector. The economic justification of the FIT rates for hybrid wind–solar power plants also needs special attention in order to maximize the involvement of both types of RES in electricity production. In the medium-term perspective, the key changes in the energy policy should be related to the creation of favorable conditions for the transition to the net metering/net billing support scheme and the development of conceptual foundations for its effective functioning in Ukraine.

Author Contributions

Conceptualization, T.K. and I.S.; methodology, T.K. and I.S.; validation, T.K., I.S., O.P., I.B. and U.P.; formal analysis, T.K. and I.S.; investigation, T.K. and I.S.; resources, O.P., I.B. and U.P.; data curation, T.K., I.S. and O.P.; original draft preparation, T.K., I.S. and O.P.; review and editing, T.K. and I.S.; visualization, T.K., I.S., O.P., I.B. and U.P.; funding acquisition, T.K., I.S. and U.P. All authors have read and agreed to the published version of the manuscript.

Funding

This publication was prepared under the research project “Formation of economic mechanisms to increase energy efficiency and provide sustainable development of renewable energy in Ukraine’s households” (No. 0122U001233), funded by the National Research Foundation of Ukraine.

Conflicts of Interest

The authors declare no conflict of interest. The funders had no role in the study’s design, in the collection, analyses, data interpretation, the writing of the manuscript, or the decision to publish the results.

References

  1. Gencer, B.; Ackere, A. Achieving long-term renewable energy goals: Do intermediate targets matter? Util. Policy 2021, 71, 101243. [Google Scholar] [CrossRef]
  2. Mišík, M. When the Accession Legacy Fades Away: Central and Eastern European Countries and the EU Renewables Targets. Int. Spect. 2021, 56, 56–70. [Google Scholar] [CrossRef]
  3. Strunz, S.; Lehmann, P.; Gawel, E. Analysing the ambitions of renewable energy policy in the EU and its Member States. Energy Policy 2021, 156, 12447. [Google Scholar] [CrossRef]
  4. Couture, T.; Gagnon, Y. An analysis of feed-in tariff remuneration models: Implications for renewable energy investment. Energy Policy 2010, 38, 955–965. [Google Scholar] [CrossRef]
  5. Ramli, M.; Twaha, S. Analysis of renewable energy feed-in tariffs in selected regions of the globe: Lessons for Saudi Arabia. Renew. Sustain. Energy Rev. 2015, 45, 649–661. [Google Scholar] [CrossRef]
  6. Galvin, R. Why German households will not cover their roofs in photovoltaic panels: And whether policy interventions, rebound effects and heat pumps might change their minds. Renew. Energy Focus 2022, 42, 236–252. [Google Scholar] [CrossRef]
  7. Castaneda, M.; Zapata, S.; Cherni, J.; Aristizabal, A.; Dyner, I. The long-term effects of cautious feed-in tariff reductions on photovoltaic generation in the UK residential sector. Renew. Energy 2020, 155, 1432–1443. [Google Scholar] [CrossRef]
  8. Zhang, Y.; Song, I.; Hamori, S. Impact of subsidy policies on diffusion of photovoltaic power generation. Energy Policy 2011, 39, 1958–1964. [Google Scholar] [CrossRef]
  9. Lan, H.; Cheng, B.; Gou, Z.; Yu, R. An evaluation of feed-in tariffs for promoting household solar energy adoption in Southeast Queensland, Australia. Sustain. Cities Soc. 2020, 53, 101942. [Google Scholar] [CrossRef]
  10. Li, H.; Zhang, Y.; Li, Y.; Huang, J.; Costin, G.; Zhang, P. Exploring payback-year based feed-in tariff mechanisms in Australia. Energy Policy 2021, 50, 112133. [Google Scholar] [CrossRef]
  11. Dio, V.; Favuzza, S.; La Cascia, D.; Massaro, F.; Zizzo, G. Critical assessment of support for the evolution of photovoltaics and feed-in tariff(s) in Italy. Sustain. Energy Technol. Assess. 2015, 9, 95–104. [Google Scholar] [CrossRef]
  12. Verkhovna Rada of Ukraine. Law of Ukraine “On the Electricity Market”. 2017. Available online: https://zakon.rada.gov.ua/laws/show/2019-19#Text (accessed on 8 June 2023).
  13. Verkhovna Rada of Ukraine. Law of Ukraine “On Alternative Energy Sources”. 2003. Available online: https://zakon.rada.gov.ua/laws/show/555-15#Text (accessed on 8 June 2023).
  14. NCSREPU. All-Ukrainian Information and Statistical Information of European Institutions in the Electricity Field. 2021. Available online: http://surl.li/jwghe (accessed on 18 June 2023).
  15. Epravda. How to Provide 25% of Energy from RES without Support from the Budget. 2022. Available online: http://surl.li/jwghq (accessed on 18 June 2023).
  16. Sun-Energy. 20 kW Medium Solar Power Plant 2023. Available online: http://surl.li/bfnsn (accessed on 15 June 2023).
  17. Eco-Tech. Solar Power Plant of 30 kW for the Home under the Feed-In Tariff. 2023. Available online: http://surl.li/-jwgho (accessed on 15 June 2023).
  18. Sala, D.; Bashynska, I.; Pavlova, O.; Pavlov, K.; Chorna, N.; Romanyuk, R. Investment and Innovation Activity of Renewable Energy Sources in the Electric Power Industry in the South-Eastern Region of Ukraine. Energies 2023, 16, 2363. [Google Scholar] [CrossRef]
  19. Prokopenko, O.; Kurbatova, T.; Zerkal, A.; Khalilova, M.; Prause, G.; Binda, J.; Berdiyorov, T.; Klapkiv, Y.; Sanetra-Półgrabi, S.; Komarnitskyi, I. Impact of investments and R&D costs in renewable energy technologies on companies’ profitability indicators: Assessment and forecast. Energies 2023, 16, 1021. [Google Scholar] [CrossRef]
  20. Kwilinski, A.; Lyulyov, O.; Pimonenko, T. Greenfield Investment as a Catalyst of Green Economic Growth. Energies 2023, 16, 2372. [Google Scholar] [CrossRef]
  21. Prokopenko, O.; Toktosunova, C.; Sharsheeva, N.; Zablotska, R.; Mazurenko, V.; Halaz, L. Prospects for the Reorientation of Investment Flows for Sustainable Development under the Influence of the COVID-19 Pandemic. Probl. Ekorozwoju 2021, 16, 7–17. [Google Scholar] [CrossRef]
  22. Sotnyk, I.; Kurbatova, T.; Romaniyk, Y.; Prokopenko, O.; Gonchar, V.; Sayenko, Y.; Prause, G.; Sapiński, A. Determining the optimal directions of investment in regional renewable energy development. Energies 2022, 15, 3646. [Google Scholar] [CrossRef]
  23. Chygryn, O.; Shevchenko, K. Energy industry development: Key trends and the core determinants. Socioecon. Chall. 2023, 7, 115–128. [Google Scholar] [CrossRef]
  24. Kwilinski, A.; Lyulyov, O.; Pimonenko, T. Inclusive Economic Growth: Relationship between Energy and Governance Efficiency. Energies 2023, 16, 2511. [Google Scholar] [CrossRef]
  25. Prokopenko, O.; Cebula, J.; Chayen, S.; Pimonenko, T. Wind energy in Israel, Poland and Ukraine: Features and opportunities. Int. J. Ecol. Dev. 2017, 32, 98–107. [Google Scholar]
  26. Ksonzhyk, I.; Lavrushchenko, Y.; Oleksiuk, M.; Saienko, V.; Buryk, Z. Influence of renewable green energy on the economic development of the EU states. Environ. Ecol. Res. 2021, 9, 271–281. [Google Scholar] [CrossRef]
  27. Tymoshenko, M.; Saienko, V.; Serbov, M.; Shashyna, M.; Slavkova, O. The impact of industry 4.0 on modelling energy scenarios of the developing economies. Financ. Credit. Act.-Probl. Theory Pract. 2023, 1, 336–350. [Google Scholar] [CrossRef]
  28. Kurbatova, T.; Lysenko, D.; Trypolska, G.; Prokopenko, O.; Järvis, M.; Skibina, T. Solar energy for green university: Estimation of economic, environmental and image benefits. Int. J. Glob. Environ. Issues 2022, 21, 198–216. [Google Scholar] [CrossRef]
  29. Raikar, S.; Adamson, S. Public policy mechanisms to support renewable energy. Renew. Energy Financ. 2020, 9–19. [Google Scholar] [CrossRef]
  30. Barnea, G.; Hagemann, C.; Wurster, S. Policy instruments matter: Support schemes for renewable energy capacity in worldwide comparison. Energy Policy 2022, 168, 113093. [Google Scholar] [CrossRef]
  31. Jacksohn, A.; Grösche, P.; Rehdanz, K.; Schröder, C. Drivers of renewable technology adoption in the household sector. Energy Econ. 2019, 81, 216–226. [Google Scholar] [CrossRef]
  32. Guta, D. Determinants of household use of energy-efficient and renewable energy technologies in rural Ethiopia. Technol. Soc. 2020, 61, 101249. [Google Scholar] [CrossRef]
  33. Ang’u, C.; Muthama, N.; Mutuku, M.; M’IKiugu, M. Determinants of the sustained use of household clean fuels and technologies: Lessons from Vihiga county, Kenya. Energy Rep. 2023, 9, 1990–2001. [Google Scholar] [CrossRef]
  34. Etongo, D.; Naidu, H. Determinants of household adoption of solar energy technology in Seychelles in a context of 100% access to electricity. Discov. Sustain. 2022, 3, 38. [Google Scholar] [CrossRef]
  35. Štreimikienė, D.; Baležentis, A. Assessment of willingness to pay for renewables in Lithuanian households. Clean Technol. Environ. Policy 2015, 17, 515–531. [Google Scholar] [CrossRef]
  36. Braito, M.; Flint, C.; Muhar, A.; Penker, M.; Vogel, S. Individual and collective socio-psychological patterns of photovoltaic investment under diverging policy regimes of Austria and Italy. Energy Policy 2017, 109, 141–153. [Google Scholar] [CrossRef]
  37. Nyborg, K.; Rege, M. Does Public Policy Crowd Out Private Contributions to Public Goods. Public Choice 2003, 115, 397–418. [Google Scholar] [CrossRef]
  38. Thøgersen, J. Monetary incentives and recycling: Behavioural and psychological reactions to a performance-dependent garbage fee. J. Consum. Policy 2003, 26, 197–228. [Google Scholar] [CrossRef]
  39. Verkhovna Rada of Ukraine. Tax Code of Ukraine. 2010. Available online: https://zakon.rada.gov.ua/-laws/show/2755-17#Text (accessed on 22 June 2023).
  40. Verkhovna Rada of Ukraine. Customs Code of Ukraine 2012. Available online: https://zakon.rada.gov.ua/-laws/show/4495-17#Text (accessed on 22 June 2023).
  41. Oschadbank. Credit Program “Green energy”. 2023. Available online: https://www.oschadbank.ua/credit/green-energy (accessed on 25 June 2023).
  42. Ukrgasbank. Credit Program “Eco Energy”. 2023. Available online: http://www.ukrgasbank.com/private/-credits/eco_energy/ (accessed on 25 June 2023).
  43. SAEE. Information Letter No. 16-01/17/31-22 about the Main Indicators of Renewable Energy Development in 2015–2021; SAEE: Kyiv, Ukraine, 2022; 3p. [Google Scholar]
  44. SAEE. Information Letter No. 33-02/17/31 about the Main Indicators of Renewable Energy Development 2018–2022; SAEE: Kyiv, Ukraine, 2023; 3p. [Google Scholar]
  45. Ukrainian Energy. Ukrainian Small Wind Farms—Autonomous Saviors or Suitcases without a Handle? 2021. Available online: http://surl.li/adgrs (accessed on 25 June 2023).
  46. Breeze, P. Chapter 9—The Cost of Electricity; Elsevier: Amsterdam, The Netherlands, 2021; pp. 117–136. [Google Scholar] [CrossRef]
  47. Finswin. What Is WACC and How Is It Calculated? 2021. Available online: https://finswin.com/projects/ekonomika/-wacc.html (accessed on 3 July 2023).
  48. NCSREPU. Resolution No. 1817 Dated 30.08.2019 On Approval of the Procedure for Establishing, Revising and Terminating the Feed-in Tariff for Electricity for Economic Entities, Electricity Consumers, Including Energy Cooperatives, and Households Whose Generating Plants Produce Electricity from Alternative Energy Sources. 2019. Available online: https://zakon.rada.gov.ua/laws/show/v1817874-19#Text (accessed on 3 July 2023).
  49. Sotnyk, I.; Kurbatova, T.; Blumberga, A.; Kubatko, O.; Prokopenko, O. Solar business prosumers in Ukraine: Should we wait for them to appear? Energy Policy 2023, 178, 113585. [Google Scholar] [CrossRef]
  50. Project-Management. Discounted Payback Period: Definition, Formula, Example & Calculator. 2021. Available online: http://surl.li/afigj (accessed on 3 July 2023).
  51. IEA. Average Annual Capacity Factors by Technology. 2018. Available online: http://surl.li/jwgjm (accessed on 6 July 2023).
  52. Sun-Energy. Solar Power Plant Electricity Production Calculator. 2023. Available online: https://sunenergy.com.ua/-sun-calculator (accessed on 6 July 2023).
  53. Generacia. Calculation of Solar Generation for Power Plants. 2023. Available online: https://generacia.energy/-kalkuljator/ (accessed on 6 July 2023).
  54. Sun-Energy. Sets of Solar Power Plants. 2023. Available online: https://sun-energy.com.ua/solar-power/solar-power-plants/ (accessed on 6 July 2023).
  55. Solar-Tech. Solar Power Plant 50 kW for Own Consumption. 2023. Available online: http://surl.li/iknsi (accessed on 9 July 2023).
  56. Energosave. Solar Power Plants. 2023. Available online: http://surl.li/iknsk (accessed on 9 July 2023).
  57. Raiffeisen. Wind in Favor. 2023. Available online: http://surl.li/aybtf (accessed on 9 July 2023).
  58. Avante. Wind Generator W10 20000 Bt. 2023. Available online: http://surl.li/iknue (accessed on 9 July 2023).
  59. Kworum. Classic Wind Farms. 2023. Available online: https://kworum.com.ua/c/vitriaki-klasychni (accessed on 9 July 2023).
  60. Jordan, D.; Kurtz, S. Photovoltaic Degradation Rates—An Analytical Review. NREL/JA-5200-51664. 2022. Available online: http://www.osti.gov/bridge (accessed on 14 July 2023).
  61. Staffell, I.; Green, R. How does wind farm performance decline with age? Renew. Energy 2014, 66, 775–786. [Google Scholar] [CrossRef]
  62. IEA. Projected Costs of Generating Electricity. 2010. Available online: http://surl.li/jwori (accessed on 14 July 2023).
  63. Fischer, J. Comparing Wind and Solar Energy Impacts on the Environment: A LCA Approach Using openLCA Platform. 2021. Available online: http://surl.li/idyrf (accessed on 14 July 2023).
  64. Minfin. Stability Rating of Banks as of the 1st Quarter of 2023. 2023. Available online: https://minfin.com.ua/ua/banks/rating/ (accessed on 17 July 2023).
  65. Feensee. Deposits 2023: Calculator, Reliable Banks, Detailed Conditions. 2023. Available online: http://surl.li/uorg (accessed on 14 July 2023).
  66. Minfin. The Official Average Exchange Rate of UAH to the EUR for May 2023. 2023. Available online: https://index.minfin.com.ua/exchange/nbu/curr/eur/ (accessed on 14 July 2023).
  67. CMU. Resolution No. 544 Dated 30 May 2023, On Amendments to the Resolution of the Cabinet of Ministers of Ukraine Dated 5 June 2019. 2023. Available online: https://zakon.rada.gov.ua/laws/show/544-2023-%D0%BF#Text (accessed on 21 July 2023).
  68. Solar Reviews. How Long Does It Take for Solar Panels to Pay for Themselves? Average Solar Panel Payback Period for Homes in the US in 2022. 2022. Available online: http://surl.li/bfjec (accessed on 21 July 2023).
  69. Greenmatch. Are Solar Panels Worth It in the UK in 2023? 2023. Available online: http://surl.li/bfntu (accessed on 21 July 2023).
  70. Attainablehome. Small Wind Turbines: What Is the Average Payback Period? 2022. Available online: http://surl.li/jwgji (accessed on 22 July 2023).
  71. Zalewska, J.; Damaziak, K.; Malachowski, J. An Energy Efficiency Estimation Procedure for Small Wind Turbines at Chosen Locations in Poland. Energies 2021, 14, 3706. [Google Scholar] [CrossRef]
  72. Sotnyk, I.; Kurbatova, T.; Kubatko, O.; Baranchenko, Y.; Li, R. The price for sustainable development of renewable energy sector: The case of Ukraine. E3S Web Conf. 2021, 280, 02006. [Google Scholar] [CrossRef]
  73. Kropelnytska, S.; Mayorova, T. The financing of renewable energy development projects in Ukraine. Polityka Energetyczna—Energy Policy J. 2021, 24, 77–88. [Google Scholar] [CrossRef]
  74. Verkhovna Rada of Ukraine. Law of Ukraine “On Amendments to Some Laws of Ukraine Regarding Ensuring Competitive Conditions for Producing Electricity from Alternative Energy Sources”. 2019. Available online: https://zakon.rada.gov.ua/laws/show/2712-19#Text (accessed on 5 September 2023).
  75. Energy Transition. Genealogy of Ukrainian Solar Panels: Where the Equipment Comes From. 2020. Available online: http://surl.li/kyokx (accessed on 5 September 2023).
  76. Slovoidilo. How Much Will EU Residents Pay for Electricity in 2023: Comparison of Tariffs with Ukrainian Ones. 2023. Available online: http://surl.li/jwgjf (accessed on 22 July 2023).
Figure 1. The research algorithm.
Energies 16 06773 g001
Figure 2. A conceptual map of forming an effective FIT for households.
Energies 16 06773 g002
Table 1. The dynamics of RE plants development in the household sector of Ukraine in 2015–2021 [43,44].
RE Power Plants in the Household Sector2015201620172018201920202021
Number of RE power plants, units
Solar power plants24411093010745021,96829,93144,888
Wind power plants0033444
The installed capacity of RE power plants, MW
Solar power plants217511575537791205
Wind power plants000.0290.0290.0270.0410.057
Amount of electricity produced, million kWh
Solar power plants0.4423923037561151
Wind power plants002.52.50.20.61.9
Table 2. The dataset of investment projects of household solar and wind power plants [52,53,54,55,56,57,58,59].
Installed Capacity, kW
51020304050
Solar power plants
Electricity production, kWh/year494710,52021,83633,15346,20657,791
Investment expenditures, UAH146,229260,802517,347763,448990,4781,138,253
Operating expenditures, UAH/year1462260851737634990511,383
Decommissioning expenditures, UAH731113,04025,86738,17249,52356,913
Wind power plants
Electricity production, kWh/year15,00030,00060,00090,000--
Investment expenditures, UAH380,948654,2391,117,2801,571,370--
Operating expenditures, UAH/year3809654211,17315,714--
Decommissioning expenditures, UAH19,04732,71255,86478,569--
Table 3. LCOE for RE power plants of households (calculated by authors).
LCOE, UAH/kWh
The Installed Capacity of RE Power Plants, kW51020304050
Solar power plants
Discount rate, %144.283.593.433.333.102.85
15.24.523.793.623.523.283.01
16.84.844.063.883.773.513.23
19.25.324.464.274.153.863.55
Wind power plants
Discount rate, %143.553.042.602.44--
15.23.753.222.752.58--
16.84.033.462.962.77--
19.24.443.813.263.05--
Table 4. The FIT coefficients for RE power plants of households commissioned from 2019 to 2029 [12].
RE Power Plants of Households for which the FIT is AppliedThe FIT Coefficients for Electricity Produced by RE Power Plants of Households, Commissioned
From 01.01.2019 to 31.12.2019From 01.01.2020 to 31.12.2024From 01.01.2025 to 31.12.2029
Solar power plants with installed capacity ≤30 kW3.363.022.69
Solar power plants with installed ≤50 kW, provided they are placed on the roofs and/or buildings’ facades3.36̶-
Wind power plants with installed capacity ≤30 kW2.161.941.73
Table 5. The FIT rates for electricity produced by RE power plants of households commissioned in 2023 (calculated by the authors).
RE Power Plants of HouseholdsThe FIT,
UAH/kWh
Solar power plants with installed capacity ≤30 kW6.48
Solar power plants with installed capacity ≤ 50 kW, provided they are placed on the roofs and/or buildings’ facades6.48
Wind power plants with installed capacity ≤30 kW4.16
Table 6. Payback periods of RE investment projects, years (calculated by the authors).
Payback Periods of RE Investment Projects, Years
The Installed Capacity, kWh51020304050
Solar power plants
Discount rate, %14>2513.738.536.986.095.30
15.2>2517.949.737.806.325.45
16.8>25>2512.219.296.665.68
19.2>25>25>25 years13.347.596.02
Wind power plants
Discount rate, %14>25>2513.0010.19--
15.2>25>2515.5511.43--
16.8>25>25>2514.06--
19.2>25>25>25>25--
Table 7. Ranges of recommended   k i t j values for RE power plants depending on the main influencing factors (developed by the authors).
Influence Factor jRecommended Range of k i t j Values by Factor j
Profitability of the RE power plant0.05–0.25
The capacity of the RE power plant (higher values for smaller capacities)0–0.5
Priority of the i-th RE technology deployment for the state0–0.3
Disclaimer/Publisher’s Note: The statements, opinions and data contained in all publications are solely those of the individual author(s) and contributor(s) and not of MDPI and/or the editor(s). MDPI and/or the editor(s) disclaim responsibility for any injury to people or property resulting from any ideas, methods, instructions or products referred to in the content.

