Article

Intrinsic Photoconductivity Spectral Dependence as a Tool for Prediction of Open-Circuit Voltage in Organic Solar Cells

Institute of Solid State Physics, University of Latvia, 8 Kengaraga Street, LV-1063 Riga, Latvia
*
Author to whom correspondence should be addressed.
Energies 2023, 16(18), 6728; https://doi.org/10.3390/en16186728
Submission received: 9 August 2023 / Revised: 15 September 2023 / Accepted: 18 September 2023 / Published: 20 September 2023
(This article belongs to the Special Issue Advances on Solar Energy Materials and Solar Cells)

Abstract

:
Organic materials are known for their variety of molecules. Methods to predict the parameters of organic photovoltaic (OPV) cells are required to avoid the time- and resource-consuming processes of manufacturing and testing OPVs. Usually, the open-circuit voltage (Uoc) is estimated as the difference between the ionization energy level of the electron donor molecule (Id) and the electron affinity level of the electron acceptor molecule (EAa). Various measurement methods are used to determine the energy level values of pure materials, which, when combined with energy level shifts due to the donor:acceptor interactions, make these estimations less precise. In this work, photoconductivity measurements were applied to the donor:acceptor films. Near threshold energy, the electron can be directly transferred from the donor to the acceptor molecule. The obtained charge transfer energy (ECT) shows the difference between Id and EAa in the film. This difference was compared to the Uoc value of an OPV made of the same donor:acceptor combination. We show that this approach provides less scattered results and a higher correlation coefficient compared to the Uoc estimation using energy level values.

1. Introduction

Environmental concerns and the rapidly increasing demand for green energy are the main driving forces advancing the development of solar cells. One of the areas being actively developed is organic photovoltaic (OPV) cells, which recently reached an efficiency of 19% [1,2]. Organic materials offer such advantages as low material costs, the possibility to create large area cells by printing or using roll-to-roll technologies [3,4,5], and applications such as building-integrated photovoltaics (BIPV), due to their semi-transparency [6]. Organic materials are known for their immense variety, because the molecules can be easily modified by varying the functional groups that affect their properties. As the creation of solar cells is a time- and resource-consuming process, methods to easily and reliably predict the parameters of OPVs are required.
The most important parameters that describe OPVs are the short-circuit current (Isc), open-circuit voltage (Uoc), fill factor (FF), and power conversion efficiency (PCE). Isc shows the maximum current obtainable from OPV cells. It is mostly determined by two factors: charge-carrier generation in the active layer, and charge-carrier extraction from the solar cell. Parameters such as absorption coefficient and spectrum, charge-carrier mobility, and compatibility between various layers influence Isc. Uoc is mainly determined by the materials in the active layer and their energy level values (ionization energy (I) and electron affinity (EA)) [7,8,9,10]. External conditions such as light intensity [11] and temperature [10,12] can also have a limited influence on the open-circuit voltage of OPV cells. PCE shows the portion of light energy that has been converted into electrical power, while FF is the “ideality factor” of OPV.
Currently, to predict the Uoc, an empirical equation is used:
U o c = 1 e I d E A a .
where e is the elementary charge, Id is the ionization energy level value of the electron donor material, EAa is the electron affinity energy level of the electron acceptor material, and ∆ is an empirical coefficient between 0.3 and 0.5 [13,14]. While Equation (1) is simple and could potentially allow the most promising donor:acceptor material pairs to be predicted, there are some disadvantages to this method. First, ∆ is an empirical coefficient whose value can vary depending on the material class or the amount of “tail states” introduced in the active layer due to the energetic disorder [14]. Second, the correct determination of the energy level values of the materials becomes crucial. Ultraviolet photoemission spectroscopy (UPS) is the most popular method for ionization energy level value determination [15,16]. Alternatively, one simple method is photoelectron emission spectroscopy (PES) which does not require ultra-high vacuum and allows measurements to also be performed in air [17,18,19]. Although the methods are similar, for some (even well-known) materials the energy level values can greatly differ from source to source. For example, the ionization energy for a well-known polymer PBDB-T is reported to be between 5.20 and 5.30 eV [20,21,22,23], while values as high as 5.39 eV [24] and as low as 4.9 eV [25] can also be found. In most cases, these values introduce 0.1 V uncertainties in the prediction of Uoc, with a 0.5 eV difference between the lowest and the highest reported values. The electron affinity level value determination produces an additional challenge. While inverse photoemission spectroscopy (IPES) can be used to determine the EA directly [26,27], the poor energy resolution and complexity of the method limit its usage. Most often, the EA value is obtained indirectly from the ionization energy level value and energy gap measurements. The energy gap between the ionization energy and EA can be estimated either from the absorption edge or the intrinsic photoconductivity measurements.
A popular method for the energy level value determination of organic materials is cyclic voltammetry. As the measurements are performed in solutions instead of thin films, there is still debate regarding whether the results can be used to describe energy levels in solids [28,29].
Additionally, energy level shifts at the electron donor–acceptor interface can take place [19,28,30]. This means that the energy level values obtained from bulky layers of pure material films can give incorrect information about the real energy gap at the donor–acceptor interface. Because of this, a simple and reliable method for the prediction of Uoc is necessary.
In the intrinsic photoconductivity near the threshold energy, the excited electron can be directly transferred to the adjacent molecule. In the case of pure film, this threshold is the difference between the ionization energy level and electron affinity level. If the active layer is made of two materials (for example, at a bulk heterojunction), the obtained threshold describes the real difference between the ionization energy level of the electron donor molecule and the electron affinity level of the electron acceptor molecule [31]. Theoretically this direct charge transfer (CT) transition can be observed optically; however, the probability of such transfer is low, often close to the sensitivity limits of the equipment. Electrical measurements are an easier way to observe this effect.
In this work, we aim to use intrinsic photoconductivity to obtain a charge transfer energy (ECT) that describes the difference between Id and EAa and can be used to predict the Uoc of organic photovoltaic cells. In this way, the time- and resource-consuming creation of OPVs can be replaced by photoconductivity measurements of simple “sandwich” type (ITO/donor:acceptor/Al) samples. The obtained ECT values are compared to the Uoc values of the same donor:acceptor combination OPV cells.

2. Materials and Methods

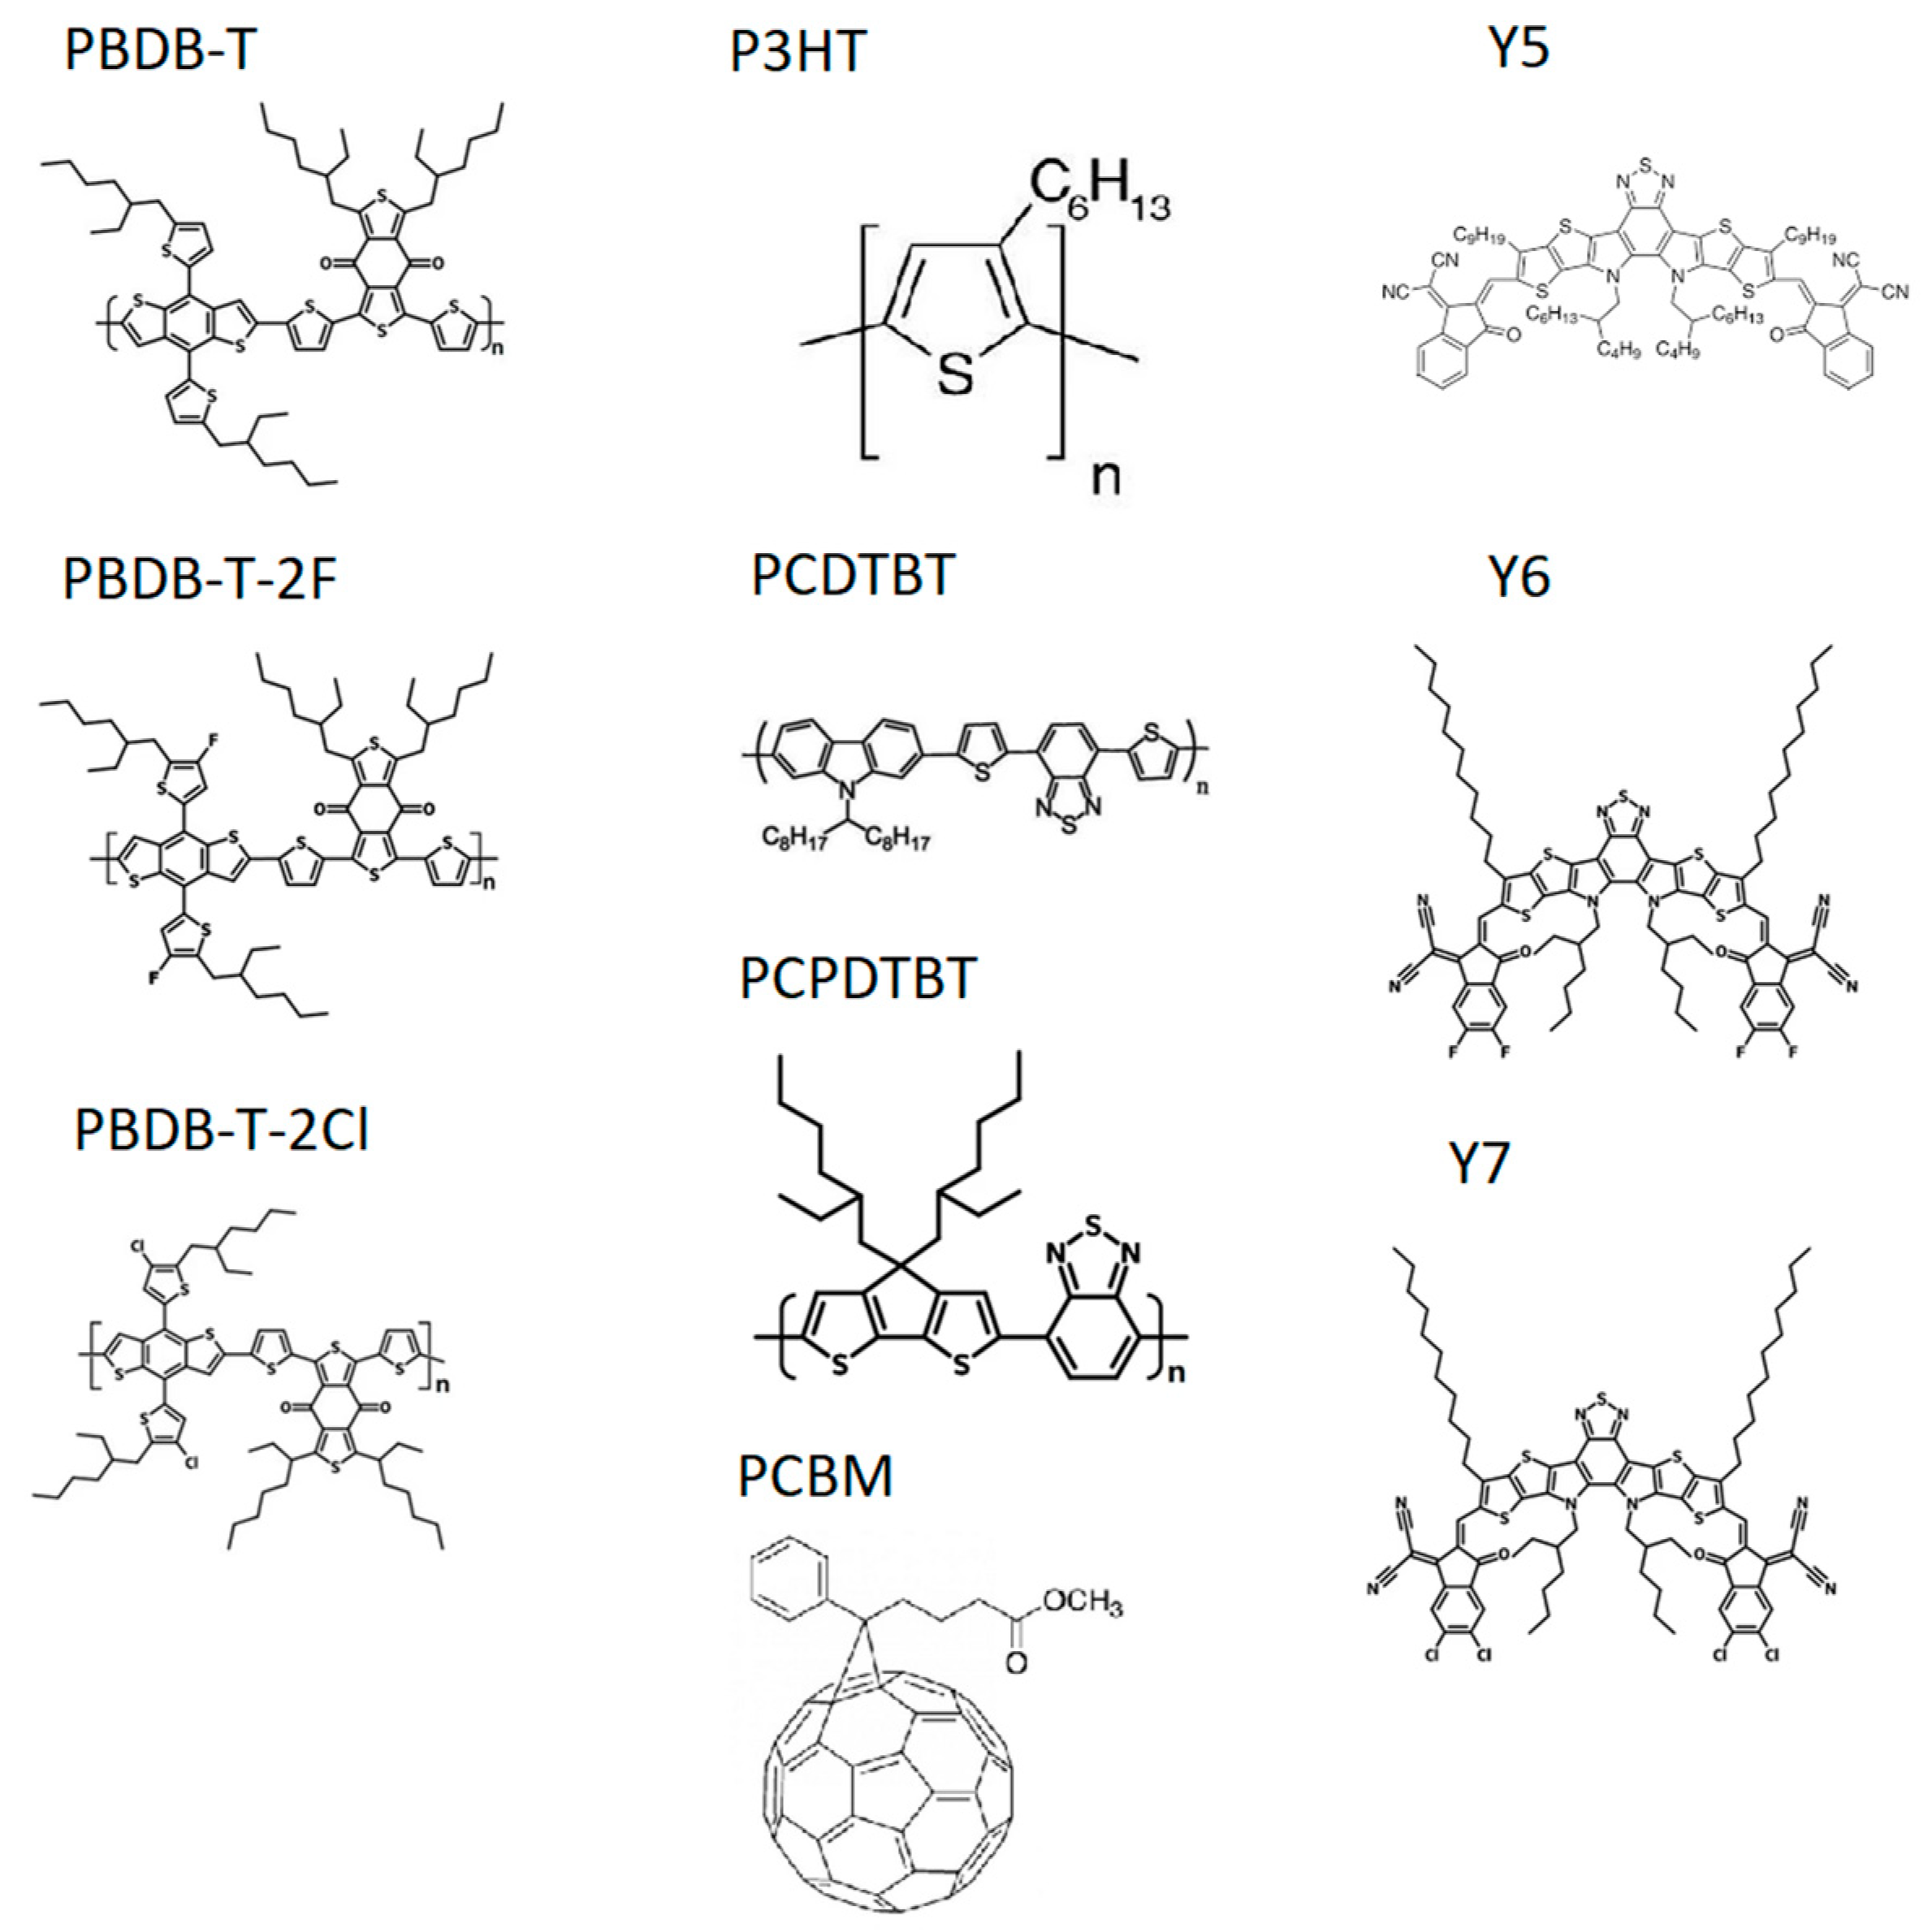
2.1. Studied Materials and Sample Preparation

Several well-known commercially available organic electron donor and acceptor materials were chosen for this study. The materials were electron donor polymers such as P3HT (bought from Sigma-Aldrich, https://www.sigmaaldrich.com/, (accessed on 17 September 2023)) and PCDTBT, PCPDTBT, PBDB-T, PBDB-T-2F, and PBDB-T-2Cl (bought from Ossila, https://www.ossila.com/ (accessed on 17 September 2023)), as well as low molecular weight electron acceptors such as PCBM and Y5 (bought from Sigma-Aldrich) and Y6 and Y7 (bought from Ossila). The structures of the molecules studied in this work are shown in Figure 1. The materials were chosen to cover various groups of organic compounds. Additionally, the energy level value differences between materials covered the possible Uoc values across a relatively wide range between 0.45 and 1.20 V.
For this study, four series of samples were made: (1) samples for energy level determination; (2) samples for bulk heterojunction photoconductivity measurements; (3) OPV cells with various donor:acceptor combinations in the active layer; (4) OPV cells with the same donor:acceptor pair in the active layer. Meanwhile, we varied the sample preparation conditions.
The samples for energy level determination were made on ITO-covered glass substrates (Präzisions Glas and Optik GmbH, 15 Ω/sq.). The materials were dissolved in chlorobenzene with a concentration of 15–20 mg/mL and spin-coated in an argon atmosphere with a speed of 700 rpm, acceleration of 700 rpm/s, and spinning time of 60 s. The samples were dried on a hotplate for 15 min at 140 °C. After ionization energy level measurements using the PES method, the 30 nm thick semi-transparent Al electrodes were deposited on top of the organic material film to obtain sandwich-type (ITO/organic material/Al) samples. The Al electrodes were deposited via thermal evaporation in a vacuum (at 1 × 10⁻⁵ mbar pressure) with a deposition rate of 0.2 nm/s. These samples were used in photoconductivity measurements to obtain the electron affinity energy level value of the studied compounds.
Bulk heterojunction samples for photoconductivity measurements were made by mixing two materials dissolved in chlorobenzene with a concentration of 15 mg/mL. The solution mass ratio in each mixture was 1:1 (donor:acceptor). Spin-coating and Al electrode deposition parameters were the same as in pure material thin films. In this way, samples with a structure of ITO/donor:acceptor/Al were obtained.
The solar cells were made on ITO-covered glass substrates (Präzisions Glas and Optik GmbH, https://www.pgo-online.com/intl/ito.html (Accessed on 26 September 2023) 5 Ω/sq.). PEDOT:PSS (AL4083) was spin-coated with a speed of 2000 rpm, acceleration of 2000 rpm/s, and spinning time of 60. The substrates were dried on a hotplate for 15 min at 120 °C temperature. The studied materials were dissolved in chlorobenzene with a concentration of 8–10 mg/mL. Various electron donor:acceptor material combinations were prepared by mixing two solutions with a mass ratio of 1:1 to ensure that the film morphology was the same as in the photoconductivity measurement samples. The solutions were spin-coated in an argon atmosphere with a spinning speed of 1200 rpm, acceleration of 1200 rpm/s, and spinning time of 60 s. The obtained samples were dried on a hotplate for 15 min at 140 °C. A 1 nm thick LiF electron transport layer and 100 nm thick Al electrodes were deposited using a Moorfield Nanotechnology MiniLab LT090A-MX thermal evaporator in a Jacomex glovebox. The Al deposition rate was ~0.2 nm/s. The final structure of the OPV cells was ITO/PEDOT:PSS/donor:acceptor/LiF/Al.
A series of samples containing an PBDB-T-2Cl:Y5 active layer was made to observe the effect of sample preparation conditions on the results. Three samples were made by varying the donor:acceptor mass ratio (1.2:1, 1:1, 1:1.2). One further sample was made by adding chloroform to the solution. In this case, the chloroform:chlorobenzene mass ratio in the solution was 0.5:1. The rest of the preparation parameters (solution concentration, spin-coating parameters, and time of thermal treatment) remained the same as in the previous series.

2.2. Measurement Systems
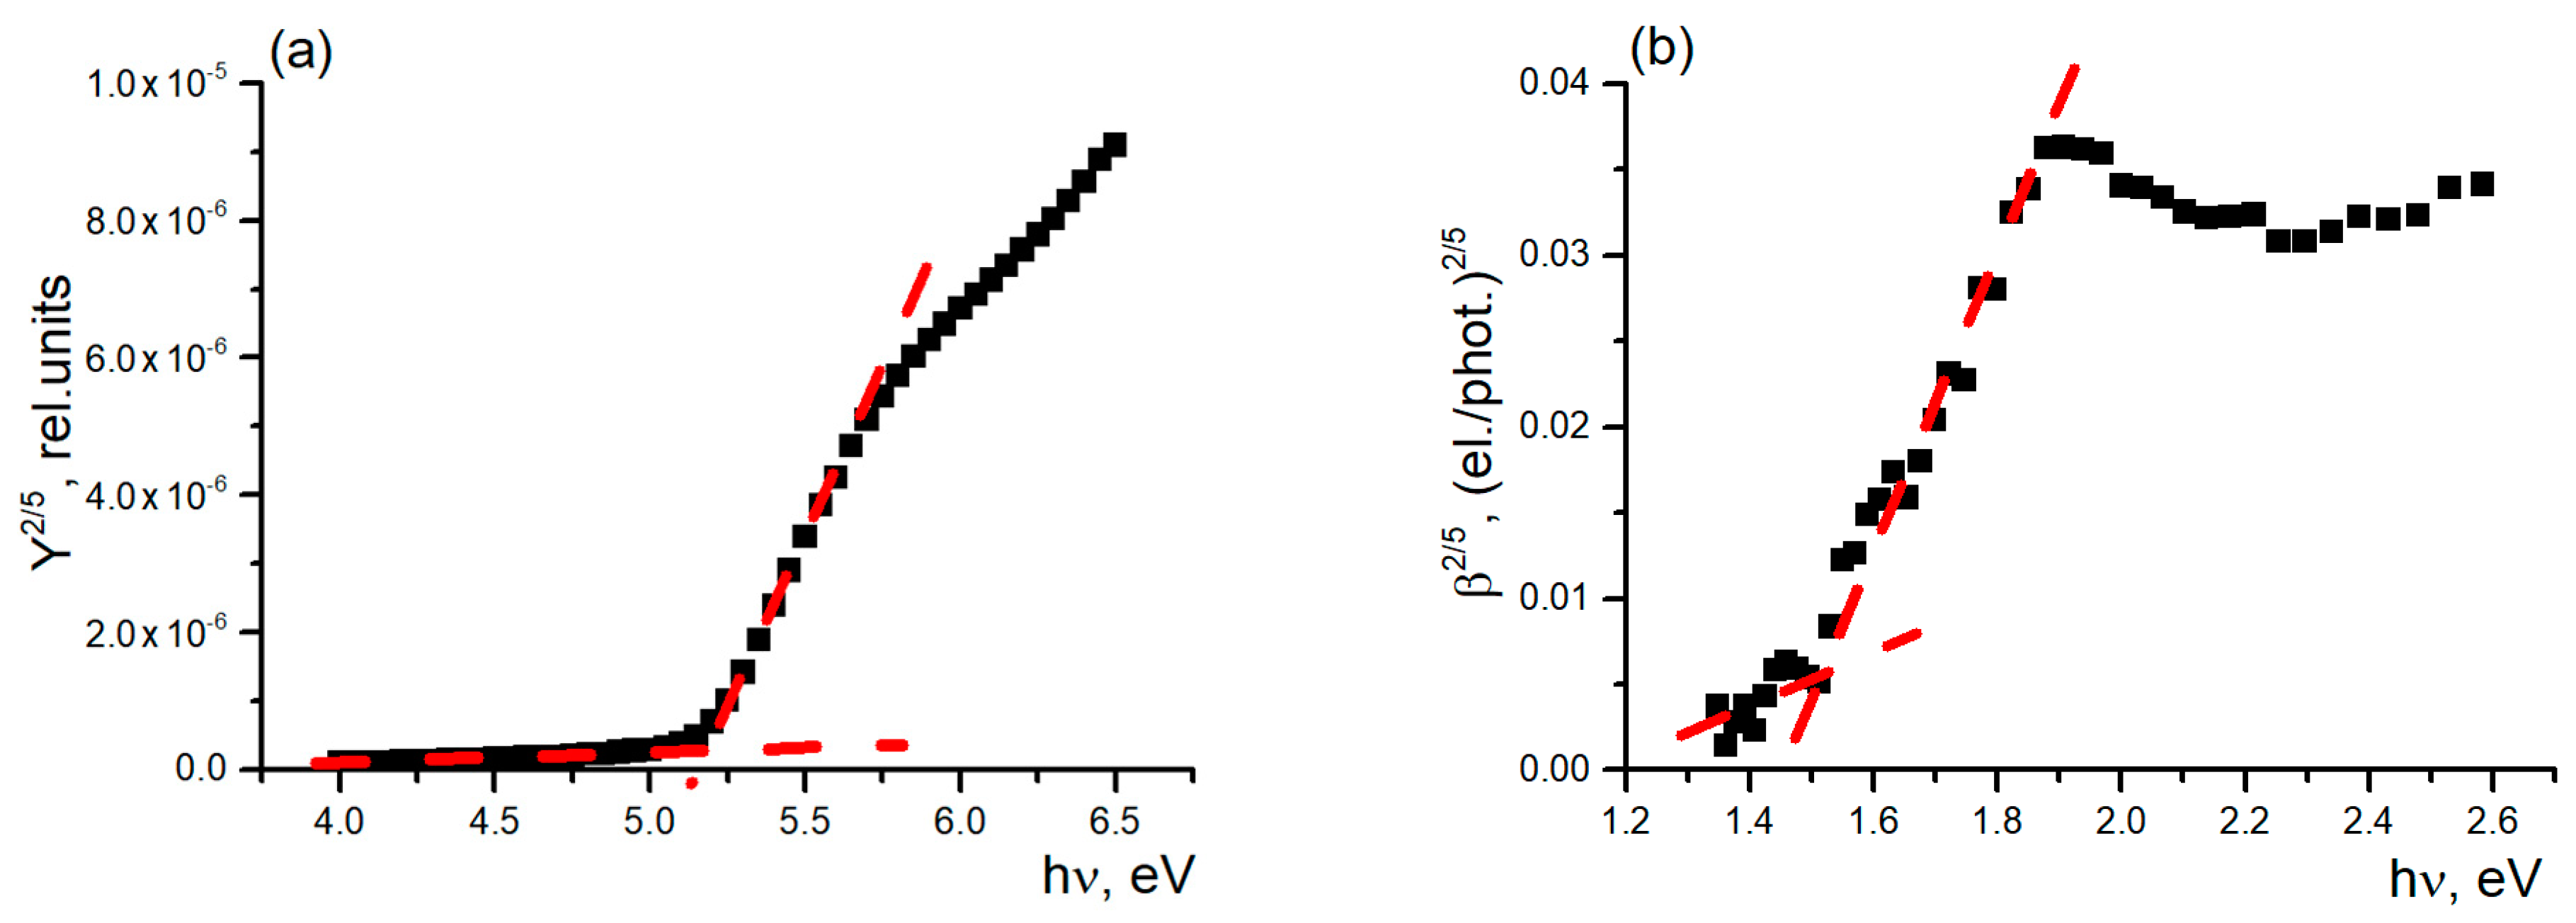
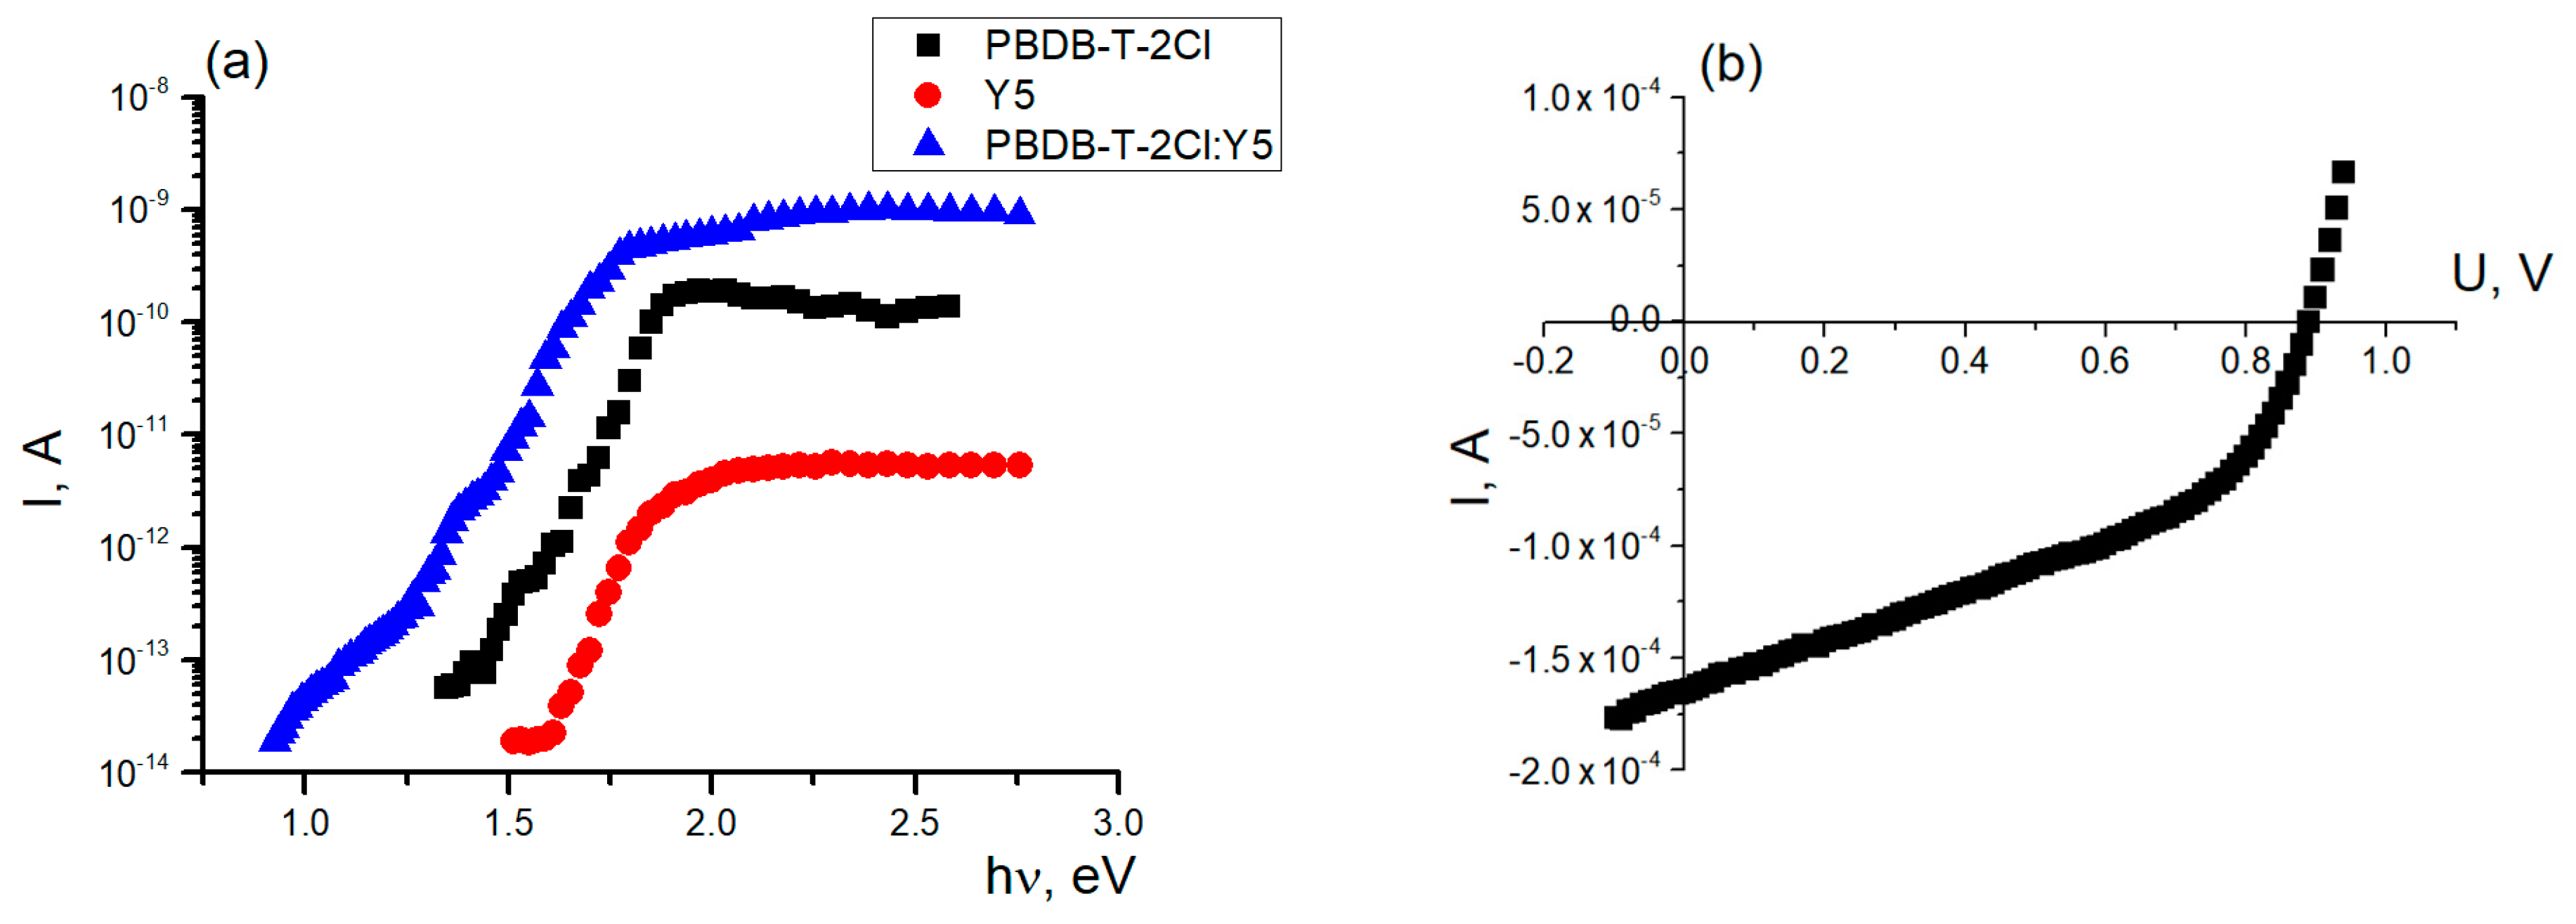
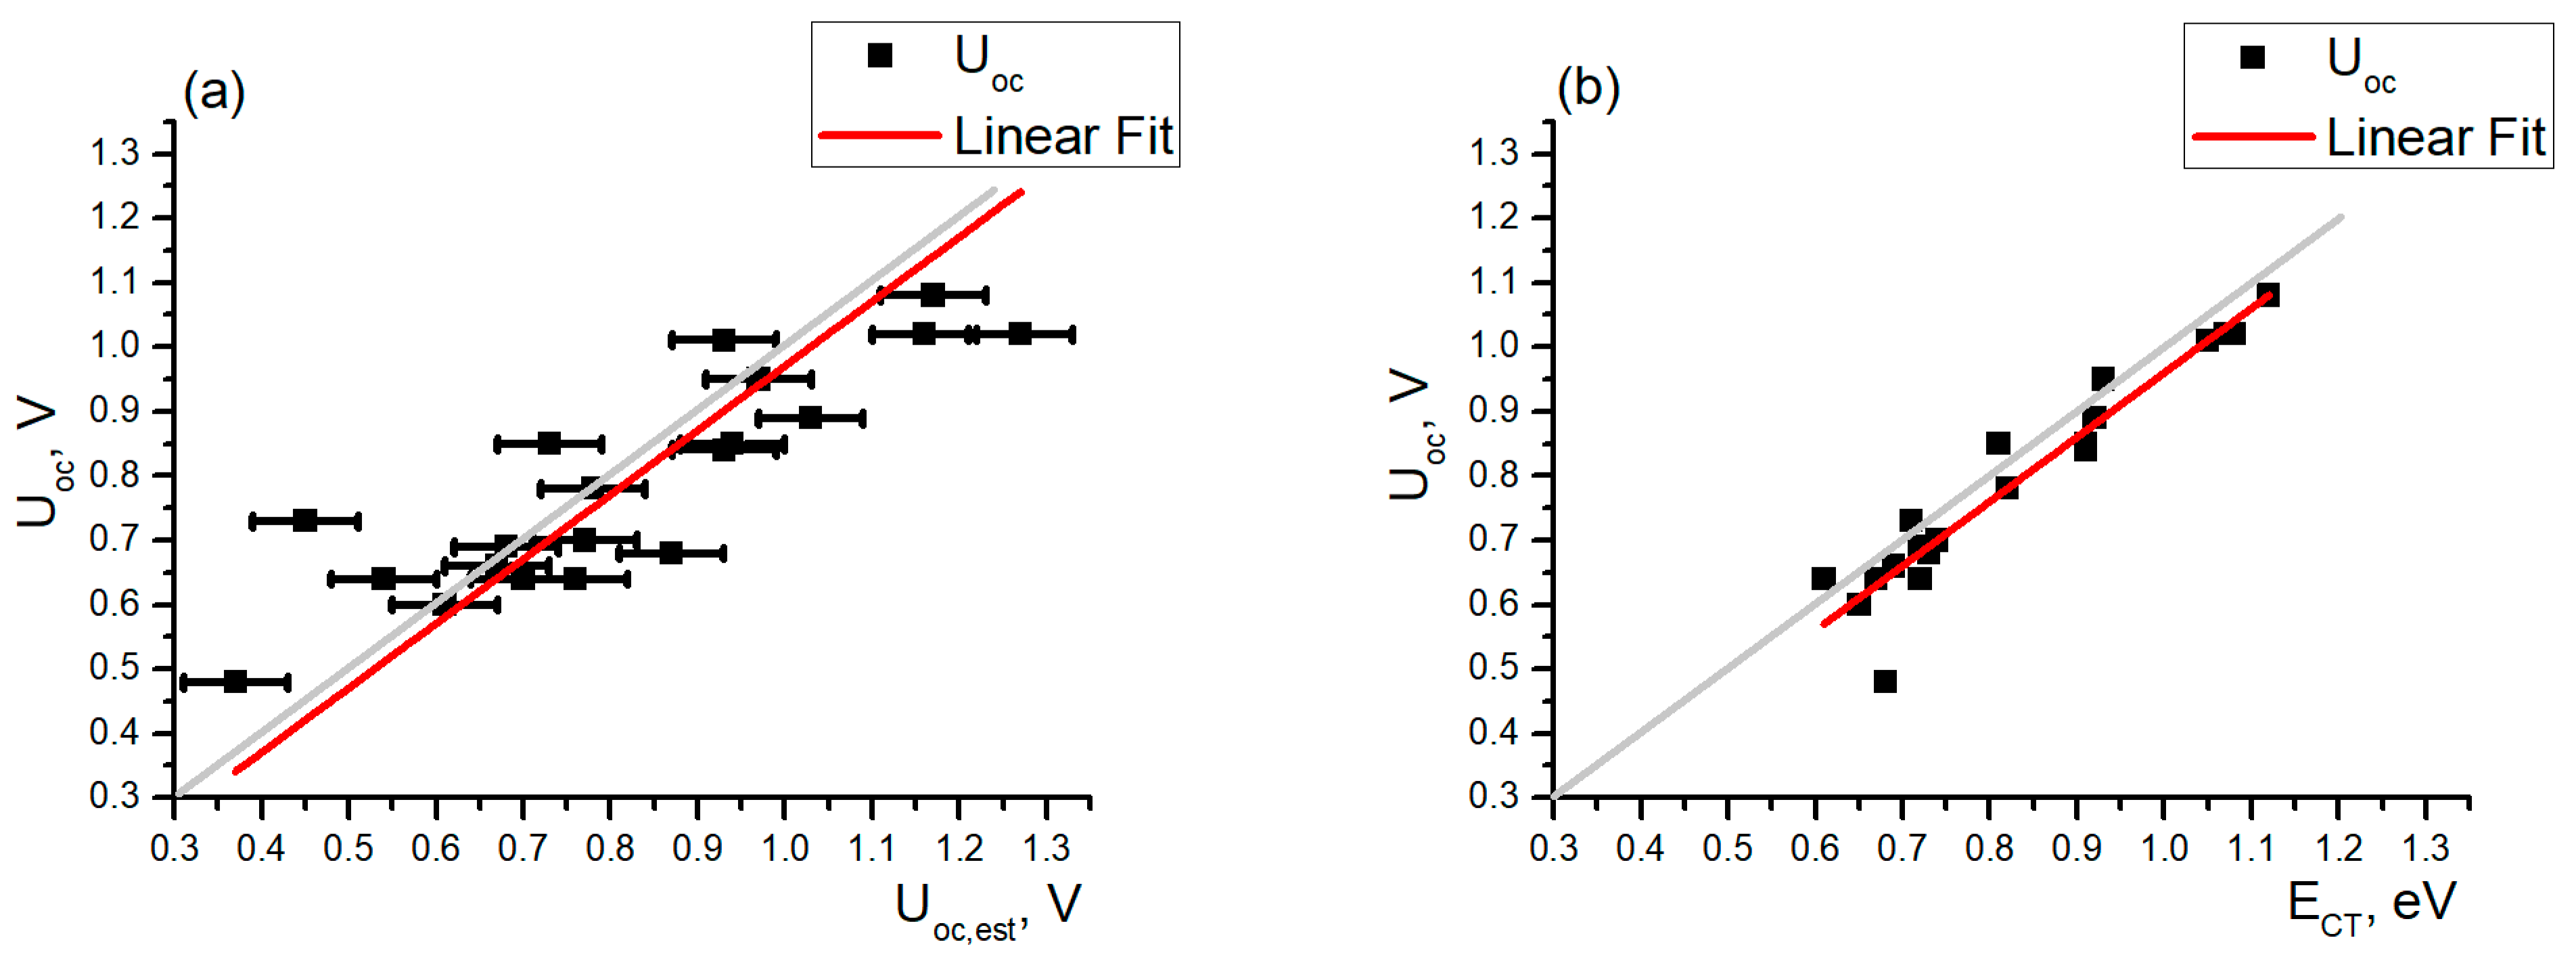
The ionization energy level value of the studied materials was obtained using the photoemission yield spectroscopy (PYS) method. The measurements were carried out in a vacuum (1-2∙10-5 mbar) using a self-built system consisting of an ENERGETIQ Laser-Driven Light Source (LDLS EQ-99) https://www.energetiq.com/ (Accessed on 26 September 2023), white light source, Spectral Products DK240 1/4 m monochromator, and Keithley 617 electrometer (which was used as a voltage source as well as the equipment for electric current measurements). The spectral range of the measurements was between 4.00 and 6.50 eV with a 0.05 eV step. A voltage of 50 V was applied between the sample and copper electrode to improve the electrical signal. The distance between the sample and the electrode was around 2 cm.
The equipment for photoconductivity measurements was the same as in photoelectron emission spectroscopy. In this case, there was no copper electrode 2 cm from the sample surface. Instead, one electrical contact was connected to the ITO while the other was connected to the Al electrode. The light was focused on a 3 × 3 mm2 area where ITO and Al overlapped. For the pure films, photoconductivity was used to determine the energy gap (Eg) between the material ionization energy level and electron affinity level. Knowing the energy gap and the ionization energy (I) level value, it was possible to calculate the electron affinity level value:
E A = I E g .
By measuring the photoconductivity of the bulk heterojunction (donor:acceptor) samples, the real gap between the donor molecule’s ionization energy level and the acceptor molecule’s electron affinity level was obtained.
A solar simulator ScienceTech SS150 https://www.sciencetech-inc.com/ (accessed on 17 September 2023) with a light intensity of 100 mW/cm2 and a standard AM 1.5 filter was used as a light source in the photovoltaic effect measurements. The current–voltage characteristics (I–V curves) were measured using a Keithley 6517B electrometer. From these measurements, the Uoc value for all of the studied donor–acceptor pairs was obtained.

3. Results

As there are a variety of measurement methods and systems, the energy level values for the studied materials vary considerably in the literature. To ensure that the energy level values were obtained in the same way, the ionization energy level and electron affinity level values were determined for the organic materials used in this work.
The ionization energy was determined from the photoelectron emission yield spectral dependence as the threshold energy at which the yield rapidly increases. Photoemission yield Y() can be calculated as
Y h ν = N h ν P h ν ,
where N() is the number of emitted electrons and P() is the number of incident photons with energy . Near the threshold energy, the photoemission yield is proportional to the difference between the photon energy and the ionization energy level value:
Y h ν h ν I x .
where x is a number between 1 and 3, depending on the studied system [32]. x = 2 is usually used for metals and conductive materials [18,33] while x = 2.5 or x = 3 is used for semiconductors [17,34,35]. In this work, we used x = 2.5 as it yielded a better approximation than x = 3. To obtain the ionization energy level value of the studied material, the Y()2/5 dependence on photon energy was plotted. An example of the photoelectron emission for PBDB-T-2Cl is shown in Figure 2a. It can be seen that after 5.20 eV, the photoemission yield linearly increases. This value is then considered the ionization energy level value of PBDB-T-2Cl.
The gap energy Eg value was obtained as the threshold energy from the photoconductivity spectral dependence. Photoconductivity efficiency β() can be calculated as
β h ν I p h h ν e · k h ν · N h ν · G h ν ,
where Iph() is the photocurrent when a sample is irradiated with photons of certain energy of , e is the elementary charge, k() is the light transmission coefficient of the semitransparent electrode, N() is the number of incident photons, and G() is the portion of light absorbed in the thin film, calculated as:
G h ν = 0 d e x p α h ν x d x 0 e x p α h ν x d x = 1 e x p α h ν d ,
where α() is the light absorption coefficient of the material, and d is the sample thickness. [36,37] Similarly to the photoelectron emission, photoconductivity efficiency is non-linearly proportional to the difference between the photon energy and gap energy:
β h ν h ν E g y
It has been empirically observed that in organic semiconductors, y = 2.5. Again, to obtain the Eg value of the studied material, the β()2/5 spectral dependence was plotted as shown in the example for PBDT-T-2Cl (see Figure 2b). In this case, the gap value was determined to be 1.51 eV, placing the electron affinity at 3.69 eV. The small photoconductivity signal between 1.3 and 1.5 eV was most likely caused by the impurities in the thin film, as no purification was performed and the materials were used as received.
The obtained values for all studied materials are collected in Table 1. These values were used to estimate the open-circuit voltage of various donor:acceptor material pairs.
Usually, the photocurrent rapidly increases by several orders of magnitude when the photon energy is above the gap energy (Eg). Below Eg, there can sometimes be observed a small photoconductivity signal which is most likely generated by impurities in the film. As can be seen in the example of PBDB-T-2Cl in Figure 2b, Eg = 1.51 eV, yet a small photocurrent can be observed even at 1.35 eV. In the case of Y5, Eg = 1.68, yet a small photocurrent can be measured from ~1.50 eV (see Figure 3a). In the bulk heterojunction samples, photocurrents can be observed in the infrared part of the spectrum, far below the threshold energy of any separate material (see Figure 3a). In this case, the photocurrent could be measured starting from ECT = 0.92 eV. The photon energy is too low there to directly excite either PBDB-T-2Cl or Y5. This means that the electrons are directly transferred from the electron donor material to the electron acceptor molecules.
Using the studied materials, the OPV cells were fabricated and their current–voltage characteristics (I–V curves) were measured. From these measurements, the real Uoc values were obtained as the point closest to the I = 0 A value. In the example of the PBDB-T-2Cl: Y5 solar cell, the obtained Uoc value was 0.89 ± 0.01 V, only 0.03 V lower than the ECT value obtained in the photoconductivity measurements.
The values in Table 1 were used to estimate the open-circuit voltage (Uoc,est) for various donor:acceptor material combinations, according to Equation 1. In this work, we assumed the value ∆ to be 0.30. For IPBDB-T-2Cl = 5.20 eV and EAY5 = 3.87 eV, we obtained the estimated open-circuit voltage value Uoc,est = 1.03 ± 0.06 V, which is a 0.14 V overestimation compared to the real measured value. For most of the ionization energy level values reported in the literature around IPBDB-T-2Cl = 5.50 eV [38,39,40], the expected Uoc,est value would have been even 0.3 V higher, reaching 1.33 V and overestimating Uoc by more than 0.40 V.
In total, 20 different electron donor:acceptor pairs were studied. Photocurrent spectra were obtained for simple ITO/donor:acceptor/Al samples; OPV cells were fabricated and their current-voltage characteristics were measured.
The summarized results are shown in Figure 4. When energy level values and Equation 1 are used to determine Uoc, the results are more scattered (Figure 4a) than when measured ECT values are used (Figure 4b). Using linear fitting of the data, and fixing the slope coefficient to 1, an intercept value was −0.03 ± 0.06 V was obtained with a Pearson’s correlation coefficient of 0.87. While on average the estimated voltage Uoc,est was close to the measured Uoc, the points were dispersed around the “perfect fit” values. Mostly, Uoc,est tends to overestimate the expected voltage.
When linear fitting was applied to the Uoc dependence on ECT, the obtained intercept value was −0.04 ± 0.02 with a Pearson’s correlation coefficient of 0.95, showing a very strong correlation between both variables. This shows that the points are less scattered and the obtained Uoc values are closer to the values estimated from photoconductivity measurements. Furthermore, in this case, the measured ECT is slightly larger than the Uoc values for similar active layers. The low intensity of the white-light source in the infrared part of the spectrum and the electrical noises may explain why ECT exceeded the measured Uoc values. A light source with higher radiation intensity could be a solution to this problem.
When using both methods, the estimated open-circuit voltage values are close to the real ones, and the ECT results are less dispersed. Uoc estimation using Equation (1) does not take into account possible interactions between donor and acceptor molecules, which may differ from material class to material class. Two groups of similar materials were used in this work: PBDB-T and its derivatives (as electron donor materials) and Y- series (as electron acceptor materials). As the energy levels decrease owing to the addition of chlorine and fluorine atoms to the molecule [41,42], the estimated and obtained Uoc values follow the expected trend. For a lower ionization energy of electron donor material, the obtained Uoc values were higher than those when the original PBDB-T was used. When samples were made from a Y5 electron acceptor molecule, the Uoc values were generally higher than those where Y6 and Y7 were used in the active layer. However, no material group produced systematic errors (always overestimated or always underestimated) in either the Uoc estimation from energy level values or when intrinsic photoconductivity measurements were used.
The energy level values can be obtained with various methods; this can introduce additional uncertainties in the Uoc estimations. Often, these values are obtained from solutions instead of films, which can create even larger errors in Uoc estimations. Direct measurements using photoconductivity spectral dependence should provide more reliable and, in most cases, more precise results.
It has been shown that solar cell preparation conditions (solvent choice, morphology control, etc.) can influence the open-circuit voltage [43]. However, this influence is relatively limited and in most cases is within the range of 0.05 V. To test the sensitivity of the intrinsic photoconductivity measurements, an additional series of samples with a PBDB-T-2Cl:Y5 active layer was fabricated. This helped to evaluate the influence of sample preparation conditions on the obtained results.
As can be seen in Figure 5a, adding chloroform to the solution reduced the obtained Uoc. In this case, it was 0.84 V, a 0.05 V reduction compared to the case of pure chlorobenzene solution. As the chloroform rapidly evaporates, it hinders the formation of the desired film morphology and thus the performance of the solar cell is lowered. Changing the donor:acceptor mass ratio does not have a significant influence on the obtained Uoc values. Under an excessive amount of donor (1.2:1) the Uoc value decreased insignificantly (by 0.02 V) to 0.87 V (see Figure 5b). Under extra electron acceptor material in the active layer, the Uoc decreased by another 0.01 V to 0.86 V. This shows that the Uoc is mainly determined by the materials themselves, and there is a limited influence of the morphology of the film.
The intrinsic photoconductivity measurements showed a limited influence of the donor:acceptor mass ratio on the results (see Figure 6). Insignificant changes in the threshold value were observed: an additional amount of either donor or acceptor in the active layer lowered the threshold value by 0.01 eV, which is within the margin of error. Here, ECT = 0.91 eV, compared to the 0.92 eV obtained for the sample with a donor:acceptor mass ratio of 1:1. Larger changes were observed for the sample with added chloroform in the solution. First, the photocurrent was lower in the infrared part of the spectrum (see inset of Figure 6), showing decreased charge carrier transfer between the electron donor and acceptor molecules. Second, the ECT value in this case was 0.89 eV. Here, it can be seen that the trend remains the same as for other series of samples: the lower the Uoc, the lower the photoconductivity threshold value.

4. Conclusions

In this work, we showed that the open-circuit voltage estimation from energy level values in OPVs gives dispersed results and, in most cases, the expected Uoc is slightly overestimated. Photoconductivity measurements of simple ITO/donor:acceptor/Al samples facilitate the more precise prediction of Uoc, as shown by linear fitting of the results. The results are less dispersed, and the correlation coefficient is higher: 0.95 compared to 0.87 in the case of Uoc estimation from energy level values alone. The slight overestimation of Uoc using ECT values could be related to the sensitivity of the photocurrent measurements. More precise measurements could be performed using a more intense infrared radiation source.
Samples fabricated using the same materials in the active layer showed that sample preparation can influence the Uoc and intrinsic photoconductivity threshold (ECT). For the most correct comparison, the samples for photoconductivity measurements should be made the same way (for example, the mass ratio of donor:acceptor material, and the used solvents) as for solar cells.

Author Contributions

Conceptualization, A.V. and R.G.; methodology, A.P. and R.G.; formal analysis, A.P. and R.G.; investigation, A.P. and R.G.; writing—original draft preparation, R.G. and A.V.; writing—review and editing, R.G. and A.V.; visualization, R.G; supervision, A.V.; project administration, R.G.; funding acquisition, R.G. All authors have read and agreed to the published version of the manuscript.

Funding

This research is funded by the Latvian Council of Science, project “Development of ternary organic solar cells by employing original indacene-tetraone based non-fullerene acceptors”, project No. LZP-2022/1-0494.

Data Availability Statement

The data presented in this study are available on request from the corresponding author.

Acknowledgments

Institute of Solid State Physics, University of Latvia as the Centre of Excellence has received funding from the European Union’s Horizon 2020 Framework Programme H2020-WIDESPREAD-01-2016- 2017-TeamingPhase2 under grant agreement No. 739508, project CAMART².

Conflicts of Interest

The authors declare no conflict of interest.

References

  1. Tarique, W.B.; Uddin, A. A Review of Progress and Challenges in the Research Developments on Organic Solar Cells. Mater. Sci. Semicond. Process. 2023, 163, 107541. [Google Scholar] [CrossRef]
  2. Cui, Y.; Xu, Y.; Yao, H.; Bi, P.; Hong, L.; Zhang, J.; Zu, Y.; Zhang, T.; Qin, J.; Ren, J.; et al. Single-Junction Organic Photovoltaic Cell with 19% Efficiency. Adv. Mater. 2021, 33, 2102420. [Google Scholar] [CrossRef]
  3. Andersen, T.R.; Cooling, N.A.; Almyahi, F.; Hart, A.S.; Nicolaidis, N.C.; Feron, K.; Noori, M.; Vaughan, B.; Griffith, M.J.; Belcher, W.J.; et al. Fully Roll-to-Roll Prepared Organic Solar Cells in Normal Geometry with a Sputter-Coated Aluminium Top-Electrode. Sol. Energy Mater. Sol. Cells 2016, 149, 103–109. [Google Scholar] [CrossRef]
  4. Perulli, A.; Lattante, S.; Persano, A.; Cola, A.; Anni, M. On the Homogeneity of the External Quantum Efficiency in a Free OPV Roll-to-Roll Flexible Solar Module. Synth. Met. 2019, 247, 248–254. [Google Scholar] [CrossRef]
  5. Miranda, B.H.S.; Corrêa, L.d.Q.; Soares, G.A.; Martins, J.L.; Lopes, P.L.; Vilela, M.L.; Rodrigues, J.F.; Cunha, T.G.; de Q. Vilaça, R.; Castro-Hermosa, S.; et al. Efficient Fully Roll-to-Roll Coated Encapsulated Organic Solar Module for Indoor Applications. Sol. Energy 2021, 220, 343–353. [Google Scholar] [CrossRef]
  6. Ding, Z.; Stoichkov, V.; Horie, M.; Brousseau, E.; Kettle, J. Spray Coated Silver Nanowires as Transparent Electrodes in OPVs for Building Integrated Photovoltaics Applications. Sol. Energy Mater. Sol. Cells 2016, 157, 305–311. [Google Scholar] [CrossRef]
  7. Mola, G.T.; Abera, N. Correlation between LUMO Offset of Donor/Acceptor Molecules to an Open Circuit Voltage in Bulk Heterojunction Solar Cell. Phys. B Condens. Matter 2014, 445, 56–59. [Google Scholar] [CrossRef]
  8. Morvillo, P.; Bobeico, E. Tuning the LUMO Level of the Acceptor to Increase the Open-Circuit Voltage of Polymer-Fullerene Solar Cells: A Quantum Chemical Study. Sol. Energy Mater. Sol. Cells 2008, 92, 1192–1198. [Google Scholar] [CrossRef]
  9. Tajbakhsh, M.; Kariminasab, M.; Ganji, M.D.; Alinezhad, H. Molecular Design of Novel Fullerene-Based Acceptors for Enhancing the Open Circuit Voltage in Polymer Solar Cells. J. Phys. Chem. Solids 2017, 111, 410–418. [Google Scholar] [CrossRef]
  10. Rand, B.P.; Burk, D.P.; Forrest, S.R. Offset Energies at Organic Semiconductor Heterojunctions and Their Influence on the Open-Circuit Voltage of Thin-Film Solar Cells. Phys. Rev. B Condens. Matter Mater. Phys. 2007, 75, 115327. [Google Scholar] [CrossRef]
  11. Parhi, A.P.; Tripathi, D.C.; Kataria, D. Study of the Open Circuit Voltage Dependence on Incident Light Intensity of Planar Heterojunction Organic Solar Cell. Mater. Today Proc. 2021, 38, 1267–1271. [Google Scholar] [CrossRef]
  12. Manor, A.; Katz, E.A. Open-Circuit Voltage of Organic Photovoltaics: Implications of the Generalized Einstein Relation for Disordered Semiconductors. Sol. Energy Mater. Sol. Cells 2012, 97, 132–138. [Google Scholar] [CrossRef]
  13. Scharber, M.C.; Mühlbacher, D.; Koppe, M.; Denk, P.; Waldauf, C.; Heeger, A.J.; Brabec, C.J. Design Rules for Donors in Bulk-Heterojunction Solar Cells—Towards 10 % Energy-Conversion Efficiency. Adv. Mater. 2006, 18, 789–794. [Google Scholar] [CrossRef]
  14. Lee, M.H. Identifying Correlation between the Open-Circuit Voltage and the Frontier Orbital Energies of Non-Fullerene Organic Solar Cells Based on Interpretable Machine-Learning Approaches. Sol. Energy 2022, 234, 360–367. [Google Scholar] [CrossRef]
  15. Casu, M.B.; Imperia, P.; Schrader, S.; Falk, B. Ultraviolet Photoelectron Spectroscopy of Thin Films of New Materials for Multilayer Organic Light Emitting Diodes. Surf. Sci. 2001, 482–485, 1205–1209. [Google Scholar] [CrossRef]
  16. Chandekar, A.; Whitten, J.E. Ultraviolet Photoemission and Electron Loss Spectroscopy of Oligothiophene Films. Synth. Met. 2005, 150, 259–264. [Google Scholar] [CrossRef]
  17. Honda, M.; Kanai, K.; Komatsu, K.; Ouchi, Y.; Ishii, H.; Seki, K. Atmospheric Effect of Air, N2, O2, and Water Vapor on the Ionization Energy of Titanyl Phthalocyanine Thin Film Studied by Photoemission Yield Spectroscopy. J. Appl. Phys. 2007, 102, 103704. [Google Scholar] [CrossRef]
  18. Monjushiro, H.; Watanabe, I.; Yokoyama, Y. Ultraviolet Photoelectron Yield Spectra of Thin Gold Films Measured in Air. Anal. Sci. 1991, 7, 543–547. [Google Scholar] [CrossRef]
  19. Grzibovskis, R.; Vembris, A. Energy Level Determination in Bulk Heterojunction Systems Using Photoemission Yield Spectroscopy: Case of P3HT:PCBM. J. Mater. Sci. 2018, 53, 7506–7515. [Google Scholar] [CrossRef]
  20. Xiao, L.; Mao, H.; Li, Z.; Yan, C.; Liu, J.; Liu, Y.; Reimer, J.A.; Min, Y.; Liu, Y. Employing a Narrow-Band-Gap Mediator in Ternary Solar Cells for Enhanced Photovoltaic Performance. ACS Appl. Mater. Interfaces 2020, 12, 16387–16393. [Google Scholar] [CrossRef]
  21. Kan, B.; Yi, Y.Q.Q.; Wan, X.; Feng, H.; Ke, X.; Wang, Y.; Li, C.; Chen, Y. Ternary Organic Solar Cells With 12.8% Efficiency Using Two Nonfullerene Acceptors With Complementary Absorptions. Adv. Energy Mater. 2018, 8, 1800424. [Google Scholar] [CrossRef]
  22. Feng, K.; Wu, Z.; Su, M.; Ma, S.; Shi, Y.; Yang, K.; Wang, Y.; Zhang, Y.; Sun, W.; Cheng, X.; et al. Highly Efficient Ternary All-Polymer Solar Cells with Enhanced Stability. Adv. Funct. Mater. 2021, 31, 2008494. [Google Scholar] [CrossRef]
  23. Choi, H.; Lee, J.; Oh, C.M.; Jang, S.; Kim, H.; Jeong, M.S.; Park, S.H.; Hwang, I.W. Efficiency Enhancements in Non-Fullerene Acceptor-Based Organic Solar Cells by Post-Additive Soaking. J. Mater. Chem. A 2019, 7, 8805–8810. [Google Scholar] [CrossRef]
  24. Yuan, J.; Huang, T.; Cheng, P.; Zou, Y.; Zhang, H.; Yang, J.L.; Chang, S.Y.; Zhang, Z.; Huang, W.; Wang, R.; et al. Enabling Low Voltage Losses and High Photocurrent in Fullerene-Free Organic Photovoltaics. Nat. Commun. 2019, 10, 570. [Google Scholar] [CrossRef] [PubMed]
  25. Li, Q.; Sun, Y.; Xue, X.; Yue, S.; Liu, K.; Azam, M.; Yang, C.; Wang, Z.; Tan, F.; Chen, Y. Insights into Charge Separation and Transport in Ternary Polymer Solar Cells. ACS Appl. Mater. Interfaces 2019, 11, 3299–3307. [Google Scholar] [CrossRef] [PubMed]
  26. Hill, I.G.; Kahn, A.; Soos, Z.G.; Pascal, R.A. Charge-Separation Energy in Films of π-Conjugated Organic Molecules. Chem. Phys. Lett. 2000, 327, 181–188. [Google Scholar] [CrossRef]
  27. Fahlman, A.; Hamrin, K.; Hedman, J.; Nordberg, R.; Nordling, C.; Siegbanh, K. Electron Spectroscopy and Chemical Binding. Nature 1966, 210, 4–8. [Google Scholar] [CrossRef]
  28. Sworakowski, J.; Janus, K. On the Reliability of Determination of Energies of HOMO Levels in Organic Semiconducting Polymers from Electrochemical Measurements. Org. Electron. 2017, 48, 46–52. [Google Scholar] [CrossRef]
  29. Sworakowski, J.; Lipiński, J.; Janus, K. On the Reliability of Determination of Energies of HOMO and LUMO Levels in Organic Semiconductors from Electrochemical Measurements. A Simple Picture Based on the Electrostatic Model. Org. Electron. 2016, 33, 300–310. [Google Scholar] [CrossRef]
  30. Whitcher, T.J.; Wong, W.S.; Talik, A.N.; Woon, K.L.; Rusydi, A.; Chanlek, N.; Nakajima, H.; Saisopa, T.; Songsiriritthigul, P. Energy Level Alignment of Blended Organic Semiconductors and Electrodes at the Interface. Curr. Appl. Phys. 2018, 18, 982–992. [Google Scholar] [CrossRef]
  31. Khan, S.U.Z.; Londi, G.; Liu, X.; Fusella, M.A.; D’Avino, G.; Muccioli, L.; Brigeman, A.N.; Niesen, B.; Yang, T.C.J.; Olivier, Y.; et al. Multiple Charge Transfer States in Donor-Acceptor Heterojunctions with Large Frontier Orbital Energy Offsets. Chem. Mater. 2019, 31, 6808–6817. [Google Scholar] [CrossRef]
  32. Kane, E.O. Theory of Photoelectric Emission from Metals. Phys. Rev. 1962, 127, 131–141. [Google Scholar] [CrossRef]
  33. Ow-Yang, C.W.; Jia, J.; Aytun, T.; Zamboni, M.; Turak, A.; Saritas, K.; Shigesato, Y. Work Function Tuning of Tin-Doped Indium Oxide Electrodes with Solution-Processed Lithium Fluoride. Thin Solid Film. 2014, 559, 58–63. [Google Scholar] [CrossRef]
  34. Gao, Y. Surface Analytical Studies of Interfaces in Organic Semiconductor Devices. Mater. Sci. Eng. R Rep. 2010, 68, 39–87. [Google Scholar] [CrossRef]
  35. Kanai, K.; Honda, M.; Ishii, H.; Ouchi, Y.; Seki, K. Interface Electronic Structure between Organic Semiconductor Film and Electrode Metal Probed by Photoelectron Yield Spectroscopy. Org. Electron. 2012, 13, 309–319. [Google Scholar] [CrossRef]
  36. Silinsh, E.A. Organic Molecular Crystals: Their Electronic States; Cardona, M., Flude, P., Queisser, H.-J., Eds.; Springer: Berlin/Heidelberg, Germany; New-York, NY, USA, 1980; ISBN 3-540-10053-9. [Google Scholar]
  37. Silinsh, E.A.; Čapek, V. Organic Molecular Crystals: Interaction, Localization, and Transport Phenomena; AIP Press: New York, NY, USA, 1994; ISBN 1-56396-069-9. [Google Scholar]
  38. Liu, T.; Luo, Z.; Chen, Y.; Yang, T.; Xiao, Y.; Zhang, G.; Ma, R.; Lu, X.; Zhan, C.; Zhang, M.; et al. A Nonfullerene Acceptor with a 1000 Nm Absorption Edge Enables Ternary Organic Solar Cells with Improved Optical and Morphological Properties and Efficiencies over 15%. Energy Environ. Sci. 2019, 12, 2529–2536. [Google Scholar] [CrossRef]
  39. Zhang, J.; Han, Y.; Zhang, W.; Ge, J.; Xie, L.; Xia, Z.; Song, W.; Yang, D.; Zhang, X.; Ge, Z. High-Efficiency Thermal-Annealing-Free Organic Solar Cells Based on an Asymmetric Acceptor with Improved Thermal and Air Stability. ACS Appl. Mater. Interfaces 2020, 12, 57271–57280. [Google Scholar] [CrossRef]
  40. Ma, R.; Liu, T.; Luo, Z.; Guo, Q.; Xiao, Y.; Chen, Y.; Li, X.; Luo, S.; Lu, X.; Zhang, M.; et al. Improving Open-Circuit Voltage by a Chlorinated Polymer Donor Endows Binary Organic Solar Cells Efficiencies over 17%. Sci. China Chem. 2020, 63, 325–330. [Google Scholar] [CrossRef]
  41. Chu, C.; Ni, C.; He, A.; Qin, Y. Chlorination and Thiophene Strategies to Adjust Molecular Energy Levels for High-Performance Organic Polymer Solar Cells. Synth. Met. 2020, 268, 116509. [Google Scholar] [CrossRef]
  42. Zhang, K.; Wei, Z.; Song, P.; Ma, F.; Li, Y. Exploring the Fluorination Effect Mechanism on Charge Transport in Organic Solar Cells. Sol. Energy 2022, 248, 160–170. [Google Scholar] [CrossRef]
  43. Wen, Z.C.; Yin, H.; Hao, X.T. Recent Progress of PM6:Y6-Based High Efficiency Organic Solar Cells. Surf. Interfaces 2021, 23, 100921. [Google Scholar] [CrossRef]
Figure 1. Studied materials.
Energies 16 06728 g001
Figure 2. Energy level value determination of PBDB−T−2Cl. The spectra for (a) photoelectron emission and (b) photoconductivity.
Energies 16 06728 g002
Figure 3. (a) Photocurrent spectra of PBDB−T−2Cl, Y5, and their mixture; (b) Current-voltage characteristics of PBDB−T−2Cl:Y5 solar cell.
Energies 16 06728 g003
Figure 4. Open-circuit voltage (Uoc) dependence on (a) estimated open-circuit voltage (Uoc,est) and (b) charge-transfer energy (ECT). In both cases, the grey line shows a perfect fit.
Energies 16 06728 g004
Figure 5. Current–voltage characteristics of PBDB−T−2Cl:Y5 solar cells (a) with and without adding chloroform to the solution and (b) under varying donor:acceptor mass ratios in the active layer.
Energies 16 06728 g005
Figure 6. Photocurrent spectra of PBDB−T−2Cl:Y5 samples, inset shows the infrared part of the photoconductivity spectra.
Energies 16 06728 g006
Table 1. Studied materials and their energy level values.
MaterialI, eV
(±0.03 eV)
EA, eV
(±0.05 eV)
P3HT4.542.79
PCDTBT5.103.40
PCPDTBT4.903.60
PBDB-T4.873.15
PBDB-T-2F5.103.40
PBDB-T-2Cl5.203.69
PCBM6.083.63
Y55.553.87
Y65.754.03
Y75.694.12
Disclaimer/Publisher’s Note: The statements, opinions and data contained in all publications are solely those of the individual author(s) and contributor(s) and not of MDPI and/or the editor(s). MDPI and/or the editor(s) disclaim responsibility for any injury to people or property resulting from any ideas, methods, instructions or products referred to in the content.

