1. Introduction
The modular high-temperature gas-cooled reactor (MHTGR) belongs to the category of very high-temperature reactor (VHTR), which is one of six advanced reactor types for generation IV nuclear energy systems [
1]. Owing to its inherent safety and higher core outlet temperature (700–950 °C), MHTGR is suitable for high-efficiency power generation and a variety of process heat applications [
2,
3,
4,
5,
6,
7]. The cold-end system [
8,
9,
10] is an important section of an MHTGR nuclear power plant (NPP). This system is used to cool exhaust steam into condensate and discharge waste heat into the external environment, which determines the final parameters of the steam Rankine cycle. The cold-end system of the Chinese MHTGR NPP adopts an open-loop design method using seawater as the cooling water and the ocean as the final heat sink [
2]. After passing through the condenser, the seawater is redischarged into the external environment; it thus undergoes only one cycle. Cooling water parameters such as inlet temperature and mass flow rate affect the performance of the cold-end system, which in turn affects the thermal performance of the secondary circuit system of an NPP.
With the frequent occurrence of extreme high-temperature weather in recent years, the inlet temperature of the cooling water in NPPs has received increasing attention. In May 2022, Electricite de France (EDF) stated that excessive cooling water (river water) inlet temperatures may reduce the power generation of NPPs in France [
11]. Owing to various factors, including high-temperature weather, the EDF’s nuclear power generation in the third quarter of 2022 was 55.1 TWh, a decrease of 36.3% compared with that of the third quarter of 2021 [
12]. The influence of the cooling water inlet temperature on the thermal performance of NPPs has been studied. Laskowski et al. [
13] used EBSILON software to establish a simulation model for a boiling water reactor NPP. The simulation results showed that when the cooling water temperature rose from 10 °C to 28 °C, the plant’s total output power decreased by 91.405 MW, and the total efficiency decreased by 2.773%. Attia [
14] established a mathematical model for a typical NPP secondary circuit system and performed an energy analysis. The results showed that the system thermal efficiency and output power decrease by 0.152% and 0.444%, respectively, when the cooling water inlet temperature increases by 1 °C. Durmayaz et al. [
15] studied the influence of the cooling water inlet temperature on the thermal performance of a conceptual pressurised water reactor NPP in combination with climate conditions in Turkey. This study offers valuable insights into the site selection of power plants.
The cooling water mass flow rate also plays a crucial role in optimising the operation of steam turbine units [
16,
17,
18]. In a power plant, adjusting the blade angle or the rotational speed of the pump rotor can alter the mass flow rate of cooling water entering the condenser [
19,
20,
21]. Zhang et al. [
22] developed a coupling algorithm using a genetic algorithm–back propagation neural network and a heat transfer model for components of cold-end systems. They determined the optimal mass flow of cooling water for a 350 MW unit at different ambient temperatures. Laskowski et al. [
23] approached the optimisation goal from the perspective of the second law of thermodynamics, aiming to minimise the system’s entropy generation rate. They obtained a series of optimum cooling water mass flow rates for varying conditions of the power plant. Wu et al. [
24] studied a 660 MW thermal power-generating unit under various loads. The optimal cooling water mass flow rates were calculated. The results demonstrated a nonlinear trend, in which the optimal mass flow rate gradually decreased with diminishing load. Błaszczyk et al. [
25] focused on choosing the appropriate cooling water mass flow rate for marine power units.
Laskowski et al. [
26] analysed the effect of different cooling water mass flow rates on the thermal performance of a 225 MW thermal power plant in Poland within the load range of 40% to 100%. This study revealed that within a certain range, an increment in the cooling water mass flow rate led to an increment in overall power generation; however, it also resulted in a rapid increase in electricity usage by the cooling water pumps. They concluded that when optimising the unit’s power output, it is advisable to reduce the cooling water mass flow rate when the unit load falls below 60%.
Most of the existing literature considers thermal power plants and light water reactor NPPs as research objects to examine the influence of cooling water parameters on the thermal performance of power plants. However, there is no research on MHTGR NPPs in the literature. Among the studies that have been conducted, the selected range of cooling water inlet temperature variations is generally limited, and the adverse effects of high-temperature cooling water on plant operations have not been fully considered. Additionally, considering the involvement of MHTGR NPPs in peak load regulation after grid connection, the influence of cooling water parameters over the full power range of NPP operation has to be analysed.
In this study, an energy analysis of the secondary circuit system of an MHTGR NPP was conducted. The construction, as well as verification of the system model, was completed using EBSILON software. Quasi-steady-state simulations were performed within the range of 30% to 100% rated conditions (RC) to quantitatively analyse the impact of varying cooling water parameters on the thermal performance of both the cold-end and secondary circuit systems. The maximum net power was selected as the optimisation goal, and the optimisation function of the EBSILON software was employed to determine the optimal mass flow rate of cooling water for various power levels of the power plant. Furthermore, at 100% RC, the corresponding optimal cooling water mass flow rates for different cooling water inlet temperatures were obtained. The results provide a basis for evaluating the impact of high-temperature weather on the thermal performance of power plants. Moreover, they can serve as a reference for MHTGR NPPs to optimise their cold-end systems.
4. Results and Discussion
The study was divided into two parts, encompassing a power range of 30% to 100% RC, employing a control variable approach. In the first part, the cooling water mass flow rate was maintained constant at the design value of 7697.61 kg/s, while studying the influence of changing cooling water inlet temperatures within the range of 10–33 °C. The temperature range was determined based on the combination of industrial and local climatic conditions. In the second part, a constant cooling water inlet temperature was maintained at the design value of 16 °C, and the mass flow rate of cooling water was varied from 6000 to 14,000 kg/s to examine the influence of mass flow rate. Subsequently, under 100% RC, the mass flow rate corresponding to the maximum net power is defined as the optimal cooling water mass flow rate. This optimal mass flow rate is determined for various power levels of the MHTGR NPP, with the cooling water inlet temperature set at 16 °C. Both the cooling water inlet temperature and mass flow rate were simultaneously altered, leading to the creation of a three-dimensional surface diagram illustrating the net power change. Additionally, the optimal cooling water mass flow rate is determined separately for cooling water inlet temperatures of 16 °C and 33 °C, both under 100% RC.
4.1. Influence of Cooling Water Inlet Temperature
Figure 6 and
Figure 7 show how the condenser end temperature difference and logarithmic mean temperature difference changed with respect to the cooling water inlet temperature. The data indicate that with a growth in the cooling water inlet temperature, both the condenser end and logarithmic mean temperature differences decrease. Additionally, at a given temperature, the condenser end and logarithmic mean temperature differences decreased as the power level of the NPP decreased.
Figure 8 illustrates the variation in the condenser back pressure at varying cooling water inlet temperatures. With the rise in cooling water inlet temperature, the condenser back pressure increased across the various power levels. Notably, at a cooling water inlet temperature of 33 °C, there was a significant increase in the condenser back pressure. As an example, consider the case of 100% RC, where without changing the cooling water mass flow rate, the condenser back pressure reaches 10.8 kPa at a cooling water inlet temperature of 33 °C, signifying a substantial 139.79% increase from the design parameter of 4.5 kPa at an inlet temperature of 16 °C. An elevated condenser back pressure in the Rankine cycle results in a higher exhaust steam temperature and enthalpy, leading to a decline in the cycle efficiency, as quantitatively demonstrated in
Figure 9 and
Table 5.
As depicted in
Figure 9, under 100% and 30% RC, the cycle efficiency exhibited a decline as the cooling water inlet temperature increased, whereas the heat consumption rate increased accordingly and the rate of change was approximately linear.
Figure 10 more comprehensively shows the change of unit net power with cooling water inlet temperature under 30–100% RC. Meanwhile,
Table 5 displays the changes in cycle efficiency, heat consumption rate, and net power at cooling water inlet temperatures of 10 and 33 °C under 100% and 30% RC. These calculations are based on simulation results for a cooling water inlet temperature of 16 °C, the designated value for this parameter. The average value was then determined. Under 100% RC and within the temperature range of 10–33 °C, the system experiences a decrease of 0.67 MW in net power, a 0.14% reduction in cycle efficiency, and an increase of 28.72 kJ/(kW·h) in heat consumption rate for every 1 °C rise in the cooling water inlet temperature.
Table 5 clearly illustrates the significant impact on unit net power when the cooling water inlet temperature reaches 33 °C without adjusting the cooling water mass flow rate. Specifically, under 100% and 30% RC, the net power of the unit decreased by 11.64 and 4.18 MW, respectively. The reduction in net power can be attributed to the change in enthalpy drop during the steam expansion process. For instance, under 100% RC, the condenser back pressure was 4.5 and 10.8 kPa, respectively, when the cooling water inlet temperature was 16 and 33 °C. Additionally, the corresponding enthalpy drop during steam expansion work was 1219.39 and 1125.52 kJ/kg, respectively. Evidently, a higher cooling water inlet temperature resulted in a significant reduction in the enthalpy drop of the steam.
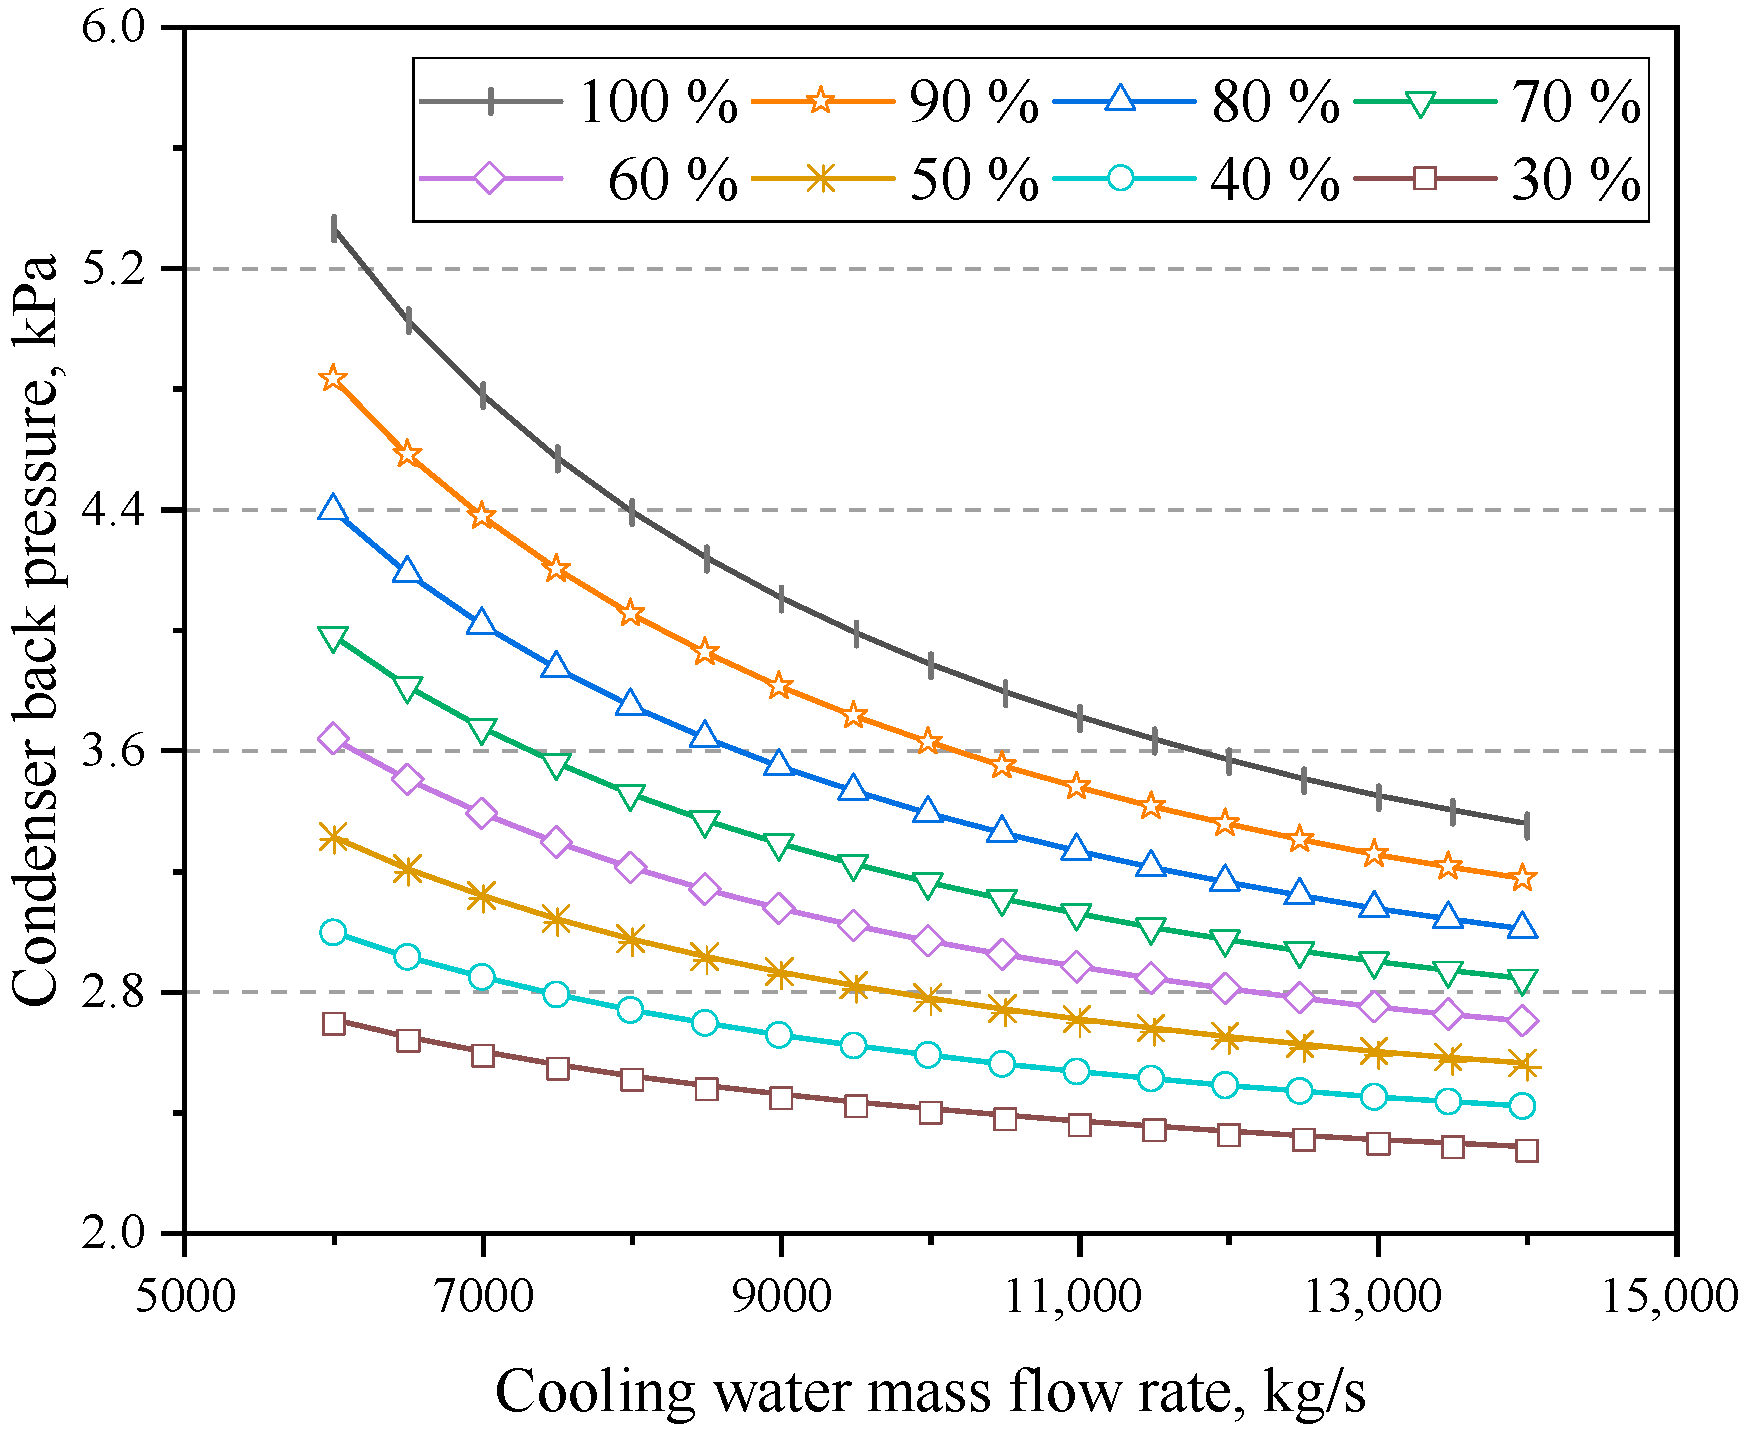
4.2. Influence of Cooling Water Mass Flow Rate
Figure 11,
Figure 12 and
Figure 13 show the variations in the end temperature difference, logarithmic mean temperature difference, and back pressure of the condenser with respect to the cooling water mass flow rate. With the growth of the mass flow rate, the end temperature difference, logarithmic mean temperature difference, and back pressure of the condenser decreased under the eight operating conditions.
Although an increase in the cooling water mass flow rate results in a reduction in the condenser back pressure, which increases the gross power generation of the unit, an increase in the mass flow rate will lead to a rapid increment in the power consumption of the cooling water pumps, which will have an adverse effect on the net power of the NPP.
Figure 14 shows the variation of net power with cooling water mass flow rate under 100% and 90% RC. The net power exhibits a clear trend, first increasing and then decreasing. This trend was consistently observed under the other operating conditions as well.
Figure 15 shows the net power of the unit under eight operating conditions, where the red dotted line indicates the optimal mass flow rate of cooling water corresponding to the different power levels. As the power level decreased, the optimal cooling water mass flow rate gradually decreased, and the trend became nonlinear.
Figure 16 shows the variations in the cycle efficiency and heat consumption rate with cooling water mass flow rates under 100% and 30% RC. The net power exhibits a corresponding trend (
Figure 17). When the mass flow rate increased, the cycle efficiency initially increased and then declined, whereas the heat consumption rate initially decreased and then increased. By adopting the optimal mass flow rate, the heat consumption rate was reduced by 46.11 and 15.18 kJ/(kW·h) at 100% and 30% RC, respectively. Furthermore,
Figure 17 visually demonstrates the variation of the net power simultaneously with the cooling water inlet temperature and mass flow rate, aligning with the trends observed in
Figure 10 and
Figure 15. At 33 °C and 6000 kg/s, the system’s net power reached its minimum value of 193.57 MW.
Figure 18 illustrates the net power increase of the unit under eight operating conditions when adopting the optimal cooling water mass flow rate. The green line represents the design value of the cooling water mass flow rate of 7697.61 kg/s. The deviation between the optimal and design mass flow rates first decreased and then increased as the power level decreased. At higher power levels, the net power can be significantly improved by using the optimal cooling water mass flow rate. As an illustration, when the cooling water inlet temperature was 16 °C and the cooling water mass flow rate was reduced to the optimal mass flow rate under 30% RC, the unit’s net power increased by 96.62 kW. This increase translates to an additional 96.62 MWh of electricity output for every 1000 h of operation at 30% RC. Furthermore, a comparison of
Figure 18a,b reveals that the optimal cooling water mass flow rates under the two temperature conditions were relatively close.
.
5. Conclusions
The study utilised EBSILON software to establish and validate the thermal model of the secondary circuit in an MHTGR NPP. Variable operating condition simulations were performed across the full power range of stable operation of the NPP, using net power, cycle efficiency, and heat consumption rate as thermal performance evaluation indicators. A wider spectrum of cooling water inlet temperatures was selected, and the effects of both the inlet temperature and mass flow rate on the system’s thermal performance were studied in detail. Taking the maximum net power as the optimisation goal, the optimal cooling water mass flow rate for various power levels of the power plant was determined when the cooling water inlet temperature was 16 °C. Additionally, the optimal cooling water mass flow rate was determined for cooling water inlet temperatures of 16 °C and 33 °C under 100% RC. The following conclusions were drawn:
- (1)
Excessive cooling water inlet temperature causes a substantial elevation in condenser back pressure, resulting in a decline in the thermal performance of the unit. Particularly, at a cooling water inlet temperature of 33 °C, the condenser back pressure reached 10.8 kPa, which surpasses the design parameter of 4.5 kPa by a considerable 139.79%. Additionally, under both 100% and 30% RC, the net power decreased by 11.64 and 4.18 MW, respectively, and the cycle efficiencies decreased by 2.36% and 2.57%, respectively. Moreover, the heat consumption rate increased by 510.84 and 702.70 kJ/(kW·h). Furthermore, under 100% RC, a rise in the inlet temperature from 10 °C to 33 °C led to a reduction in the net power and cycle efficiency of the system by 0.67 MW and 0.14%, respectively, with the heat consumption rate escalating by 28.72 kJ/(kW·h) for every 1 °C increment.
- (2)
Within a certain range, the net power of the system first increased and then decreased as the cooling water mass flow rate increased. By considering the maximum net power as the optimisation goal, the optimal cooling water mass flow rate for various operating conditions can be determined. The findings indicated a nonlinear decrease in the optimal cooling water mass flow rate as the power level decreased.
- (3)
At a higher power level, appropriately increasing the cooling water mass flow rate can significantly increase the net power, whereas, at a lower power level, the cooling water mass flow rate must be reduced correspondingly to increase the net power. Taking cooling water inlet temperatures of 16 °C and 33 °C, respectively, when the mass flow rate increased from the design value to the optimal value under 100% RC, the net power increased by 1119.49 and 1032.96 kW, respectively.
In summary, this study demonstrated the qualitative and quantitative relationships between the cooling water parameters and evaluation indicators, providing a basis for evaluating the impact of high-temperature weather on the thermal performance of MHTGR NPPs. The optimisation of the cold-end system is a complex process that requires a comprehensive consideration of various factors and costs. This study considers maximum net power as the optimisation goal to obtain the optimal cooling water mass flow rate under different operating conditions, which can be used as a part of the cold-end system optimisation of MHTGR NPPs and provides a reference for power plant operation optimisation and economic improvement.


