

Predicting Residential Photovoltaic Adoption Intention of Potential Prosumers in Thailand: A Theory of Planned Behavior Model

Abstract
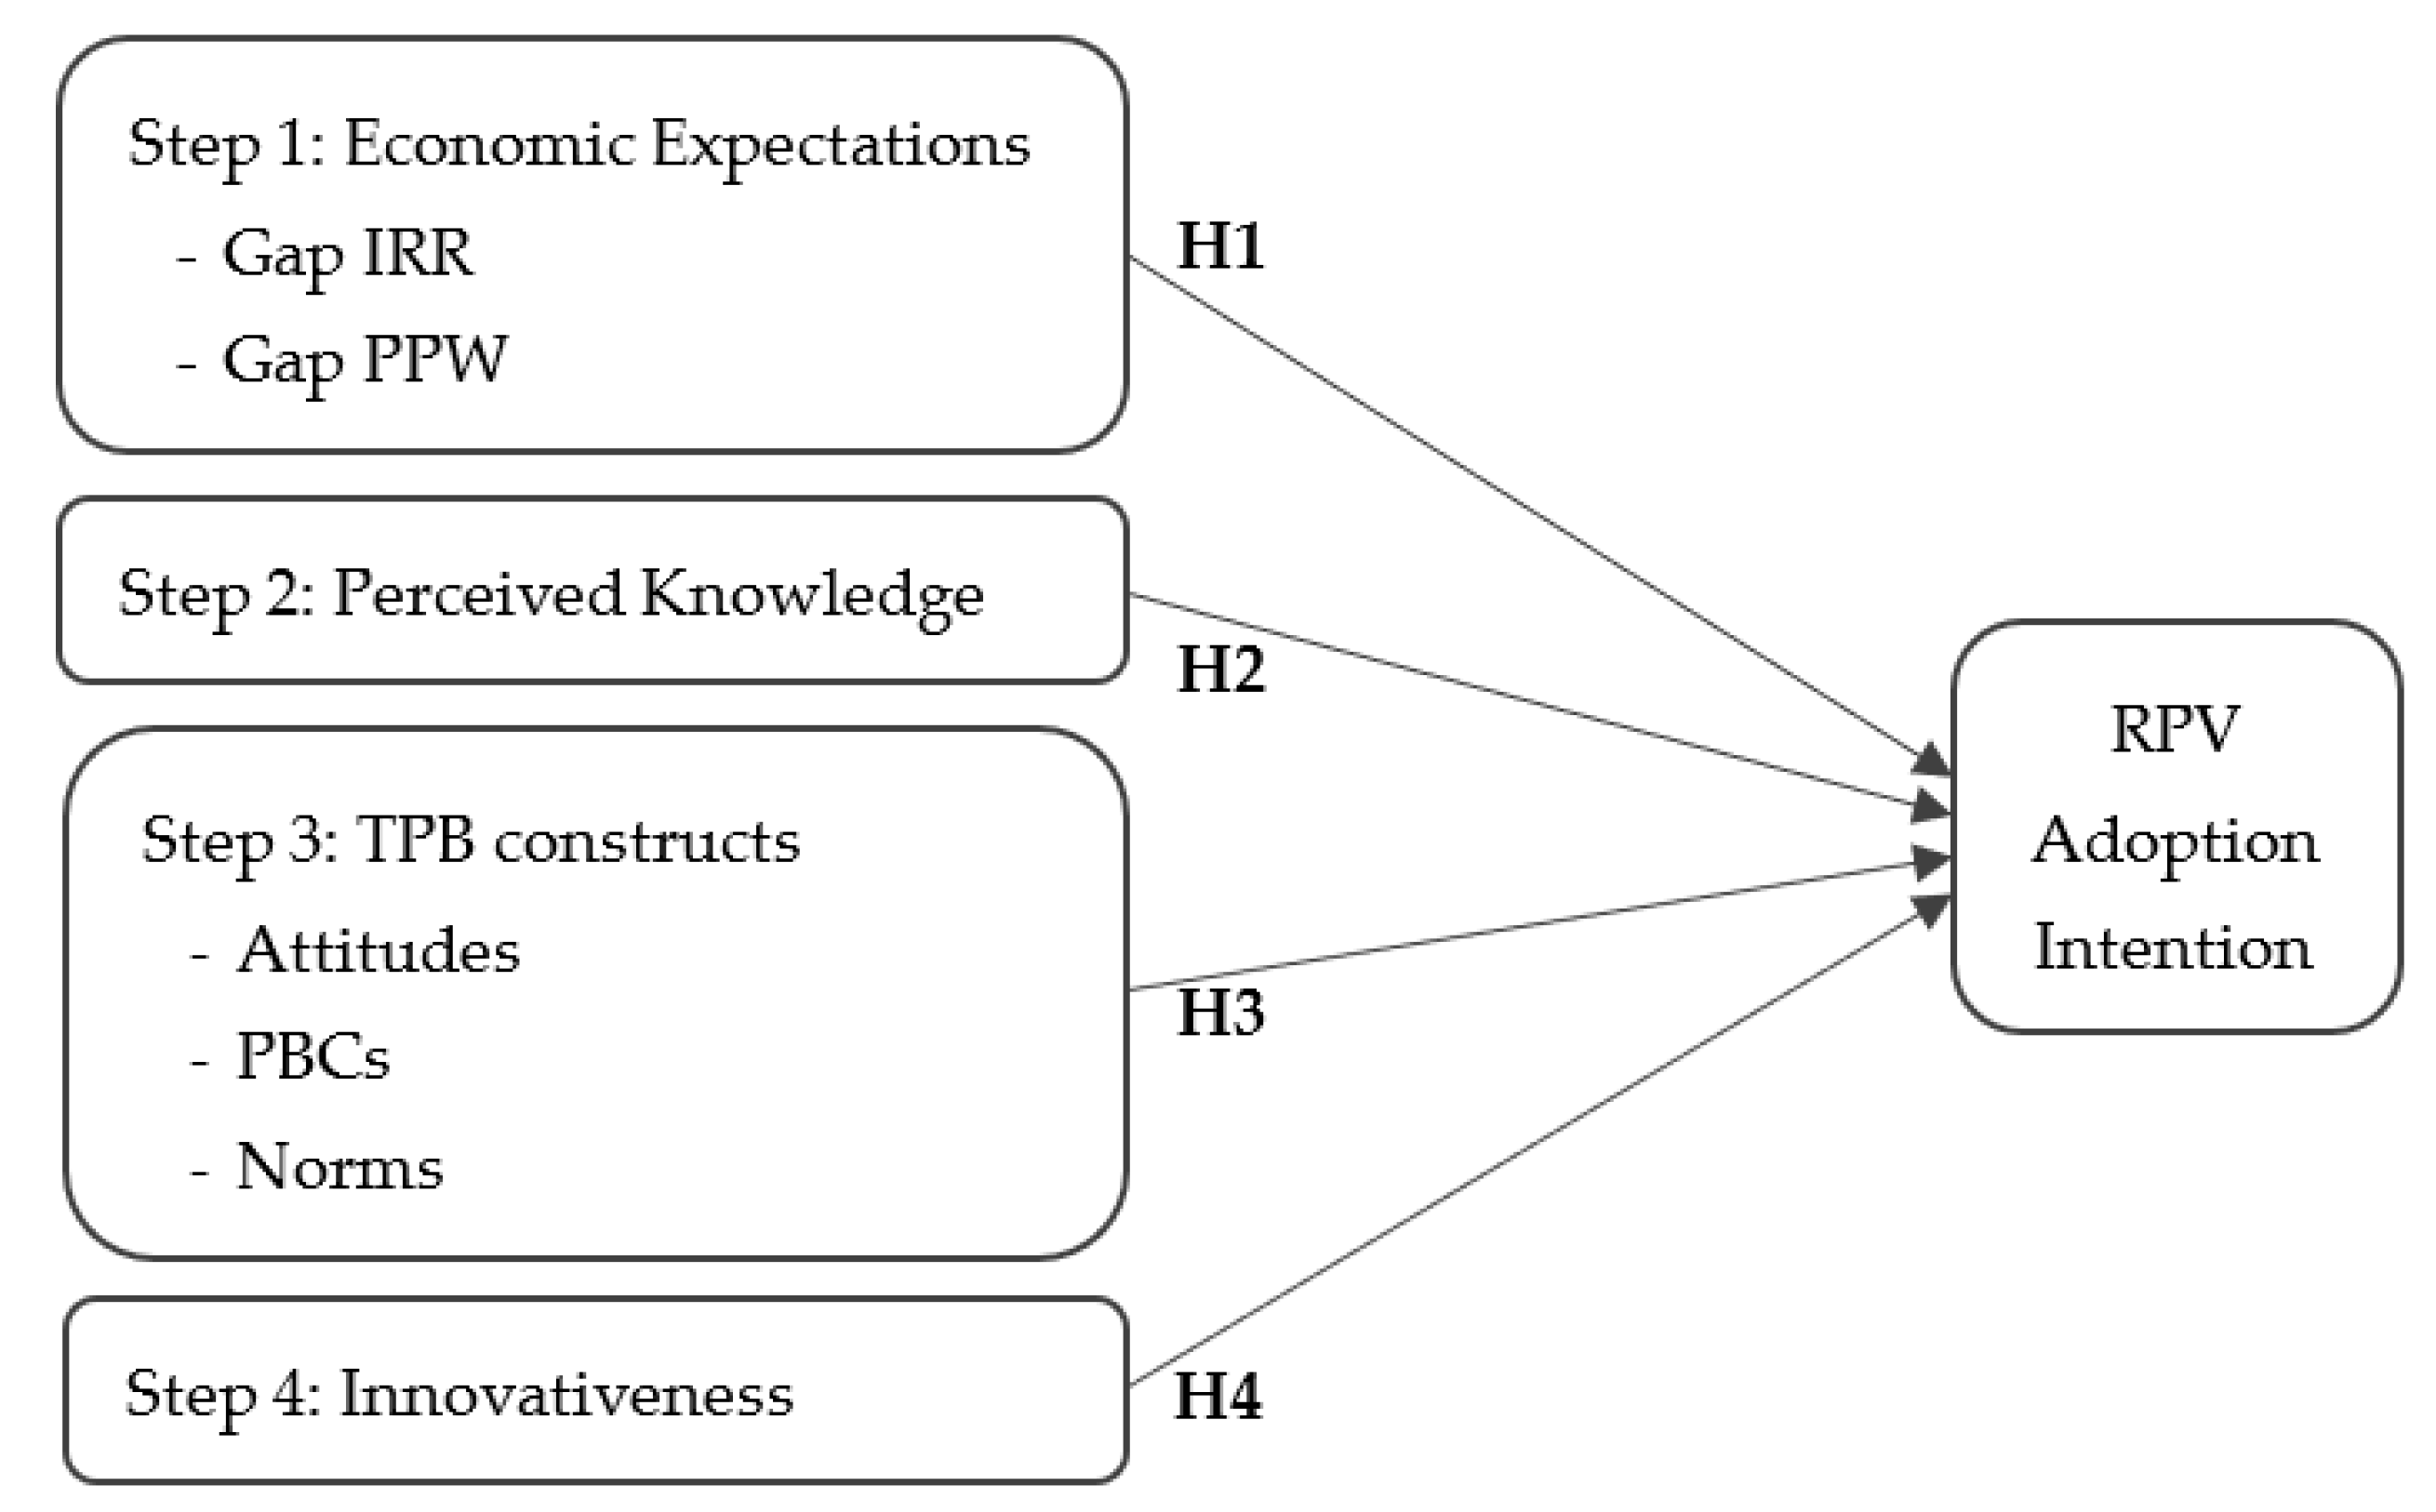
:1. Introduction
1.1. Economic Expectations
1.2. Perceived Knowledge
1.3. Behavioral and Socio-Psychological Factors
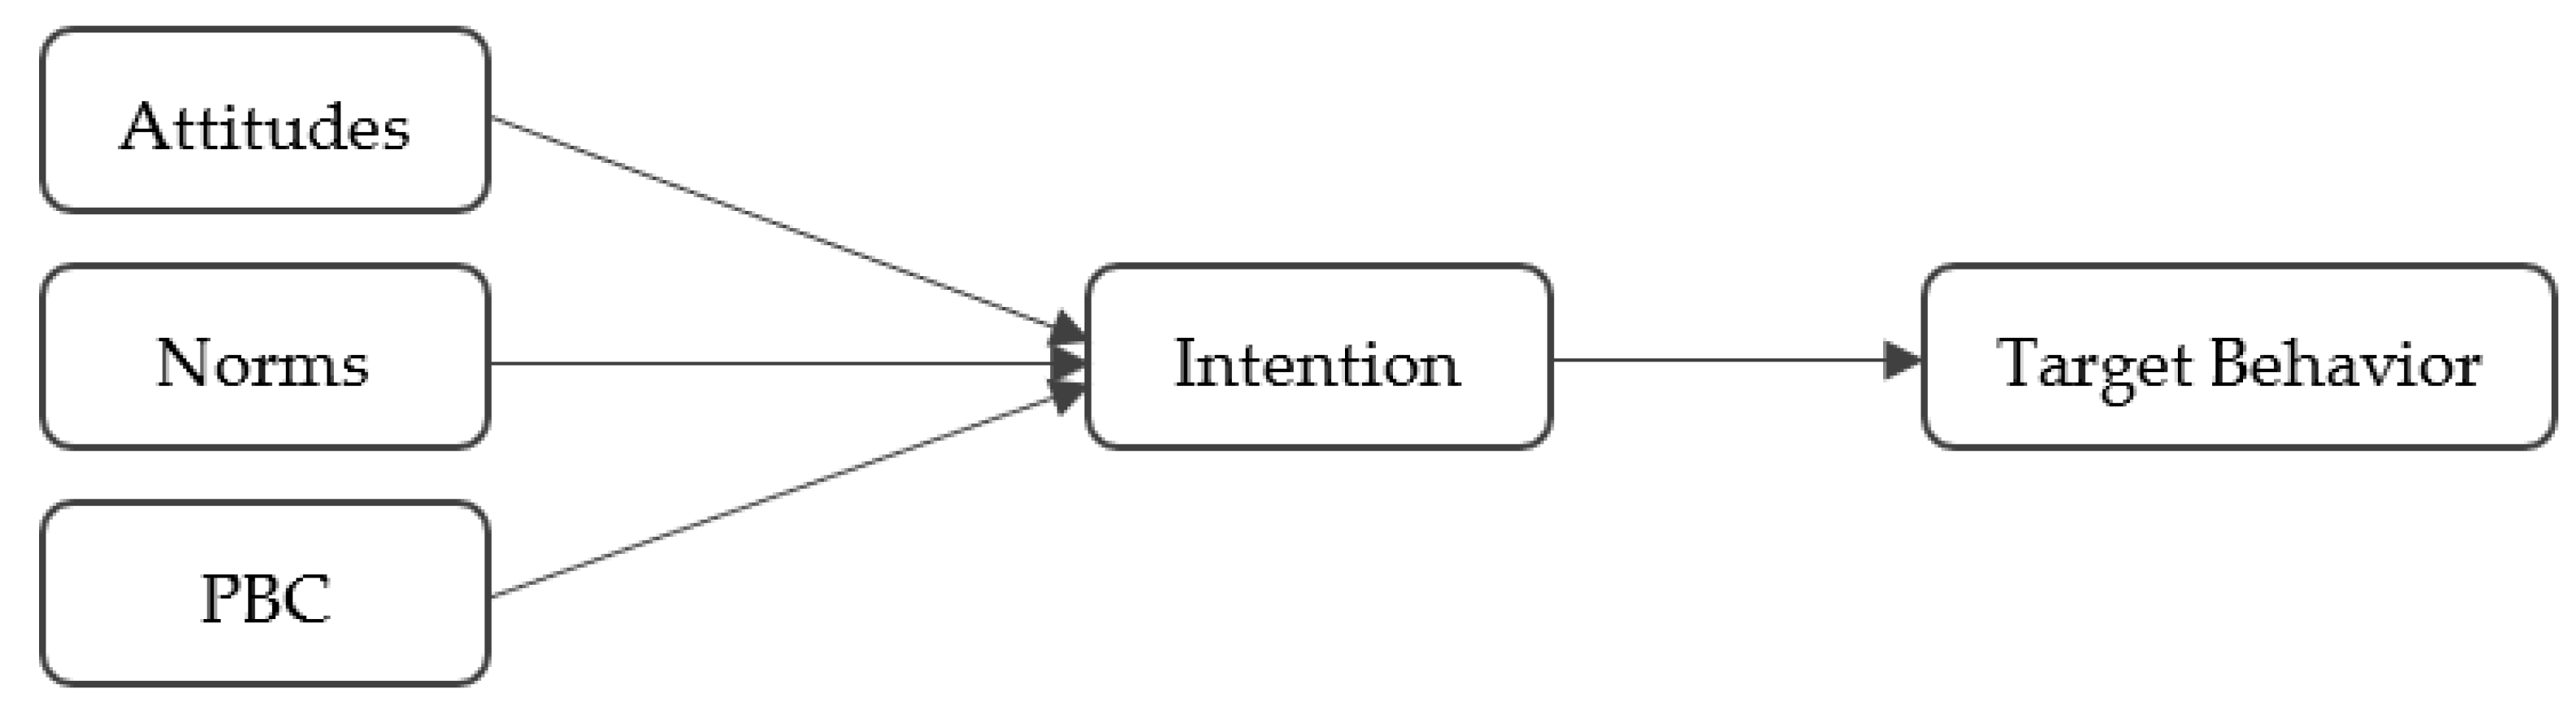
1.3.1. Theory of Planned Behavior
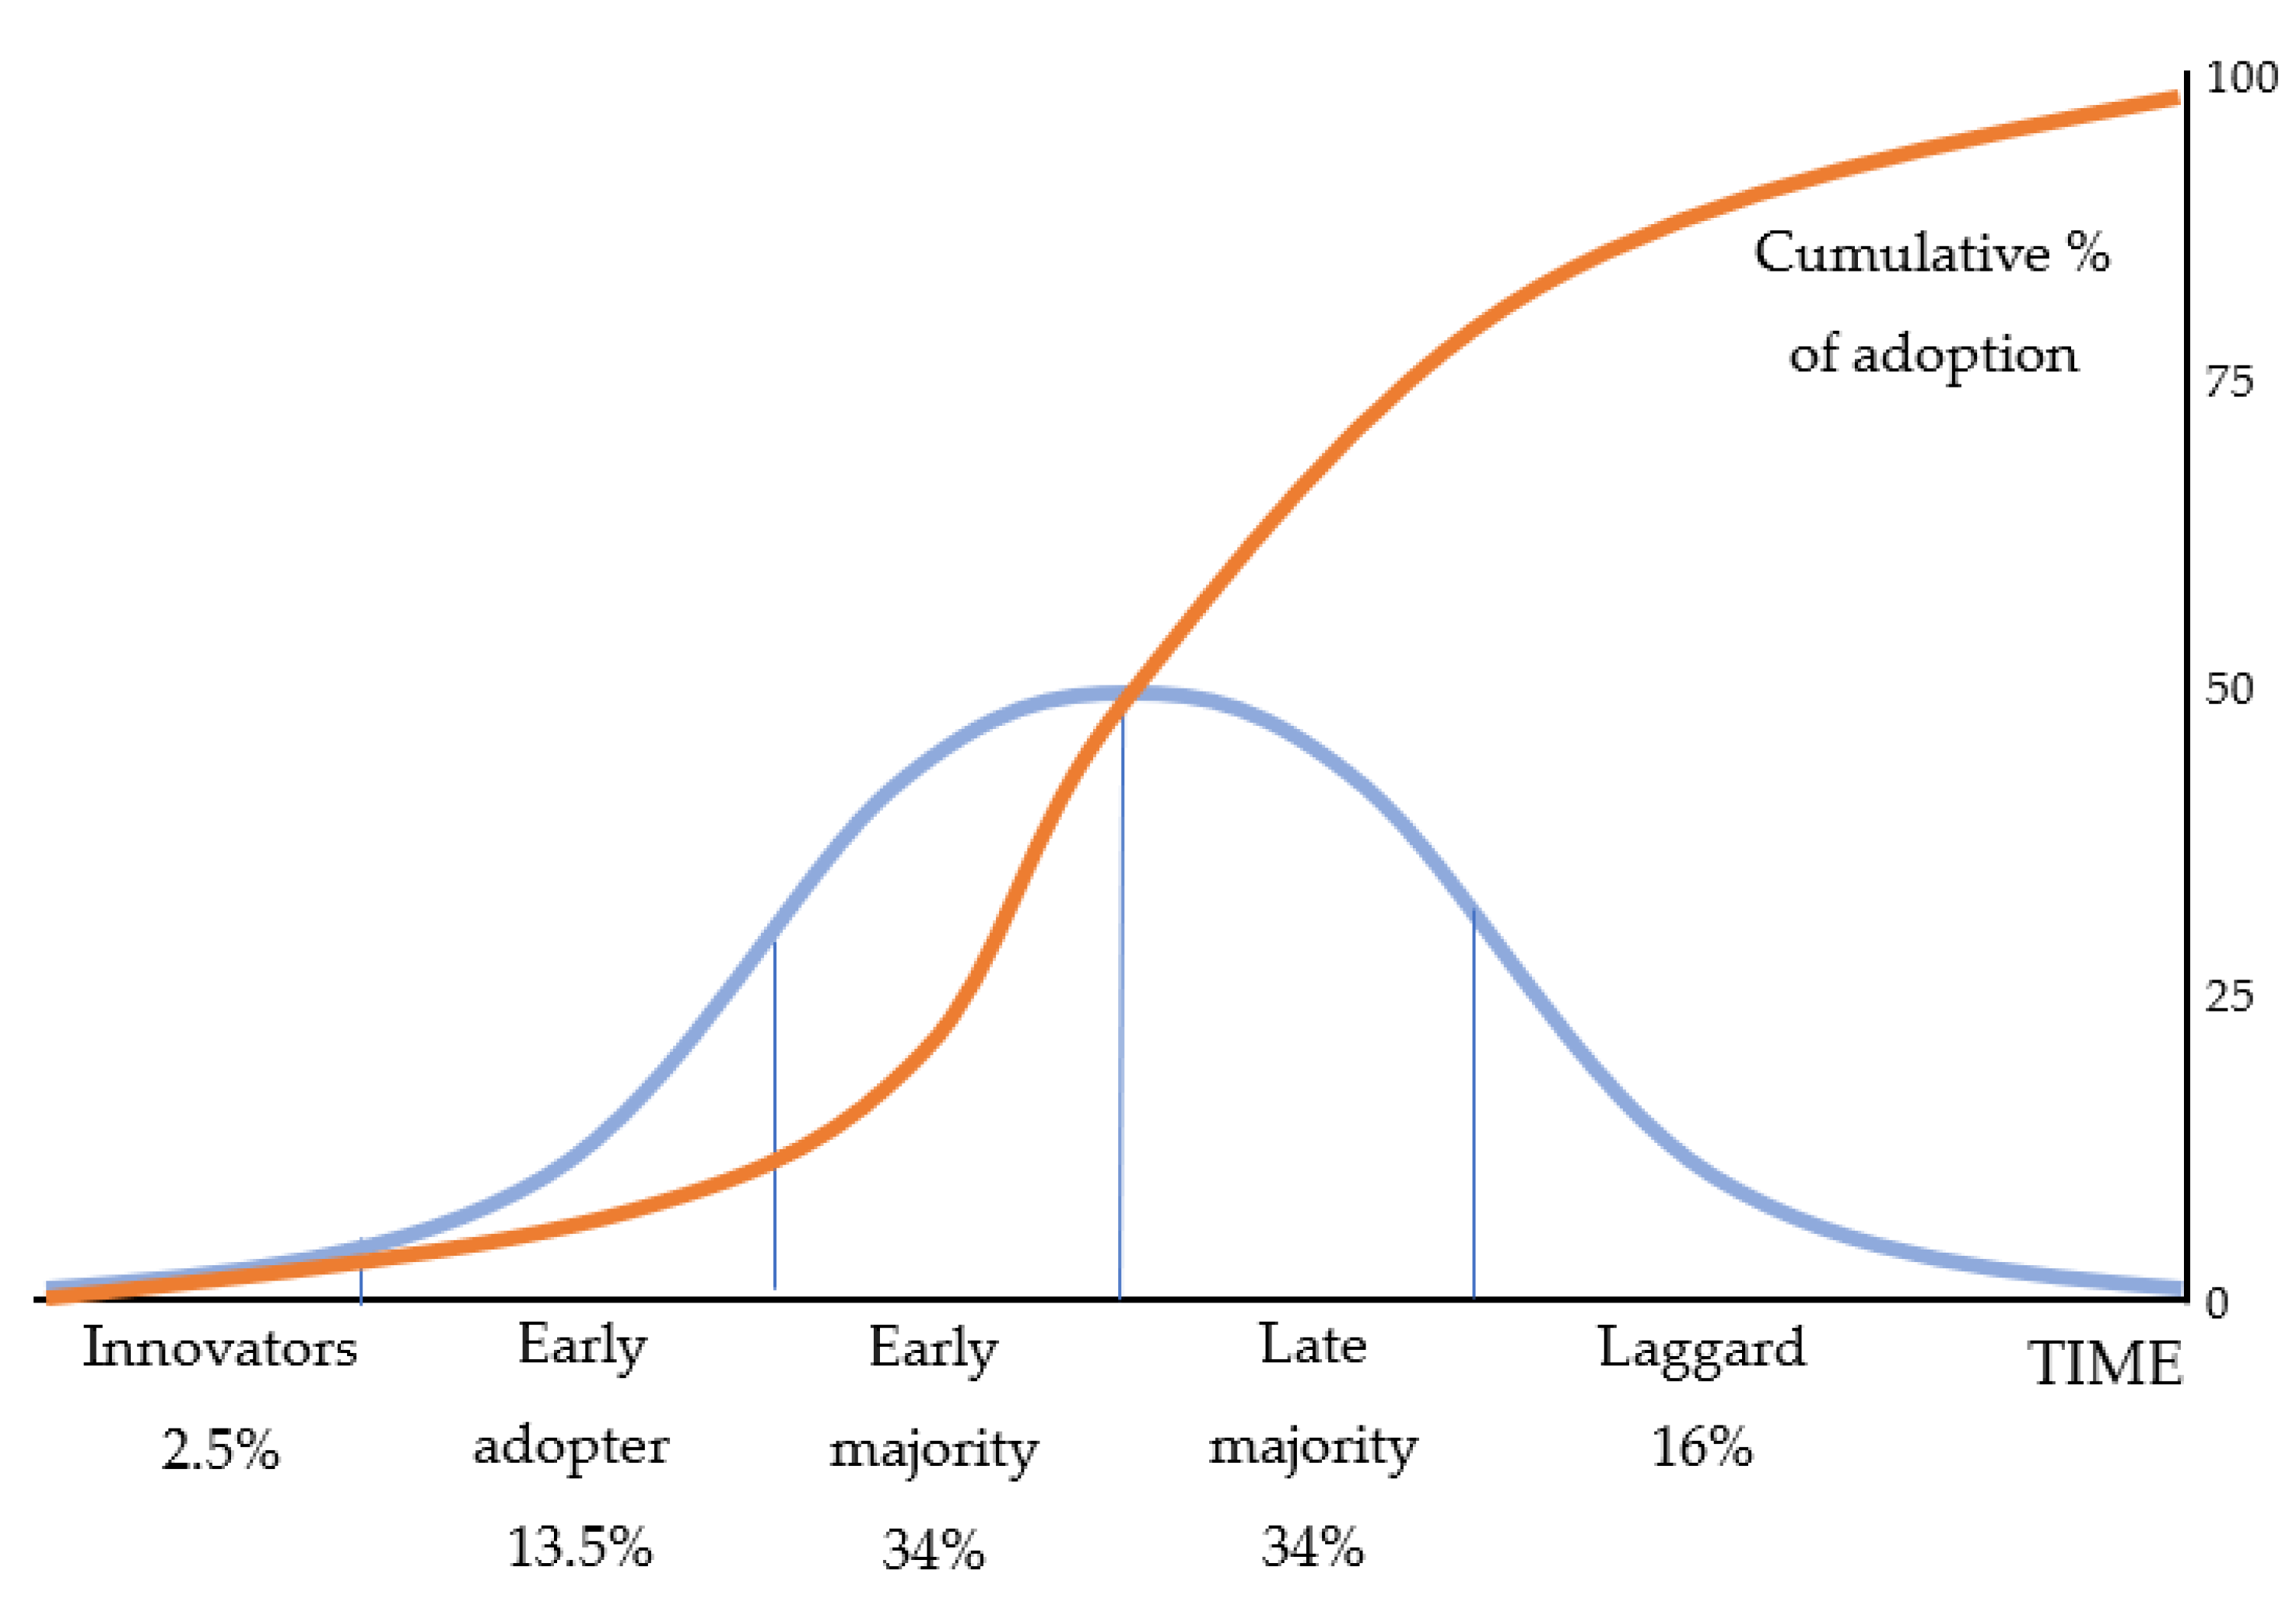
1.3.2. Diffusion of Innovation and Consumer Innovativeness
2. Materials and Methods
2.1. Participants
2.2. Materials
3. Results
4. Discussion
4.1. Interpretation of the Findings
4.2. Implications
4.3. Strength, Limitations, and Future Research
5. Conclusions
Author Contributions
Funding
Data Availability Statement
Conflicts of Interest
Nomenclature
| b | Regression coefficient |
| CI | Confidence interval |
| Cronbach’s α | Internal consistency reliability index |
| Current IRR | Current market internal rate of return of a PV system at the time of the study |
| Current PPW | Current market price per Watt of a PV system at the time of the study |
| EFA | Exploratory factor analysis |
| EPPO | Energy Policy and Planning Office of Thailand |
| Expected IRR | Internal rate of return of a PV system implied by respondent’s expected yearly income generated by a PV system. |
| Gap IRR | Current IRR − Expected IRR |
| Gap PPW | Max PPW − Current PPW |
| IRR | Internal rate of return. |
| LL | Lower limit of a confidence interval |
| M | Mean |
| Max PPW | Maximum price per Watt of a PV system that a household could afford |
| N | Total sample size |
| p | Probability value (p-value) |
| PCB | Perceived behavioral control |
| PPW | Price per Watt. |
| PV | Photovoltaic. |
| r | Person’s correlation coefficient |
| R2 | Coefficient of determination; proportion of variance in the dependent variable explained by the model |
| RPV | Residential photovoltaic. |
| SD | Standard deviation |
| t | Student’s t-test |
| TPB | Theory of Planned Behavior |
| UL | Upper limit of a confidence interval |
| ∆R2 | Change in R2 between regression models. |
References
- Ministry of Energy. Thailand’s Power Development Plan; Ministry of Energy: Bangkok, Thailand, 2018. [Google Scholar]
- Kasikorn Thai Research Center. Krongkan Solar Pak Prachachon Triam Perm Attra Rubsue Faifa [The People’s Solar Power Campaign to Increase the Feed-In Tariffs]. Available online: https://www.kasikornresearch.com/th/analysis/k-social-media/Pages/Solar-cell-FB-080720.aspx (accessed on 9 August 2020).
- Green Network Thailand. Palang-Ngarn Leng Prub Kain Rubsue Solar Pak Prachachon Mai Lang Attra Rubsue Lasud Young Mai Jungjai [Ministry of Energy to Increase the Feed-In Tariffs to Motivate Participation in the People’s Solar Power Campaign]. Available online: https://www.greennetworkthailand.com/เกณฑ์-โซลาร์ภาคประชาชน/ (accessed on 9 August 2020).
- Stern, P.C. Blind spots in policy analysis: What economics doesn’t say about energy use. J. Policy Anal. Manag. 1986, 5, 200–227. [Google Scholar] [CrossRef]
- Kokchang, K.; Tongsopit, S.; Junlakarn, S.; Wibulpolprasert, W.; Tossabanyad, M. Stakeholders’ perspectives of design options for a rooftop solar PV self-consumption scheme in Thailand. Appl. Environ. Res. 2018, 40, 42–54. [Google Scholar] [CrossRef]
- Tongsopit, S.; Chaitusaney, S.; Limmanee, A.; Kittner, N.; Hoontrakul, P. Scaling up Solar PV: A Roadmap for Thailand; Energy Research Institute, Chulalongkorn University: Bangkok, Thailand, 2015. [Google Scholar]
- Tongsopit, S.; Junlakarn, S.; Wibulpolprasert, W.; Chaianong, A.; Kokchang, P.; Hoang, N.V. The economics of solar PV self-consumption in Thailand. Renew. Energy 2019, 138, 395–408. [Google Scholar] [CrossRef]
- Chaianong, A.; Bangviwat, A.; Menke, C. Forecast of rooftop PV adoption in Thailand. Sci. Technol. Asia 2019, 24, 13–41. [Google Scholar]
- Wilson, R.; Toby, C.; Galen, L.B.; David, J.; Giles, P.; Emily, C.; Andy, B.; Holly, W.; Henry, B. Residential Prosumers: Drivers and Policy Options (Re-Prosumers); International Energy Agency (IEA)–Renewable Energy Technology Deployment: Paris, France, 2014. [Google Scholar]
- Karakaya, E.; Sriwannawit, P. Barriers to the adoption of photovoltaic systems: The state of the art. Renew. Sustain. Energy Rev. 2015, 49, 60–66. [Google Scholar] [CrossRef]
- Balcombe, P.; Rigby, D.; Azapagic, A. Investigating the importance of motivations and barriers related to microgeneration uptake in the UK. Appl. Energy 2014, 130, 403–418. [Google Scholar] [CrossRef]
- Balcombe, P.; Rigby, D.; Azapagic, A. Motivations and barriers associated with adopting microgeneration energy technologies in the UK. Renew. Sustain. Energy Rev. 2013, 22, 655–666. [Google Scholar] [CrossRef]
- Wolske, K.S.; Stern, P.C.; Dietz, T. Explaining interest in adopting residential solar photovoltaic systems in the United States: Toward an integration of behavioral theories. Energy Res. Soc. Sci. 2017, 25, 134–151. [Google Scholar] [CrossRef]
- Kotilainen, K.; Saari, U.A. Policy influence on consumers’ evolution into prosumers–Empirical findings from an exploratory survey in Europe. Sustainability 2018, 10, 186. [Google Scholar] [CrossRef]
- Palm, J. Household installation of solar panels–Motives and barriers in a 10-year perspective. Energy Policy 2018, 113, 1–8. [Google Scholar] [CrossRef]
- Khan, I. Drivers, enablers, and barriers to prosumerism in Bangladesh: A sustainable solution to energy poverty? Energy Res. Soc. Sci. 2019, 55, 82–92. [Google Scholar] [CrossRef]
- Campos, I.; Marín-González, E.; Luz, G.; Barroso, J.; Oliveira, N. Renewable energy prosumers in Mediterranean viticulture social–ecological systems. Sustainability 2019, 11, 6781. [Google Scholar] [CrossRef]
- Zhang, X.; Shen, L.; Chan, S.Y. The diffusion of solar energy use in HK: What are the barriers? Energy Policy 2012, 41, 241–249. [Google Scholar] [CrossRef]
- Jager, W. Stimulating the diffusion of photovoltaic systems: A behavioural perspective. Energy Policy 2006, 34, 1935–1943. [Google Scholar] [CrossRef]
- Rai, V.; Robinson, S.A. Effective information channels for reducing costs of environmentally- friendly technologies: Evidence from residential PV markets. Environ Res. Lett. 2013, 8, 014044. [Google Scholar] [CrossRef]
- Rebane, K.L.; Barham, B.L. Knowledge and adoption of solar home systems in rural Nicaragua. Energy Policy 2011, 39, 3064–3075. [Google Scholar] [CrossRef]
- Koinegg, J.; Brudermann, T.; Posch, A.; Mrotzek, M. “It would be a shame if we did not take advantage of the spirit of the times …”: An analysis of prospects and barriers of building integrated photovoltaics. Gaia 2013, 22, 39–45. [Google Scholar] [CrossRef]
- D’Agostino, A.L.; Sovacool, B.K.; Bambawale, M.J. And then what happened? A retrospective appraisal of China’s Renewable Energy Development Project (REDP). Renew. Energy 2011, 36, 3154–3165. [Google Scholar] [CrossRef]
- Erdem, C.; Şentürk, İ.; Şimşek, T. Identifying the factors affecting the willingness to pay for fuel-efficient vehicles in Turkey: A case of hybrids. Energy Policy 2010, 38, 3038–3043. [Google Scholar] [CrossRef]
- Yang, J.; Chen, F. How are social-psychological factors related to consumer preferences for plug-in electric vehicles? Case studies from two cities in China. Renew. Sustain. Energy Rev. 2021, 149, 111325. [Google Scholar] [CrossRef]
- Wang, J.; Liu, F.; Li, L.; Zhang, J. More than innovativeness: Comparing residents’ motivations for participating renewable energy communities in different innovation segments. Renew. Energy 2022, 197, 552–563. [Google Scholar] [CrossRef]
- Park, C.; Jeong, M. A study of factors influencing on passive and active acceptance of home energy management services with internet of things. Energies 2021, 14, 3631. [Google Scholar] [CrossRef]
- Zhang, N.; Hwang, B.-G.; Lu, Y.; Ngo, J. A Behavior theory integrated ANN analytical approach for understanding households adoption decisions of residential photovoltaic (RPV) system. Technol. Soc. 2022, 70, 102062. [Google Scholar] [CrossRef]
- Ajzen, I. The theory of planned behavior. Organ. Behav. Hum. Decis. Process. 1991, 50, 179–211. [Google Scholar] [CrossRef]
- Fishbein, M.; Ajzen, I. Predicting and Changing Behavior: The Reasoned Action Approach; Psychology Press: New York, NY, USA, 2009. [Google Scholar]
- Stikvoort, B.; Bartusch, C.; Juslin, P. Different strokes for different folks? Comparing pro-environmental intentions between electricity consumers and solar prosumers in Sweden. Energy Res. Soc. Sci. 2020, 69, 101552. [Google Scholar] [CrossRef]
- Korcaj, L.; Hahnel, U.J.J.; Spada, H. Intentions to adopt photovoltaic systems depend on homeowners’ expected personal gains and behavior of peers. Renew. Energy 2015, 75, 407–415. [Google Scholar] [CrossRef]
- Rai, V.; Beck, A.L. Public perceptions and information gaps in solar energy in Texas. Environ. Res. Lett. 2015, 10, 074011. [Google Scholar] [CrossRef]
- Schulte, E.; Scheller, F.; Sloot, D.; Bruckner, T. A meta-analysis of residential PV adoption: The important role of perceived benefits, intentions and antecedents in solar energy acceptance. Energy Res. Soc. Sci. 2022, 84, 102339. [Google Scholar] [CrossRef]
- Engelken, M.; Römer, B.; Drescher, M.; Welpe, I. Why homeowners strive for energy self-supply and how policy makers can influence them. Energy Policy 2018, 117, 423–433. [Google Scholar] [CrossRef]
- Faiers, A.; Neame, C. Consumer attitudes towards domestic solar power systems. Energy Policy 2006, 34, 1797–1806. [Google Scholar] [CrossRef]
- Hackbarth, A.; Löbbe, S. Attitudes, preferences, and intentions of German households concerning participation in peer-to-peer electricity trading. Energy Policy 2020, 138, 111238. [Google Scholar] [CrossRef]
- Wittenberg, I.; Matthies, E. Solar policy and practice in Germany: How do residential households with solar panels use electricity? Energy Res. Soc. Sci. 2016, 21, 199–211. [Google Scholar] [CrossRef]
- Palm, J.; Tengvard, M. Motives for and barriers to household adoption of small-scale production of electricity: Examples from Sweden. Sustain: Sci. Pract. Policy 2011, 7, 6–15. [Google Scholar] [CrossRef]
- Palm, A. Peer effects in residential solar photovoltaics adoption–A mixed methods study of Swedish users. Energy Res. Soc. Sci. 2017, 26, 1–10. [Google Scholar] [CrossRef]
- Schelly, C. Residential solar electricity adoption: What motivates, and what matters? A case study of early adopters. Energy Res. Soc. Sci. 2014, 2, 183–191. [Google Scholar] [CrossRef]
- Rogers, E.M. Diffusion of Innovations, 5th ed.; Free Press: New York, NY, USA, 2003. [Google Scholar]
- Bollinger, B.; Gillingham, K. Peer effects in the diffusion of solar photovoltaic panels. Mark. Sci. 2012, 31, 900–912. [Google Scholar] [CrossRef]
- Ramirez, E.; Goldsmith, R.E. Some antecedents of price sensitivity. J. Mark. Theory Pract. 2014, 17, 199–214. [Google Scholar] [CrossRef]
- Goldsmith, R.E.; Flynn, L.R.; Kim, D. Status consumption and price sensitivity. J. Mark. Theory. Pract. 2014, 18, 323–338. [Google Scholar] [CrossRef]
- Konuk, F.A. Consumers’ willingness to buy and willingness to pay for fair trade food: The influence of consciousness for fair consumption, environmental concern, trust and innovativeness. Food Res. Int. 2019, 120, 141–147. [Google Scholar] [CrossRef]
- Natarajan, T.; Balasubramanian, S.A.; Kasilingam, D.L. Understanding the intention to use mobile shopping applications and its influence on price sensitivity. J. Retail. Consum. 2017, 37, 8–22. [Google Scholar] [CrossRef]
- Zhang, F.; Sun, S.; Liu, C.; Chang, V. Consumer innovativeness, product innovation and smart toys. Electron. Commer. Res. Appl. 2020, 41, 100974. [Google Scholar] [CrossRef]
- Yamamoto, Y. Opinion leadership and willingness to pay for residential photovoltaic systems. Energy Policy 2015, 83, 185–192. [Google Scholar] [CrossRef]
- Energy Policy and Planning Office. Study of Electricity Supply Industry’s Structure Enhancement to Support Penetration of Prosumer; Ministry of Energy: Bangkok, Thailand, 2019. [Google Scholar]
- Nunnally, J.C.; Bernstein, I.H. Psychometric Theory, 3rd ed.; McGraw-Hill: New York, NY, USA, 1994. [Google Scholar]
- Manager Online. Krasaung Palang-Ngarn Pid Pratu Rubsue Fai Jak Palang-Ngarn Munwiean Yao Ha Pi Wen Khafai Tum Jing [Ministry of Energy Puts a Five-Year Hold on Renewable Power Electricity Buy-Back Program unless the Price Matches the Wholesale Electricity Price]. Available online: https://mgronline.com/business/detail/9610000030259 (accessed on 9 August 2020).
- Grębosz-Krawczyk, M.; Zakrzewska-Bielawska, A.; Glinka, B.; Glińska-Neweś, A. Why do consumers choose photovoltaic panels? Identification of the factors influencing consumers’ choice behavior regarding photovoltaic panel installations. Energies 2021, 14, 2674. [Google Scholar] [CrossRef]
- National Statistics Office of Thailand. Statistics of Household Income and Expenditure and Their Distribution. 2020. Available online: http://statbbi.nso.go.th/staticreport/page/sector/en/08.aspx (accessed on 9 August 2020).
- Sreenath, S.; Azmi, A.M.; Dahlan, N.Y.; Sudhakar, K. A decade of solar PV deployment in ASEAN: Policy landscape and recommendations. Energy Rep. 2022, 8, 460–469. [Google Scholar] [CrossRef]
- IEA-PVPS. National Survey Report of PV Power Applications in Thailand; IEA-PVPS: Bangkok, Thailand, 2021. [Google Scholar]
- Sun, P.-C.; Wang, H.-M.; Huang, H.-L.; Ho, C.-W. Consumer attitude and purchase intention toward rooftop photovoltaic installation: The roles of personal trait, psychological benefit, and government incentives. Energy Environ. 2018, 31, 21–39. [Google Scholar] [CrossRef]
- Rai, V.; Robinson, S.A. Agent-based modeling of energy technology adoption: Empirical integration of social, behavioral, economic, and environmental factors. Environ. Model Softw. 2015, 70, 163–177. [Google Scholar] [CrossRef]
- Visser, P.S.; Krosnick, J.A.; Norris, C.J. Attitude importance and attitude-relevant knowledge: Motivator and enabler. In Political Psychology: New Explorations; Frontiers of Social Psychology; Routledge/Taylor & Francis Group: New York, NY, USA, 2017; pp. 203–245. [Google Scholar]
- Putria, A.N.; Tjungandib, M.; Pavitac, N.; Prayogad, S. Psychological and social determinants that influence Interest in residential photovoltaic (RPV). Indones. Bus. Rev. 2019, 2, 82–101. [Google Scholar] [CrossRef]


| n | % | |
|---|---|---|
| Gender | ||
| Female | 464 | 61.05 |
| Male | 288 | 37.89 |
| Unspecified | 6 | 0.79 |
| Missing | 2 | 0.26 |
| Electricity User Tier | ||
| Below 150 unit/month | 203 | 26.71 |
| Above 150 unit/month | 557 | 73.29 |
| Region | ||
| Bangkok and metropolitan area | 379 | 49.87 |
| Central | 89 | 11.71 |
| South | 96 | 12.63 |
| North | 97 | 12.76 |
| Northeastern | 99 | 13.03 |
| Self-identified Innovativeness | ||
| 1 Innovators | 50 | 6.58 |
| 2 Early adopters | 92 | 12.11 |
| 3 Early Majority | 299 | 39.34 |
| 4 Late Majority | 184 | 24.21 |
| 5 Laggards | 135 | 17.76 |
| Perceived Knowledge (Cronbach’s α = 0.96) | Items |
|---|---|
| 0 = Not at all 1 = Limited 2 = Moderate 3 = Advanced 4 = Complete knowledge or understanding | How much do you know or understand the following information? |
| |
| |
| |
| |
| |
| |
| |
| |
| |
|
| TPB Constructs and Response Options | Dimensions and Items | EFA Factor Loadings |
|---|---|---|
| Attitudes 0 = strongly disagree 1 = disagree 2 = neutral 3 = agree 4 = strongly agree | To me, RPV …Perceived Financial benefits (Cronbach’s α = 0.80)
| |
| 0.936 | ||
| 0.589 | ||
| 0.624 | ||
| 0.589 | ||
Perceived Environmental benefits (Cronbach’s α = 0.87)
| ||
| 0.845 | ||
| 0.916 | ||
| 0.804 | ||
Perceived Image benefit
| ||
| −0.727 | ||
| PBCs 0 = strongly disagree 1 = disagree 2 = neutral 3 = agree 4 = strongly agree | Perceived Troubles (Cronbach’s α = 0.72)
| |
| 0.941 | ||
| 0.757 | ||
Perceived Cost (Cronbach’s α = 0.77)
| ||
| −0.888 | ||
| −0.851 | ||
Perceived Inconvenience (Cronbach’s α = 0.77)
| ||
| 0.752 | ||
| 0.899 | ||
| 0.824 | ||
| Social Norms 0 = no 1 = yes | Social norms
| |
| - * | ||
| - * | ||
| - * |
| Categories | Descriptions |
|---|---|
| 1 = innovators | Actively follow news on technological advances and are usually among the first to adopt the most cutting-edge technology. |
| 2 = early adopters | Are among the first group to adopt a new technology when it becomes available on the market. |
| 3 = early majority | Adopt a new technology when a growing number of people are using it |
| 4 = late majority | Adopt a new technology only when it is proven effective by most people. |
| 5 = laggards | Are not interested in new technology. Prefer old and familiar technology. |
| Variable | M | SD | 1 | 2 | 3 | 4 | 5 | 6 | 7 | 8 | 9 | 10 | 11 |
|---|---|---|---|---|---|---|---|---|---|---|---|---|---|
| 1. RPV Adoption Intention | 1.85 | 1.04 | |||||||||||
| 2. Gap IRR | −21.45 | 25.72 | 0.17 ** | ||||||||||
| 3. Gap PPW | −10.92 | 12.84 | 0.24 ** | 0.24 ** | |||||||||
| 4. Perceived Knowledge | 0.81 | 0.92 | 0.06 | 0.02 | 0.11 ** | ||||||||
| 5. Perceived Financial Benefits | 2.51 | 0.85 | 0.28 ** | 0.11 ** | 0.12 ** | 0.16 ** | |||||||
| 6. Perceived Environmental Benefits | 3.10 | 0.90 | 0.19 ** | 0.13 ** | 0.08 * | 0.08 * | 0.66 ** | ||||||
| 7. Perceived Image Benefit | 2.66 | 1.11 | 0.12 ** | 0.06 | 0.05 | 0.14 ** | 0.41 ** | 0.51 ** | |||||
| 8. Perceived Troubles | 1.90 | 0.98 | −0.04 | −0.07 | −0.06 | 0.11 ** | 0.04 | 0.08 * | 0.16 ** | ||||
| 9. Perceived Cost | 2.45 | 0.98 | −0.11 ** | −0.04 | −0.09 * | 0.11 ** | 0.21 ** | 0.25 ** | 0.23 ** | 0.39 ** | |||
| 10. Perceived Inconvenience | 2.49 | 1.13 | −0.00 | −0.06 | −0.08 * | −0.00 | 0.24 ** | 0.27 ** | 0.22 ** | 0.35 ** | 0.49 ** | ||
| 11. Social Norm | 0.29 | 0.64 | 0.19 ** | 0.09 * | 0.14 ** | 0.16 ** | 0.16 ** | 0.18 ** | 0.05 | −0.14 ** | −0.02 | −0.01 | |
| 12. Innovativeness | 3.34 | 1.10 | −0.30 ** | −0.05 | −0.18 ** | −0.19 ** | −0.18 ** | −0.09 * | −0.06 | 0.00 | −0.01 | −0.00 | −0.17 ** |
| Variable | b | 95% CI for b | β | 95% CI for β | R2 | ∆R2 | ||
|---|---|---|---|---|---|---|---|---|
| LL | UL | LL | UL | |||||
| Step 1 | 0.07 | |||||||
| (Intercept) | 2.14 ** | 2.04 | 2.24 | |||||
| Gap IRR | 0.005 ** | 0.002 | 0.008 | 0.12 | 0.05 | 0.19 | ||
| Gap PPW | 0.02 ** | 0.01 | 0.02 | 0.21 | 0.14 | 0.28 | ||
| Step 2 | 0.071 | 0.001 | ||||||
| (Intercept) | 2.11 ** | 1.98 | 2.23 | |||||
| Gap IRR | 0.005 ** | 0.002 | 0.008 | 0.12 | 0.05 | 0.19 | ||
| Gap PPW | 0.02 ** | 0.01 | 0.02 | 0.21 | 0.13 | 0.28 | ||
| Perceived Knowledge | 0.04 | −0.04 | 0.11 | 0.03 | −0.04 | 0.1 | ||
| Step 3 | 0.166 | 0.095 ** | ||||||
| (Intercept) | 1.50 ** | 1.2 | 1.81 | |||||
| Gap IRR | 0.003 * | 0.001 | 0.006 | 0.09 | 0.02 | 0.15 | ||
| Gap PPW | 0.01 ** | 0.01 | 0.02 | 0.16 | 0.09 | 0.23 | ||
| Perceived Knowledge | −0.01 | −0.09 | 0.07 | −0.01 | −0.08 | 0.06 | ||
| Financial Attitude | 0.30 ** | 0.19 | 0.41 | 0.24 | 0.15 | 0.33 | ||
| Environmental Attitude | 0.005 | −0.11 | 0.11 | 0.004 | −0.09 | 0.1 | ||
| Image Attitude | 0.03 | −0.04 | 0.11 | 0.03 | −0.04 | 0.11 | ||
| Perceived Troubles | 0.04 | −0.04 | 0.12 | 0.04 | −0.03 | 0.11 | ||
| Perceived Cost | −0.19 ** | −0.27 | −0.11 | −0.18 | −0.26 | −0.10 | ||
| Perceived Inconvenience | 0.02 | −0.05 | 0.09 | 0.02 | −0.06 | 0.1 | ||
| Social Norm | 0.20 ** | 0.09 | 0.32 | 0.12 | 0.06 | 0.19 | ||
| Step 4 | 0.214 | 0.048 ** | ||||||
| (Intercept) | 2.30 ** | 1.92 | 2.68 | |||||
| Gap IRR | 0.004 * | 0.001 | 0.006 | 0.09 | 0.02 | 0.15 | ||
| Gap PPW | 0.01 ** | 0.005 | 0.02 | 0.13 | 0.06 | 0.19 | ||
| Perceived Knowledge | −0.05 | −0.12 | 0.03 | −0.04 | −0.11 | 0.03 | ||
| Financial Attitude | 0.25 ** | 0.15 | 0.36 | 0.21 | 0.12 | 0.29 | ||
| Environmental Attitude | 0.02 | −0.09 | 0.12 | 0.01 | −0.08 | 0.11 | ||
| Image Attitude | 0.04 | −0.03 | 0.11 | 0.04 | −0.04 | 0.12 | ||
| Perceived Troubles | 0.04 | −0.04 | 0.12 | 0.04 | −0.04 | 0.11 | ||
| Perceived Cost | −0.19 ** | −0.27 | −0.10 | −0.18 | −0.25 | −0.10 | ||
| Perceived Inconvenience | 0.02 | −0.05 | 0.09 | 0.02 | −0.05 | 0.1 | ||
| Social Norm | 0.16 ** | 0.05 | 0.27 | 0.1 | 0.03 | 0.17 | ||
| Innovativeness | −0.22 ** | −0.28 | −0.15 | −0.23 | −0.30 | −0.16 | ||
| Innovativeness Levels | b | 95% CI | |
|---|---|---|---|
| LL | UL | ||
| 1 = innovators | 0.10 | −0.27 | 0.47 |
| 2 = early adopters | 0.11 | −0.13 | 0.36 |
| 3 = early majority | 0.14 | −0.01 | 0.30 |
| 4 = late majority | 0.14 | −0.11 | 0.40 |
| 5 = laggards | 0.43 | 0.03 | 0.82 |
Disclaimer/Publisher’s Note: The statements, opinions and data contained in all publications are solely those of the individual author(s) and contributor(s) and not of MDPI and/or the editor(s). MDPI and/or the editor(s) disclaim responsibility for any injury to people or property resulting from any ideas, methods, instructions or products referred to in the content. |
© 2023 by the authors. Licensee MDPI, Basel, Switzerland. This article is an open access article distributed under the terms and conditions of the Creative Commons Attribution (CC BY) license (https://creativecommons.org/licenses/by/4.0/).
Share and Cite
Huansuriya, T.; Ariyabuddhiphongs, K. Predicting Residential Photovoltaic Adoption Intention of Potential Prosumers in Thailand: A Theory of Planned Behavior Model. Energies 2023, 16, 6337. https://doi.org/10.3390/en16176337
Huansuriya T, Ariyabuddhiphongs K. Predicting Residential Photovoltaic Adoption Intention of Potential Prosumers in Thailand: A Theory of Planned Behavior Model. Energies. 2023; 16(17):6337. https://doi.org/10.3390/en16176337
Chicago/Turabian StyleHuansuriya, Thipnapa, and Kris Ariyabuddhiphongs. 2023. "Predicting Residential Photovoltaic Adoption Intention of Potential Prosumers in Thailand: A Theory of Planned Behavior Model" Energies 16, no. 17: 6337. https://doi.org/10.3390/en16176337