1. Introduction
The interest in distributed generation (DG) sources in recent times is increasing worldwide because of the increasing power demand, high transmission losses, and high carbon footprints and GHG emissions produced by fossil-fuel-based energy generation sources. Similarly, some other technical reasons such as the diminishing of traditional energy sources, reliability issues in the distribution system (DS), deregulated energy market and cost constraints in the installation of the new generating plants, and the expansion of transmission lines are also forcing power utility companies to utilize DG sources for power generation. The International Energy Agency (IEA) describes DG as “a type of generating plant that is tied to the grid at the distribution level voltages to serve a customer on-site and at the same time to provide support to a distribution network” [
1]. DG sources include wind turbines, PV systems, fuel cells, small hydro generation plants, and reciprocating engines. The DG capacity varies from a few kilowatts up to tens of MW. DG sources are not centrally planned nor dispatched while connected to a DS. DG technologies are categorized based on the type of power they can deliver into the system. Reference [
2] categorized DG technologies into the following four types:
Type 1: It can only deliver active power into the system. Examples of type 1 DG include photovoltaic (PV), fuel cells, and microturbines.
Type 2: It can simultaneously deliver active and reactive power into the system. Type 2 DGs include doubly fed induction generators (DFIG) used in wind farms and synchronous generators.
Type 3: It can only deliver reactive power into the system. An example of a type 3 DG is synchronous compensators (gas turbines).
Type 4: It can deliver active power; however, it consumes reactive power from the system. An example of a type 4 DG is induction generators used in wind farms.
DG sources can be operated in parallel with the utility DS and can help power utility companies in achieving loss minimization, voltage profile improvement, reliability enhancement, peak load shaving, cost savings, and building sustainable energy infrastructure [
3]. However, the power produced from these sources is unstable, and DS operators face difficulty in integrating them into a DS [
4,
5]. DSs are designed to deliver power to end users and are passive in nature, but DG source integration makes them active DSs. Additionally, the power flow changes from unidirectional to bi-directional. The integration of DG sources into the utility DS needs to be effectively managed and controlled to ensure the reliable operation of the DS and utility grid stability. Thus, the relationship between the DG sources and utility DS is becoming important as DG plays a prominent role in the power distribution landscape, and proper coordination between them becomes essential for optimizing the overall system performance and ensuring sustainable and efficient power DS. Therefore, the optimal location and sizing of DG sources are of the utmost importance before integrating them with the utility grid. DG optimal location and sizing can mitigate power losses, improves voltage profile, minimizes the time period and frequency of interruptions in the system, and enhances utility grid reliability and end customer satisfaction [
6]. DG non-optimal location and sizing can lead to increased power losses and a rise in a voltage profile that directly affects the reliability of DSs [
7]. This issue arises because an increase in power losses can lead to reducing the operational efficiency of the DS by limiting the amount of power supplied to the end consumers, and voltage beyond the permissible limits creates frequency interruption problems in the system that can lead to malfunctioning and potential damage to the electrical equipment both in the utility DS and consumer premises that can negatively affect the DS reliability, as it is closely linked with the proper functioning of the utility DS and satisfying consumer electricity demand without any interruptions in the system.
Reliability can be described as “the ability of a system or equipment to perform its required function for a given period of time under steady-state conditions” [
8]. The reliability of a power system is vital because it ensures continuous power supply to the end users’ and customers’ satisfaction. Most of the reliability problems in power systems are because of the failures that occur in a DS which contributes to 80–90% of the power outages [
9], and DS reliability is always of concern for power utility companies and DS operators. Moreover, reliability analysis helps to identify the effectiveness of a DS and provides recommendations for new DS components needed to enhance the system’s reliability. Therefore, reliability is an essential aspect in the operation, planning, and designing of a DS and it needs to be addressed to provide the end users with highly reliable power and minimal interruptions.
Hence, research on the power losses and reliability estimation of a DS with DG sources is necessary to overcome the time period and frequency of interruptions in the system, to serve the end customers with a continuous power supply. When integrating DG sources into the system, the type, location, size, and number of DG units are design criteria that directly affect the power losses and DS reliability.
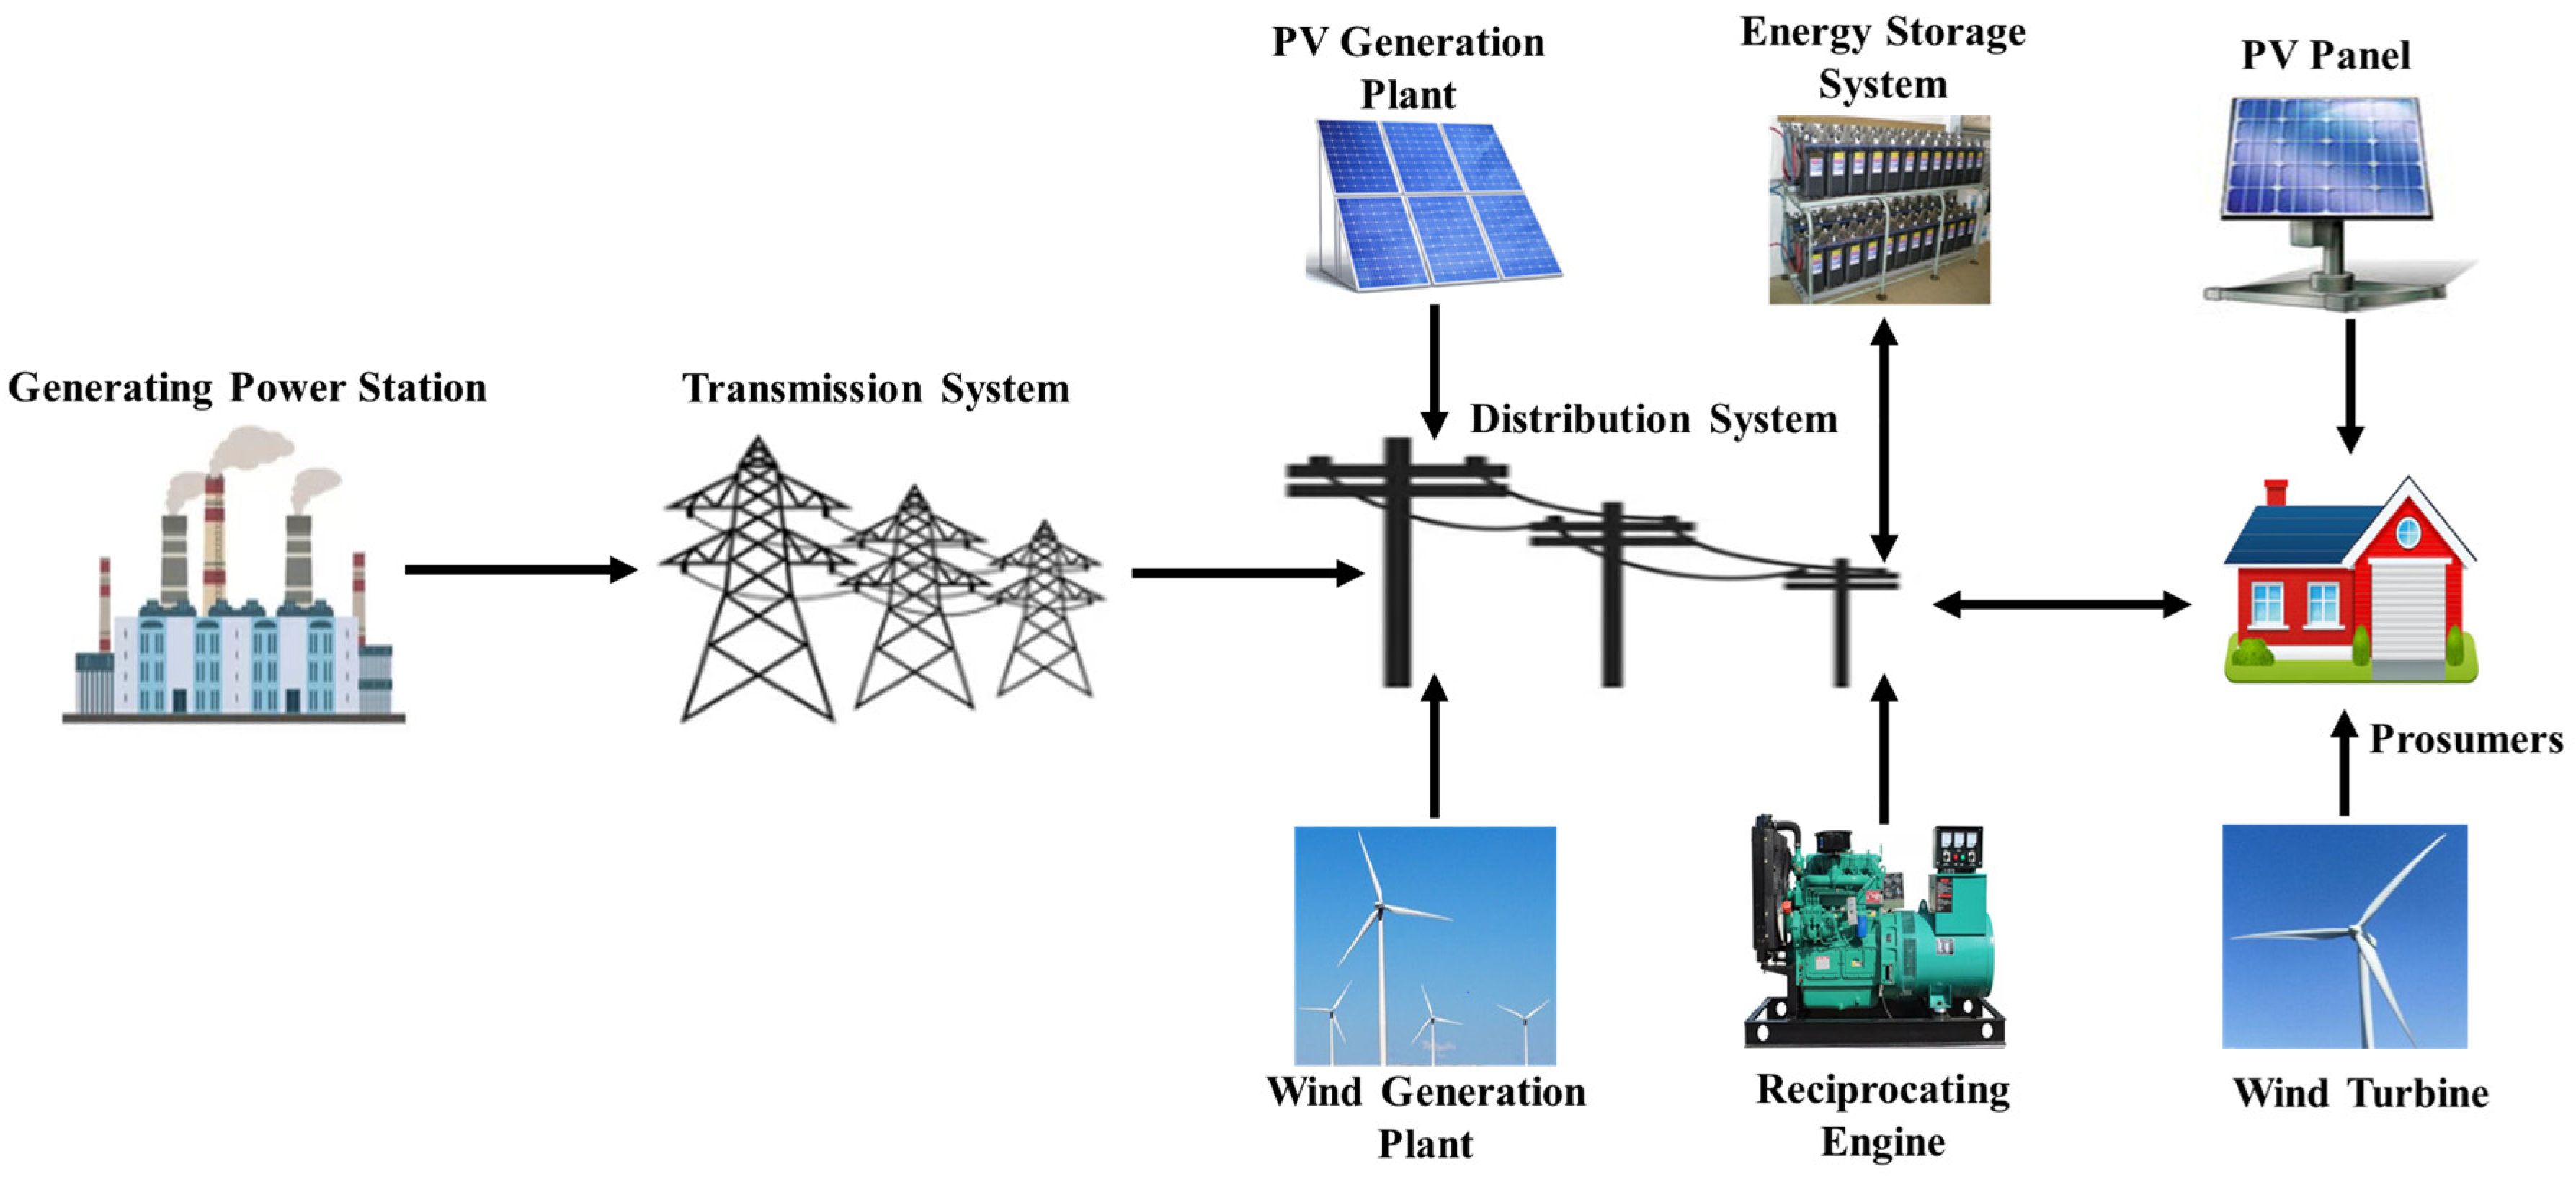
Figure 1 presents a typical power system model with DG sources integration at the DS.
This article is divided into seven sections. The remaining article is classified as follows:
Section 2 comprehensively explores the literature related to the proposed study and presents the problem formulation along with the contributions of the present study.
Section 3 explains the test system used in the study and the modifications made to the test system.
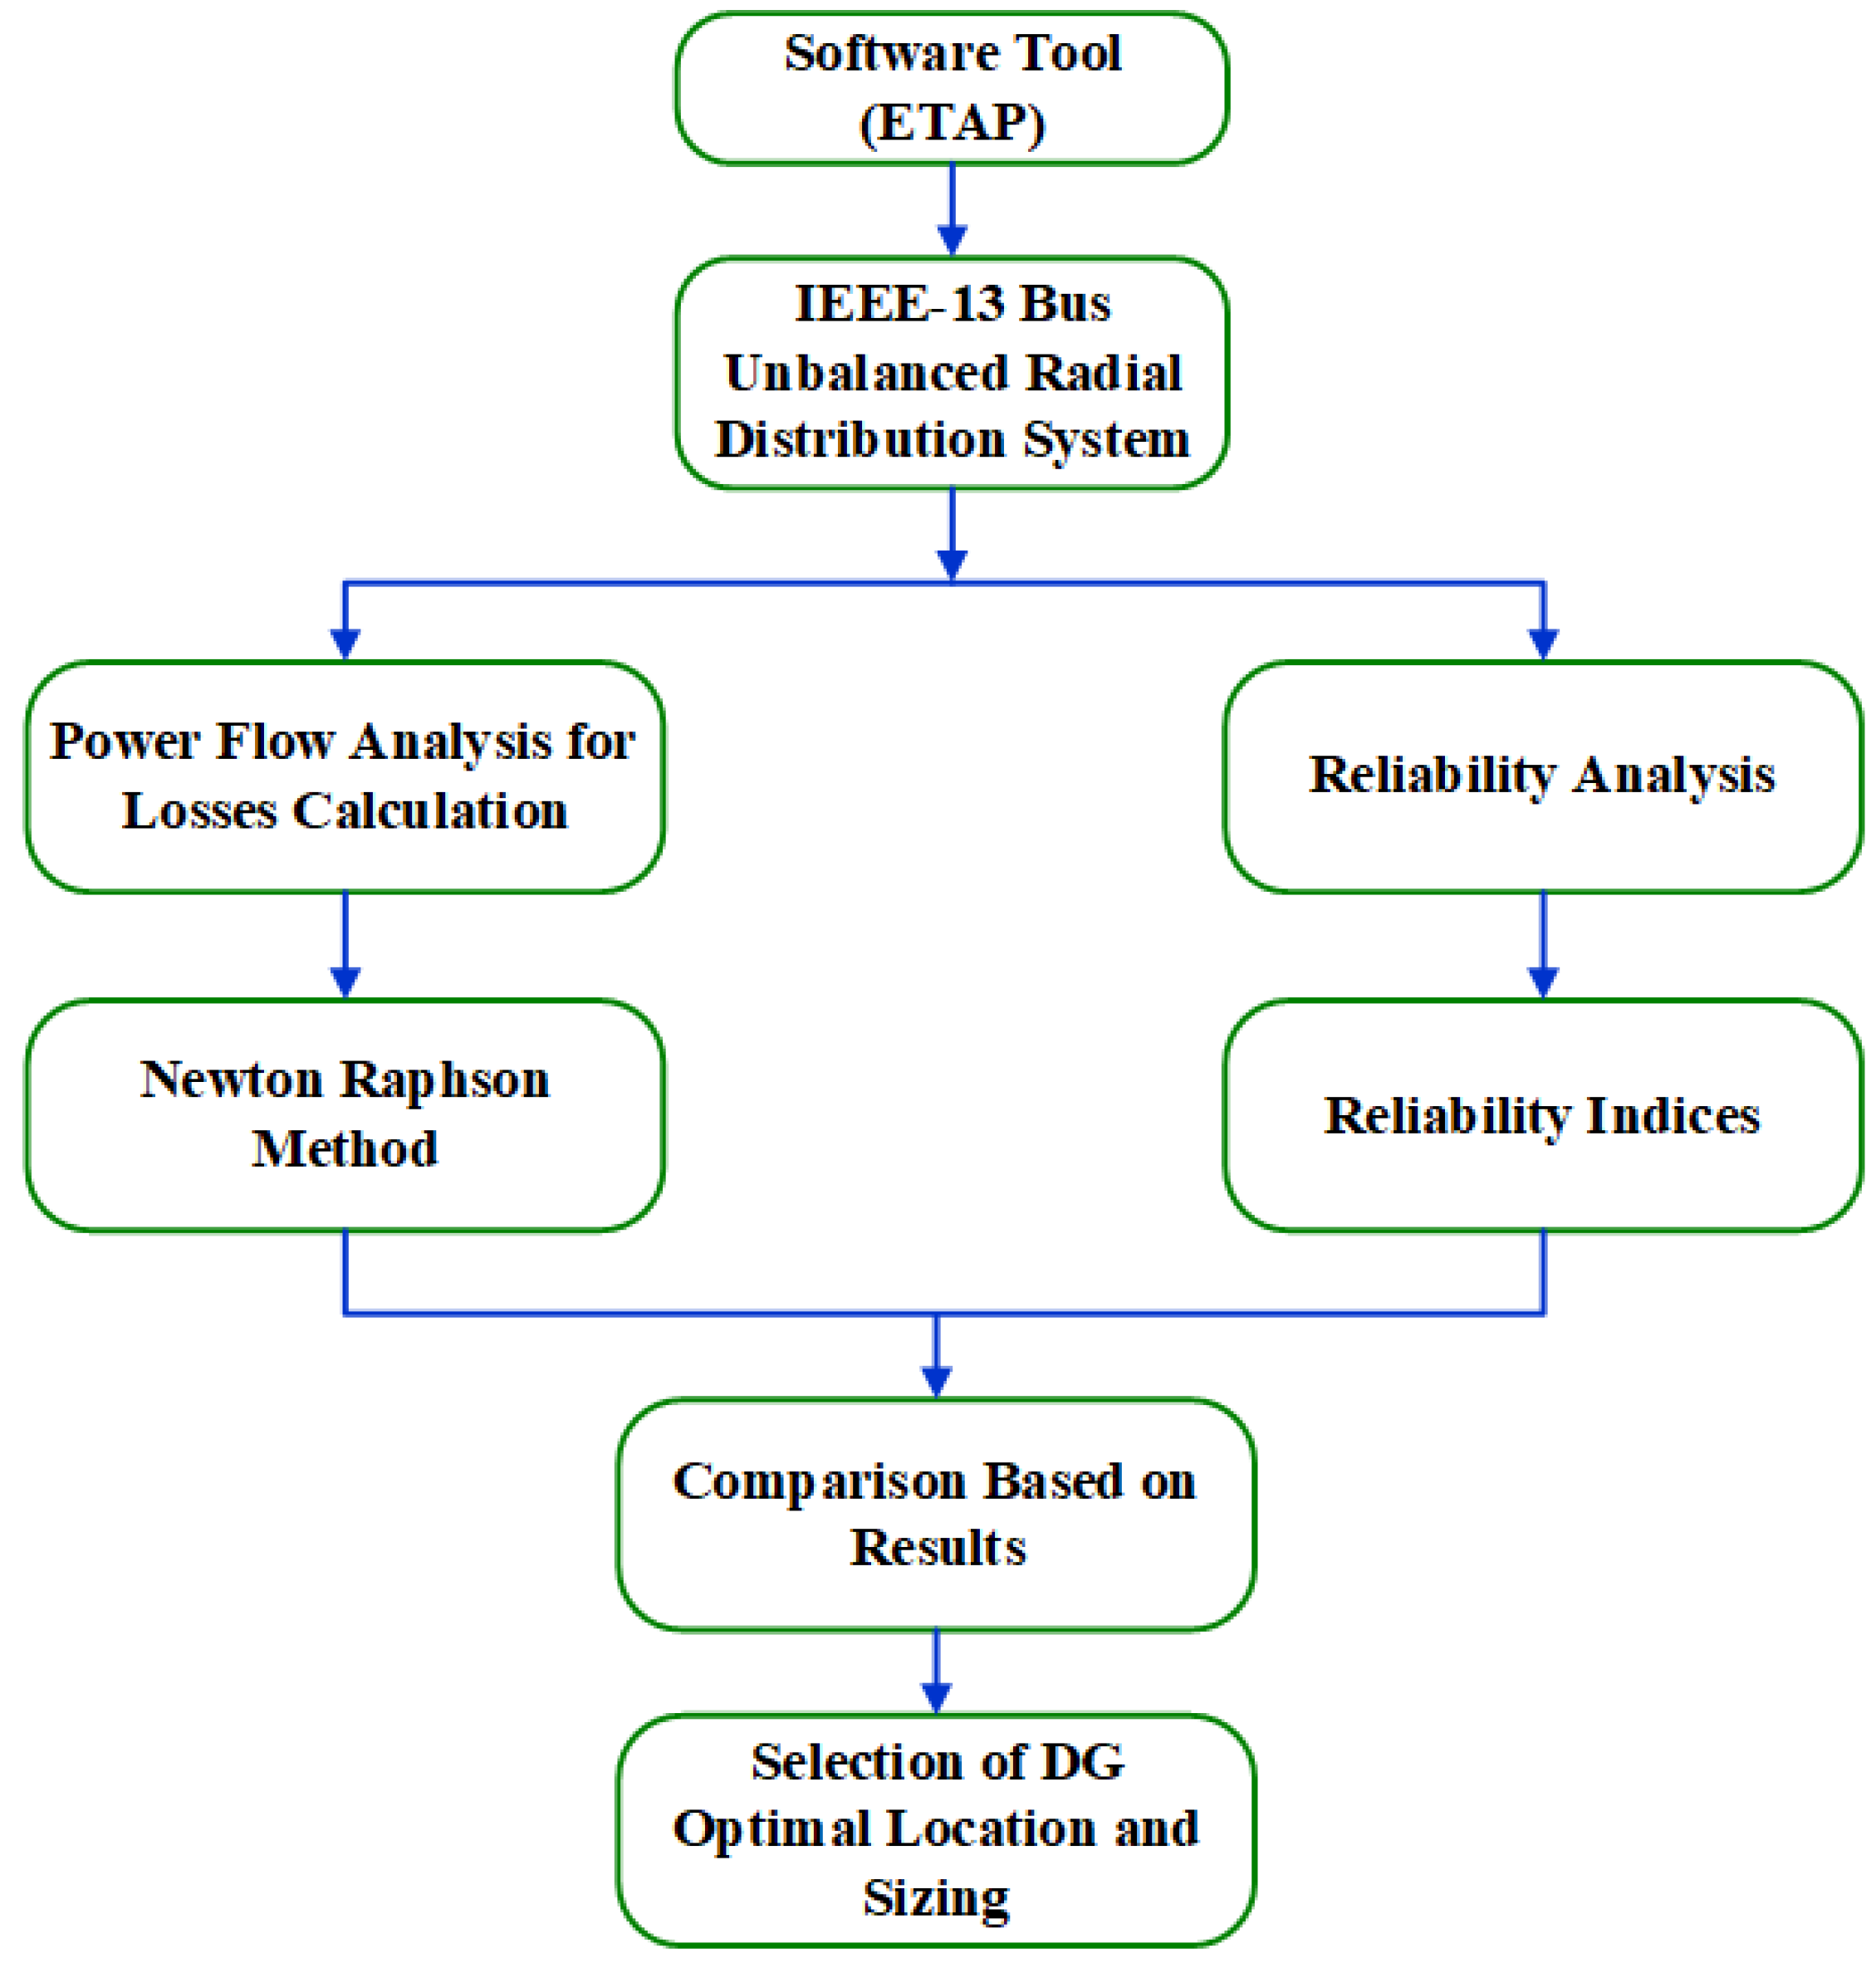
Section 4 briefly elaborates on the study methodology.
Section 5 discusses the study results and analysis based on the study outcomes.
Section 6 evaluates the test system performance during uncertainties of the DG sources. Finally,
Section 7 concludes the article and gives recommendations on the future scope of the proposed study.
2. Literature Review
The impact analysis of the optimal location and sizing of DGs on DS parameters such as power loss mitigation, reliability and voltage profile enhancement, system stability, power quality, and protection systems are studied by different researchers based on using various techniques like performing multiple tests on the system, hit and trial methods, analytical methods, and applying different optimization techniques.
Some research studies focused on the impacts of the installation of DG on the voltage profile, power losses, and reliability of a DS based on performing different tests and applying analytical techniques. Reference [
10] investigated the effects of DG installation on power losses and voltage drop in a DS at different points using an IEEE-37 bus radial DS and suggested that DG installation at the most critical bus furthest from the feeder greatly reduced system power losses and voltage drop. In reference [
11], the power losses, voltage profile, and reliability of an IEEE-14 bus system are evaluated by using PV as a DG source, and it is observed that by placing DG at buses that deliver power to the system, the weakest buses significantly reduce power losses and enhance the voltage profile and system reliability. In [
12,
13], a case study is performed on an 11 kV distribution feeder modeled in ETAP software to evaluate the effect of DGs (synchronous and induction generators) on the voltage profile and power losses of a DS. The results show that the synchronous generator’s optimal placement and size consideration lead to better a voltage profile and power loss mitigation than the induction generator, which contributed to greater power losses compared to the system without DG because the induction generator absorbed reactive power from the system. The researchers in references [
14,
15] analyzed the impact of wind turbine DG on DS reliability by changing the size, number, and distance of DG units from the feeder by using bus 2 of the Roy Billinton Test System (RBTS). The researchers suggested that a single DG injection near the load point or at the far end of a feeder positively affects reliability and multiple DG unit injections at various locations further increase reliability, whereas multiple DG unit injections at a single point negatively impact the system reliability, and by varying the DG size, the reliability of the system remains unchanged. References [
16,
17] examined the impact of a single DG placement on the reliability of a DS based on performing multiple tests by using bus 2 of the RBTS and suggested that single DG optimal placement has a more positive effect on the reliability than the installation of multiple DG units at various locations. Similarly, reference [
18] analyzed the DG placement in DS by using bus 2 of the RBTS and suggested that DG installation at the weakest bus of the system achieved mitigation in power losses and an enhancement in reliability. Reference [
19] performed the impact analysis of DG on the reliability of a real DS considered as a case study modeled in ETAP software and suggested that system reliability is improved by the installation of a single DG near load points and is further improved when multiple DG units are placed at various locations in a DS. In [
20], the researchers evaluated the reliability of a modified IEEE-13 bus unbalanced DS after DG placement and found that the system reliability is greatly improved after optimal DG placement. Reference [
21] also considered a modified IEEE-13 bus system for investigating the impacts of the high penetration of DG sources on the smart grid DS reliability in the grid-connected and islanded modes. Study outcomes show an improvement in reliability indices after distributed energy resource integration. Moreover, reference [
22] proposed an analytical algorithm for optimal DG placement and sizing in a DS by testing it on an IEEE-34 bus DS, and it is suggested that power losses are mitigated and reliability is enhanced based on the proposed approach.
Similarly, some researchers applied different optimization techniques to investigate the DS performance after DG source integration. In [
23], the DS reliability is evaluated based on a hit and trial method and an artificial neural network (ANN) by using bus 2 of the RBTS, and it found that the reliability of the system is greatly enhanced by applying the ANN technique compared to the hit and trial method. In [
24], a genetic algorithm (GA), and in [
25], grey wolf optimization (GWO) are applied on an IEEE-33 and a 69 bus DS for optimal DG placement and sizing with the objectives of overcoming power losses and improving the system voltage profile. In [
26,
27], particle swarm optimization (PSO) is implemented on an IEEE-33 bus DS to obtain the optimal placement and size of a type 1 (PV) DG unit, and it is suggested that multiple PV units integrated into the system overcome the power losses and enhance the voltage profile and reliability to a great extent. Similarly, the impact of type 1–3 DG units integrated on the DS voltage profile and power losses is examined as a case study in reference [
28] by applying PSO on a 50 bus 11.5 kV practical DS through integrating open DSS with MATLAB, and it is found that type 2 DG contributes more to power loss reduction and voltage profile enhancement compared to the other type of DGs. In [
29], a PSO-based approach is proposed for selecting optimal DG sitting and capacity allocation with the objectives of power loss minimization, voltage stability improvement, and achieving cost benefits by testing it on an IEEE-34 bus DS. Additionally, in reference [
30], PSO is applied for obtaining optimal DG placement and size in an IEEE-33 bus DS, and the study findings depict that the PSO technique shows better results for power loss mitigation and voltage profile and reliability enhancement compared to other methods. In reference [
31], PSO and the gravitational search algorithm (GSA) are proposed for the optimal placement and sizing of type 1 and type 2 DGs by applying them on an IEEE-33 bus DS, and the study outcomes show that multiple type 2 DG integration shows greater power loss reduction, enhancement in the voltage profile, and system reliability by using PSO and GSA. In [
32], the crow search algorithm (CSA) is proposed for multiple types of optimal DG placement and sizing to minimize power losses and voltage deviation by applying it on IEEE-13, 34, and 123 unbalanced radial DS. Reference [
33] proposed a multiobjective whale optimization algorithm (MOWOA) for optimal DG placement and sizing to achieve loss minimization, voltage profile enhancement, and maximizing annual cost savings by applying it on IEEE-33 and 69 bus DSs. Furthermore, the co-evolutionary multiswarm PSO technique [
34] and the artificial hummingbird algorithm (AHA) [
35], that also considers the uncertainties of DG sources and load, are suggested for the optimal location and sizing of type 1 and type 2 DGs in DS by applying them on an IEEE-33 bus and a real DS. The study findings show that optimal DG placement and sizing by applying the proposed techniques resulted in power loss minimization and increased system stability along with the voltage profile being within operational limits while considering the uncertainties. The researchers in [
36,
37] also used the artificial hummingbird optimizer technique for the equivalent circuit modeling of PV modules in order to maximize the PV modules’ efficiency and extract the maximum power from them. Similarly, some other optimization techniques such as multi-objective PSO (MOPSO) [
38], ant colony optimization (ACO) [
39], the dragonfly algorithm [
40], and the lightning search algorithm (LSA) [
41] are proposed by the researchers in the literature for obtaining optimal DG unit placement, sizing, and number in radial DSs. The efficacy of all these optimization techniques is proved by applying them on different IEEE distribution test systems and on real DSs as a case study for achieving power loss mitigation, reliability enhancement, voltage stability control, and other additional benefits in radial DSs.
Furthermore, several optimization techniques are also proposed in the literature for effectively managing the operational reliability of DSs and reducing power losses. For instance, in [
42], the jelly fish search (JFS) algorithm, and in [
43], a social network search (SNS) algorithm are proposed for the optimization of power network reconfiguration within IEEE-33 and 69 bus DSs, respectively, to improve the DS reliability. In [
44], a modified JFS search algorithm is suggested for managing optimal network reconfiguration in medium-voltage distribution feeders with the objective of minimizing the power losses and enhancing the overall system reliability. Additionally, reference [
45] proposed the equilibrium optimization algorithm (EOA) for configuring power DS with the optimal allocation of multiple DG units by implementing it on IEEE-33, 69, and 137 bus DSs.
5. Results and Discussion
5.1. Base Case Study
In the base case study, multiple tests are performed based on different scenarios. To obtain the optimal DG location and size, the maximum active power loss reduction and system reliability enhancement along with system operational constraint limits within specified limits are considered based on power flow and reliability analysis, described in detail below.
5.1.1. Scenario 1: System without DG Integration
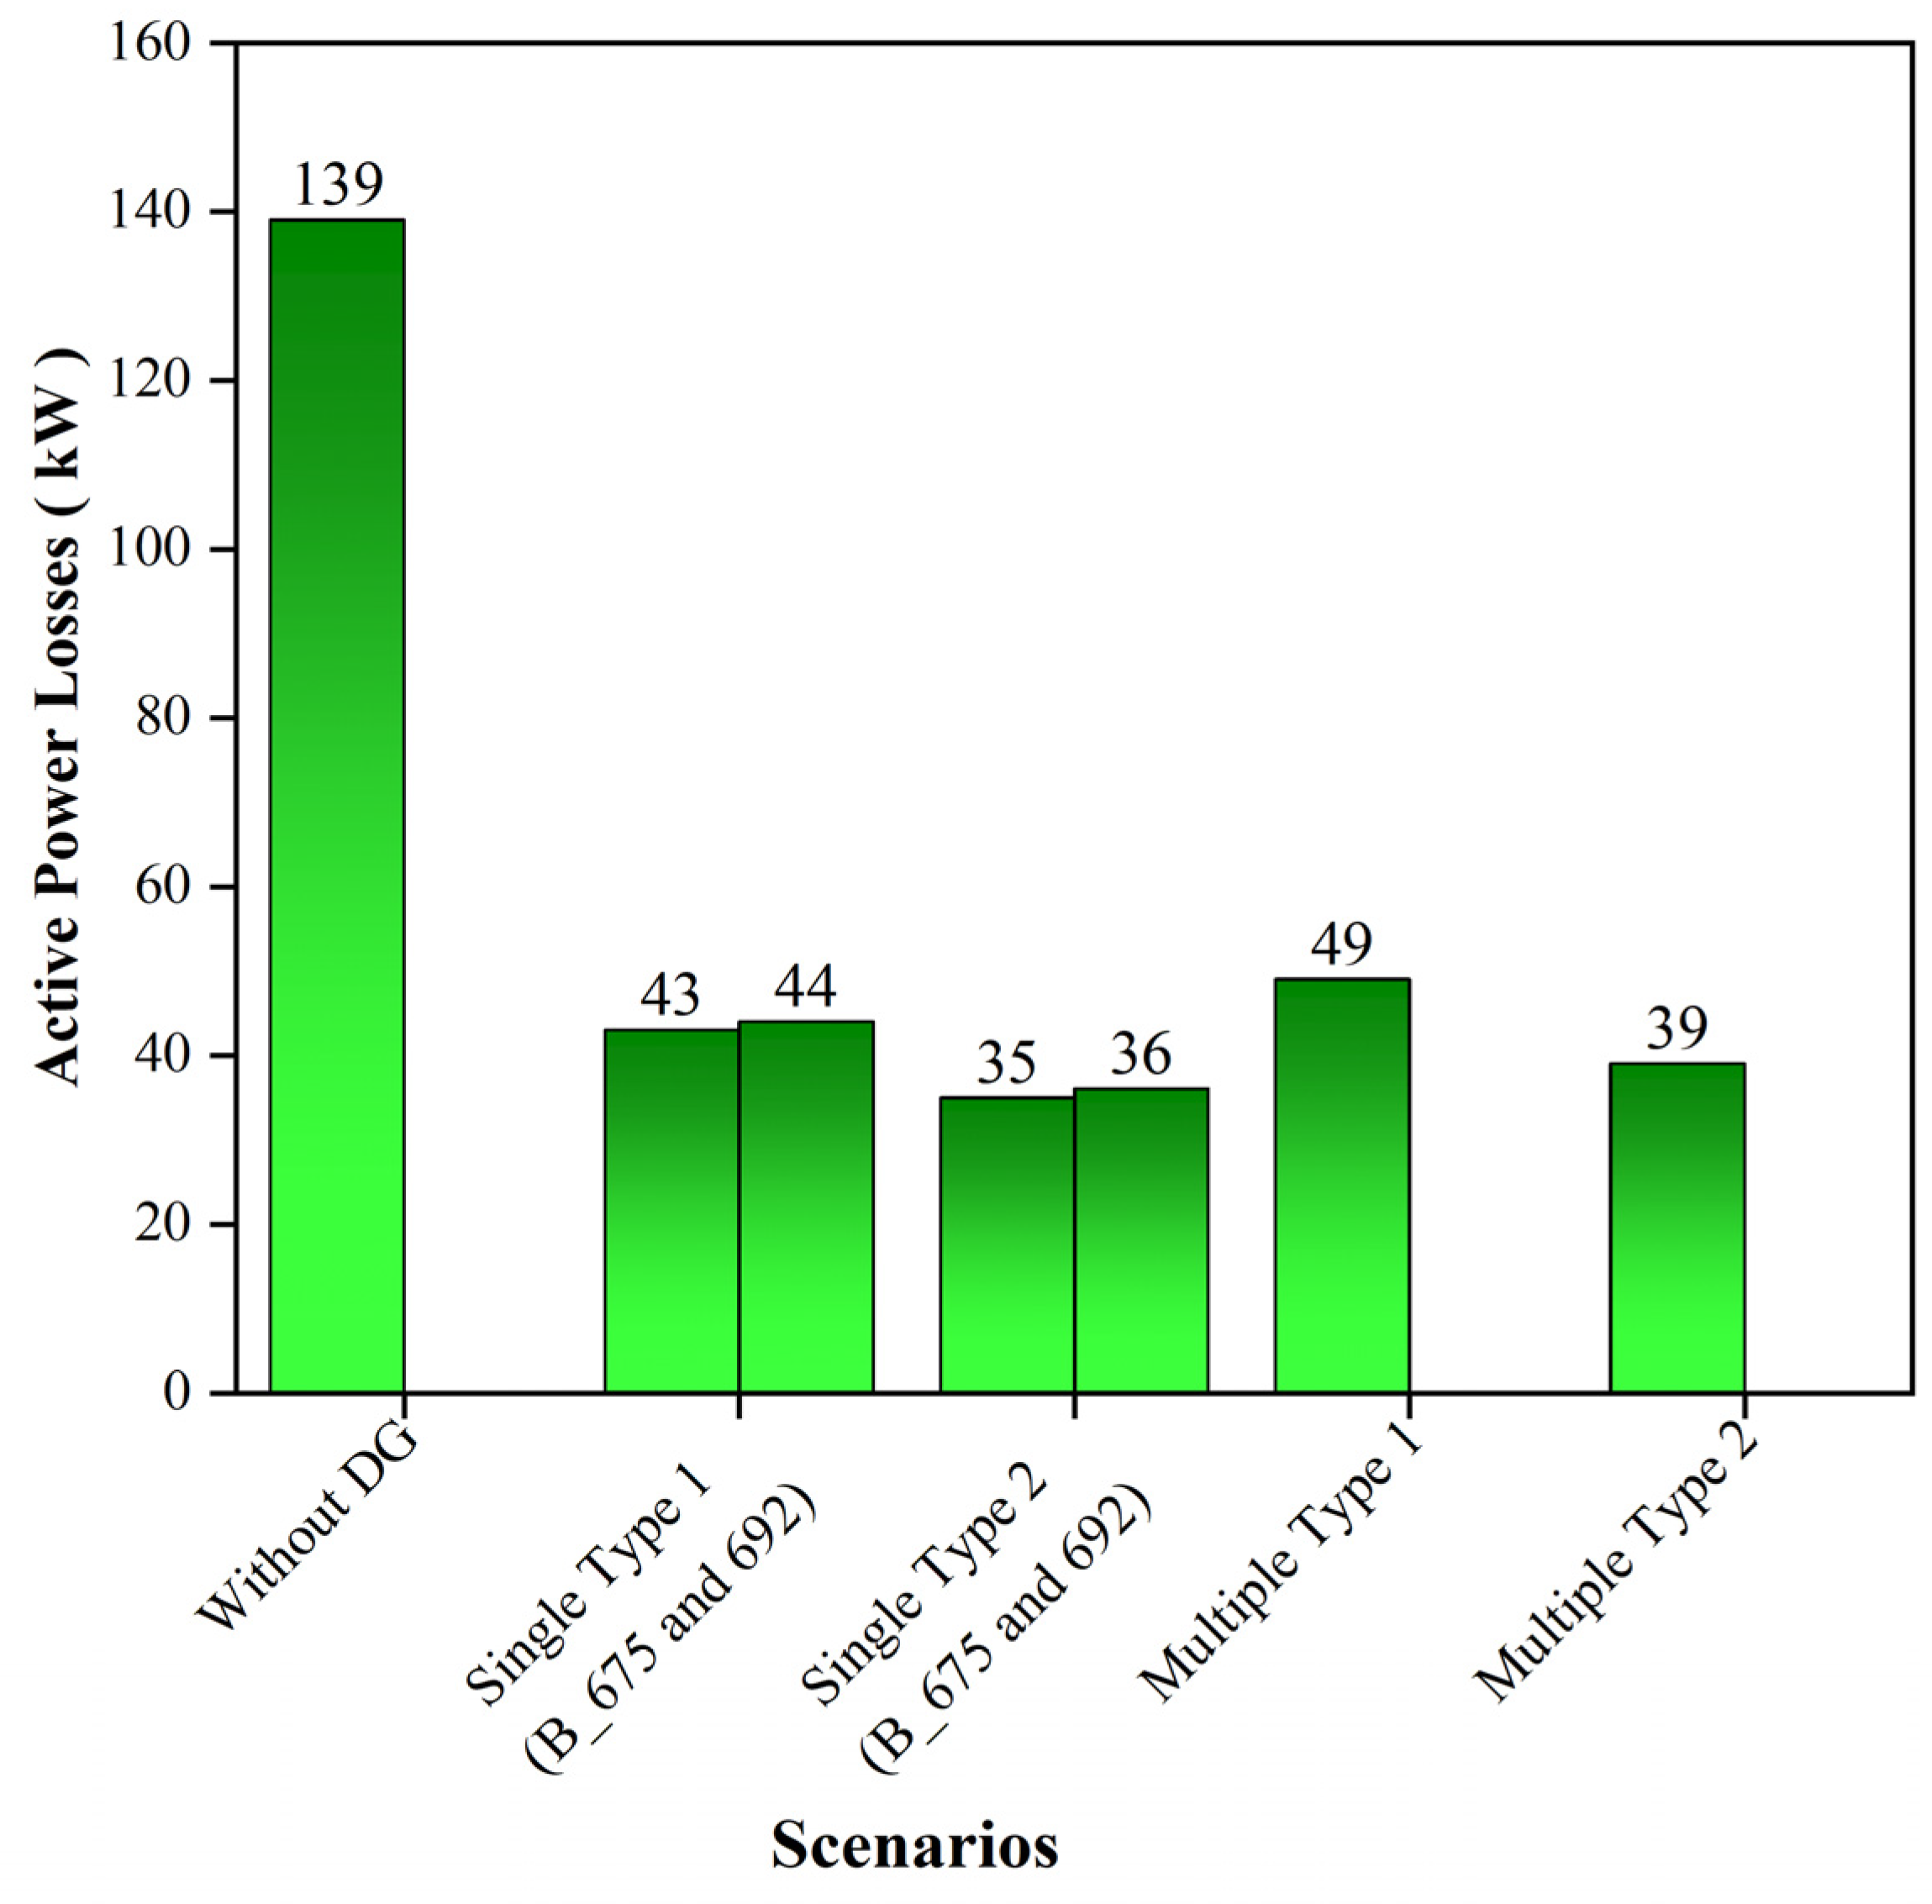
In this scenario, the power flow analysis based on the Newton Raphson method with maximum iterations of 100 and accuracy of 0.0001 is run in ETAP software 19.0.1 version on a modified IEEE-13 bus DS to examine system active power losses without DG integration. After running the load flow analysis, system active power losses are identified as 139 kW. Then, the system reliability analysis is also conducted to determine the system reliability indices without DG integration.
5.1.2. Scenario 2: Single Type 1 DG Integration
In this scenario, a single type 1 DG (PV) at a penetration level of 15% based on Equation (7) is integrated into the system at all the buses except the utility bus (reference bus/slack bus), and its effect on the system active power losses and reliability is analyzed. It is noticed that when a type 1 DG is installed at buses 675 and 692 individually, the maximum active power loss reduction is achieved compared to other buses. Overall system losses when a type 1 DG is installed at bus 675 become 97 kW and at bus 692 become 99 kW (
Figure 6), contributing to percentage active power loss reductions of 30.2% and 28.7%, respectively. System reliability is also enhanced compared to the system without a DG (
Table 8). It is also noticed that at other buses, a reduction in active power losses and an enhancement in the system voltage profile constraint are achieved; however, the system reliability is not enhanced compared to the system without a DG.
Then, the impact of the increasing penetration level of the type 1 DG on the active power loss reduction, reliability, and system operational constraints is determined by gradually increasing the penetration level of the type 1 DG from 15% in steps of 5% (Equation (7)). It is noticed that at the 45% penetration level, buses 675 and 692 contributed to the maximum active power loss mitigation along with the system constraints within the operating limits. As the penetration level is increased above 45%, the power losses in the system start to increase again, which means that up to a maximum of 45% penetration of the type 1 DG can be integrated into the system. At the 45% penetration level, the overall active power losses when the type 1 DG is installed individually at bus 675 become 43 kW, and at bus 692, they become 44 kW (
Figure 6), contributing to 69% and 68.3% power loss reduction, respectively. However, the system reliability was not affected by the increasing penetration level of the type 1 DG and remained the same as at a penetration level of 15%. The parameters considered in the modeling of the type 1 DG module are presented in
Table 9.
Table 8 depicts that the reliability indices SAIFI, SAIDI, CAIDI, and ASUI are reduced and ASAI is increased when a single type 1 DG is individually placed at buses 675 and 692, respectively, compared to the system without a DG. This shows that an overall enhancement in the system reliability is achieved.
5.1.3. Scenario 3: Single Type 2 DG Integration
In this scenario, a single type 2 DG (wind) at a penetration level of 15% based on Equation (8) is integrated into the system in the same manner as in scenario 2. It is noticed that when the type 2 DG is installed at buses 675 and 692 individually, the maximum active power loss reduction is achieved with almost the same system behavior as in scenario 2. The overall system losses when the type 2 DG is installed at bus 675 become 84 kW (39.5% reduction), and at bus, 692 they become 86 kW (38% reduction) (
Figure 7). The system reliability is also enhanced compared to the system without a DG (
Table 10).
Similarly, the effect of increasing the penetration level (based on Equation (8)) of the type 2 DG and its impact on the system performance is noticed in the same manner as in scenario 2. For the type 2 DG at a penetration level of 40%, the maximum active power mitigation is achieved along with the system constraints within the operating limit. As the penetration level increased above 40%, the losses in the system started to increase again, which means that up to a maximum of 40% penetration of the type 2 DG can be integrated into the system. At the 40% penetration level, the overall active power losses when the type 2 DG is installed individually at bus 675 become 35 kW (75% reduction), and at bus 692, they become 36 kW (74% reduction) (
Figure 7). However, the system reliability was not affected by the increasing penetration level of the type 2 DG and remained the same as at the penetration level of 15%. The basic parameters of the type 2 DG module considered in modeling are presented in
Table 11.
5.1.4. Scenario 4: Multiple Type 1 DG Integration
In this scenario, multiple DG units of type 1 are integrated into the system at a penetration level of 45% because, from scenario 2, the maximum penetration level of the type 1 DG can be 45%. It is noticed that when the DG units are installed at buses 675 and 684, power losses are reduced to the maximum level compared to other buses along with system constraints within the operational limits. Active power losses are reduced to 49 kW (64.7%) when type 1 DGs are installed on these buses (
Figure 8). However, the system reliability is not enhanced compared to the system without DGs.
5.1.5. Scenario 5: Multiple Type 2 DG Integration
In this scenario, multiple DG units of type 2 are integrated into the system in the same manner as in scenario 4 at a penetration level of 40%. Greater mitigation in active power losses is noticed when type 2 DGs are integrated at buses 675 and 671 compared to other buses along with system constraints within the operational limits. Active power losses are reduced to 39 kW (72%) when type 2 DGs are integrated into these buses (
Figure 8). However, the system reliability is not enhanced compared to the system without DG as in scenario 4.
5.2. PSO Results
After the base case study, a metaheuristic PSO technique is implemented on a modified test system to achieve an optimized optimal DG location and size using MATLAB software. Different scenarios are examined, and all the system operational constraints, as discussed in
Section 4, are considered to obtain the optimal DG location and size in each scenario. Then, its impact on the mitigation of active power losses, reliability, and system operational constraints are investigated using ETAP software.
After implementing the PSO algorithm in MATLAB software, the optimal location for a single type 1 DG is achieved at bus 675 with a size of 1.53 MW (
Table 12), contributing to a total active power loss reduction of 65.5% (
Figure 9). The system reliability and voltage profile constraint are also enhanced versus the system without a DG, as shown in
Table 13 and
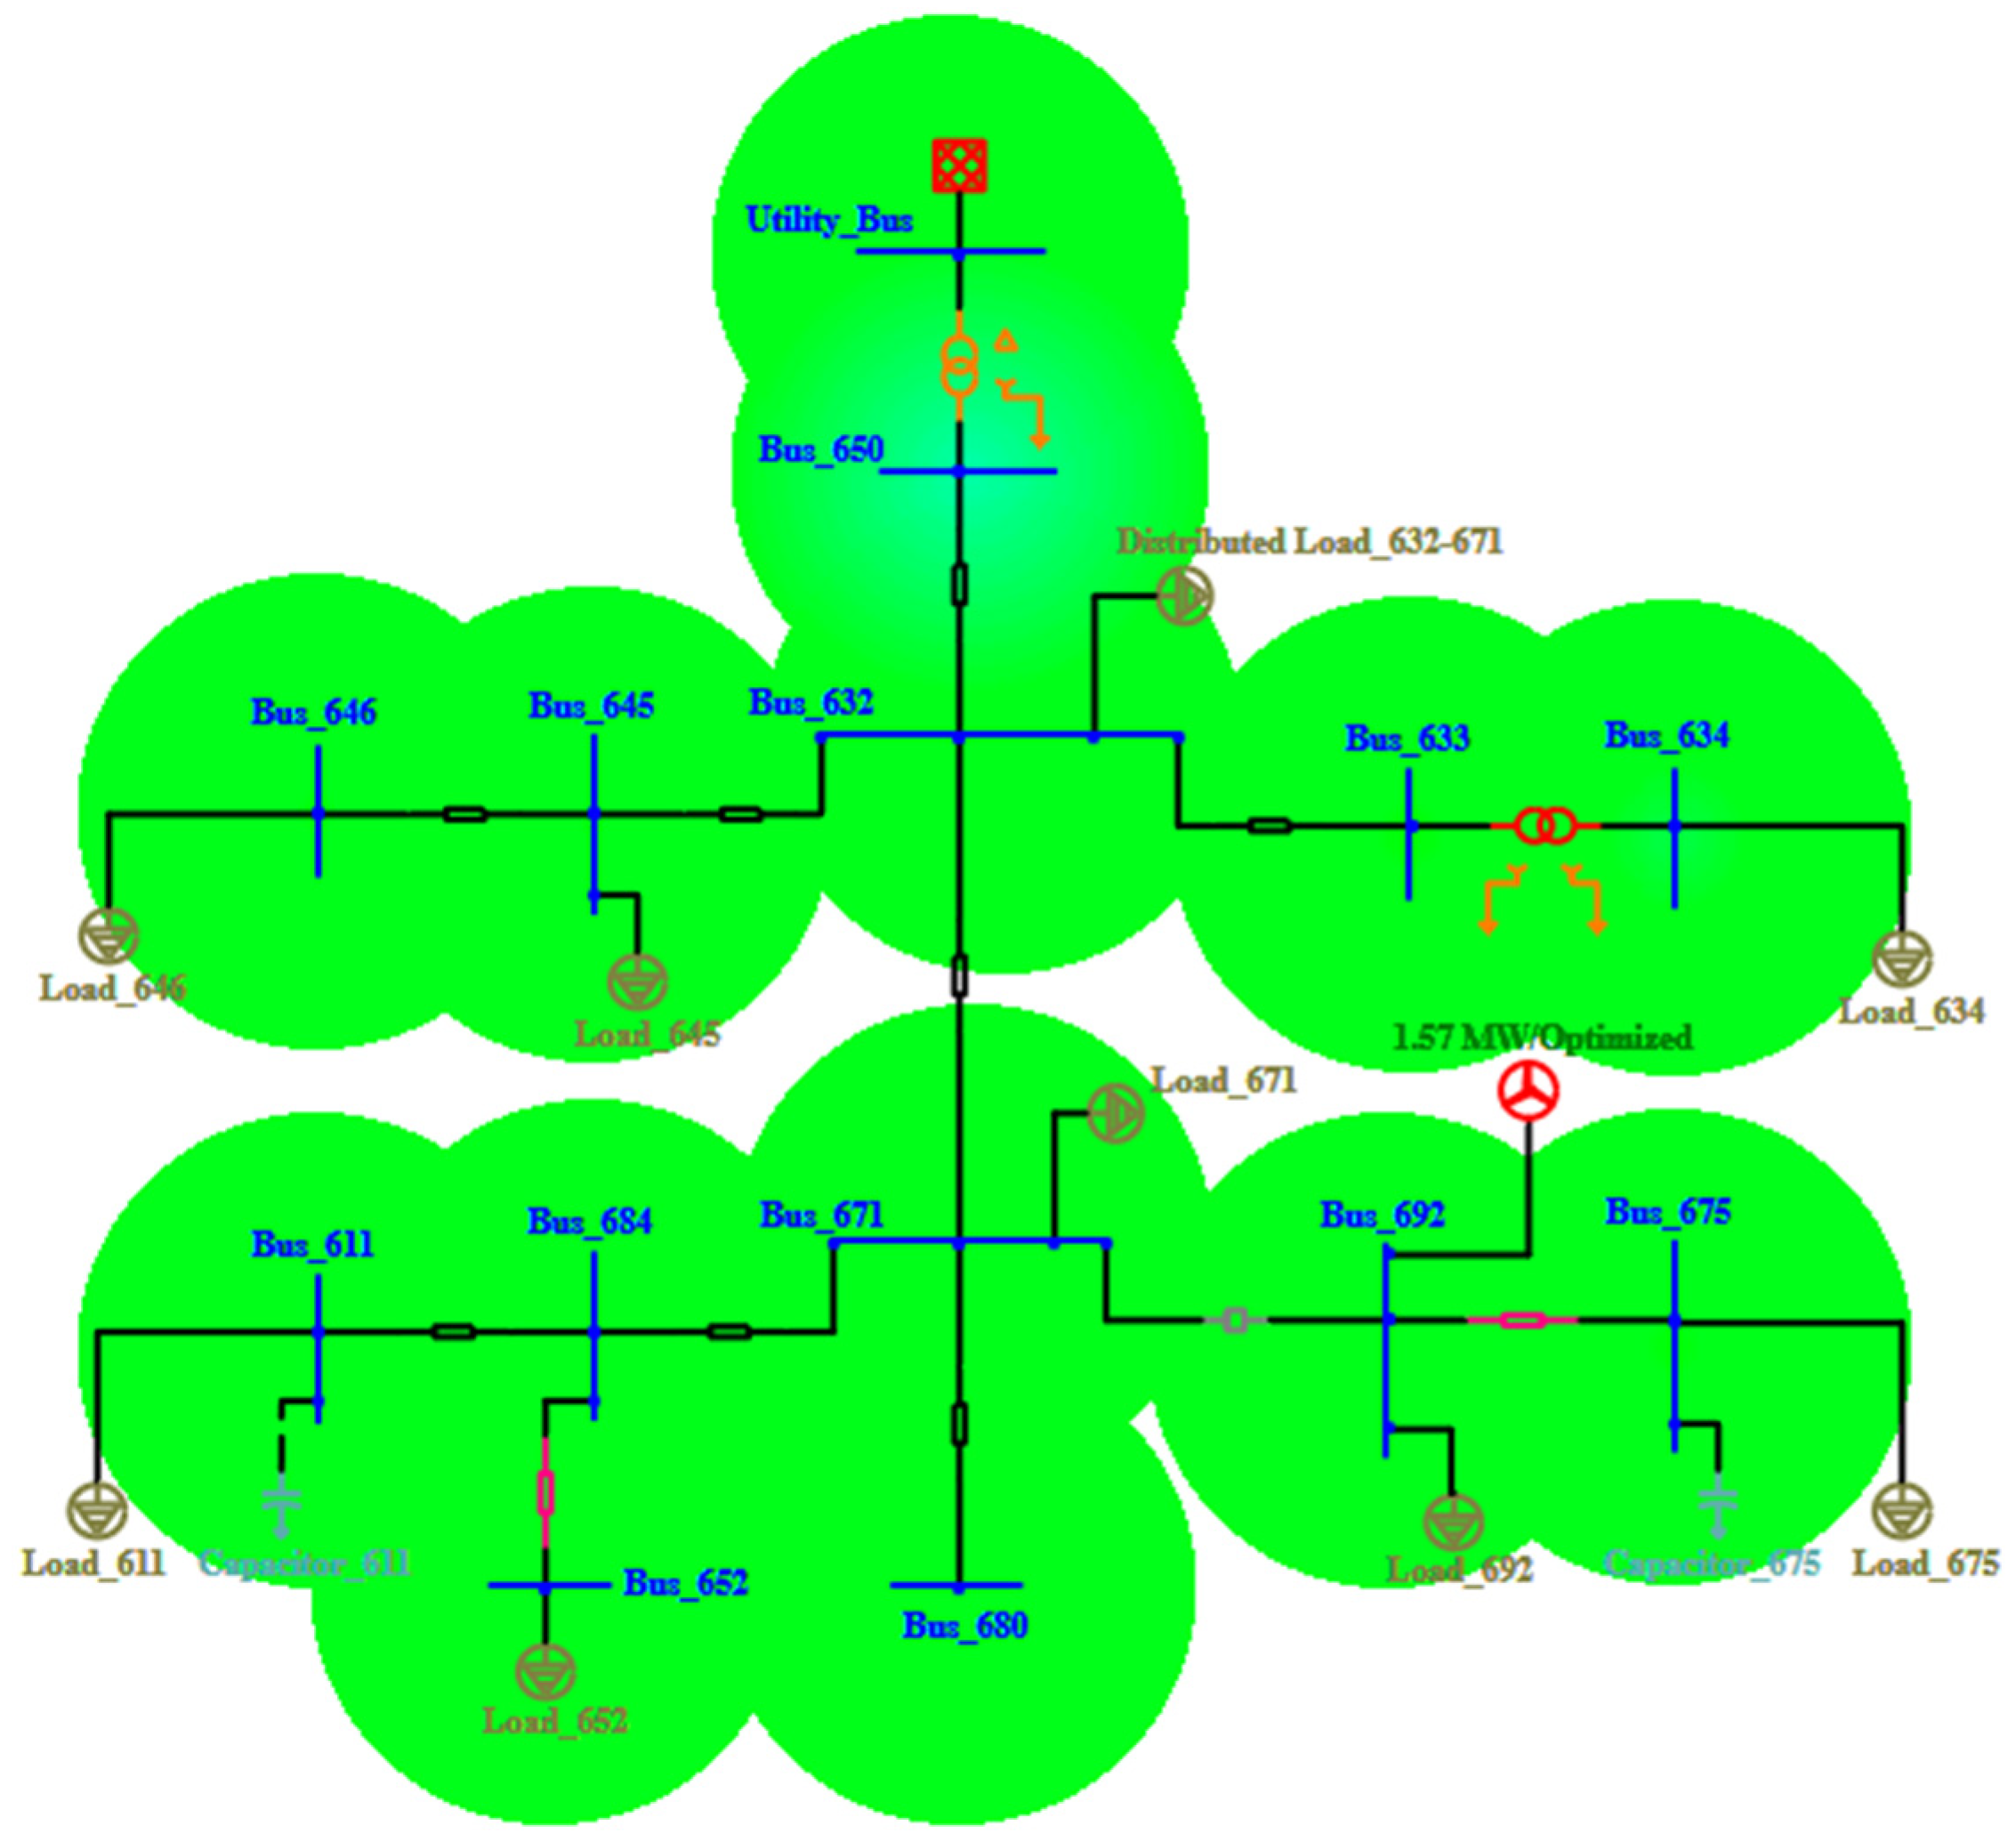
Figure 10, respectively. For a single type 2 DG, the optimal DG location is achieved at bus 692 with a size of 1.57 MW, contributing to the total loss reduction of 73.4% and system reliability and voltage profile enhancement.
The optimal locations for multiple type 1 DGs are found to be buses 675 and 671 with DG capacities of 0.7964 MW and 0.6921 MW, respectively. For multiple placements of type 2 DGs, the optimal locations are buses 692 and 684 with DG capacities of 0.8045 MW and 0.7086 MW, respectively. Active power loss mitigation of 64% and 71.2% is achieved along with enhancement in the voltage profile constraint of the system when multiple DG units of type 1 and type 2 are placed at the respective buses. However, the system reliability did not improve versus the system without DGs (
Table 13). Detailed descriptions of the system power losses per phase and voltage per phase in each scenario are illustrated in
Appendix A (
Table A1 and
Table A2), respectively.
Figure 11 shows the comparison of the system reliability indices in each scenario. It can be seen from
Figure 11 that reliability indices SAIFI, SAIDI, and ASUI are greatly reduced with single type 2 DG integration, contributing to greater system reliability improvement. CAIDI is mostly reduced with multiple type 1 DG integration; however, other reliability indices are not improved in this scenario compared to the system without DGs. The ASAI (average system availability index) is also greatly enhanced with single type 2 DG integration.
Figure 12,
Figure 13 and
Figure 14 shows the visual representation of the proposed test system in different scenarios within the ETAP environment, including the system without DG integration, system with single type 1 DG integration and system with single type 2 DG integration, respectively. The color-coded indications in the Figures are as follows: red shading indicates system alerts, yellow shading indicates marginal system operation, and green shading denotes normal system operation.
5.3. Analysis Based on Results
From the above base case study and PSO technique, the overall behavior of the test system under different types of DG integration and scenarios is investigated, and observations are given in the next paragraphs.
Regarding the active power loss mitigation, when a single type 1 or type 2 DG is integrated into the system at buses 675 or 692, greater active power loss mitigation is achieved. The system reliability is also improved versus the system without DGs. It is because bus 675 is found to be the weakest bus in the system and power to it is supplied by bus 692. A maximum of 45% penetration for type 1 and 40% penetration for type 2 DGs can be allowed into the system to achieve the maximum active power loss reduction, enhancement in reliability, and improvement in the system operational constraints along with maximum load sharing with the substation. It is noticed that the type 2 DG contributed the most to the active power loss mitigation compared to the type 1 DG because it simultaneously supplies active and reactive power to the system. This in turn mitigates system losses more significantly than the type 1 DG which only supplies active power to the system. Therefore, less penetration of the type 2 DG is required than the type 1 DG. Moreover, integrating multiple type 1 or type 2 DG units into the system achieved the mitigation of active power losses and an enhancement in the system voltage profile constraint; however, the system reliability did not improve compared to the system without DGs. Greater power loss mitigation is achieved with a single DG integration compared to the integration of multiple DGs of either type.
Similarly, system reliability enhancement is more dominant when a single type 2 DG is integrated into the system compared to a single type 1 DG. Moreover, system reliability can only be enhanced compared to the system without DGs when the DG is optimally placed. By increasing the penetration level of both types of DGs, the system reliability remained the same. Regarding the placement of DGs, it is noticed that if the DG is placed at the far end from the substation, more active power mitigation and improvement in voltage profile constraint can be achieved compared to a DG placed near the substation, but the reliability is mainly dependent on optimal placement.
In the context of optimization techniques, PSO is more robust and gives more accurate results in terms of determining the exact location and DG penetration level. Additionally, from the optimization technique, it is noticed that DG is placed at those buses where the power losses are significantly reduced, the voltage profile constraint is improved, and reliability enhancement is also achieved (for single type 1 or type 2 DGs). Therefore, metaheuristic optimization techniques decrease the computational complexities and computational time compared to performing multiple tests on the system and the random selection of DG unit(s).
From the study outcomes, it is recommended that a single type 1 or type 2 DG, either at the system’s weakest bus or at the bus which delivers power to the weakest bus, should be integrated into the system to achieve maximum active power loss mitigation and reliability enhancement versus the system without DGs. It is advisable that multiple DG units, either of type 1 or type 2 should not be integrated into the system because it mitigates the system power losses and enhances the voltage profile; however, system reliability is at risk.
6. Uncertainty of DG
A major challenge for renewable-based DG sources is their uncertainty in generation defined as “the unplanned variations in the power generated by non-dispatchable renewable energy sources such as solar or wind”. The uncertainty in PV-based DG is due to the fact that the PV output entirely depends upon solar energy and only four to six hours of peak may occur in the energy provided by the sun. Similarly, the output of wind-based DG depends upon the wind speed hitting the turbine blades, and the wind speed may not be constant during the whole day. Thus, because of these reasons, uncertainty in renewable-energy-based power generation sources occurs.
Renewable-based DG source integration into systems only impacts the system’s performance positively by considering their uncertainties during the planning phase [
7]. Therefore, in this research study, the uncertainties of DG sources based on the optimized results of the PSO technique for single type 1 and type 2 DGs are also considered, and its impact on the mitigation of active power losses, reliability, and system behavior is observed. A single PV of the optimized size of 1.53 MW is integrated at bus 675 of the system, and the uncertainty in its output is considered by varying the temperature and setting the irradiance to fixed, and then by varying the irradiance and setting the temperature to fixed. It is observed that when the temperature remains in the range of 5 to 35 degree centigrade and the irradiance is in the range of 700 W/m
2 to 1000 W/m
2 (
Figure 15), the type 1 DG contributed to greater active power loss mitigation (47.5–67.5%), system voltage profile constraint improvement, and load sharing with the substation. However, the system reliability is not affected during the uncertainty of type 1 DG. Additionally, it is examined that the PV output is mainly dependent upon the irradiance rather than the temperature; the greater the irradiance and the lower the temperature, the better the PV performance.
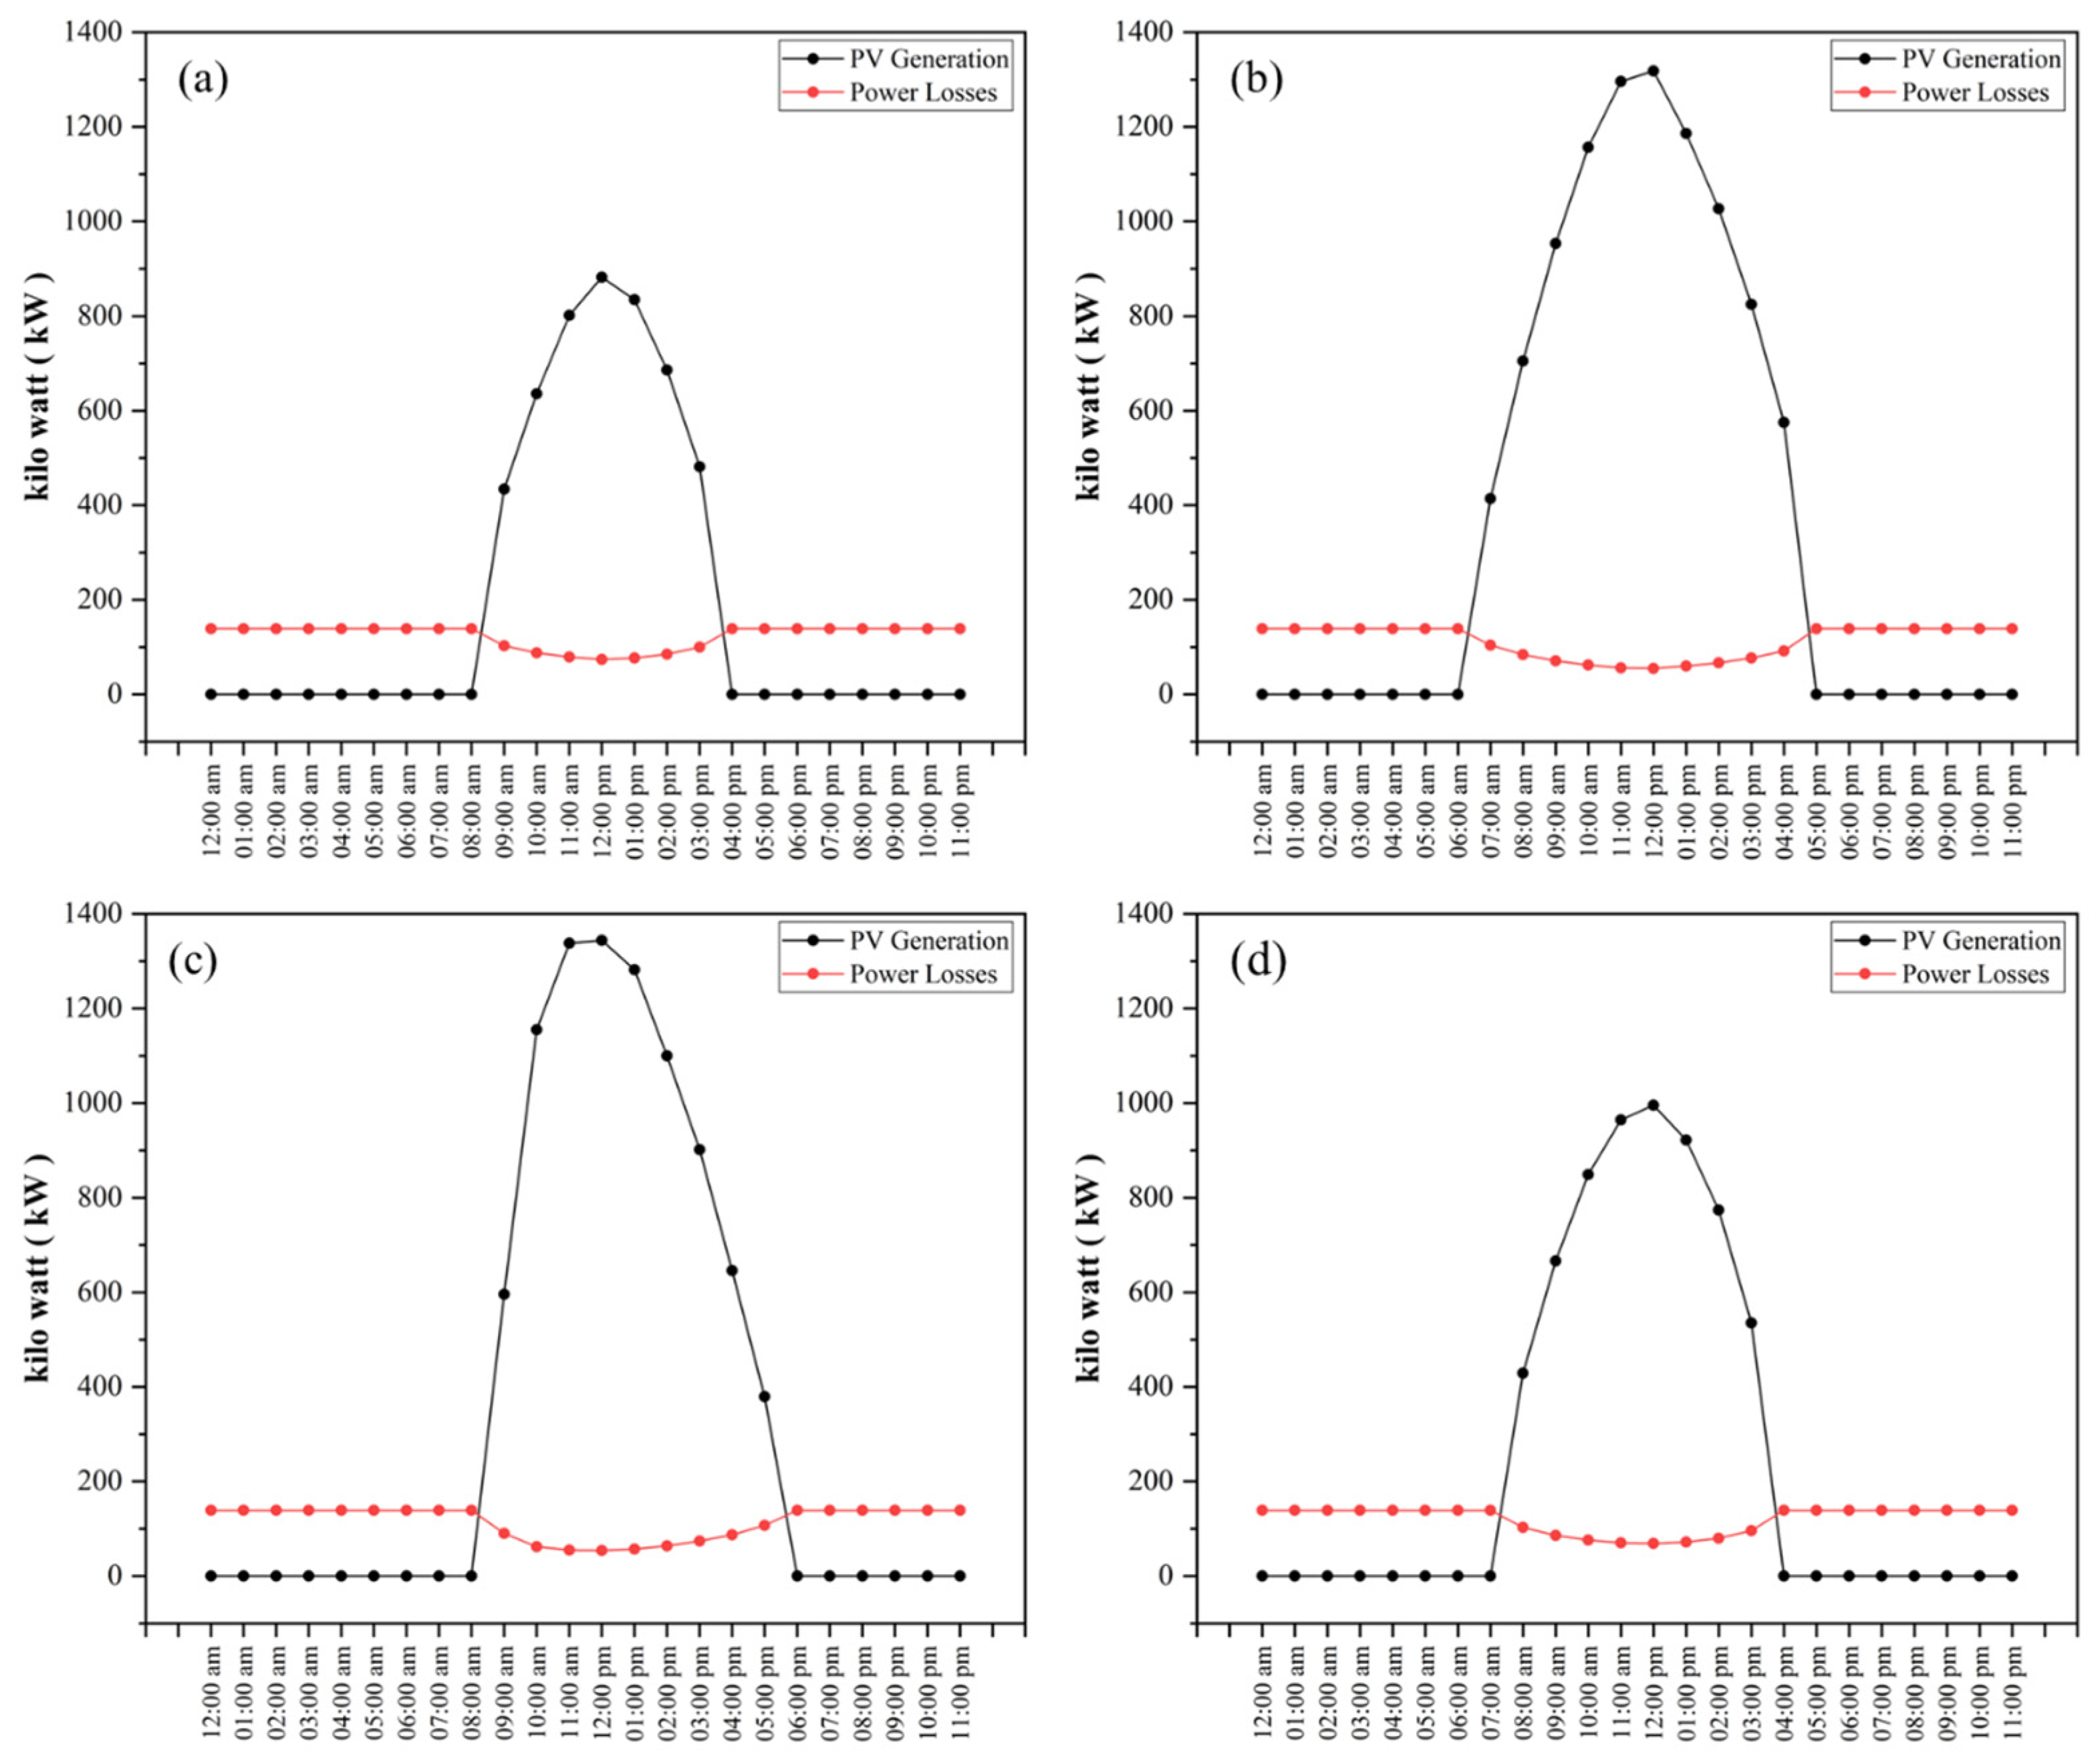
Similarly, to evaluate the PV performance based on real-time varying irradiance and temperature, the latest data of the year 2022 for the Islamabad region, Pakistan, are taken from reference [
53]. Then, the PV performance is analyzed for all four seasons’ typical days (
Figure 16). It is observed that during the winter season, the PV performance is the worst with the maximum generation of 801.4–882.2 kW from 11:00 am to 01:00 pm, contributing to a total active power loss reduction of 43.2–46.7% with the system voltage profile constraint slightly out of the operational limits. For the spring season, the PV performance is noted to be significantly better with a maximum generation of 953.3–1318 kW (49.5–60.4% power loss reduction) from 9:00 am to 2:00 pm, along with the voltage profile constraint within the specified operational limits. For the summer season, the PV performance is also better with a maximum generation of 902–1344 kW (47.5–61.2% power loss reduction) from 10:00 am to 3:00 pm, along with a voltage profile constraint within the operational limits, although the temperature reached up to 37 °C; however, the maximum irradiance occurred during this period. The PV performance during the autumn season is found to be average with the system voltage profile constraint within operational limits and a maximum generation of 922–995.3 kW (48.2–50.3% power loss reduction) from 11:00 am to 1:00 pm. Thus, based on the distinct seasonal variations in the Islamabad region, the PV performance is substantially better during the spring and summer seasons.
Similarly, the uncertainty in the output power generated by wind is considered at different percentages of power generation, and its impact on the power loss reduction, reliability, and voltage constraint are evaluated. It is noticed that when wind power generation is in the range of 60–100%, greater mitigation in the system active power loss and enhancement in the voltage profile constraint are achieved, along with maximum load sharing with the substation (
Figure 17). The reliability of the system also remains unaffected during the uncertainty of type 2 DG.
7. Conclusions and Future Recommendations
The proposed research study investigated the effects of integrating DG on reducing active power losses and improving reliability in an unbalanced radial DS, taking into account system operational constraints. The results of the study indicate that the optimal location, sizing, and number of DG units in a DS greatly reduce power losses, enhance the reliability and operational constraints of the DS, and also allow for maximum load sharing with the substation. The use of optimization techniques such as PSO provides improved and more accurate results in determining the optimal placement and sizing of DG units and eliminates computational complexities compared with the base case study method approach, which involves performing multiple tests on the system.
Based on the study’s findings, it is recommended that the optimal location for DG placement is at the weakest bus in the system or at the bus that supplies power to the system’s weakest bus. Additionally, maximum penetration levels of 45% for type 1 (PV) and 40% for type 2 (wind) DG should be allowed in the system. This study also suggests that integrating either a single type 1 DG or type 2 DG into the system is the best option, as multiple DG units overcome system power losses and satisfy the system operational constraints; however, the system reliability is at risk. In particular, integrating a single type 2 DG is recommended for greater power loss reduction, reliability, and system operation constraint enhancement and allowing for maximum load sharing with the substation, as it simultaneously provides active and reactive power to the system. Furthermore, the study revealed that during uncertainties in type 1 DG, the best performance occurs when the temperature remains constant within the range of 5–35 °C and the irradiance falls between 700 W/m2 and 1000 W/m2, and the performance is best during the spring and summer seasons. Similarly, for type 2 DG, the best performance is when the wind power generation ranges from 60% to 100%. During uncertainties and increasing penetration levels in both types of DG, the system reliability remains unaffected.
The proposed study is performed on an IEEE-13 bus unbalanced radial DS with the integration of PV and wind DG units. Future studies can be conducted on other IEEE unbalanced/balanced radial DSs and practical DSs, as well as evaluating the impacts of all four types of DG units and the inclusion of energy storage systems. Moreover, this study addresses the uncertainty of DG units and suggests that future studies should also consider the uncertainty in the system load as well. Additionally, other optimization techniques can be applied in future studies and the results can be compared to this proposed research. Furthermore, techno-economic and environmental analysis can also be included in future research studies related to this proposed research.


