
Temperature Evaluation of a Building Facade with a Thin Plaster Layer under Various Degrees of Cloudiness

Abstract
:1. Introduction
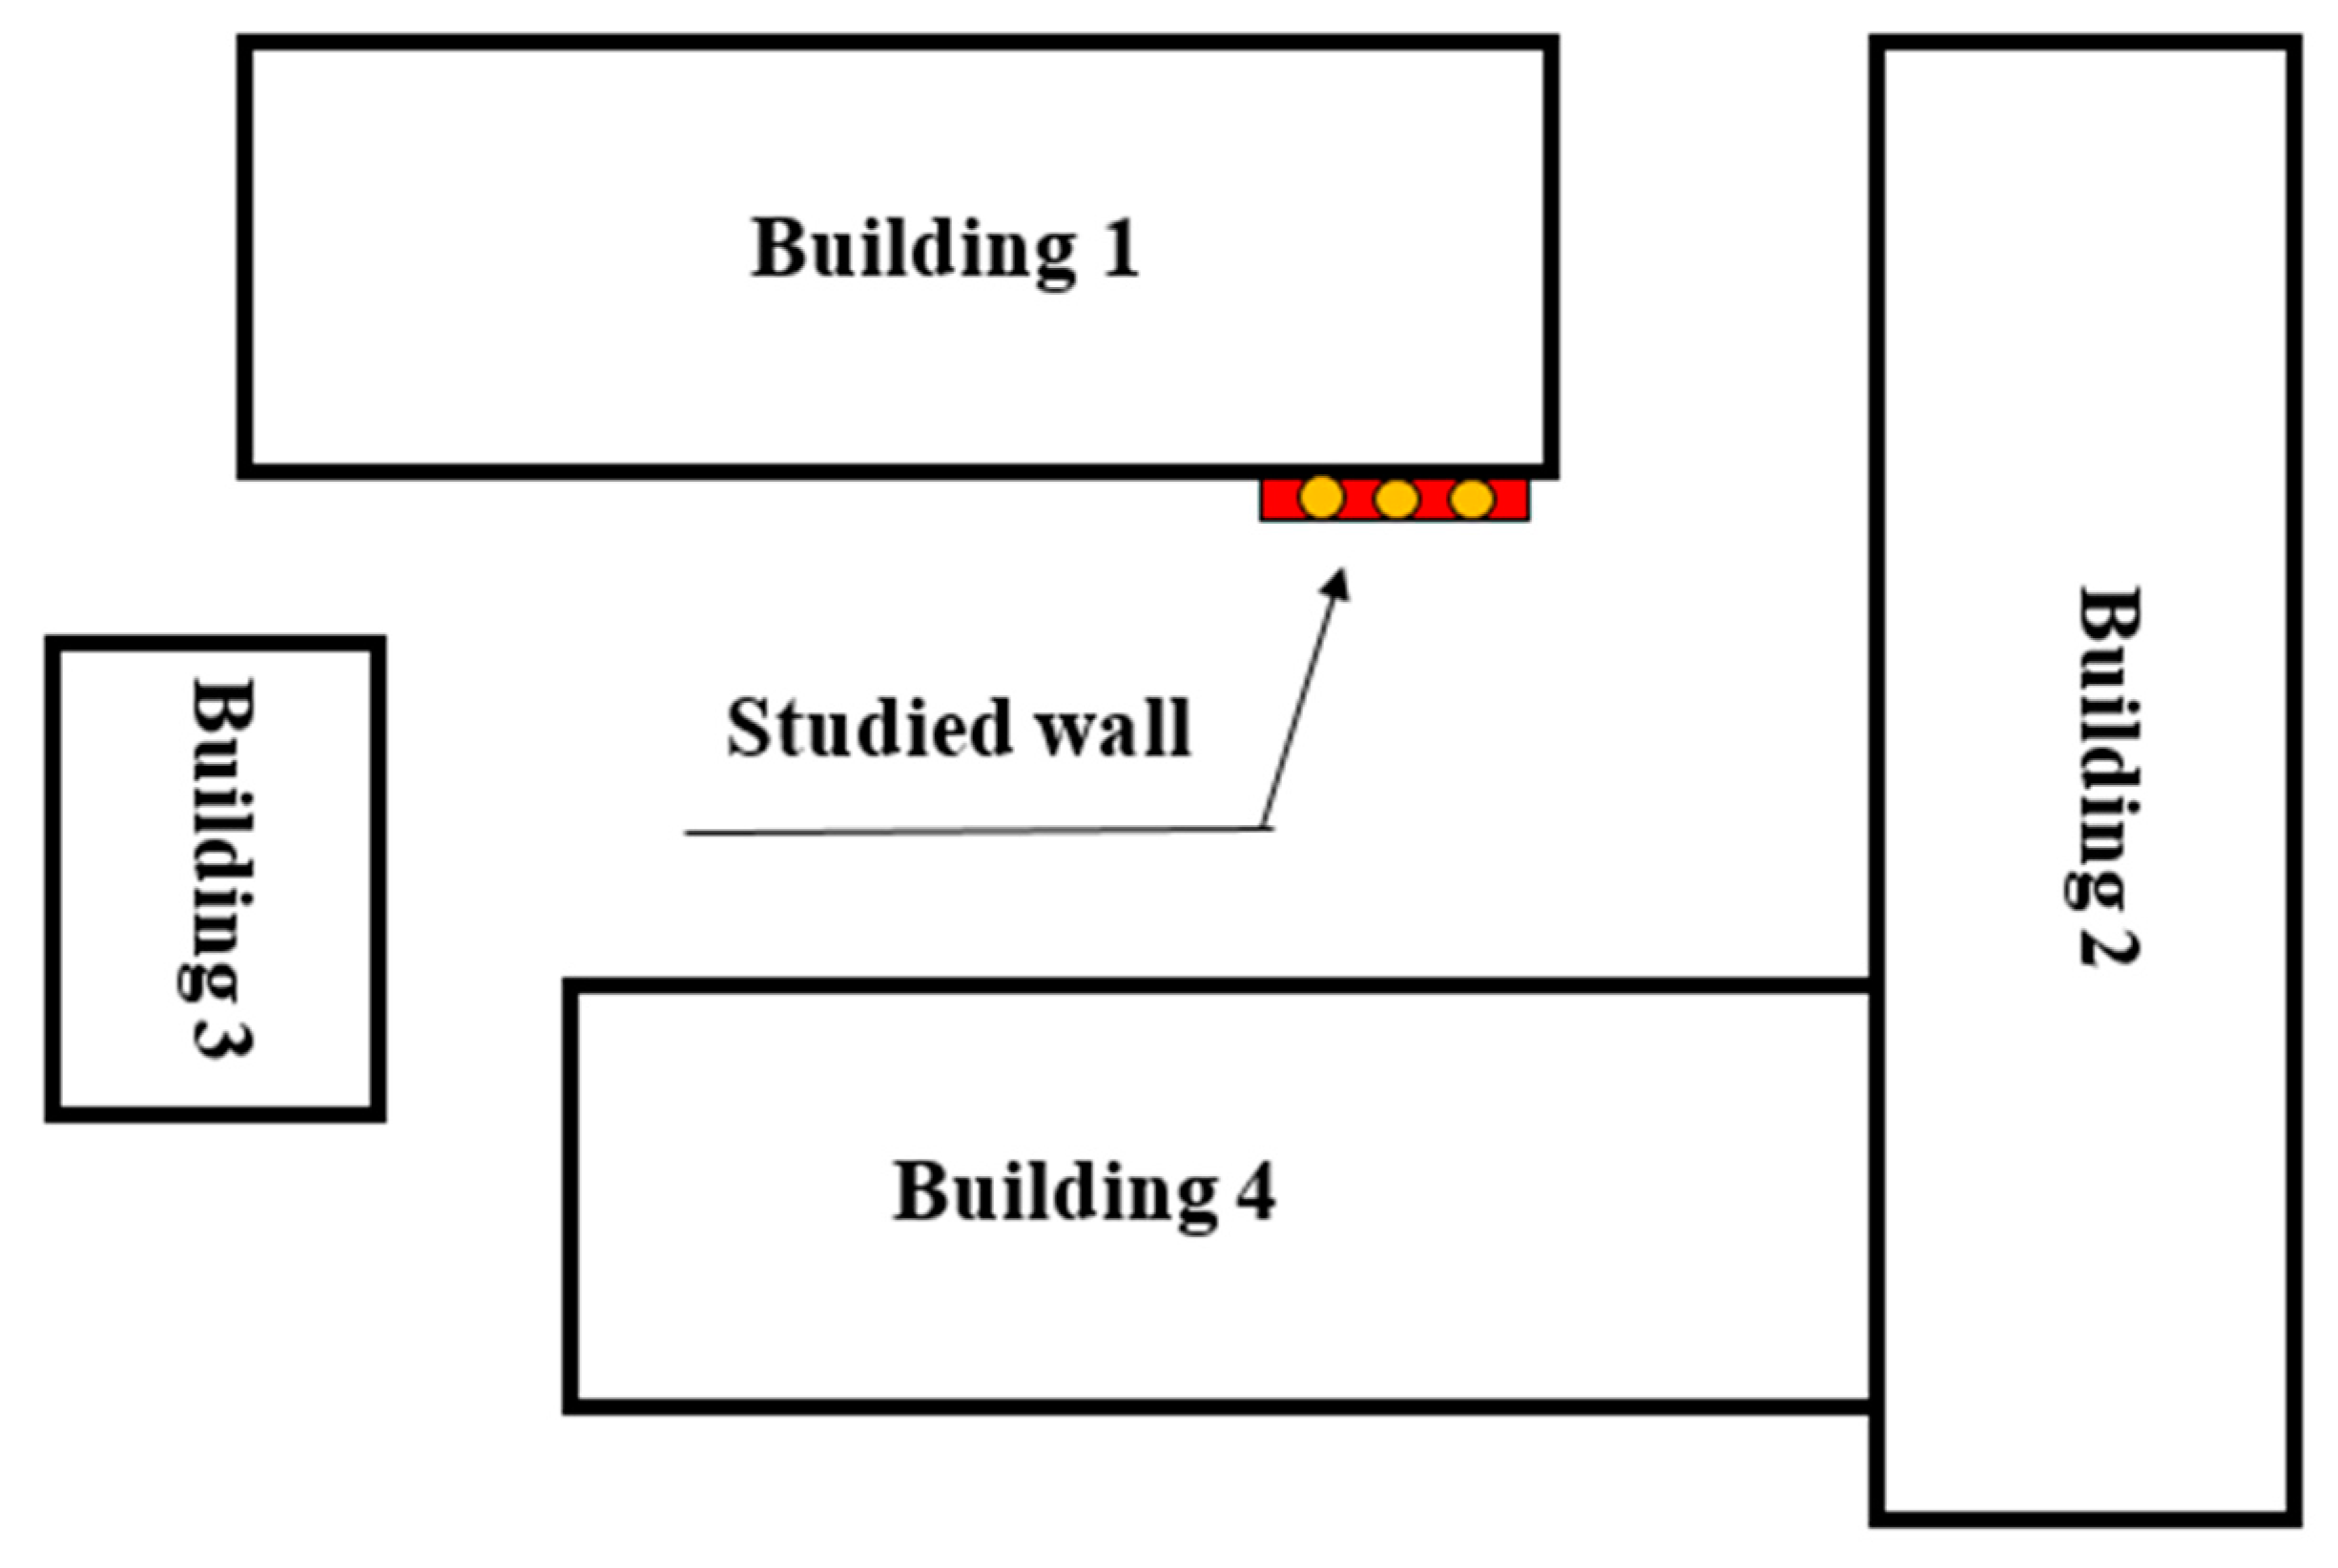
2. Study Object
3. Methodology
- (1)
- The measured heating temperature of the outer surface of the wall, tmeas °C, designed according to the FHIC system, located in the building, and the air temperature at the outlet under the canopy in the shadows, tout, °C, were measured during 28 days of the warm period of 2019. The measurements were carried out on the device ITP-MG 4.03/20(I) “POTOK” with a minimum interval of 15 min. Limits of permissible additional temperature measurement error caused by the temperature deviation of the electronic unit from 20 °C (for every 10 °C of deviation) were ±0.05 °C.
- (2)
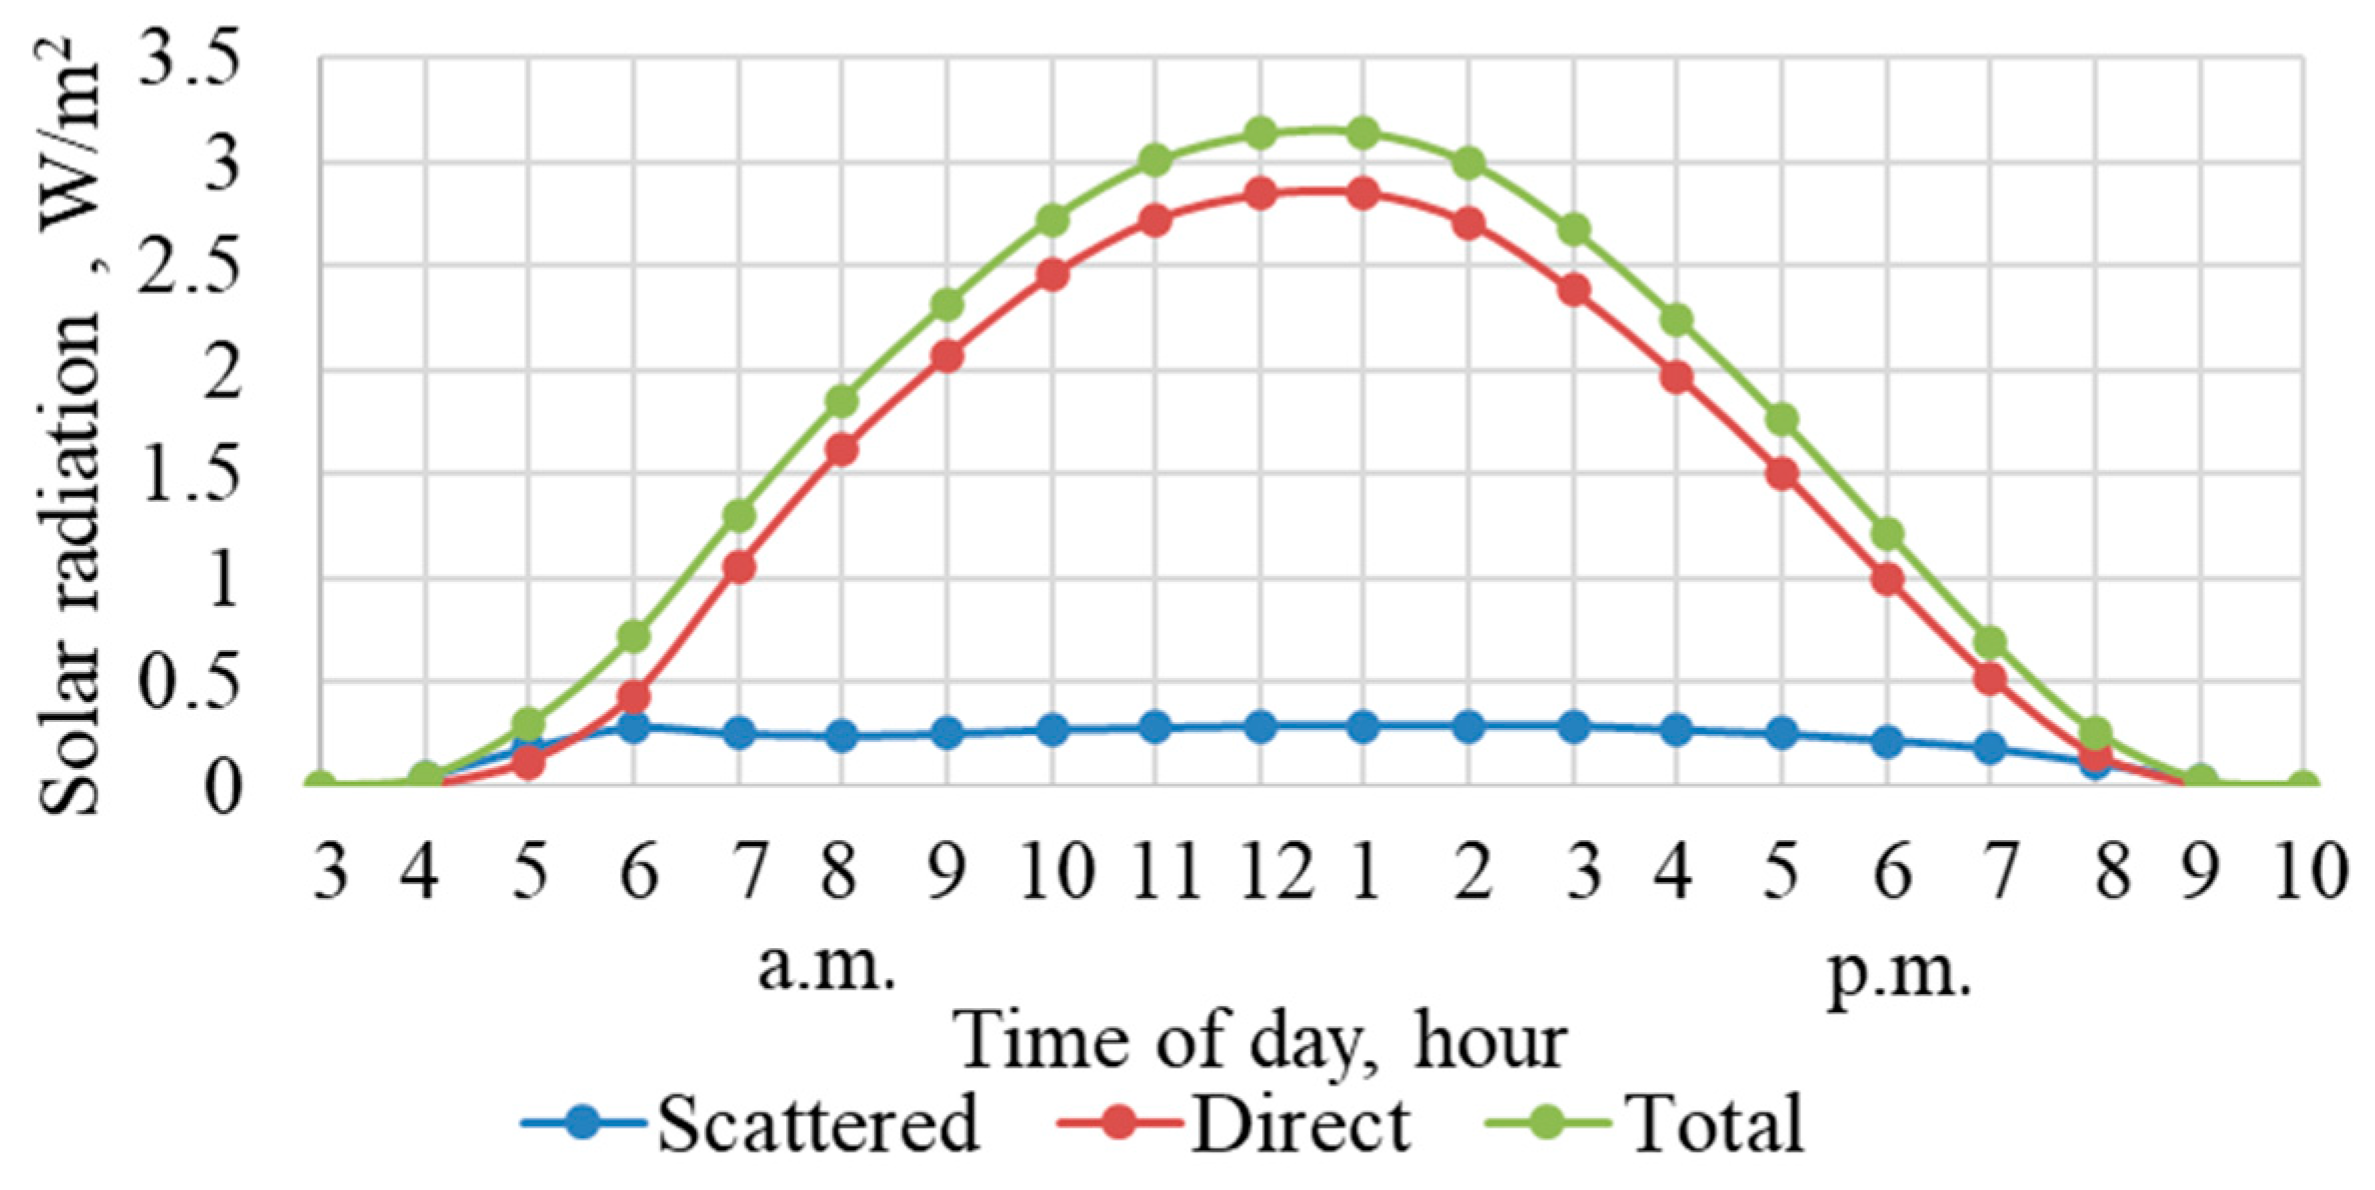
- The total radiation Ivertical (x,y) (the sum of direct and scattered solar radiation), entering the investigated section of the wall in one hour, was calculated as follows, W/m2:
- (3)
- The absorption coefficient of solar radiation (the ratio of the value of the flux of solar radiation absorbed by the sample to the value of the flux of solar radiation normally incident on the sample) was calculated based on the assumption that there is no transmitted component of solar radiation, so it is only necessary to determine the reflection coefficient of the finished coating of the wall under study with the FHIC system.
4. Results and Discussion
4.1. Processing of Meteorological Data
- Group I—These are free-of-cloudiness days and days with slight cloudiness. These days, direct radiation is practically, or not at all, obscured by clouds—5 days.
- Group II—These are the days on which cloudiness with gaps and average cloudiness is observed. These days, direct radiation is partially obscured, partially present—16 days.
- Group III—These are days with 100% cloudiness. On these days there is no direct radiation—7 days.
4.2. Correlation between Measured and Calculated Heating Temperature for Wall Surfaces under Different Irradiation Conditions
5. Conclusions
Author Contributions
Funding
Data Availability Statement
Conflicts of Interest
References
- Gagarin, V.G.; Korkina, E.V.; Shmarov, I.A. Heat Gain and Heat Loss through Glazing with High Thermal Properties. Academia Archit. Constr. 2017, 2, 106–110. [Google Scholar]
- Solov’ev, A.K. Mirror facades: Their influence on the illumination of opposing buildings. Light Eng. 2017, 2, 28. [Google Scholar]
- Korkina, E.V.; Voytovich, E.V.; Plyushchenko, N.Y.; Stolyarov, M.D. Heat access on the facade building in the development when taking into account heat exchange by radiation. Bull. BSTU Named V.G. Shukhov. 2019, 9, 46–53. [Google Scholar] [CrossRef]
- Esquivias, P.M.; Moreno, D.; Navarro, J. Solar radiation entering through openings: Coupled assessment of luminous and thermal aspects. Energy Build. 2018, 175, 208–218. [Google Scholar] [CrossRef]
- Gagarin, V.G.; Zubarev, K.P. Mathematical modeling of the unsteady moisture condition of enclosures with application of the discrete-continuous approach. Vestn. MGSU Proc. Mosc. State Univ. Civ. Eng. 2020, 15, 244–256. [Google Scholar] [CrossRef]
- Khan, R.J.; Bhuiyan, M.Z.; Ahmed, D.H. Investigation of heat transfer of a building wall in the presence of phase change material (PCM). Energy Built Environ. 2020, 1, 199–206. [Google Scholar] [CrossRef]
- Vanaga, R.; Purvins, R.; Blumberga, A.; Veidenbergs, I.; Blumberga, D. Heat transfer analysis by use of lense integrated in building wall. Energy Procedia 2017, 128, 453–460. [Google Scholar] [CrossRef]
- Agugiaro, G.; Nex, F.; Remondino, F.; Filippi, R.D.; Droghetti, S.; Furlanello, C. Solar radiation estimation on building roofs and web-based solar cadaster. ISPRS Ann. Photogramm. Remote Sens. Spat. Inf. Sci. 2012, I-2, 177–182. [Google Scholar] [CrossRef] [Green Version]
- Stadnik, V.V.; Gorbarenko, E.V.; Shilovtseva, O.A.; Zadvornykh, V.A. Comparison of the calculated and measured values of the total and scattered radiation entering the inclined surfaces, according to observations at the Meteorological Observatory of Moscow State University. Tr. Glav. Geofiz. Observ. 2016, 581, 138–154. [Google Scholar]
- Naraghi, M.; Harant, A. Configuration of Building Façade Surface for Seasonal Selectiveness of Solar Irradiation: Absorption and Reflection. J. Sol. Energy Eng. 2011, 135, 63–70. [Google Scholar] [CrossRef]
- Gracia, A.; Navarro, L.; Castell, A.; Ruiz-Pardo, A.; Álvarez, S.; Cabeza, L.F. Solar absorption in a ventilated facade with PCM. Experimental results Energy Procedia 2012, 30, 986–994. [Google Scholar] [CrossRef] [Green Version]
- Zhang, Y.; Long, E.; Li, Y.; Li, P. Solar radiation reflective coating material on building envelopes: Heat transfer analysis and cooling energy saving. Energy Explor. Exploit. 2017, 35, 748–766. [Google Scholar] [CrossRef] [Green Version]
- Alchapar, N.L.; Correa, E.N. Optothermal properties of façade coatings. Effects of environmental exposure over solar reflective index. J. Build. Eng. 2020, 32, 101536. [Google Scholar] [CrossRef]
- Yunsong, H.; Hong, Y.; Cheng, S. Simulation-Based Multiobjective Optimization of Timber-Glass Residential Buildings in Severe Cold Regions. Sustainability 2017, 9, 2353. [Google Scholar] [CrossRef] [Green Version]
- Pivovarova, Z.I. Characteristics of the Radiation Regime on the Territory of the USSR in Relation to the Requirements of Construction; Gidrometeoizdat: Leningrad, Russia, 1973; p. 128. [Google Scholar]
- Shklover, A.M.; Vasil’ev, B.F.; Ushkov, F.V. Fundamentals of Construction Heat Engineering of Residential and Public Buildings; State Publishing House of Literature on Construction and Architecture: Moscow, Russia, 1956; p. 350. [Google Scholar]
- Scientific and Applied Reference Book on the Climate of the USSR; Long-Term Data; Gidrometeoizdat: St. Petersburg, Russia, 1989–1998.
- Korkina, E.V. Graphic method of calculation of the direct solar radiation received on the facade with available opposing building. Vestnik MGSU Proc. Mosc. State Univ. Civ. Eng. 2019, 14, 237–249. [Google Scholar] [CrossRef] [Green Version]
- Korkina, E.V.; Shmarov, I.A. Analytical method of calculation of the diffuse solar radiation received on a vertical surface with partially. Izv. Vyss. Uchebnykh Zaved. Seriya Teknol. Tekst. Promyshlennosti 2018, 3, 230–236. [Google Scholar]
- Russian Standard GOST R 56709-2015; Buildings and Structures. Methods for Measuring Light Reflection Coefficients on Surfaces of Premises and Facades. Standartinform: Moscow, Russia, 2016; p. 6.
- Glants, S. Medico-Biological Statistics. Translation from English; Practice: Moscow, Russia, 1998; p. 459. [Google Scholar]


| Experimental Day | Group ID | Max (tmeas − tout), °C | Experimental Hour/Cloudiness (Points) | , °C | Shorisontal/Dhorisontal | ƩShorisontal/ƩDhorisontal |
|---|---|---|---|---|---|---|
| 8 | 1 | 9.2 | 12 a.m./2 | 6.8 | 9.8 | 9.2 |
| 9 | 1 | 8.5 | 11 a.m./0 | 6.4 | 9.6 | 9.29 |
| 11 | 1 | 8.9 | 12 a.m./2 | 6.3 | 10.6 | 9.37 |
| 17 | 1 | 7.9 | 11 a.m./1 | 5.4 | 6.23 | 4.52 |
| 18 | 1 | 8.7 | 12 a.m./2 | 5.9 | 4.14 | 3.26 |
| 1 | 2 | 8.5 | 12 a.m./8 | 4.4 | 3.17 | 2.27 |
| 2 | 2 | 8.9 | 11 a.m./3 | 4.9 | 3.08 | 2.44 |
| 3 | 2 | 5.3 | 3 p.m./9 | 1.7 | 2.51 | 0.61 |
| 4 | 2 | 6.8 | 2 p.m./12 | 2.8 | 2.68 | 1.06 |
| 5 | 2 | 6.5 | 12 a.m./12 | 4.7 | 0.88 | 0.94 |
| 6 | 2 | 6.7 | 1 p.m./7 | 4.3 | 3.54 | 2.02 |
| 7 | 2 | 6.1 | 1 p.m./8 | 4.6 | 1.02 | 1.14 |
| 14 | 2 | 6.2 | 2 p.m./7 | 2.6 | 1.37 | 0.61 |
| 15 | 2 | 7.2 | 12 a.m./6 | 4,4 | 1.95 | 1.66 |
| 16 | 2 | 7.3 | 12 a.m./4 | 3.9 | 4.31 | 1.27 |
| 19 | 2 | 5.6 | 10 a.m./6 | 3.6 | 2.21 | 1.09 |
| 20 | 2 | 6.4 | 12 a.m./7 | 4.2 | 1.23 | 0.76 |
| 21 | 2 | 7.9 | 12 a.m./5 | 5.5 | 3.49 | 1.41 |
| 22 | 2 | 7.3 | 12 a.m./8 | 5.7 | 4.29 | 5.62 |
| 23 | 2 | 7.8 | 12 a.m./12 | 5.1 | 3.83 | 2 |
| 28 | 2 | 7.1 | 12 a.m./9 | 3.8 | 0.78 | 0.45 |
| 10 | 3 | 2.1 | 12 a.m./10 | 1.3 | 0 | 0.08 |
| 12 | 3 | 4.3 | 11 a.m./8 | 1.3 | 0.02 | 0.29 |
| 13 | 3 | 4 | 12 a.m./10 | 2.6 | 0.02 | 0.09 |
| 24 | 3 | 3.1 | 11 a.m./10 | 2.2 | 0 | 0.09 |
| 25 | 3 | 1.2 | 10 a.m./10 | 0.7 | 0 | 0.02 |
| 26 | 3 | 0.4 | 9 a.m./10 | 0.2 | 0 | 0 |
| 27 | 3 | 0.6 | 11 a.m./10 | 0.3 | 0 | 0 |
| H value | 20.9 | - | 13.6 | 22.8 | 10.6 | |
| Significance level, p | <0.05 | - | <0.05 | <0.05 | <0.05 | |
| Time of Day, Hour | Average Difference between the Measured and Calculated Temperature, , °C | ||
|---|---|---|---|
| Group I, ni = 5 | Group II, ni = 16 | Group III, ni = 7 | |
| 7 | −2.4 | −1.9 | −0.9 |
| 8 | −0.8 | −1 | −0.7 |
| 9 | −0.3 | −0.2 | −0.2 |
| 10 | 0.3 | −0.2 | −0.1 |
| 11 | 0.8 | −0.2 | 0.3 |
| 12 | 0.7 | 0.1 | 0 |
| 13 | 1.2 | 0.4 | 0 |
| 14 | 0.9 | −0.1 | −0.3 |
| 15 | 1.7 | 0.5 | −0.3 |
| 16 | 0.4 | −0.2 | −0.4 |
| 17 | −0.1 | −0.3 | −0.3 |
Disclaimer/Publisher’s Note: The statements, opinions and data contained in all publications are solely those of the individual author(s) and contributor(s) and not of MDPI and/or the editor(s). MDPI and/or the editor(s) disclaim responsibility for any injury to people or property resulting from any ideas, methods, instructions or products referred to in the content. |
© 2023 by the authors. Licensee MDPI, Basel, Switzerland. This article is an open access article distributed under the terms and conditions of the Creative Commons Attribution (CC BY) license (https://creativecommons.org/licenses/by/4.0/).
Share and Cite
Korkina, E.V.; Gorbarenko, E.V.; Voitovich, E.V.; Tyulenev, M.D.; Kozhukhova, N.I. Temperature Evaluation of a Building Facade with a Thin Plaster Layer under Various Degrees of Cloudiness. Energies 2023, 16, 5783. https://doi.org/10.3390/en16155783
Korkina EV, Gorbarenko EV, Voitovich EV, Tyulenev MD, Kozhukhova NI. Temperature Evaluation of a Building Facade with a Thin Plaster Layer under Various Degrees of Cloudiness. Energies. 2023; 16(15):5783. https://doi.org/10.3390/en16155783
Chicago/Turabian StyleKorkina, Elena V., Ekaterina V. Gorbarenko, Elena V. Voitovich, Matvey D. Tyulenev, and Natalia I. Kozhukhova. 2023. "Temperature Evaluation of a Building Facade with a Thin Plaster Layer under Various Degrees of Cloudiness" Energies 16, no. 15: 5783. https://doi.org/10.3390/en16155783