1. Introduction
Solar simulators are used for controllable measurements of the properties of solar cells in indoor environments. Multiple types of light sources can be used when designing these instruments, such as light-emitting diodes (LEDs), halogen light sources, gas discharge lamps, and their combinations [
1]. The high conversion efficiency of LEDs and their long life are among the most important reasons why LED-based solar simulators are becoming more and more popular. In one of the first works in which 1 Sun irradiance was achieved within a 200 mm × 200 mm area, LEDs were used to augment the spectrum of halogen emitters in the 375 nm to 680 nm spectral range and provided up to
irradiance [
2]. The improving availability of high-power LED devices had led to multiple and sometimes divergent optimization pathways. An LED-only solar simulator for small laboratory devices of up to 5 cm in size was demonstrated using 19 LEDs of six different models with an extremely simplified light concentration solution based on individual reflectors for a part of the LED array in [
3]. For the smallest solar cells, an additional solution of light concentration can be completely avoided, even with fourteen types of light sources, as demonstrated for a low-cost simulator for a
illuminated area [
4].
Multiple light homogenization solutions are applied when the uniformly illuminated area or number of source types has to be increased. For example, a set of individual aplanatic and plano-convex lenses and a larger lens common to all sources allowed for the incorporation of sixteen LED models in the simulator for a 70 mm × 70 mm illuminated area [
5]. A dodecahedron-shaped reflector for five light sources ensures less than 2% non-uniformity within 72% of the inscribed circle of the aperture in the case of a solar simulator with five source types [
6]. Similar non-uniformity is also achieved with a spherical Lambertian reflector [
7]. Common reflectors for the entire LED array can provide similar performance and allow for the construction of larger simulators of multiple sizes. Recently, such scalable simulators were demonstrated with hexagonal [
8] and rectangular [
9] layouts. Hexagonal LED patterns and a rectangular shape of the illuminated area can also be obtained simultaneously by tessellation of rectangular printed circuit boards [
10].
The introduction of the most recent version of the IEC 60904-9:2020 standard [
11] also changed several criteria with respect to how spectra of solar simulators have to be evaluated. A broader spectral range of 300 nm to 1200 nm is now required, which is split to six narrower bands of nearly equally integrated spectral irradiance. The A+-class is now defined in this new version of the standard and can be assigned to solar simulators if the deviations of the respective spectral irradiance integrals do not exceed
. Definitions for the A, B, and C classes remain unchanged:
for class A,
for class B, and between
and
for class C. An additional two letters are assigned based on non-uniformity of irradiance and temporal instability, with four classifications available for each parameter. In this work, however, we focus our efforts on the spectral properties of solar simulators.
The spectral deviation factor from the so-called global air mass 1.5 spectrum (AM1.5G, [
12]) now has to be evaluated together with the spectral coverage factor. These parameters have to be evaluated for solar simulators, but strict limits for the values of these parameters are not introduced. Naturally, the use of broad-spectrum sources can potentially reduce the spectral deviation and increase the spectral coverage; therefore, the update to the standard is a good reason to revisit hybrid solar simulator designs with halogen emitters, which previously enabled A-class spectrum match in more ranges than strictly required by the IEC 60904-9 Ed.2 standard [
13]. This new version of the standard also envisages procedures for the evaluation of spectral mismatch errors that occur due to variation of spectral responsivities of solar cells. Virtual spectral responsivities are introduced for several of the most common solar cell types when less than four data series are available. As specified in this standard, nearly the entire 300 nm to 1200 nm spectral range is expected to be usable by crystalline or multicrystalline silicon (c-Si or mc-Si), and copper indium gallium diselenide (CIGS) solar cells, with only external quantum efficiency reduction near the edges of this range. Much narrower spectral ranges are assigned to other types of solar cells, such as amorphous silicon (a-Si), cadmium telluride (CdTe), and microcrystalline silicon (µc-Si). These virtual responsivity spectra are varied by shifting the breaking points of the respective curves by 5 nm four times when calculating the spectral mismatch parameters according to the IEC 60904-9:2020 standard [
11].
CdTe solar cells can serve as a practical example of the broadening of the high-responsivity spectrum part of experimentally demonstrated devices once new technology developments are introduced. In the past, devices of up to 16% efficiency mostly relied on a relatively simple structure consisting of a copper-doped CdTe (CdTe:Cu) absorber and cadmium sulfide (CdS) buffer layers. Current devices of more than 20% efficiency may include graded bandgap absorbers, alternative buffer materials, different absorber doping levels, and additional back contact layers [
14]. These changes can lead to more pronounced changes in specific parts of the spectrum: thinning of the CdS:O buffer layer to below 40 nm can improve the external quantum efficiency at wavelengths near 400 nm [
15]; switching to the alloyed CdSe
xTe
1−x/CdTe bilayer absorber leads to a substantial improvement in external quantum efficiency (EQE) of around 850 nm [
16]; replacement of traditional Cu doping with As leads to an increase in the majority carrier density by several orders of magnitude and leads to 20.8% efficient solar cells [
17] with relatively high EQE both in the IR and UV parts of the spectrum. With further improvements, more than 60% EQE at 300 nm was recently reported for 22% efficient CdSeTe solar cells [
18].
Microcrystalline silicon (µc-Si) solar cells are another example of thin film cells that underwent significant modifications of the EQE spectrum during the last decade of research. The application of honeycomb-shaped textures to the back reflector led to a substantial increase in EQE in the 700 nm to 1100 nm range when compared to devices with a flat reflector, simultaneously increasing the efficiency of solar cells to 10.5% [
19]. The application of high-quality material led to 10.69% cells with just 1.8 µm of Si in [
20]. Despite a slightly higher overall efficiency, the reported EQE of this device quickly approached zero for wavelengths below 380 nm, while an EQE of approximately 20% was reported at 300 nm in [
19]. µc-Si solar cells with 11.0% efficiency were reported in [
21], including the comparison of EQE spectra with or without an additional antireflective coating. Application of this coating increased the EQE to above 350 nm at the expense of an EQE reduction near 300 nm, leading to an overall steeper growth of EQE with increasing wavelength. In the case of recently demonstrated 11.8% efficient cells [
22], the EQE was improved in visible and infrared ranges, but a very low EQE was reported below 380 nm, similarly to [
20]. Such variety of EQE spectrum shapes and combinations of slopes in the UV and IR ranges makes testing of these solar cells extremely challenging, with a high risk of spectrum mismatch effects.
The novelty of the standard update [
11] led to a transitional period during which both current and previous versions were referenced in recent publications, including studies presenting extensions that are not strictly required under a previous version. For example, an AAA-class solar simulator and an extension of the spectrum into the UV region was demonstrated in [
23], but older version of the standard were referenced. Previously, it was also demonstrated how spectrum extension into the UV and IR ranges can be employed for efficient spectral characterization of solar cells and modules in order to reveal additional information about the properties of materials and the operation of solar cells [
24]. The new version of the standard is referenced in [
25,
26], where a AAA-class solar simulator for a large illuminated area of 640 cm
2 and a low-cost solar simulator for a 70 cm
2 area were demonstrated. A large illuminated area of 52 cm × 52 cm was also achieved with an ABA-class solar simulator in [
27] based on a previous version of the standard. Multiple AAA solar simulator designs were presented in a recent review [
28], which also introduced new requirements; however, no simulators with an A+-class spectrum were included. The observable scarcity of publications about LED-based solar simulators of the highest A+-class spectrum classification confirms substantial technical difficulties when implementing such designs. Furthermore, to the best of our knowledge, no in-depth analysis of expected spectral mismatch effects in the case of CdTe/CdSeTe and µc-Si cells had been performed at the time of submission of this paper for solar simulators with a low number of LED source types.
The goal of this paper is to present a method for achieving A+-class solar simulator spectrum classification with just five light source types, simultaneously ensuring minimization of spectral mismatch errors in cases of CdTe/CdSeTe and µc-Si cells. Both LED-only and hybrid configurations with halogen lamps are evaluated in a series of numerical calculations. A+-class solar simulators that employ the minimum set of light sources are presented first, followed by an in-depth analysis of the expected spectrum mismatch effects in the cases of µc-Si and CdTe solar cells when either additional sources or irradiance from already selected sources is adjusted. The optimized solar simulators are expected to ensure a substantial reduction in spectral mismatch errors in comparison with simulators based on a single Xe lamp, as our results demonstrate.
2. Materials and Methods
The spectra of six light sources were used in this study. Their properties are listed in
Table 1. Two optimization pathways are considered. In the LED-only configuration, cool white Bridgelux BXRA-56C9000-J (Bridgelux Inc., Fremont, CA, USA) arrays serve as the major light source for first three wavelength intervals (300 nm to 657 nm) specified by the IEC 60904-9:2020 standard [
11]. For other three intervals, 740 nm, 850 nm, and 1050 nm devices are used. High-power LED devices of these wavelengths are typically used for horticulture, security, machine vision, and other applications and are therefore broadly commercially available. These specific models of cool white, 740 nm, and 850 nm LEDs were previously used in our AAA-class solar simulator developed for the previous version of the IEC 60904-9 standard [
9]. Therefore, separately measured spectra of these LED arrays are used in this study. Due to IR spectrum extension in the newest version of the standard, the spectrum of a single 1050 nm emitter is employed instead of the 940 nm LED spectrum used previously in [
9]. For hybrid simulator configurations, the combination of cool white LED arrays and halogen emitters serves as the main light source. The spectrum of the Bentham CL2-calibrated emitter (Bentham Instruments Limited, Reading, UK) serves as a spectrum example of a halogen lamp source. Again, other direct color LEDs serve the purpose of fine tuning of the spectrum. The measured spectrum of a 365 nm UV LED is employed in both configurations for adjustments in the UV range.
Spectral match of solar simulators is evaluated by calculating the relative deviations (
) of irradiance in six spectral intervals defined in [
11]:
where
is the relative deviation in the i-th interval,
is the spectral irradiance of the solar simulator, λ is the wavelength,
is the required irradiance in the i-th wavelength interval under AM1.5G conditions (
),
and
are the minimum and maximum wavelengths of these intervals, respectively. All spectra used in this study were converted to equidistant spectra with a relatively dense wavelength spacing of
for numerical integration.
For each numerically generated spectrum, the AM1.5G spectral coverage (
), the spectral deviation (
), and the spectral mismatch factors (
) were also calculated as defined in [
11]:
where
and
are spectral responsivities of device numbers
i and
j, respectively, and
is the required spectral irradiance under AM1.5G conditions. As suggested in Annex A of [
11], we used five spectra with a dispersion unit of
and multipliers of
in our analysis.
3. Results and Discussion
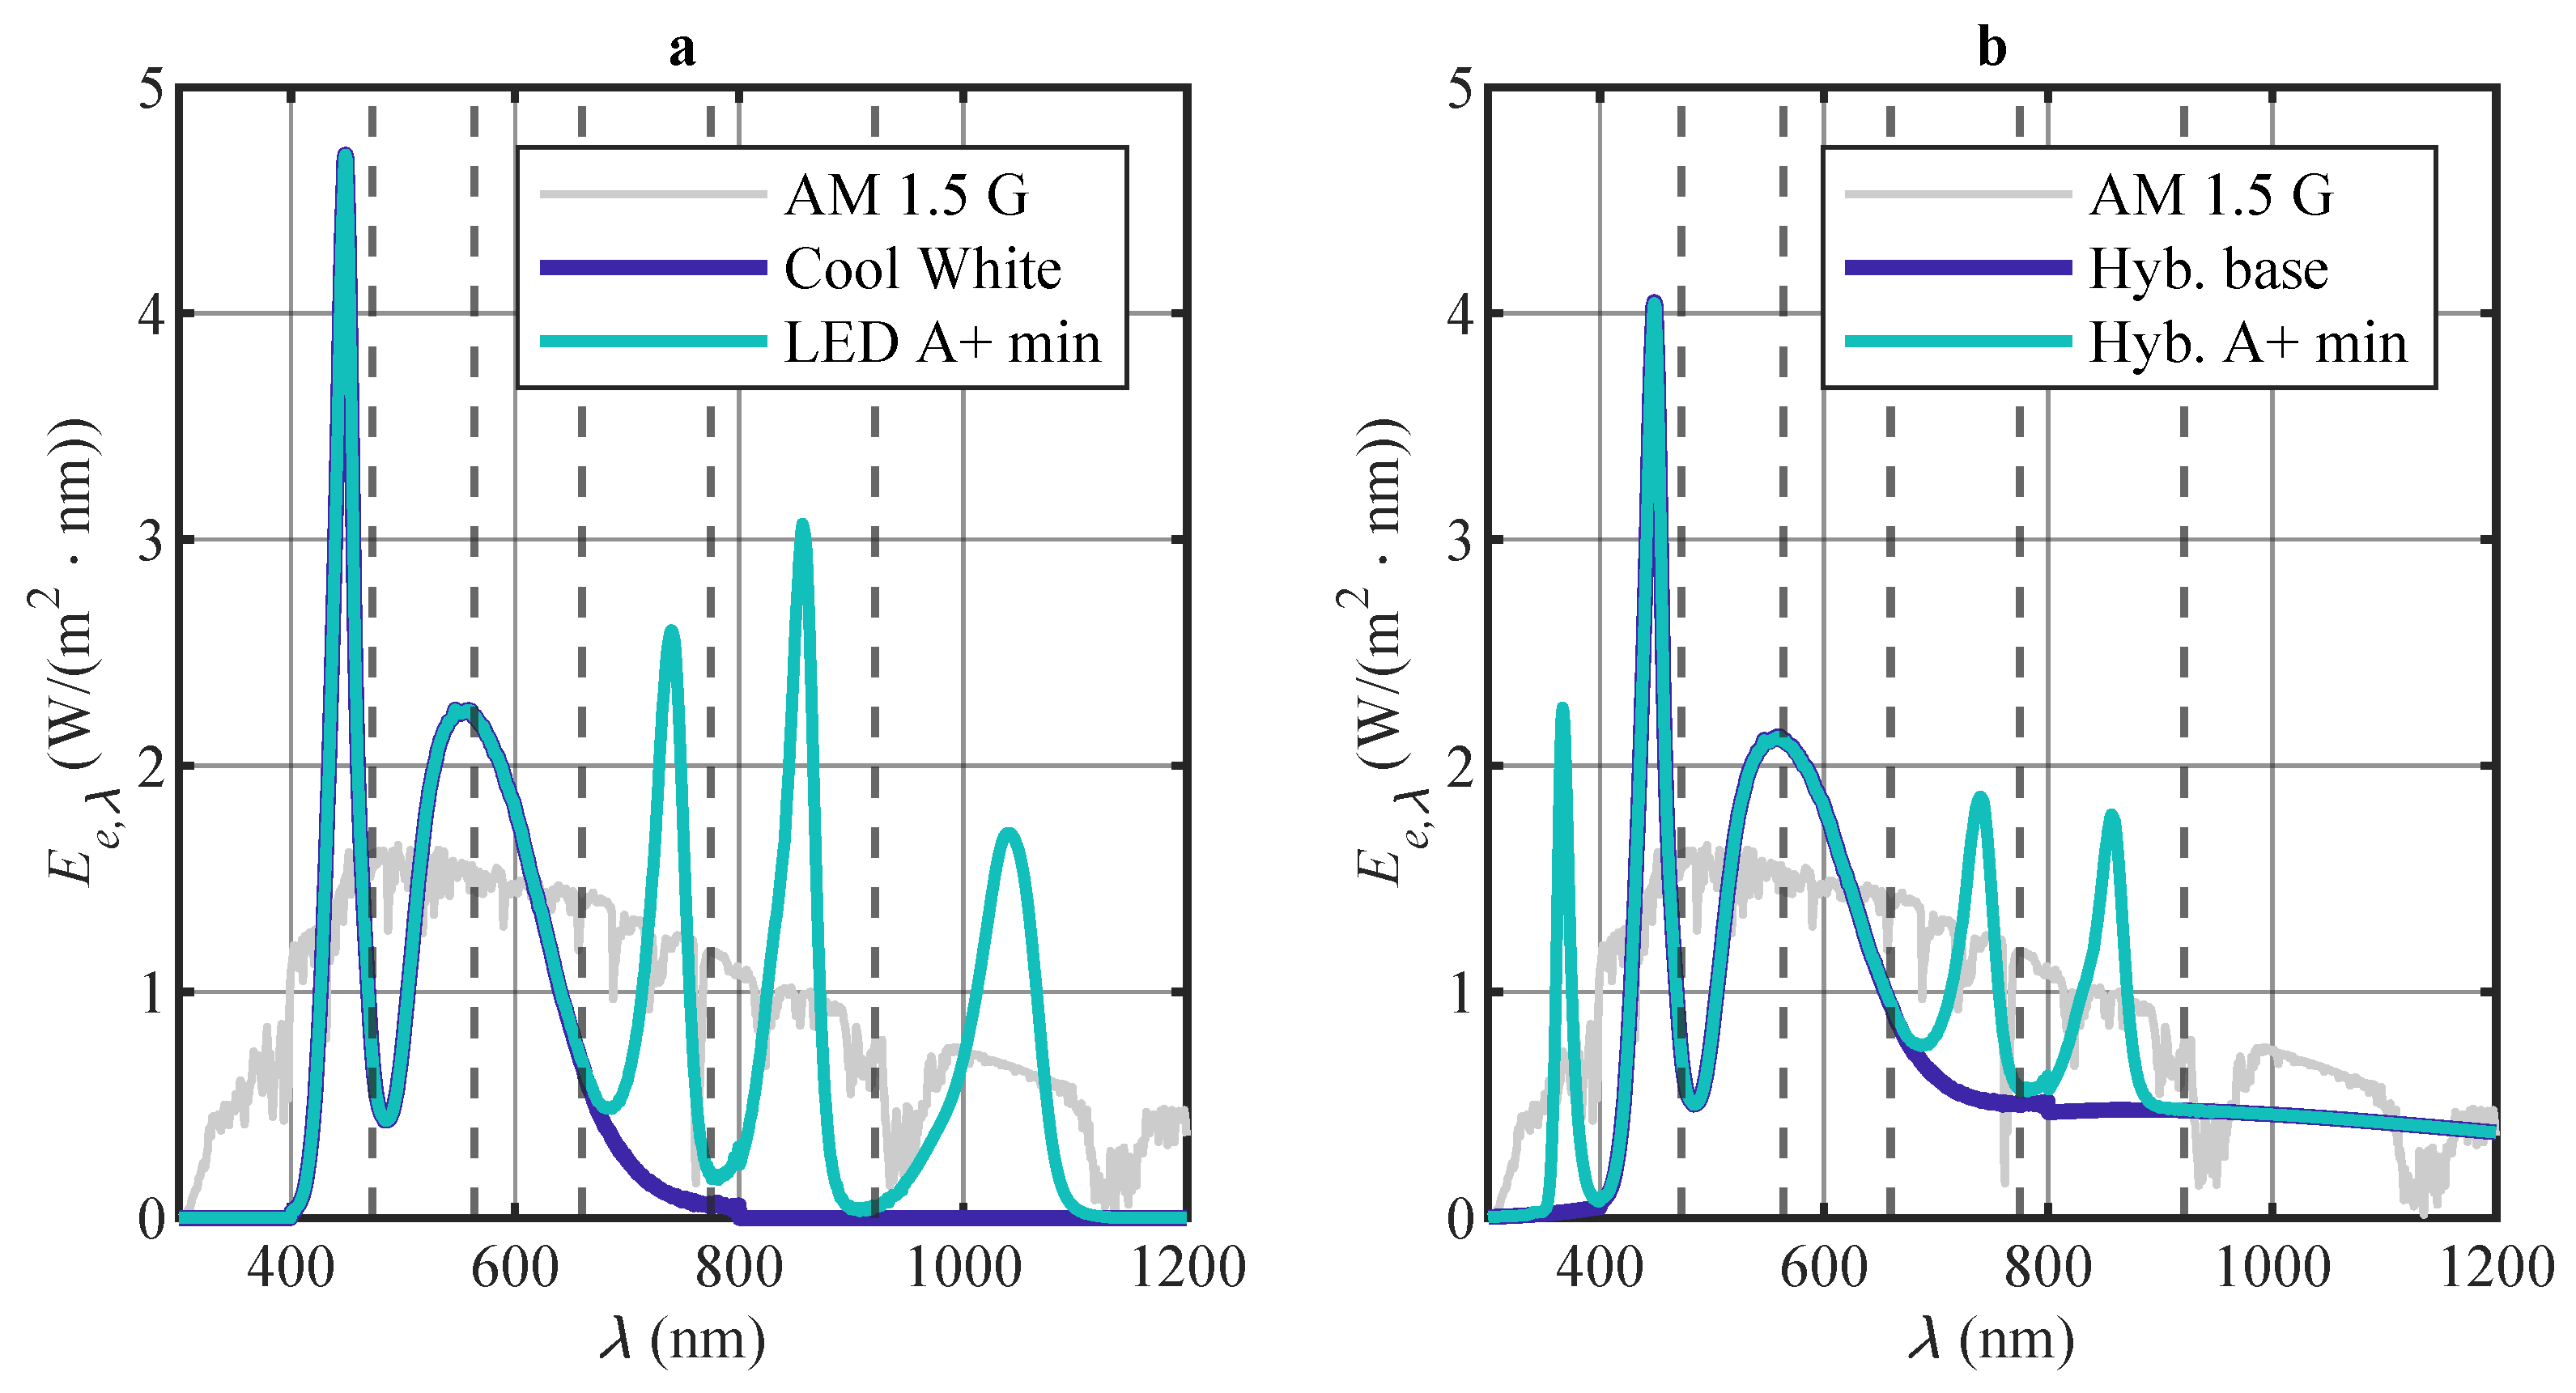
The solar simulator spectra were numerically optimized in several steps. First, irradiance from main sources was adjusted to ensure further compatibility with A+-class requirements at 1 Sun irradiance of
(
in the 300–1200 nm range) with the minimum number of additional sources required (
Figure 1). In the LED-only configuration, cool white LEDs serve as a main source, providing enough light in the first three spectral intervals. Due to their spectral properties, the minimum irradiance in the first interval with
corresponds to a slight deficiency with
in the second interval and to excess of light in the third interval with
. In the hybrid configuration, a combination of white LEDs and halogen lamp-based emitters serves as a major source combination. An overlap of their spectra might quickly lead to substantial excess of light in the third interval. By aiming to provide sufficient irradiance from halogen emitters to match the A+ spectrum requirements in at least the sixth spectral interval, we have to limit the irradiance from white LEDs. With the maximum allowable
, compatibility is also ensured in the second (
) interval, while additional sources remain necessary for the first interval.
Such a selection of the main sources allows us to reach the
minimum in the next step just by using high-power LEDs of commonly commercially available wavelengths. Minimum irradiance in the fourth and fifth intervals can be reached by adding 740 nm and 850 nm emitters in both simulator configurations. In the LED-only configuration, 1050 nm emitters are added in the sixth interval. In the hybrid simulator configuration, 365 nm UV LEDs can correct for the light deficiency in the first interval. After this step, we have two solar simulator configurations with
and available irradiance margin for either adjusting or adding additional sources, depending on specific requirements for various types of solar cells. Detailed information on already discussed and additional simulator configurations is presented in
Appendix A.
3.1. Optimization for CdTe Solar Cells
The following steps were taken to optimize the LED-only solar simulator for CdTe solar cells:
Adjustment of 740 nm LEDs to lower SMM on the red/IR side of the spectrum;
Addition of 365 nm LEDs to lower SMM on the UV side;
Adjustment of 1050 nm LEDs to match total AM1.5G irradiance required.
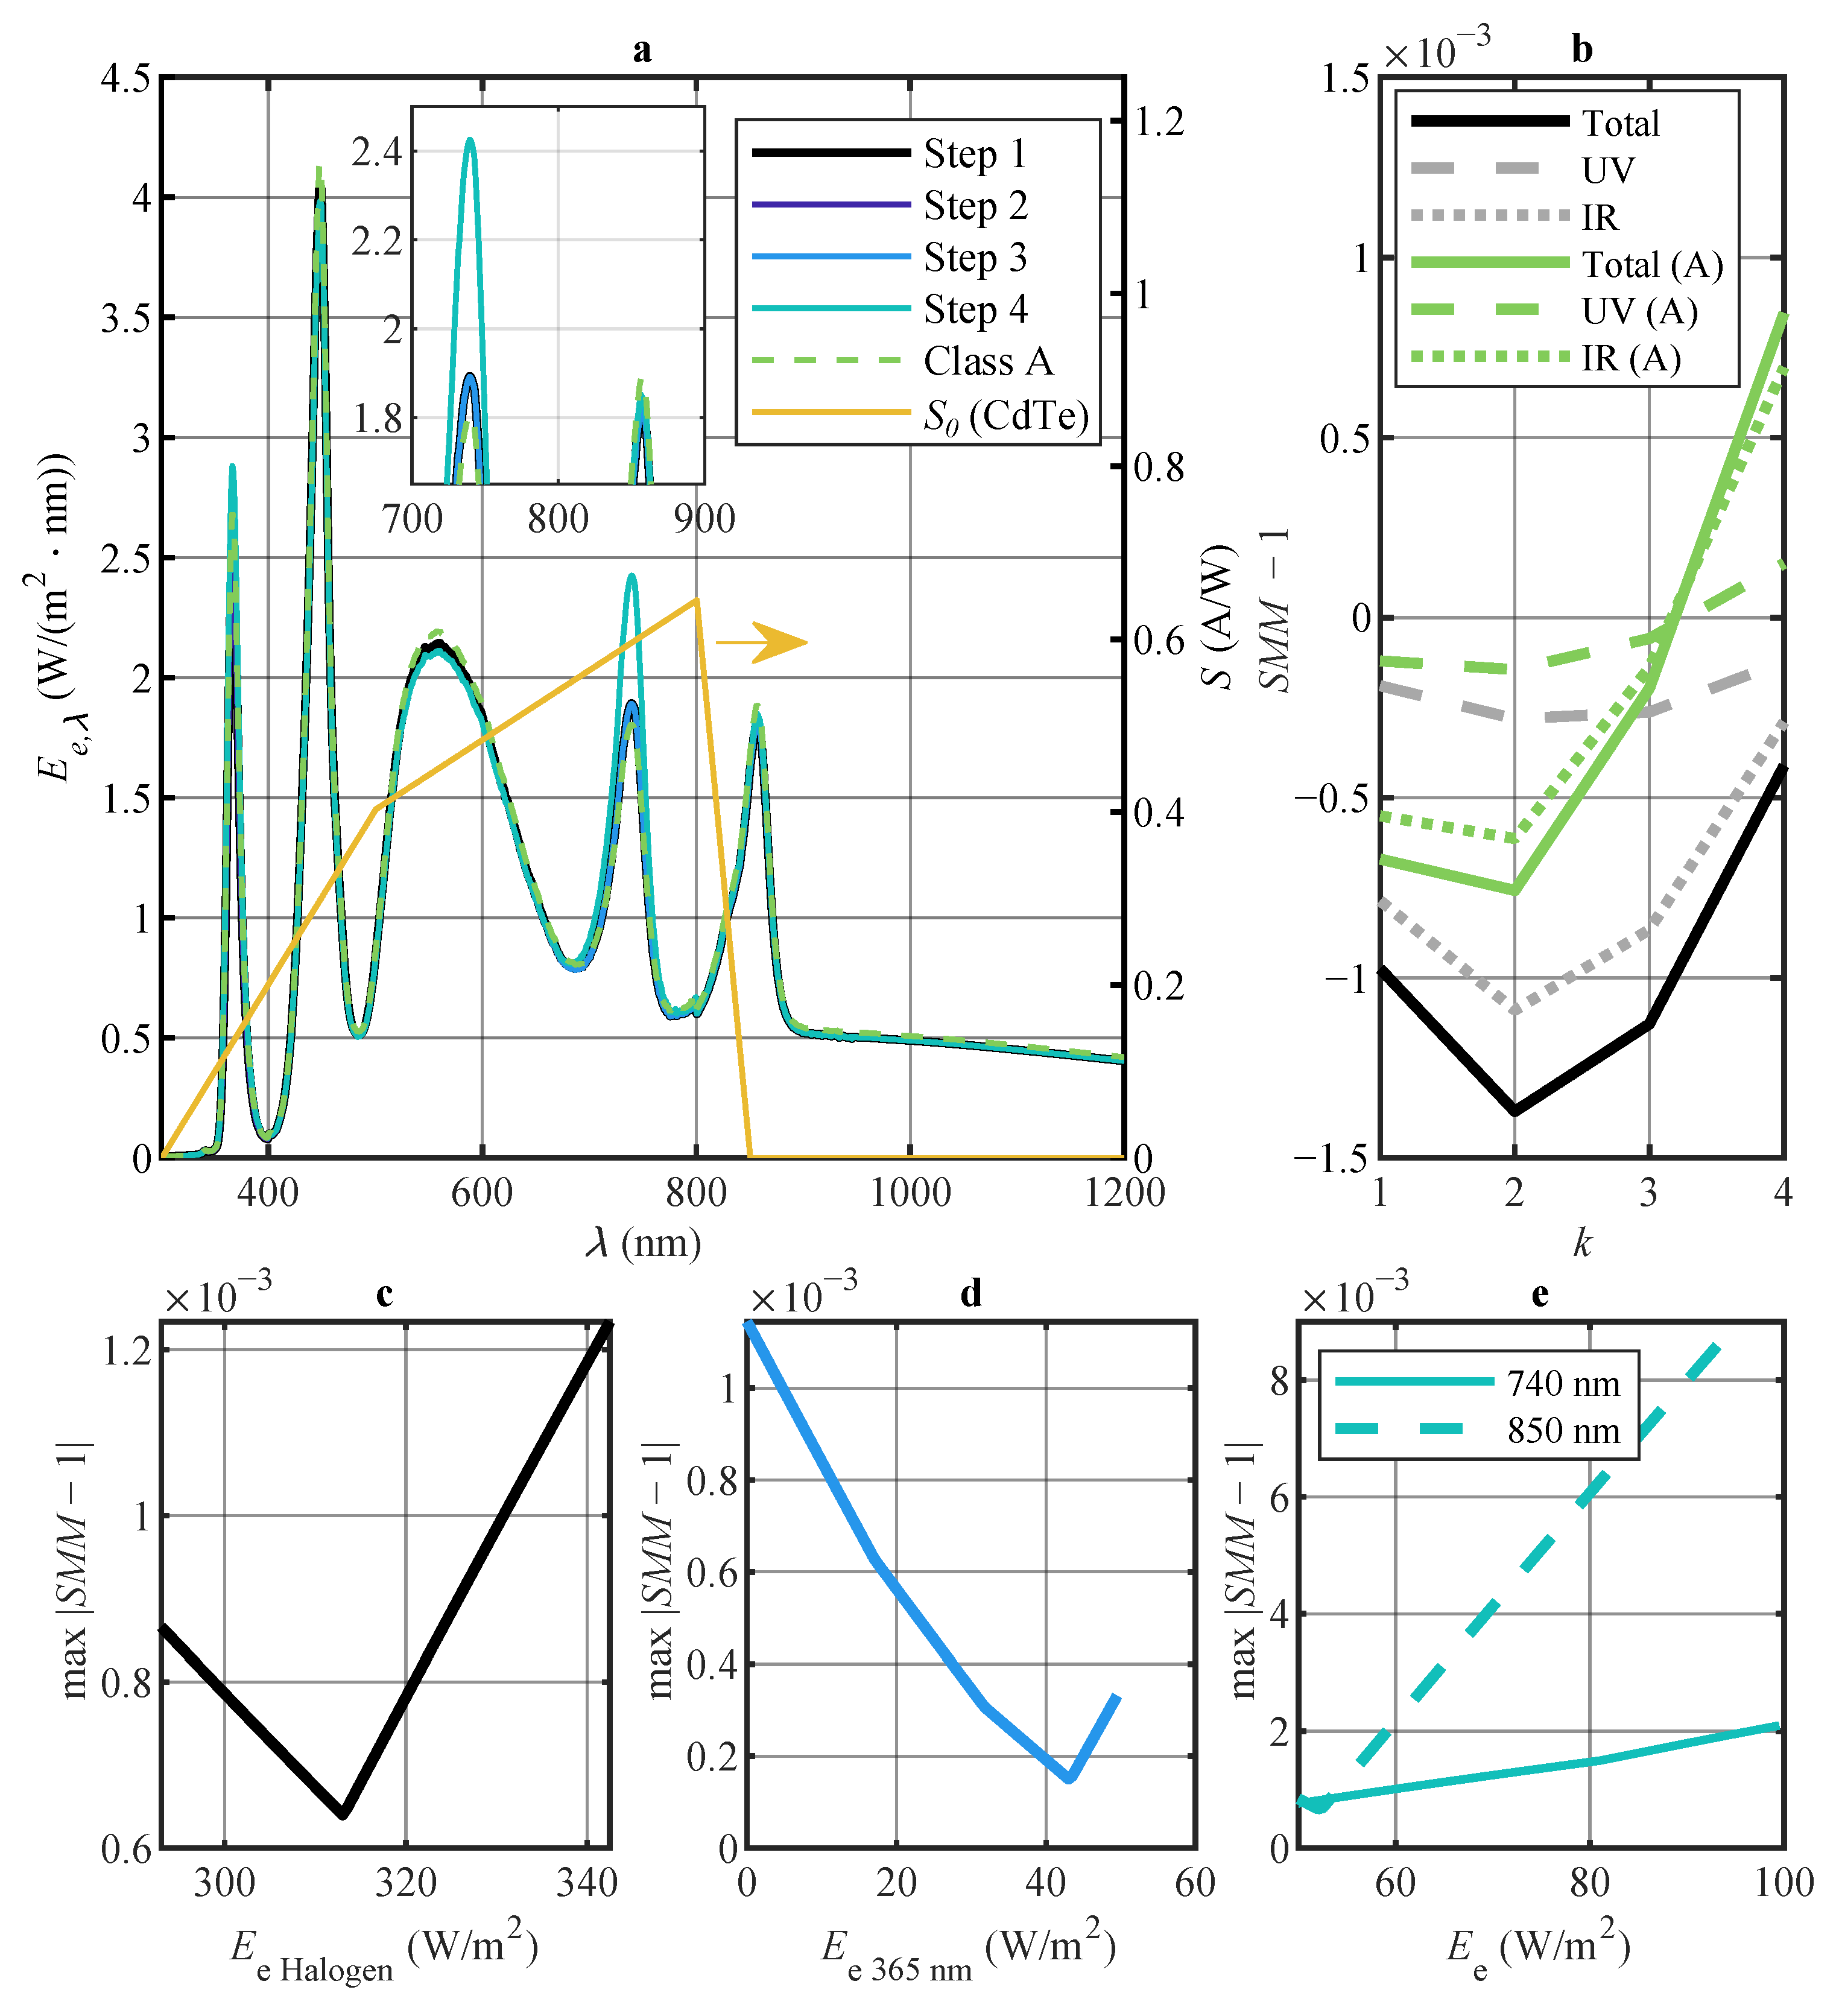
The results of this optimization are presented in
Figure 2. Two spectral reponsivity dependencies on the wavelength for
and
are also shown in panel (a) of the figure.
First, adjustments of both far red 740 nm and 850 nm IR LEDs were evaluated (
Figure 2c). Additional irradiance from 850 nm LEDs was found to be detrimental due to the increase in the
deviation. Therefore, it was left at the minimum required for an A+-class spectrum in the fifth interval. Adjustment of 740 nm LEDs led to the improvement of this parameter at
Ee 740 nm = 124 W/m
2 irradiance, which was then was for the next step. Afterwards, the addition of 365 nm LEDs led to the minimum
value at
Ee 365 nm = 26.5 W/m
2 (
Figure 2d). Again, this value was fixed before the next step. Finally, to obtain the total required irradiance, 1050 nm LEDs were adjusted. Due to the lack of responsivity of CdTe solar cells in this range, this adjustment had no influence on
SMM values (
Figure 2e).
The following steps were taken to optimize the hybrid solar simulator for CdTe solar cells:
Adjustment of the irradiance from halogen lamps to lower SMM on the red/IR side of the spectrum;
Lowering of the irradiance from cool white LEDs to fit into the A+ spectrum limits in the third interval;
Addition of of 365 nm LEDs to lower SMM on the UV side of the EQE spectrum;
Adjustment of 740 nm and 850 nm LEDs to match the total AM1.5G irradiance required.
The results of this optimization are presented in
Figure 3.
First, adjustment of the halogen lamp irradiance led to
minimum at
Ee Halogen = 313 W/m
2. This value then was fixed for the next step (
Figure 3c). Afterwards, the irradiance of cool white LEDs was lowered to
Ee C.White = 357 W/m
2 and fixed in order to fulfill A+-class irradiance requirements in the third interval. Then, adjustment of 365 nm LEDs led to the minimum
value at
Ee 365 nm = 43 W/m
2 (
Figure 3d). Again, this value was fixed before the next step. Finally, adjustments of both far red 740 nm and 850 nm LEDs were evaluated (
Figure 3e). The
trough for 850 nm LEDs was found at
Ee 850 nm = 52 W/m
2, so this value was fixed, and the irradiance of 740 nm LEDs was set to
Ee 740 nm = 67.1 W/m
2, thus obtaining the total required irradiance. Although the
values increased after the last step, there is an irradiance limitation in the third interval produced by the combination of the spectra of cool white LEDs and halogen lamps, leaving the red LEDs the only option to adjust.
Alternatively, further reduction of is possible if the requirement for the A+-class spectrum is relaxed. In this case, after step 1, the irradiance of 740 nm and cool white LEDs was adjusted to their optimal values for minimal max values on the IR side, also allowing for minimal absolute values of to be achieved. After scaling the irradiance of every LED type proportionally up to the required AM1.5G value, the obtained spectrum was class A only due to spectral deviation in the third interval (+16.9%).
3.2. Optimization for µc-Si Solar Cells
The following steps were taken to optimize the LED-only solar simulator for µc-Si solar cells:
Addition of 365 nm LEDs to lower SMM on the UV side of the spectrum;
Adjustment of 1050 nm LEDs to lower SMM on the IR side;
Adjustment of 740 nm LEDs to match the total AM1.5G irradiance.
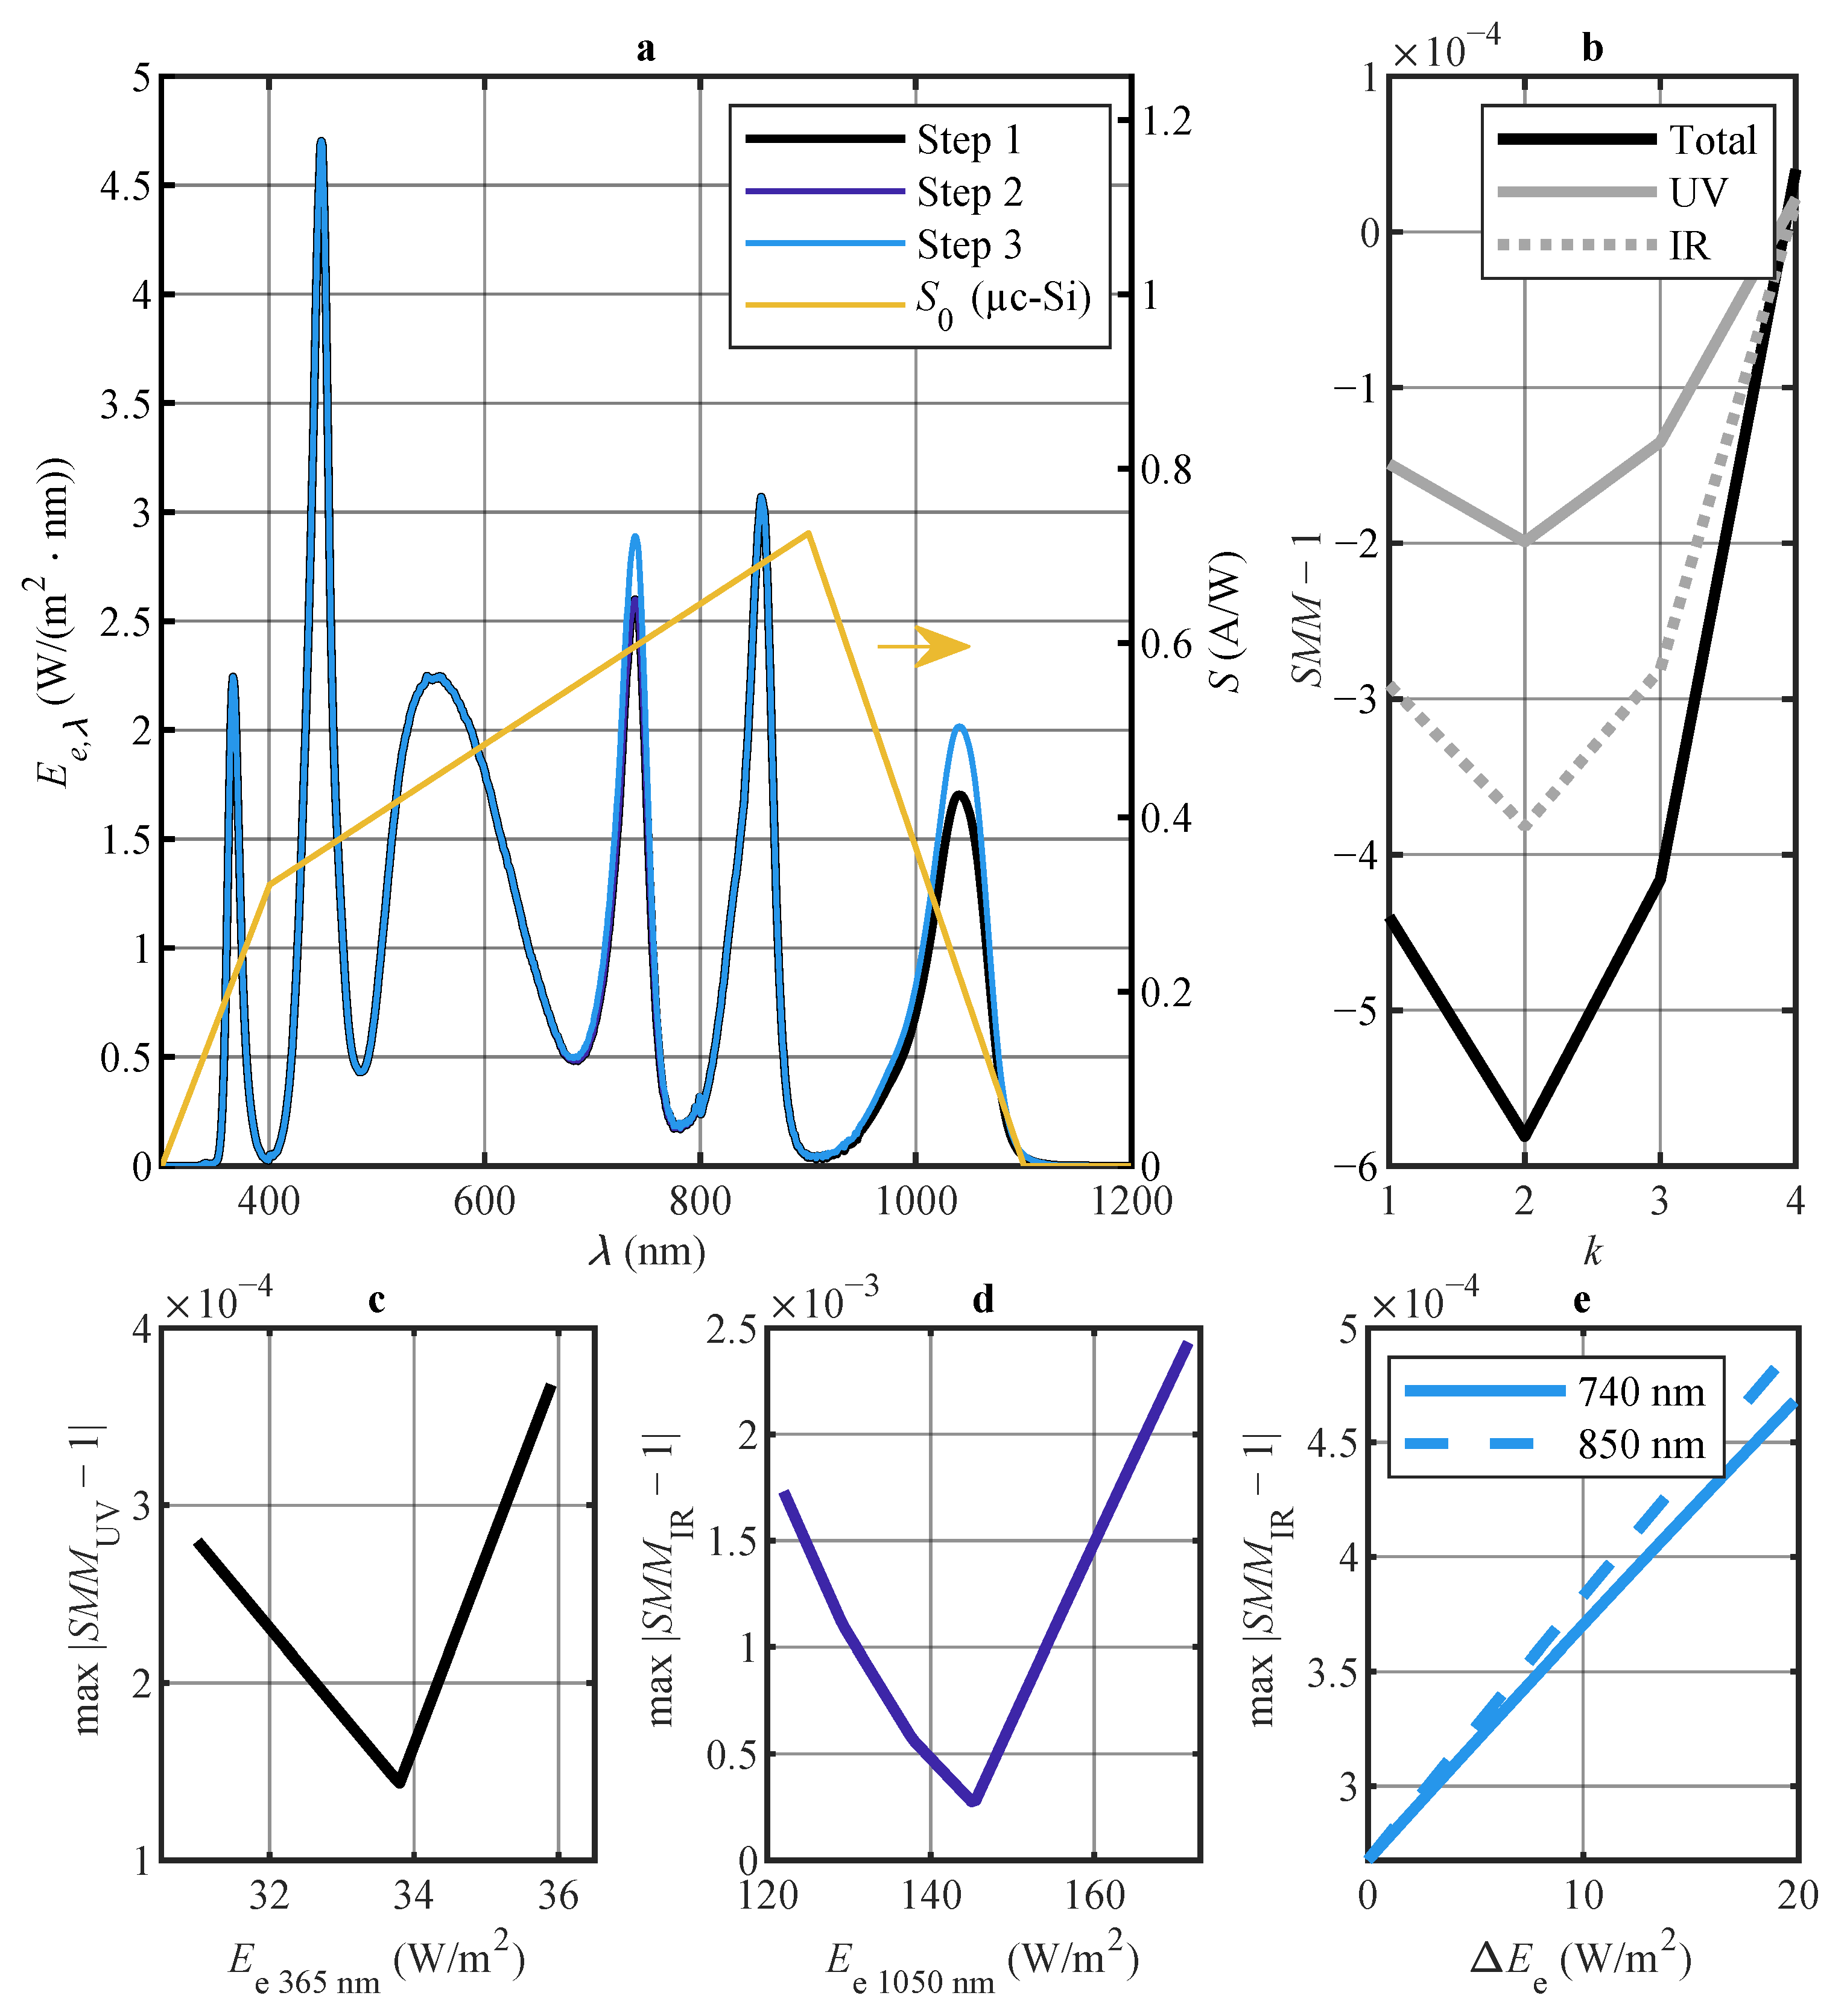
The results of this optimization are presented in
Figure 4.
First, 365 nm LEDs were added to minimize
in the UV part (
Figure 4c). The value of
Ee 365 nm = 33.8 W/m
2 was found to be optimal and fixed for the next steps. Then, the irradiance of 1050 nm LEDs was adjusted to
Ee 1050 nm = 145.2 W/m
2, minimizing
on the IR side of the spectrum (
Figure 4d). This value was fixed for the next step. Lastly, adjustments of both far red 740 nm and 850 nm LEDs were evaluated (
Figure 4e). The infrared part of
was found to be more sensitive to irradiation changes of 850 nm LEDs, so a value of
Ee 850 nm = 119 W/m
2 was fixed, and the irradiance of 740 nm LEDs was set to
Ee 740 nm = 105.8 W/m
2 in order to reach the total irradiance required.
The following steps were taken to optimize the hybrid solar simulator for µc-Si solar cells:
Adjustment of the irradiance from halogen lamps within the A+-class limits to lower SMM on both the UV and IR sides of the spectrum;
Adjustment (lowering) of the irradiance from cool white LED to fit in the A+-class limits in the third interval;
Adjustment (lowering) of the irradiance from 365 nm LEDs to improve the SMM on the UV side;
Matching of the AM1.5G 1 Sun irradiance by lowering the optical power from 740 nm and 850 nm LEDs.
The results of this optimization are presented in
Figure 5.
First, adjustment of halogen lamp irradiance up to the available maximum to fulfill A+-class irradiance requirements in the sixth interval in order to lower
on the the IR side (
Figure 5c) led to an irradiance value of
Ee Halogen = 377 W/m
2, which was then fixed for the next step. Then, the irradiance of cool white LEDs was lowered to
Ee C.White = 339 W/m
2, allowing the A+-class irradiation requirement to be met in the third interval (
Figure 5d). After fixing that value, additional adjustments to the irradiance of 365 nm LEDs were needed to correct
on the UV side (
Figure 5e), thus fixing its value at
Ee 365 nm = 33.3 W/m
2. Finally, the total excess of irradiance was subtracted equally from both red LEDs, leading to
Ee 740 nm = 44.5 W/m
2 and
Ee 850 nm = 43.3 W/m
2 irradiance values.
As demonstrated by the optimization results presented above, different solar cell types require slightly different optimum spectra. When comparing LED-only configurations of simulators, higher optimal irradiance from 365 nm LEDs and lower optimal irradiance from 740 nm LEDs can be noticed in the case of µc-Si solar cells compared to CdTe cells. Similar pattern can also be seen with hybrid solar simulators. However, the required irradiance differences are of the order of tens of
only, as can be seen from
Table A1. Therefore, the same set of light sources can be adaptable to both types of solar cells.
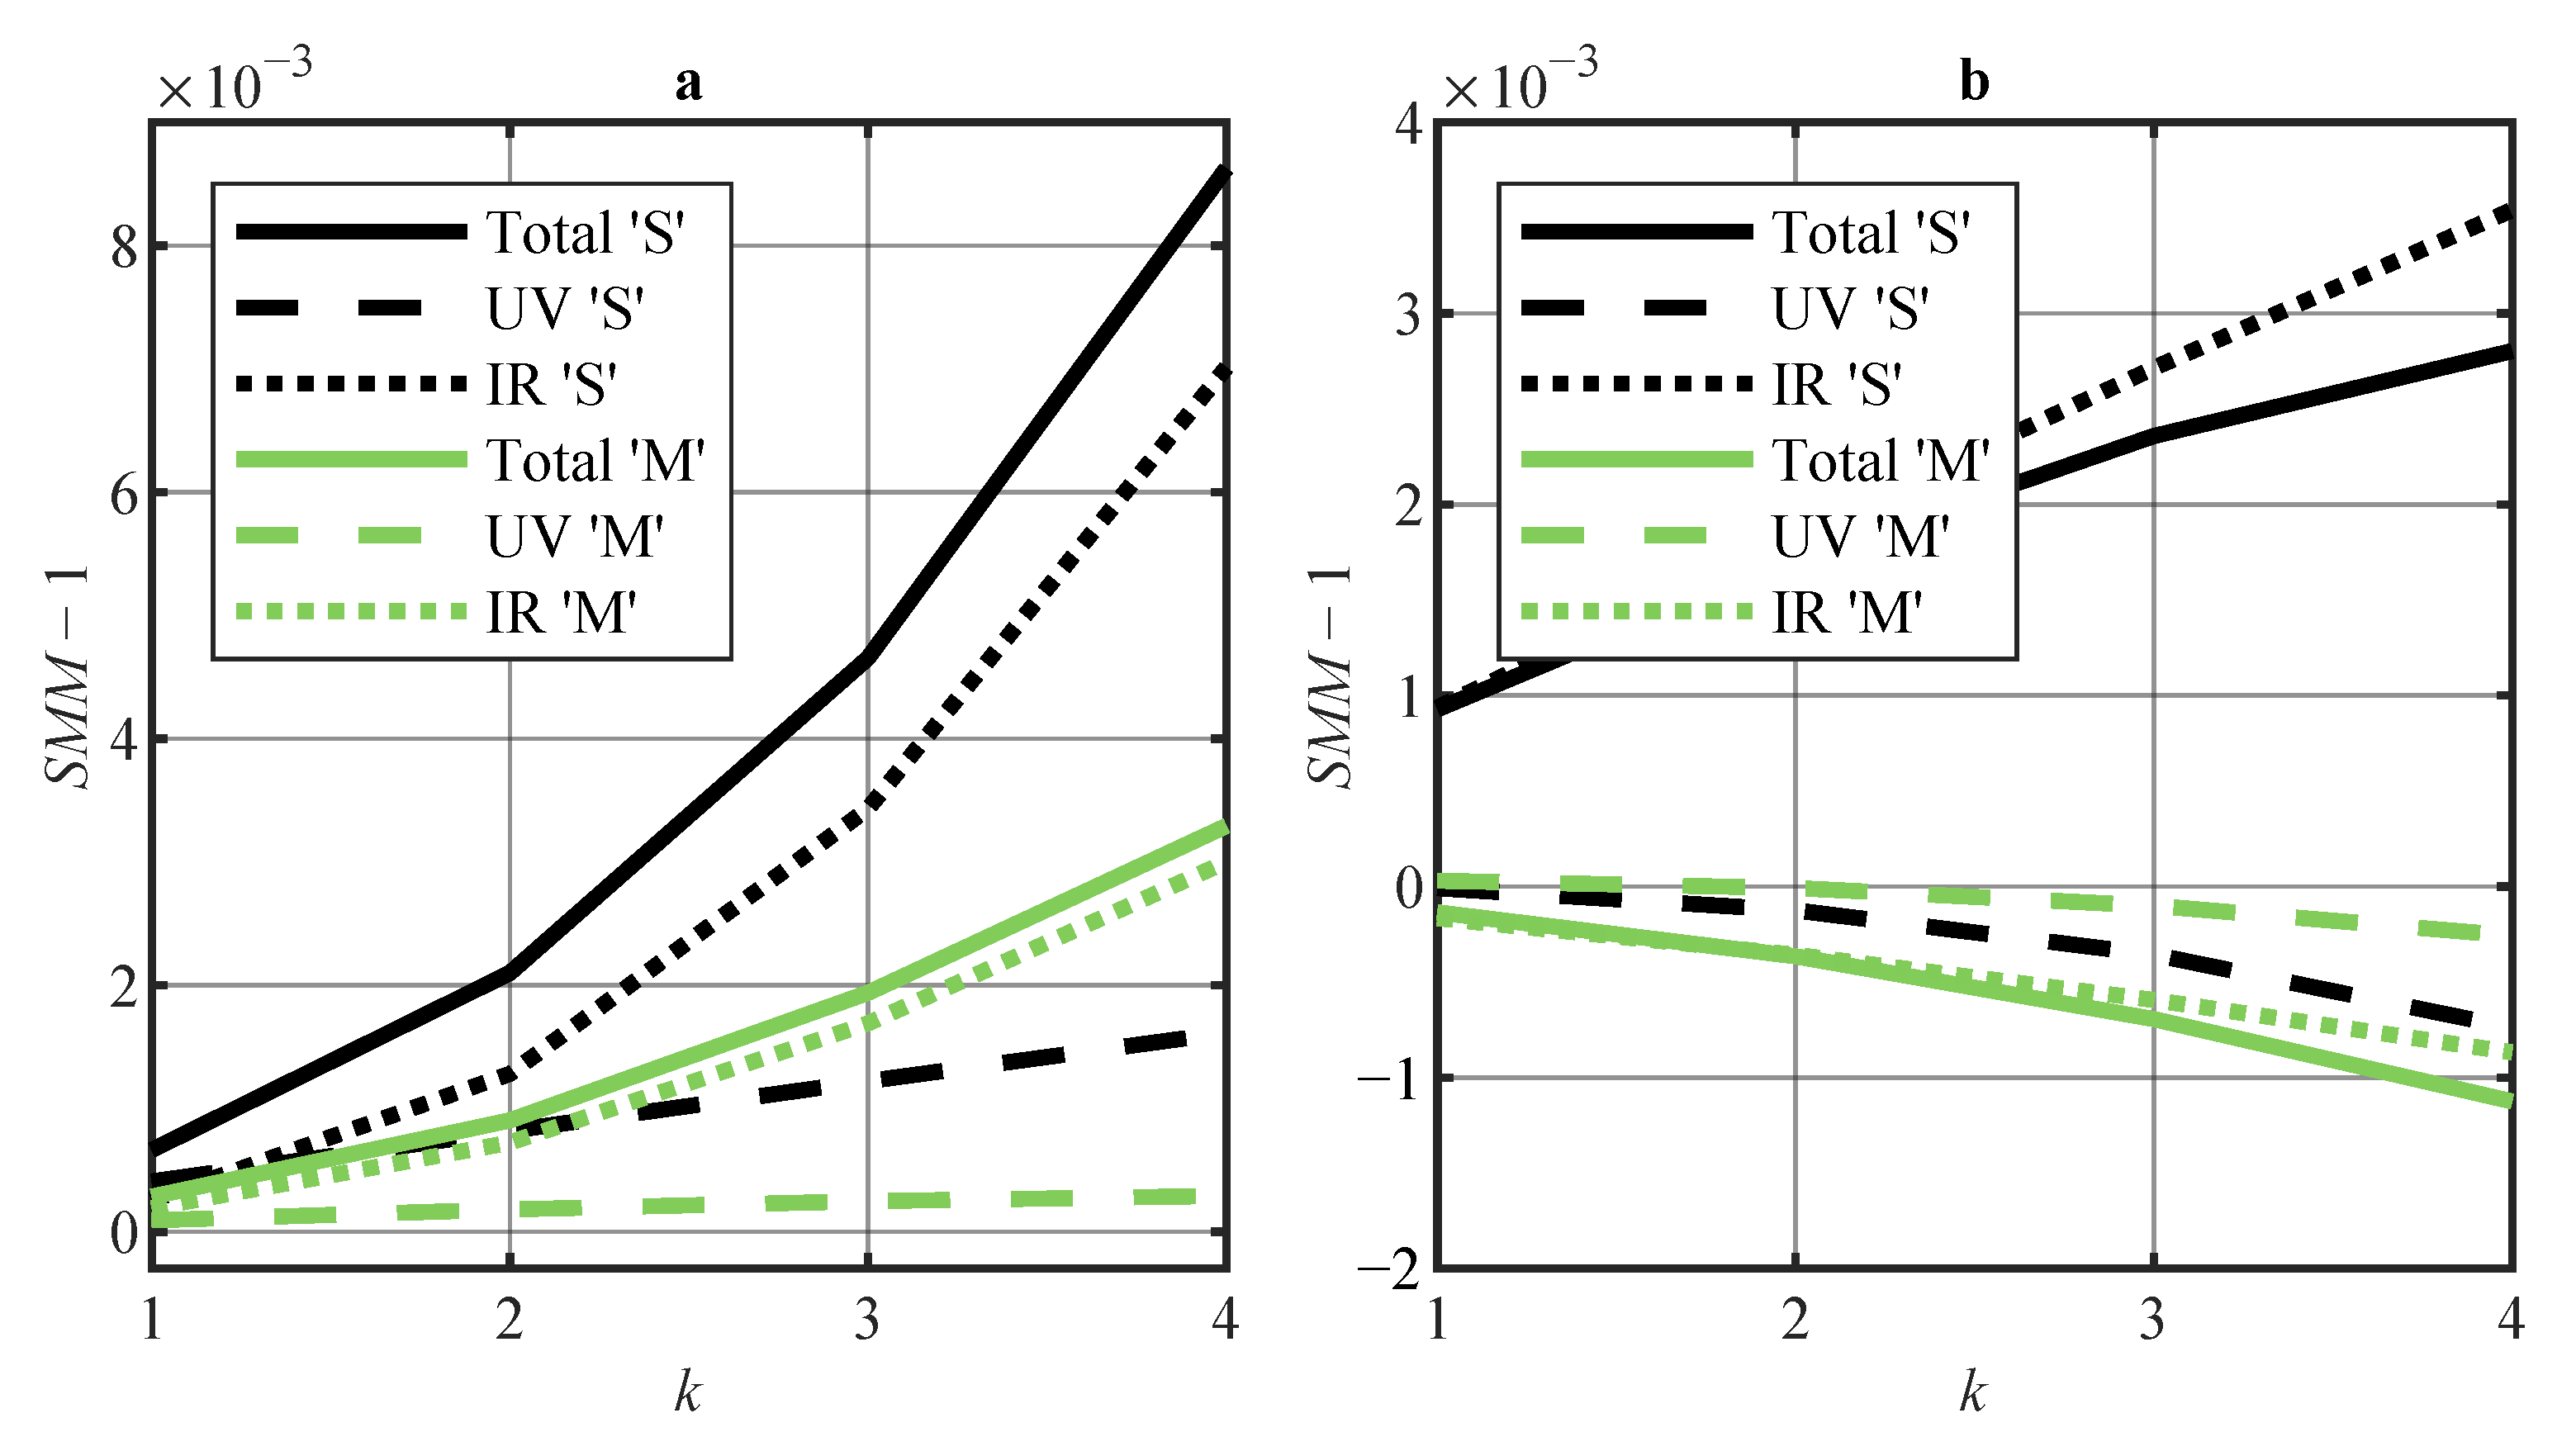
For comparison purposes, spectral mismatch errors were also evaluated for two commercial solar simulators with spectral data tabulated in [
29]. As with LED-based or hybrid solar simulators,
was evaluated in three scenarios: when dispersion is assumed on both sides of the spectrum, when only on the UV side of the spectrum is considered, and when only the IR side is considered. Results of this calculation are presented in
Figure 6. The largest
moduli were obtained at
in all cases. As can be seen when comparing with the data presented in
Figure 2,
Figure 3,
Figure 4 and
Figure 5, substantially higher values were obtained in the case of a single Xe lamp, while higher values persisted, even with a modified lamp spectrum. Therefore, the effects of spectrum mismatch should be less pronounced with the optimized simulators presented in this paper.
It should also be pointed out that equipment-specific measurement uncertainties might also play a substantial role in real life applications. For example, a
reduction of 1050 nm LED power would lead to a slightly worse value of
instead of
as shown in
Figure 4b for µc-Si cells at
. As another example, uncertainties of such order are already expected when calibrating standard lamps that are used to calibrate spectroradiometer systems [
30]. Multiple spectrum measurement options are envisaged in the [
11] standard: monochromators with discrete detectors; spectrometers, based on charge-coupled devices (CCDs), complementary metal oxide semiconductors (CMOSs), or photodiode arrays; multiple detector assemblies with band pass filters; and single detectors with multiple band pass filters. Each of these specific techniques requires separate and complex evaluations of uncertainties for multiple spectral ranges, which are beyond the scope of this paper.
4. Conclusions
A+-class solar simulator spectra are achievable with only four types of LED sources: cool white, 740 nm, 850 nm, and 1050 nm. Redefinition in comparison with the previous edition of the standard spectral intervals plays a crucial role in this case, since the spectrum of cool white LEDs alone is sufficiently well-balanced to provide a compatible spectrum within A+-class specifications in the first three spectral intervals out of the required six.
In the case of hybrid solar simulators with halogen lamp-based emitters included, a fifth type of light source is needed, since the emission spectra of these lamps overlap with the emission spectra of cool white LEDs. Due to this overlap, an additional type of emitter is needed for the first interval, since irradiance from cool white LEDs has to be reduced. However, it should be noted that configurations with halogen lamp-based emitters consistently possess much higher SPC values in comparison with LED-only configurations, as seen in
Table A1.
The addition of UV emitters of 365 nm peak wavelength is beneficial for the reduction of spectral mismatch effects when testing both types of solar cells. This result is applicable to both the LED-only and hybrid simulator configurations, and the relevant irradiance is within the 25–43 range. This factor of parameter management effectively equalizes the number of light sources for both types of simulators. As our analysis and presented data show, careful adjustments of sources emitting near the far red and/or IR edge of the responsivity spectrum can similarly lead to parameter reduction.
At present, there are no sufficiently powerful and efficient IR emitters of longer than 1000 nm wavelength; therefore, the use of halogen lamps for solar simulators can be a suitable compromise. Optimized for both solar cell types, hybrid simulators possess much lower compared to LED-only solar simulators, with the same number of distinct source types. A high is also obtained in both cases, further confirming the advantages of hybrid simulator configurations. However, it should be noted that optimization challenges might be present at least in the case of CdTe solar cells; as our results demonstrate, minimization of deviation might lead to A-class classification of the spectrum instead of the nominally better A+-class.
The proposed designs of the spectra of solar simulators are expected to yield lower spectral mismatch errors in comparison with conventional Xe lamp-based simulators, as our results demonstrate. Three partially related future research directions can be envisaged on the basis of the findings presented in this paper. One is simultaneous optimization of A+-class LED-based and hybrid solar simulators for multiple types of solar cells. The second is optimization considering more parameters of the solar cells, such as open-circuit voltage and maximum power of the solar cells. The third direction is a comprehensive evaluation of the expected uncertainties resulting from variations in the emission spectra of LEDs.


