Article

Utilizing Sewage Sludge Slag, a By-Product of the Circulating Fluidized Bed Combustion Process, to Efficiently Remove Copper from Aquatic Environment

1
Department of Industrial Products and Packaging Quality, Institute of Quality Science, Poznań University of Economics and Business, Niepodległości 10, 61-875 Poznań, Poland
2
Department of Nuclear System Safety Engineering, Graduate School of Engineering, Nagaoka University of Technology, 1603-1, Nagaoka 940-2188, Japan
*
Author to whom correspondence should be addressed.
Energies 2023, 16(15), 5688; https://doi.org/10.3390/en16155688
Submission received: 23 June 2023 / Revised: 21 July 2023 / Accepted: 27 July 2023 / Published: 29 July 2023

Abstract

:
Currently, one of the greatest threats to the aquatic environment is industrial wastewater containing heavy metals and other toxic substances. Hence, it seems necessary to search for ecological and cheap technologies for removing metals from wastewater. In this research, slag was used as waste obtained in the circulating fluidized bed combustion technology (CFBC), which is considered to be a modern, clean, and very effective method of incineration of municipal sewage sludge. The physicochemical properties of the waste material were characterized using selected analytical techniques. Next, the processes of adsorption of Cu(II) ions on slag in aqueous solutions were investigated. The results showed a high metal removal efficiency of 98.8% at pH 1.8 and slag dosage 5 g/L. Numerous studies have demonstrated that high process efficiency at a level of at least 90% is attainable. Based on the Langmuir equation, the maximum adsorption capacity was calculated to be 70.3 mg/g. Kinetic analysis revealed that the process fits better into the pseudo-second-order reaction model and the Freundlich isotherm. The intraparticle diffusion model was considered as a rate-controlling step for Cu(II) adsorption. In summary, the slag waste produced in the CFBC technology seems to be a highly effective adsorbent for potential use in adsorption processes to remove heavy metals from the aquatic environment. This solution is in line with the current European ‘zero waste’ strategy and the assumptions of a sustainable development economy.

1. Introduction

Today’s civilization faces new challenges related to the modernization of the currently functioning industry in pro-ecological directions. Human activity has contributed to the degradation of the natural environment. Hence, the goals include introducing a sustainable economy model, stopping the spread of pollution, searching for clean technologies, and at the same time effectively cleaning industrial wastewater and the aquatic environment from toxic substances, such as heavy metals. Industrial wastewater most often ends up in water bodies, including rivers, lakes, seas, and oceans, causing environmental pollution [1,2,3,4,5]. Sources include many industries, including petrochemicals, refineries, chemicals, food, pulp and paper, and others [6]. The most toxic metals are cadmium, copper, lead, chromium, mercury, and nickel [7]. Literature reports show that heavy metals, through bioaccumulation in human tissues and organs, cause many health problems, including diseases of the respiratory, circulatory, and nervous systems, tumors and brain damage, and tumors of other organs [8].
A heavy metal with a wide industrial application and one of the most common pollutants in the aquatic environment is copper (Cu). This element is obtained and processed in many industries, including mining, tanneries, pyrometallurgical processes, surface treatment of materials, etc. The ionic form of copper, which is absorbed by organisms and accumulates in tissues, is soluble in aqueous solutions as the divalent metal Cu(II), and it causes many health problems at large quantities. According to current recommendations, the maximum contaminant level (MCL) of copper in drinking water should not exceed 1.3 mg/L [9].
According to the circular economy strategy, it is necessary to eliminate negative impacts on the environment by limiting waste storage, reuse or reduction in mass, and disposal in combustion processes. The neutralization of sewage sludge (SS) by incineration is a promising method due to limitations in the use of SS containing excessive concentrations of heavy metals. The method using heat with energy recovery is perceived as one of the most effective methods of neutralizing SS due to its energy and environmental benefits, including waste mass reduction, energy use of SS treatment, low susceptibility to changes in waste composition, system stability, minimization of odors, and the possibility of using by-products of fly ash and slag as filter materials or as an additive to building materials, including concrete, asphalt, bricks, concrete blocks, and hollow blocks [10,11]. The limitations include the formation of by-products, the quantity and quality of which depend on the chemical composition of SS, combustion conditions, and flue gas treatment technology, as well as high operating costs and the costs of building incineration plants [12,13]. One of the most technologically advanced solutions is circulating fluidized bed combustion (CFBC) technology [14]. It has many advantages, including compatibility with different types of fuels (gas, oil, high- and low-grade coal, biomass, sewage sludge, plastic waste, and used tires), low emissions, high combustion efficiency, energy efficiency, the possibility of simultaneous combustion of dehydrated, dried, and digested sludge, and ease of maintenance of the installation [15].
Pursuant to Directive 2008/98/EC of the European Parliament, the overriding goal is to protect human health and the environment by preventing the negative effects of waste generation and management, reducing the overall impact of resource use, and improving the efficiency of their use. Thus, when a waste material ceases to be “waste”, it obtains “new product” status for various purposes [16,17]. In keeping with this concept, the objective of this study was to investigate the potential for Cu(II) ions to adsorb on slag (CFBC-S) waste as a novel by-product of SS incineration using CFBC technology. The effects of adsorbent dosage, contact time, initial pH, and initial concentration on the adsorption capacity and efficiency were examined, along with the effects of the by-product’s physicochemical characteristics. All experiments were carried out at room temperature. Furthermore, adsorption kinetics and isotherms were studied.

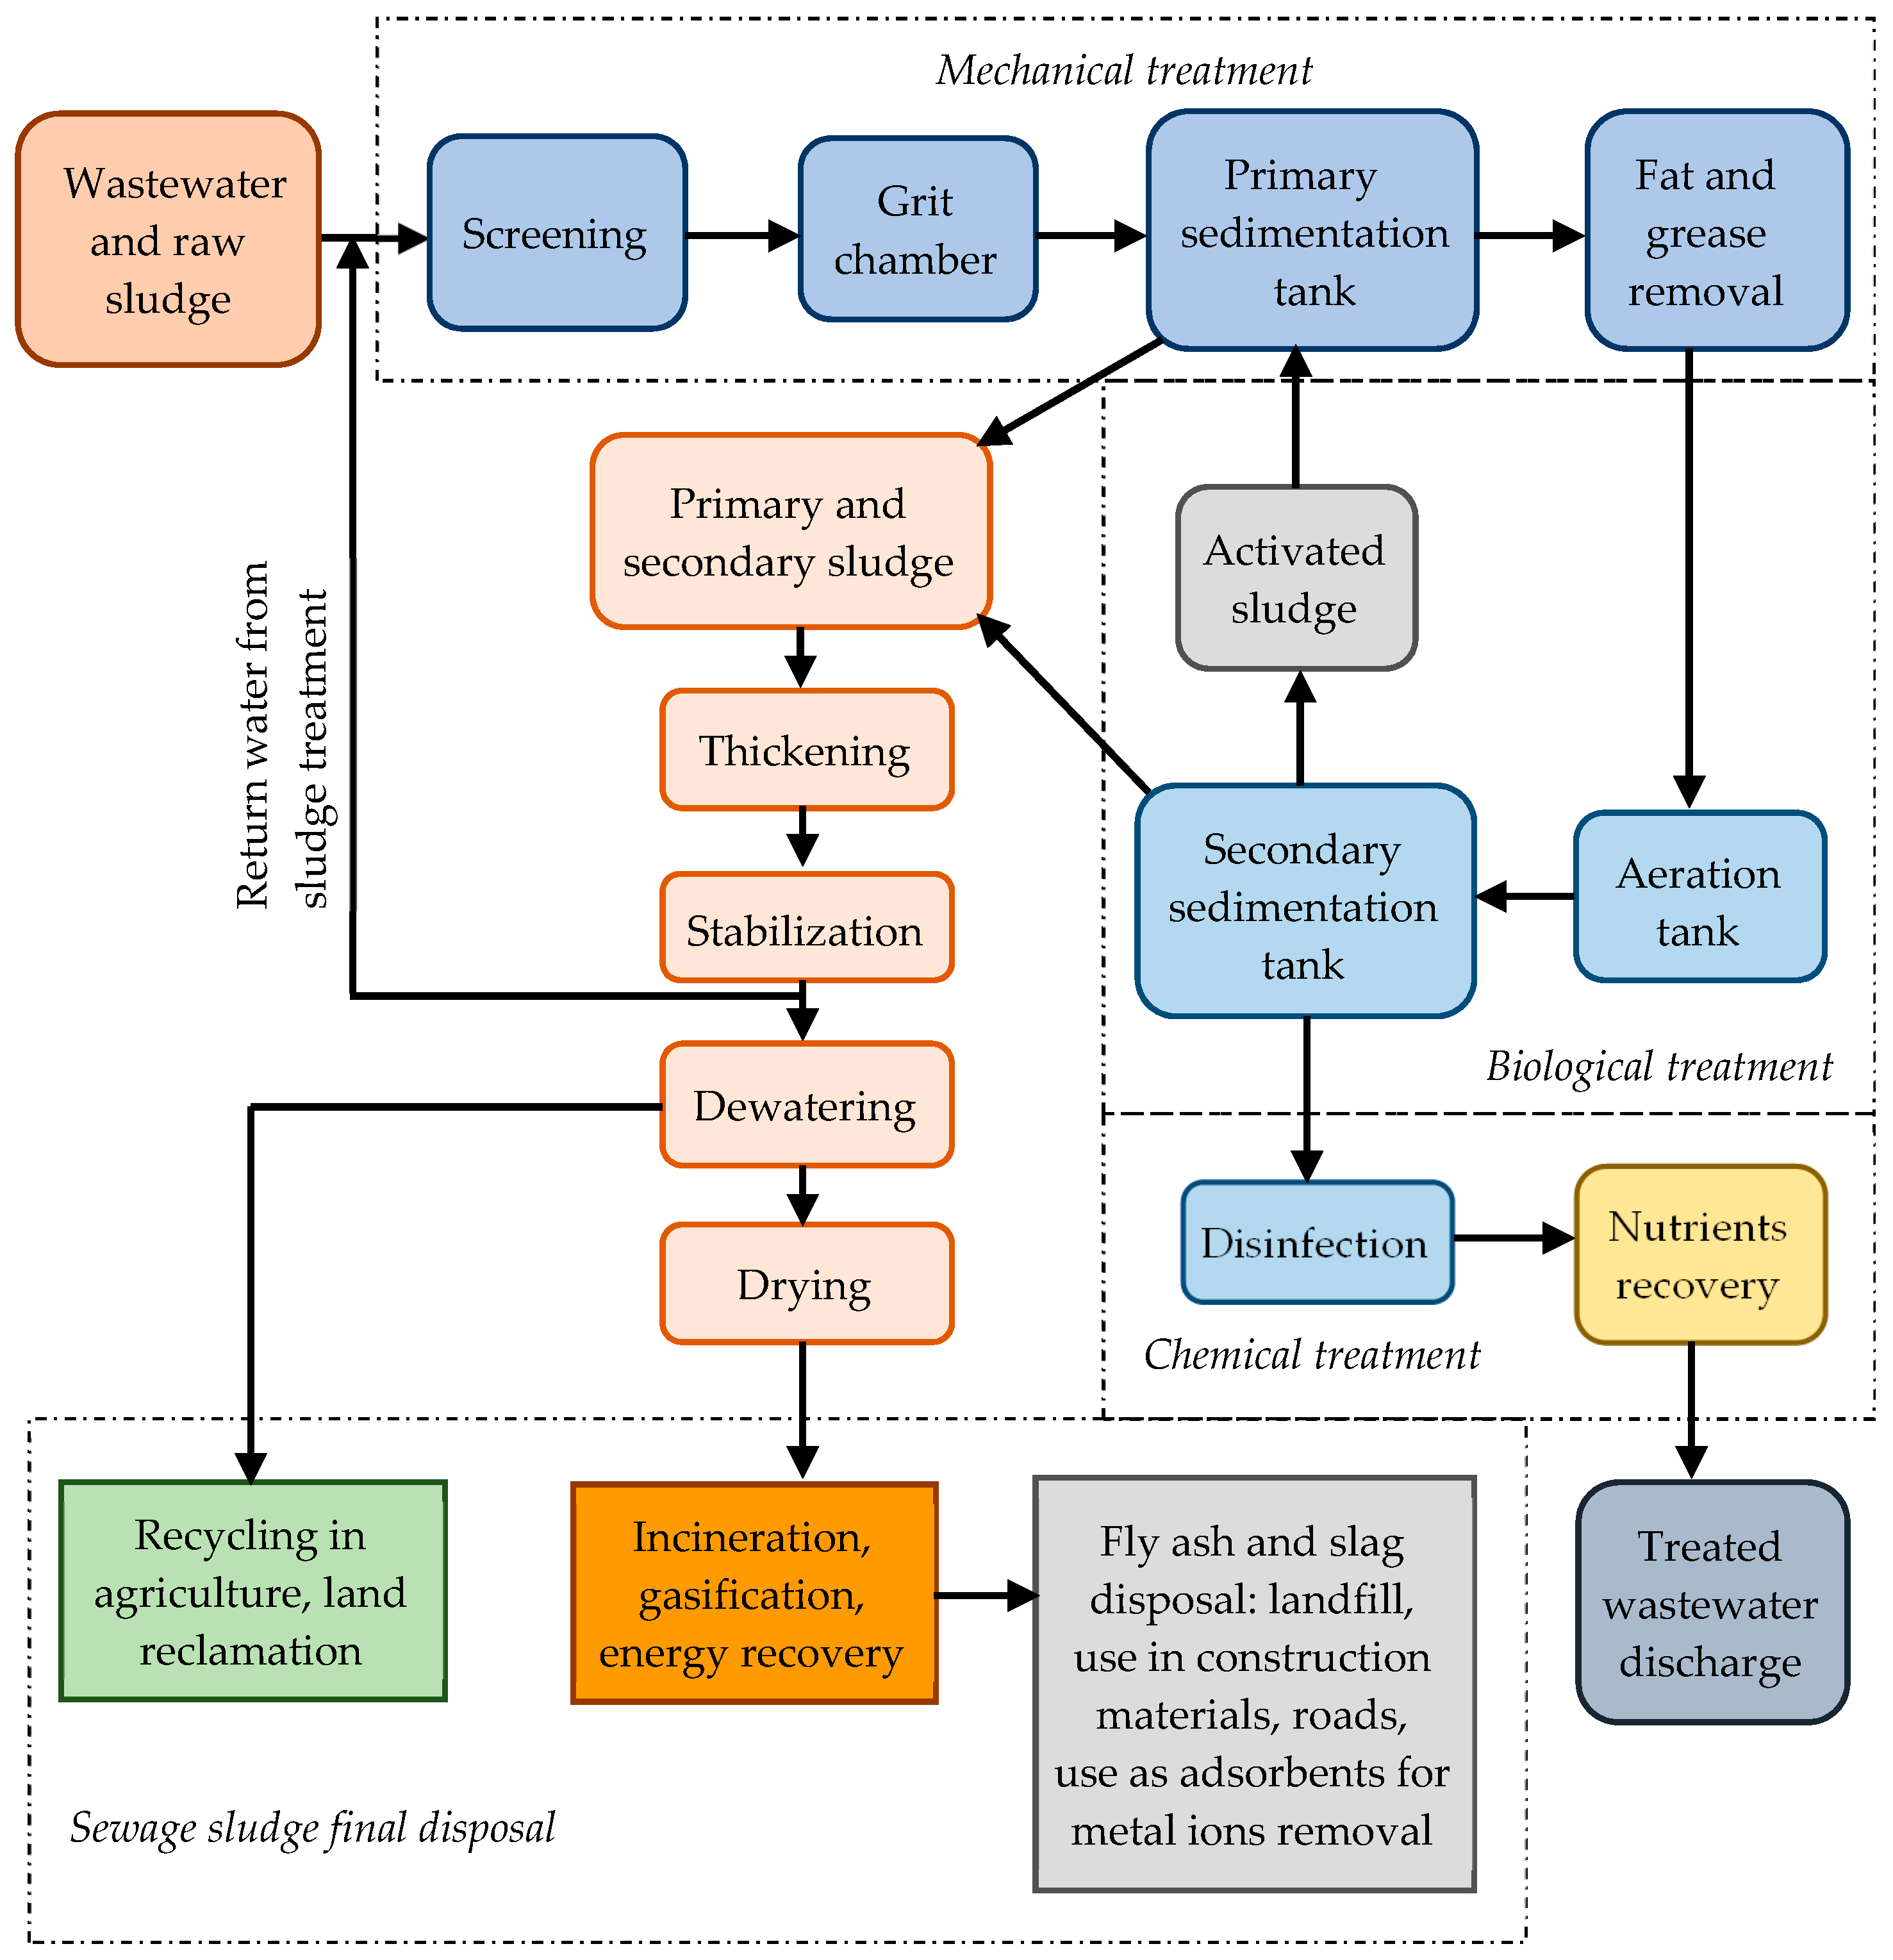
2. Sewage Sludge Treatment

Utilization of sewage sludge (SS) is a multi-stage and expensive process, despite the fact that it constitutes a small volume of treated sewage (about 1–2%). According to estimates, between 20% and 60% of the overall operating costs of sewage treatment plants are attributable to the disposal and treatment of SS [18,19]. This is a problem associated not only with high costs but also with a burdensome impact on the environment. As a result, inside the European Union, new techniques for wastewater treatment (mechanical, biological, and chemical), as well as SS, were introduced (Figure 1). The directions for SS disposal have been defined within the waste management hierarchy presented in Directive 2008/98/EC of the European Parliament and of the Council on Waste and Repealing Certain Directives [16]. This document reveals that the most effective way to treat wastewater and SS depends on a variety of variables, including the sludge’s physical and chemical characteristics, technological conditions, the potential use of by-products, and operational and investment costs. Instead of concentrating solely on limiting waste disposal, recycling, or energy recovery, optimal solutions should be found. The effectiveness of recovering the energy content and raw materials included in SS should be taken into account when evaluating disposal solutions [20]. There is a need to search for and develop new advanced technologies for SS treatment, as a result of which it will be possible to recover valuable components and energy.
There are many ways to treat sewage sludge, depending on its type and composition. The typical chemical composition and properties are presented in Table 1. The most commonly used techniques are stabilization, dewatering, thickening, drying, digestion, composting, conditioning, aerobic methods, and incineration. Treatment of sludge is necessary to reduce moisture content (volume reduction), remove organic matter, eradicate microbes, and remove hazardous materials. The completed treated sludge can be disposed of in the environment after the subsequent processes. The waste, which contains valuable components, can be used as agricultural fertilizer. Additionally, materials from industrial and commercial treatment operations that end up in the sewage system can be used in agriculture. Some types of sludge need to be disposed of in landfills or burned, depending on their composition [21,22]. After ranking various SS management techniques, Bertanza et al. [23] came to the conclusion that digestion with application to agricultural soils and incineration with energy recovery were the best options for removing SS from wastewater plants with capacities greater than 500,000 population equivalents. Anaerobic digestion combined with biogas production was studied, and it was found that the energy needs of wastewater treatment plants might be decreased by up to 35% [24]. According to the literature, sewage sludge may be used as a raw material in a biorefinery to produce a variety of new products using processes such as gasification, pyrolysis, anaerobic digestion, and incineration [25].
Thermal treatment is the most advantageous and effective method for utilizing municipal garbage. It is also recommended by UE legislation. Typically, 80% hydrated SS has a calorific value of about 0.5 MJ/kg. By using mechanical techniques, it is possible to reduce the hydration of sediments by up to 60%, yielding an average calorific value of 3–6 MJ/kg. The drying techniques used as a first heat treatment enable further dehydration and an increase in calorific value. Drying sewage sludge paves the way for energy recovery. Granulate with dimensions of 1 to 5 mm or dust with a dry matter concentration of more than 80% are the end products of the drying process. This product’s increased calorific value of between 12 and 18 MJ/kg and bulk density of roughly 700 kg/m3 make transporting it simpler. Additionally, it does not contain any pathogenic organisms, is not biodegradable, and does not endanger the environment or human health [27]. Table 2 compares some SS properties with those of other energy sources.
Sewage sludge offers a variety of opportunities for the use of energy and material content. However, a number of factors and limitations, such as location, rules and regulations, public opinion, heavy metals and pathogens, sludge quantity, features, and composition, as well as environmental considerations, affect the precise choice of SS treatment process. Therefore, thorough techno-economic studies are required to reveal the benefits and effects of the various SS treatment systems.
Table 3 presents statistical and estimated data on the production and disposal of sewage sludge from municipal wastewater in European countries in 2020. The leading producers are Germany, Spain, France, and Poland. These countries also make the most use of this waste for agricultural purposes. Noteworthy is the growing use of sewage sludge thermal treatment technology, and the leading European countries include Germany, the Netherlands, France, Austria, Poland, Turkey, and Spain [28].
Figure 2 shows the value of the market for sludge treatment equipment in 2011–2022. Over a period of 11 years, the value has increased from 3 to 4.5 billion dollars, and the trend is still growing [29,30].
Figure 3 shows the volume of energy production from sewage sludge gas in the European Union in the years 2013–2021. In 2021, production amounted to 1168 kilotons of oil equivalent. Over the period, the data showed an upward trend despite some fluctuations, peaking at 1509 kilotons of oil equivalent in 2018 [31].

3. Wastewater Treatment and Sewage Sludge Incineration

At present, one of the most significant issues facing the economies of numerous nations is proper waste management. Legislative restrictions on trash storage, suggestions for reuse or weight reduction, and disposal in incineration processes are all made in light of the harmful effects waste has on the environment.
Given the constraints of sewage sludge utilization due to increased heavy metal content, SS incineration becomes a substitute approach. The chemical composition of the waste and the proportion of combustible compounds have an impact on how it is used. Due to environmental protection and energy savings, the use of heat with energy recovery is now the most efficient and appropriate technique for SS disposal [32]. The weight of the waste is much reduced, which is the main advantage. Additional benefits include the low energy needs of sewage sludge, the reduction in odors, the stability of the system, and the potential use of fly ash as a filter material or as an additive to concrete, bricks, asphalt, and hollow blocks. The generation of by-products, whose quantity and quality depend on chemical composition, combustion circumstances, and exhaust gas treatment technologies, is the key constraint. The incineration plant’s high construction and running costs are further restraints [33]. Circulating fluidized bed combustion (CFBC) technology looks to be the most cutting-edge design approach. The main benefits include the ability to burn a variety of fuels simultaneously, including dehydrated, dried, and fermented sludge, as well as gas, oil, high-grade and low-grade coal, biomass, waste plastics, and used tires. However, each type of fuel requires appropriate changes in the design of the installation. Other benefits include high combustion efficiency, low pollution, and ease of installation and maintenance [34].
Municipal wastewater, from which sewage sludge and then slag were formed and used in this study, comes from a sewage treatment plant located in one of the Polish cities, Bydgoszcz. Selected pollutant concentrations in the wastewater are presented in Table 4. The sewage flows by gravity from the city and the surrounding neighboring communes. In the first stage, wastewater is cleaned of larger impurities (over 6 mm in diameter) using many larger and smaller gratings. Later, the wastewater flows through a slotted sand trap to retain larger mineral impurities such as sand and gravel. The wastewater is then directed to the central pumping station, through which it is delivered to the kinetic energy damping chamber and then to three parallel sand traps with circular motion in order to stop the sand suspension. Then, they flow to the distribution chamber, where they are separated into two parallel radial primary settling tanks for mechanical wastewater treatment. As a result of the sedimentation process, about 80% of the easily falling suspension is retained. After mechanical treatment, wastewater is directed through distribution chambers to four lines of biological reactors used for the simultaneous removal of carbon, nitrogen, and phosphorus compounds in biological treatment processes with the use of microorganisms. From the biological reactors, wastewater with activated sludge flows to three parallel working radial secondary settling tanks, where the activated sludge suspension is separated from the treated wastewater. Biologically treated sewage is discharged into the local river. The sludge accumulated at the bottom of the primary settling tanks is mechanically scraped into the sludge funnel, from where it is fed through the primary sludge pumping station and the macerator to the fermenter. The primary sludge is subjected to the process of initial acid fermentation in order to produce short-chain fatty acids necessary for the biological processes of removing nitrogen and phosphorus compounds. The supernatants containing volatile fatty acids are discharged into the anoxic zone of the biological reactors. Activated sludge from the bottom of secondary settling tanks is fed to the return sludge pumping station and returned to biological reactors. Excess sludge from the return sludge pumping station is discharged to compactors and then stabilized together with primary sludge in separate fermentation chambers. The digested sludge is delivered to sedimentation centrifuges for dewatering. The mechanical dewatering process is supported by the dosing of the polyelectrolyte. The dehydrated sludge is fed to the Thermal Sludge Treatment Plant for neutralization through the combustion process in a circulating fluidized bed boiler to produce by-products of fly ash and slag.
Figure 4 graphically depicts the incineration of sewage sludge and generation of fly ash and slag in the circulating fluidized bed combustion (CFBC) technology [37]. Using a piston pump, the sewage sludge mixture is moved for drying in this procedure to evaporate water. Condensed water vapor from the dryer is taken to the sewage treatment facility. Using a system of feeders, the dried sludge, which contains roughly 33% of its dry weight, is fed into the fluidized bed kiln. Hot air from nozzles elevates the layer of sand at the bottom of the furnace during combustion to form a fluidized bed. Starting the furnace and heating the fluidized bed to a temperature of 650 °C in the center of the furnace enables sewage sludge to be fed into the furnace. The top of the furnace is where the process exhaust gases are directed, where they remain for at least 2 s at a temperature of 850 °C. Waste gases and slag are created when wastewater is burned in a fluidized bed furnace. In this procedure, every organic material present in the silt is burned. Then, the flue gas is cleaned and cooled, and the heat from those processes heats the air required to fluidize the bed. The cooled gases are either treated dryly or moistly. They have previously undergone pre-treatment, and then limestone is introduced to a fluidized bed where it reacts with SOx, NOx, fluorine, and chlorine to produce calcium compounds. Acidic components of the off-gas are eliminated in a semi-dry reactor powered by lime and compressed air. The waste gases are moved to a dry reactor, where lime and activated carbon bind heavy metals, dioxins, and furans. In a bag filter that also holds fly ashes, contaminants are finally removed from exhaust fumes. They are placed on the outside of the bags, tossed into the conical section of the tank, and then transported to the silo from there. The cleansed flue gases are sent to the chimney and the atmosphere in the last step.

4. Materials and Methods

Slag (CFBC-S) waste was obtained as a result of sewage sludge incineration using the circulating fluidized bed combustion technology (CFBC) in one of the sewage treatment plants in Poland. The CFBC-S samples were taken from a fluidized bed reservoir and dried at 105 °C to a constant weight. All chemicals were analytically pure, and distilled water was used in the research.
CFBC-S samples were sieved, and those with a diameter less than 0.212 mm were used in experiments. The physico-chemical properties of the materials as well as the adsorption procedure were analyzed using several methods, descriptions of which were described and attached as supplementary material (SM Methods).

4.1. Batch Adsorption Experiments

In batch adsorption experiments, the effectiveness of the Cu(II) ions removal procedure on slag CFBC-S was determined. CuCl2 (1 g/L standard solution for AAS, Sigma-Aldrich (Schnelldorf, Germany)) was applied. A 50 mL conical flask was filled with the adsorbent (0.25–25 g/L) and the metal ion solution (20 mL), and it was agitated at 200 rpm for an hour until equilibrium was established. With 0.1 M HCl and NaOH, initial pH of the stock solutions was adjusted. After that, adsorption solutions were centrifuged at 4000 rpm for 15 min to separate the phases. Atomic absorption spectrophotometry (F-AAS, wavelength = 324.8 nm for copper, SpectrAA 800 (Varian, Palo Alto, CA, USA)) was used to measure the concentration of metal ions. At room temperature (21 ± 1 °C) and normal pressure, measurements were made in triplicate. The results are shown as means. Equations (1) and (2) were used to calculate the adsorption capacity qe [mg/g] and the adsorption efficiency R [%]:
q e = C 0 C e × V m
R = C 0 C e C 0 × 100 %
where: C0 and Ce are initial and equilibrium Cu(II) ion concentrations [mg/L], respectively; V—volume of solution [L] and m—mass of slag [g].
The following conditions were applied in the experimental procedure:
(A)
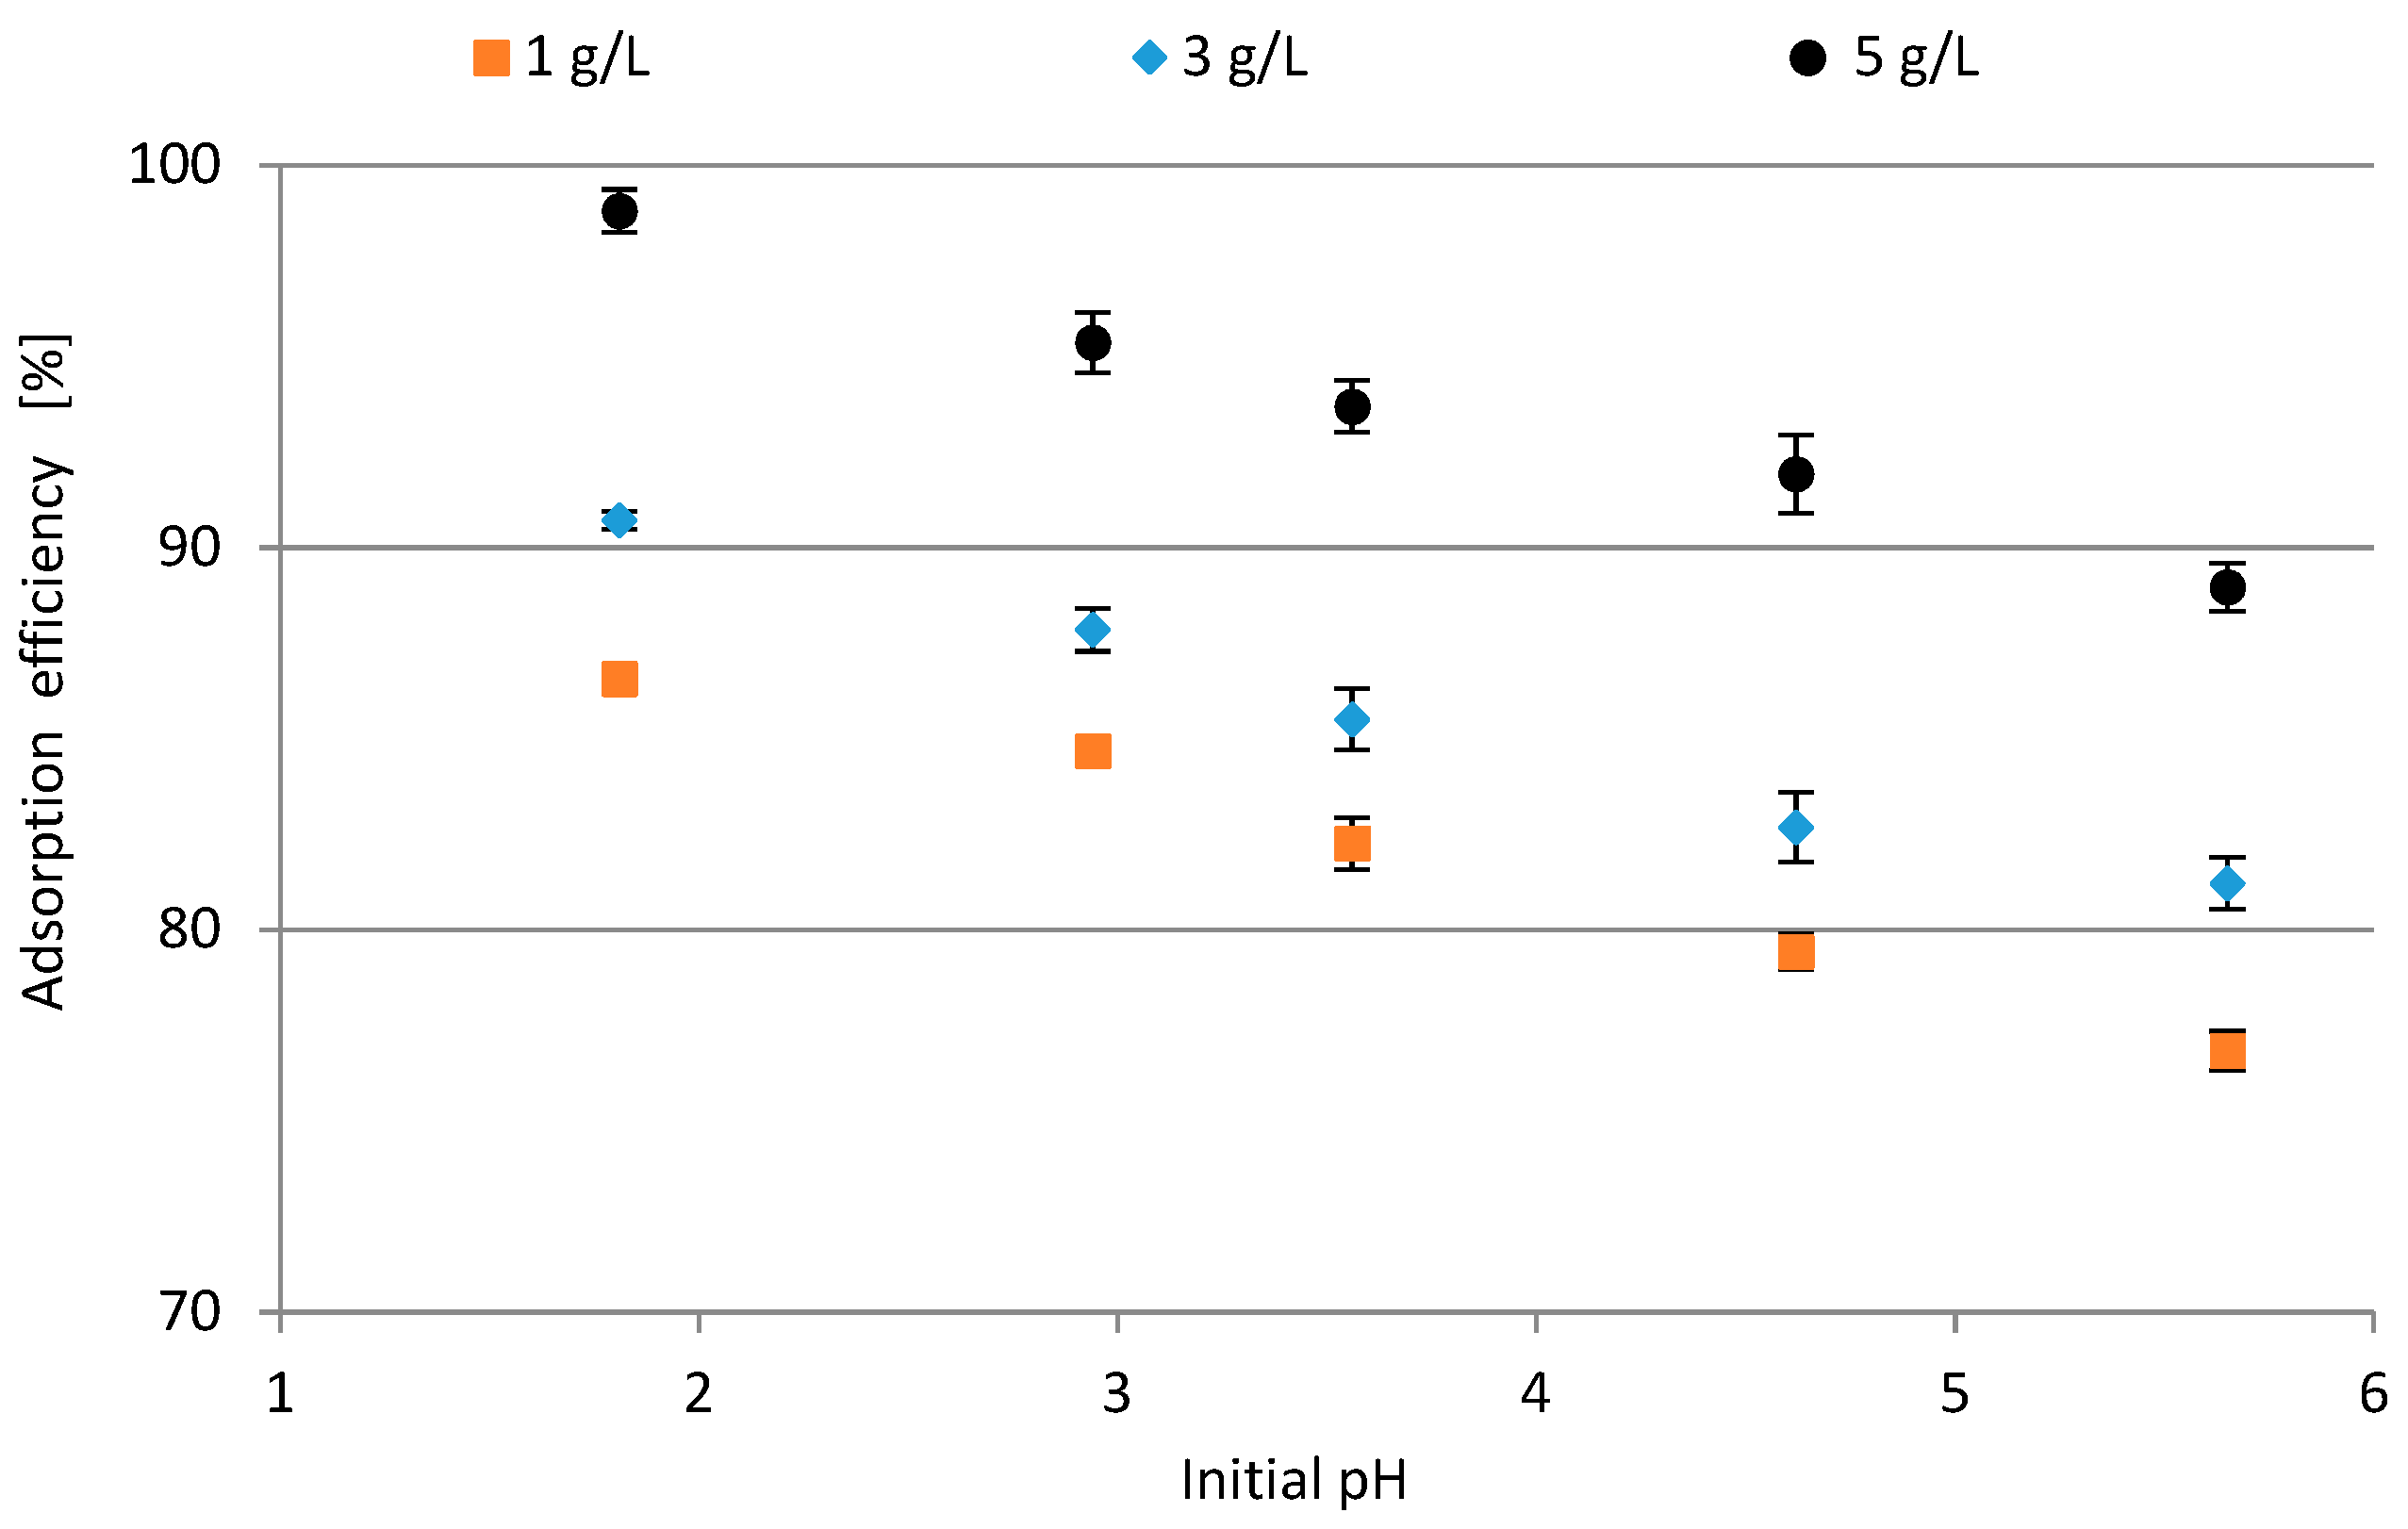
the effect of initial pH: initial pH range of 1.8–5.6, initial concentration of Cu(II) ions 100 mg/L, adsorbent dosage 1–5 g/L, contact time 60 min, T = 21 °C, agitation speed 200 rpm,
(B)
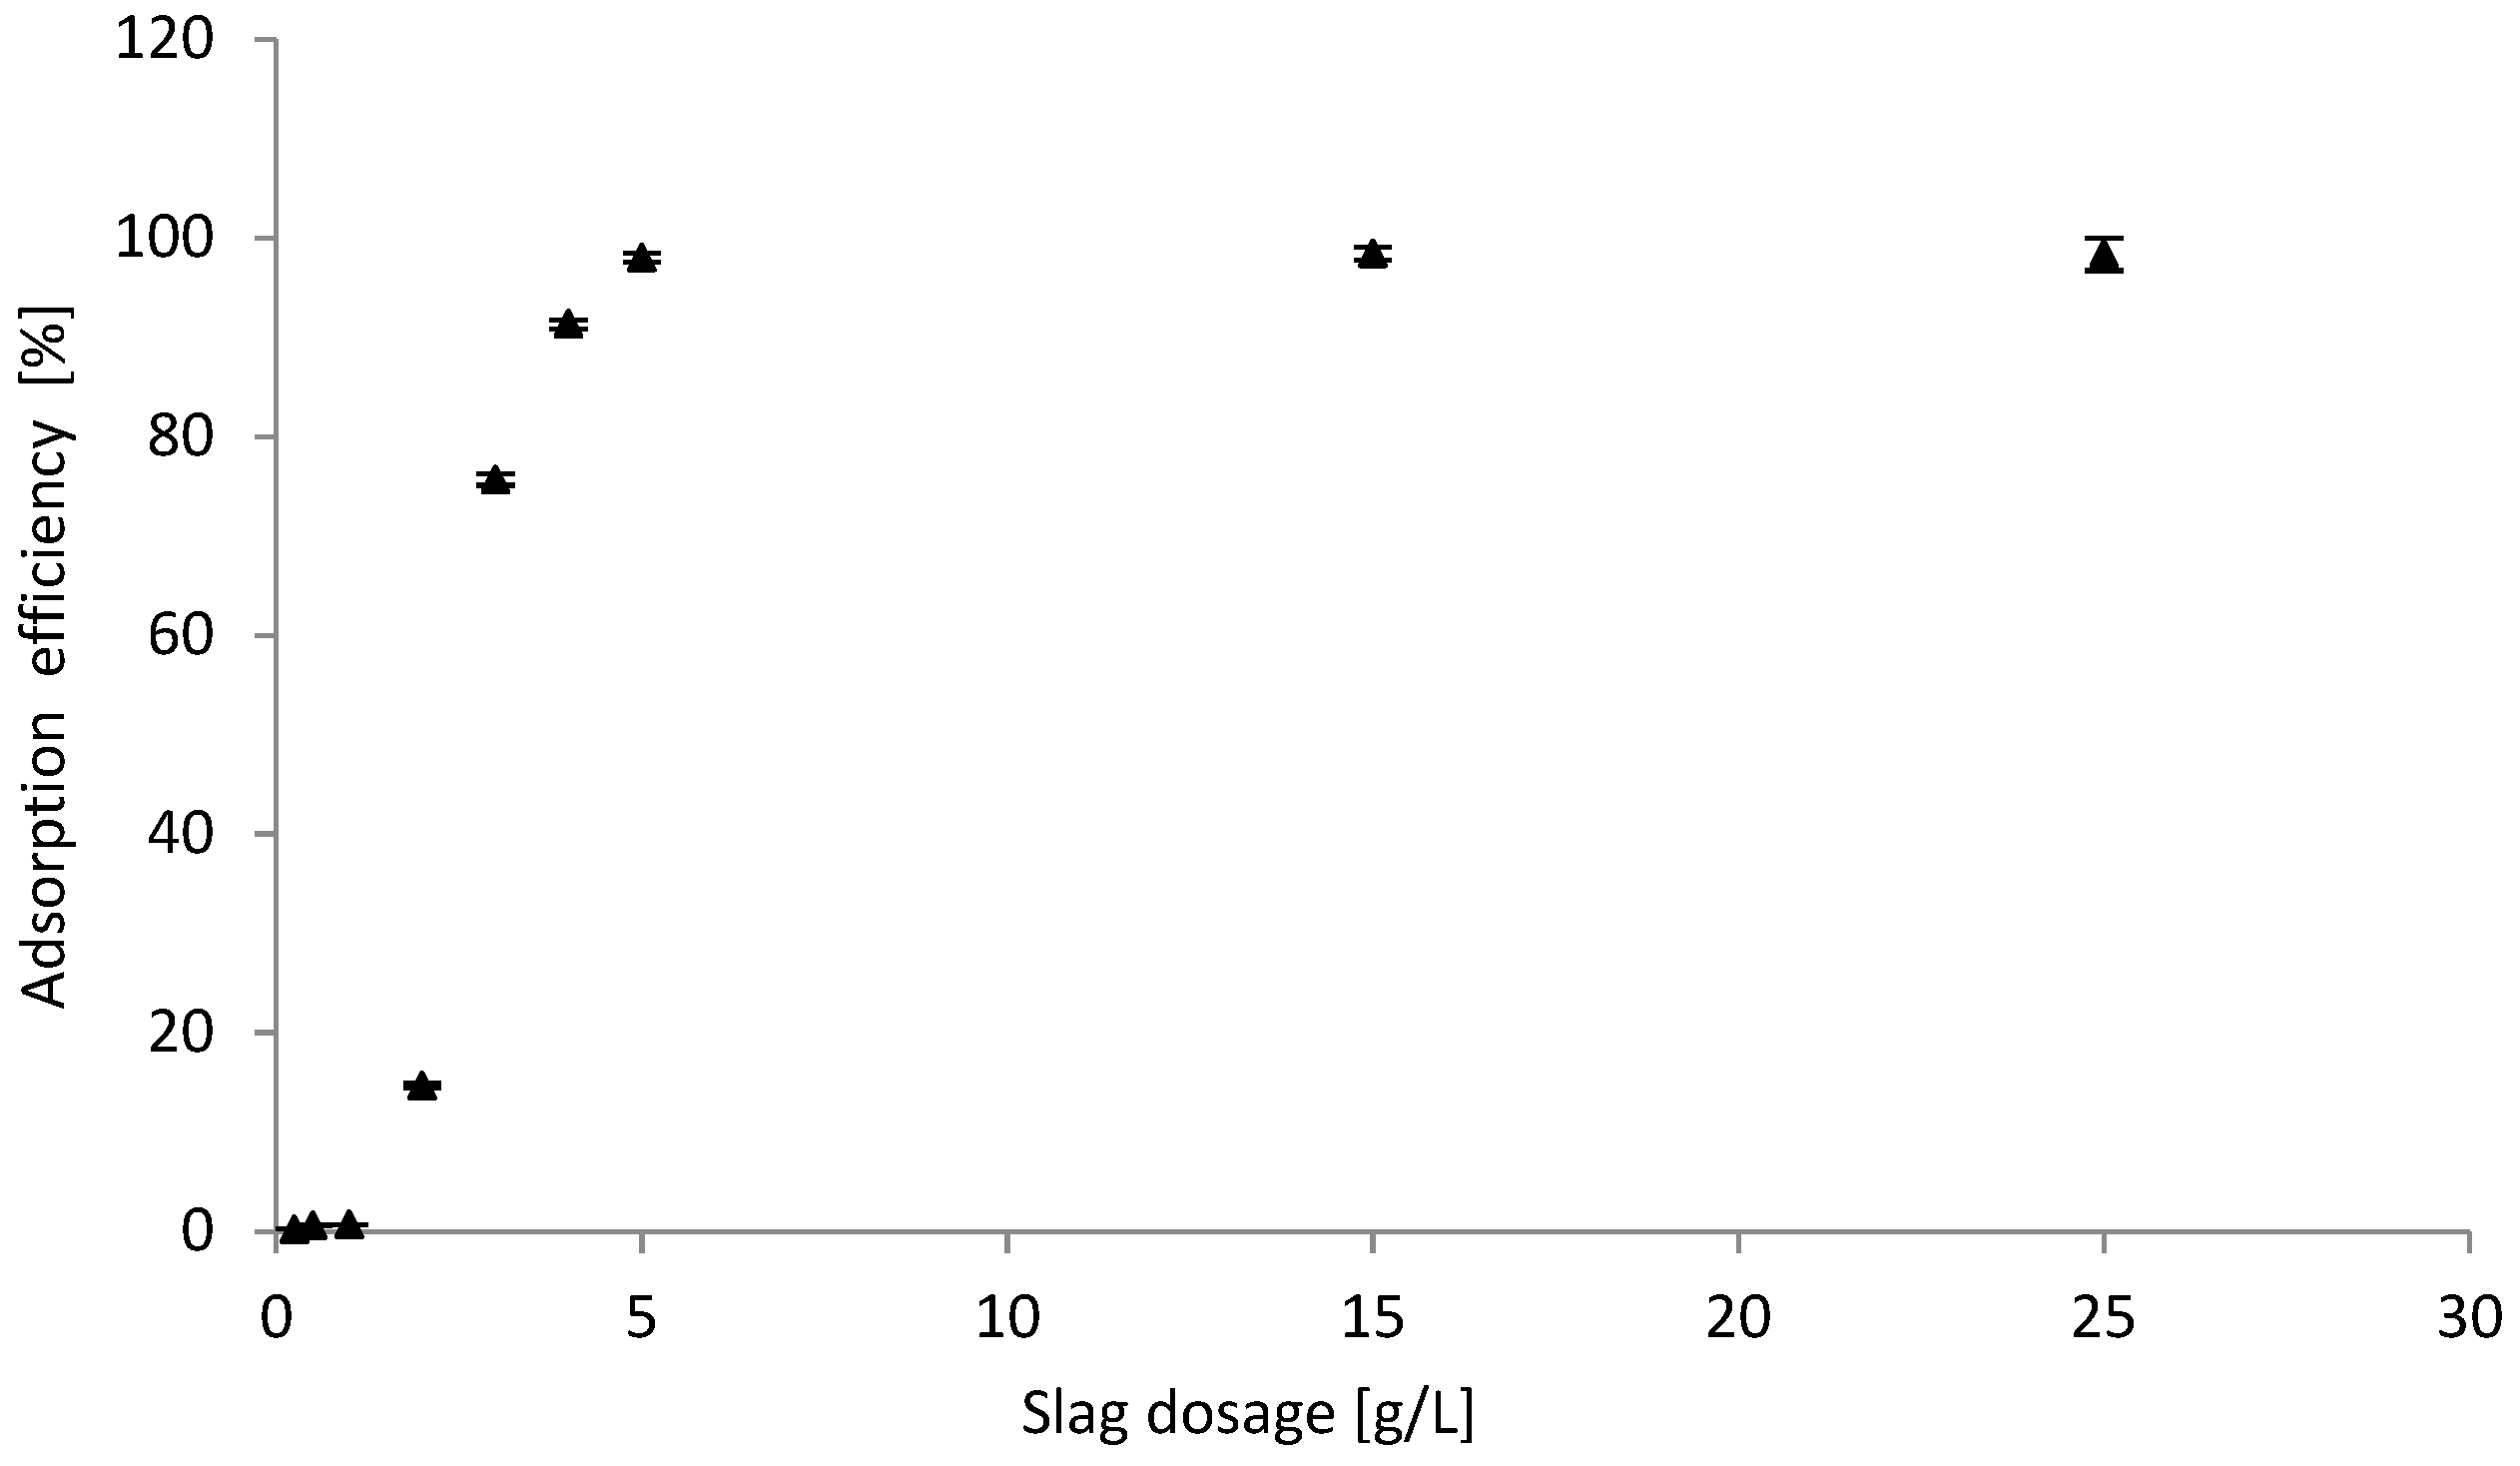
the effect of CFBC-S dosage: initial pH 1.9, initial concentration of Cu(II) ions 100 mg/L, contact time 60 min, T = 21 °C, agitation speed 200 rpm,
(C)
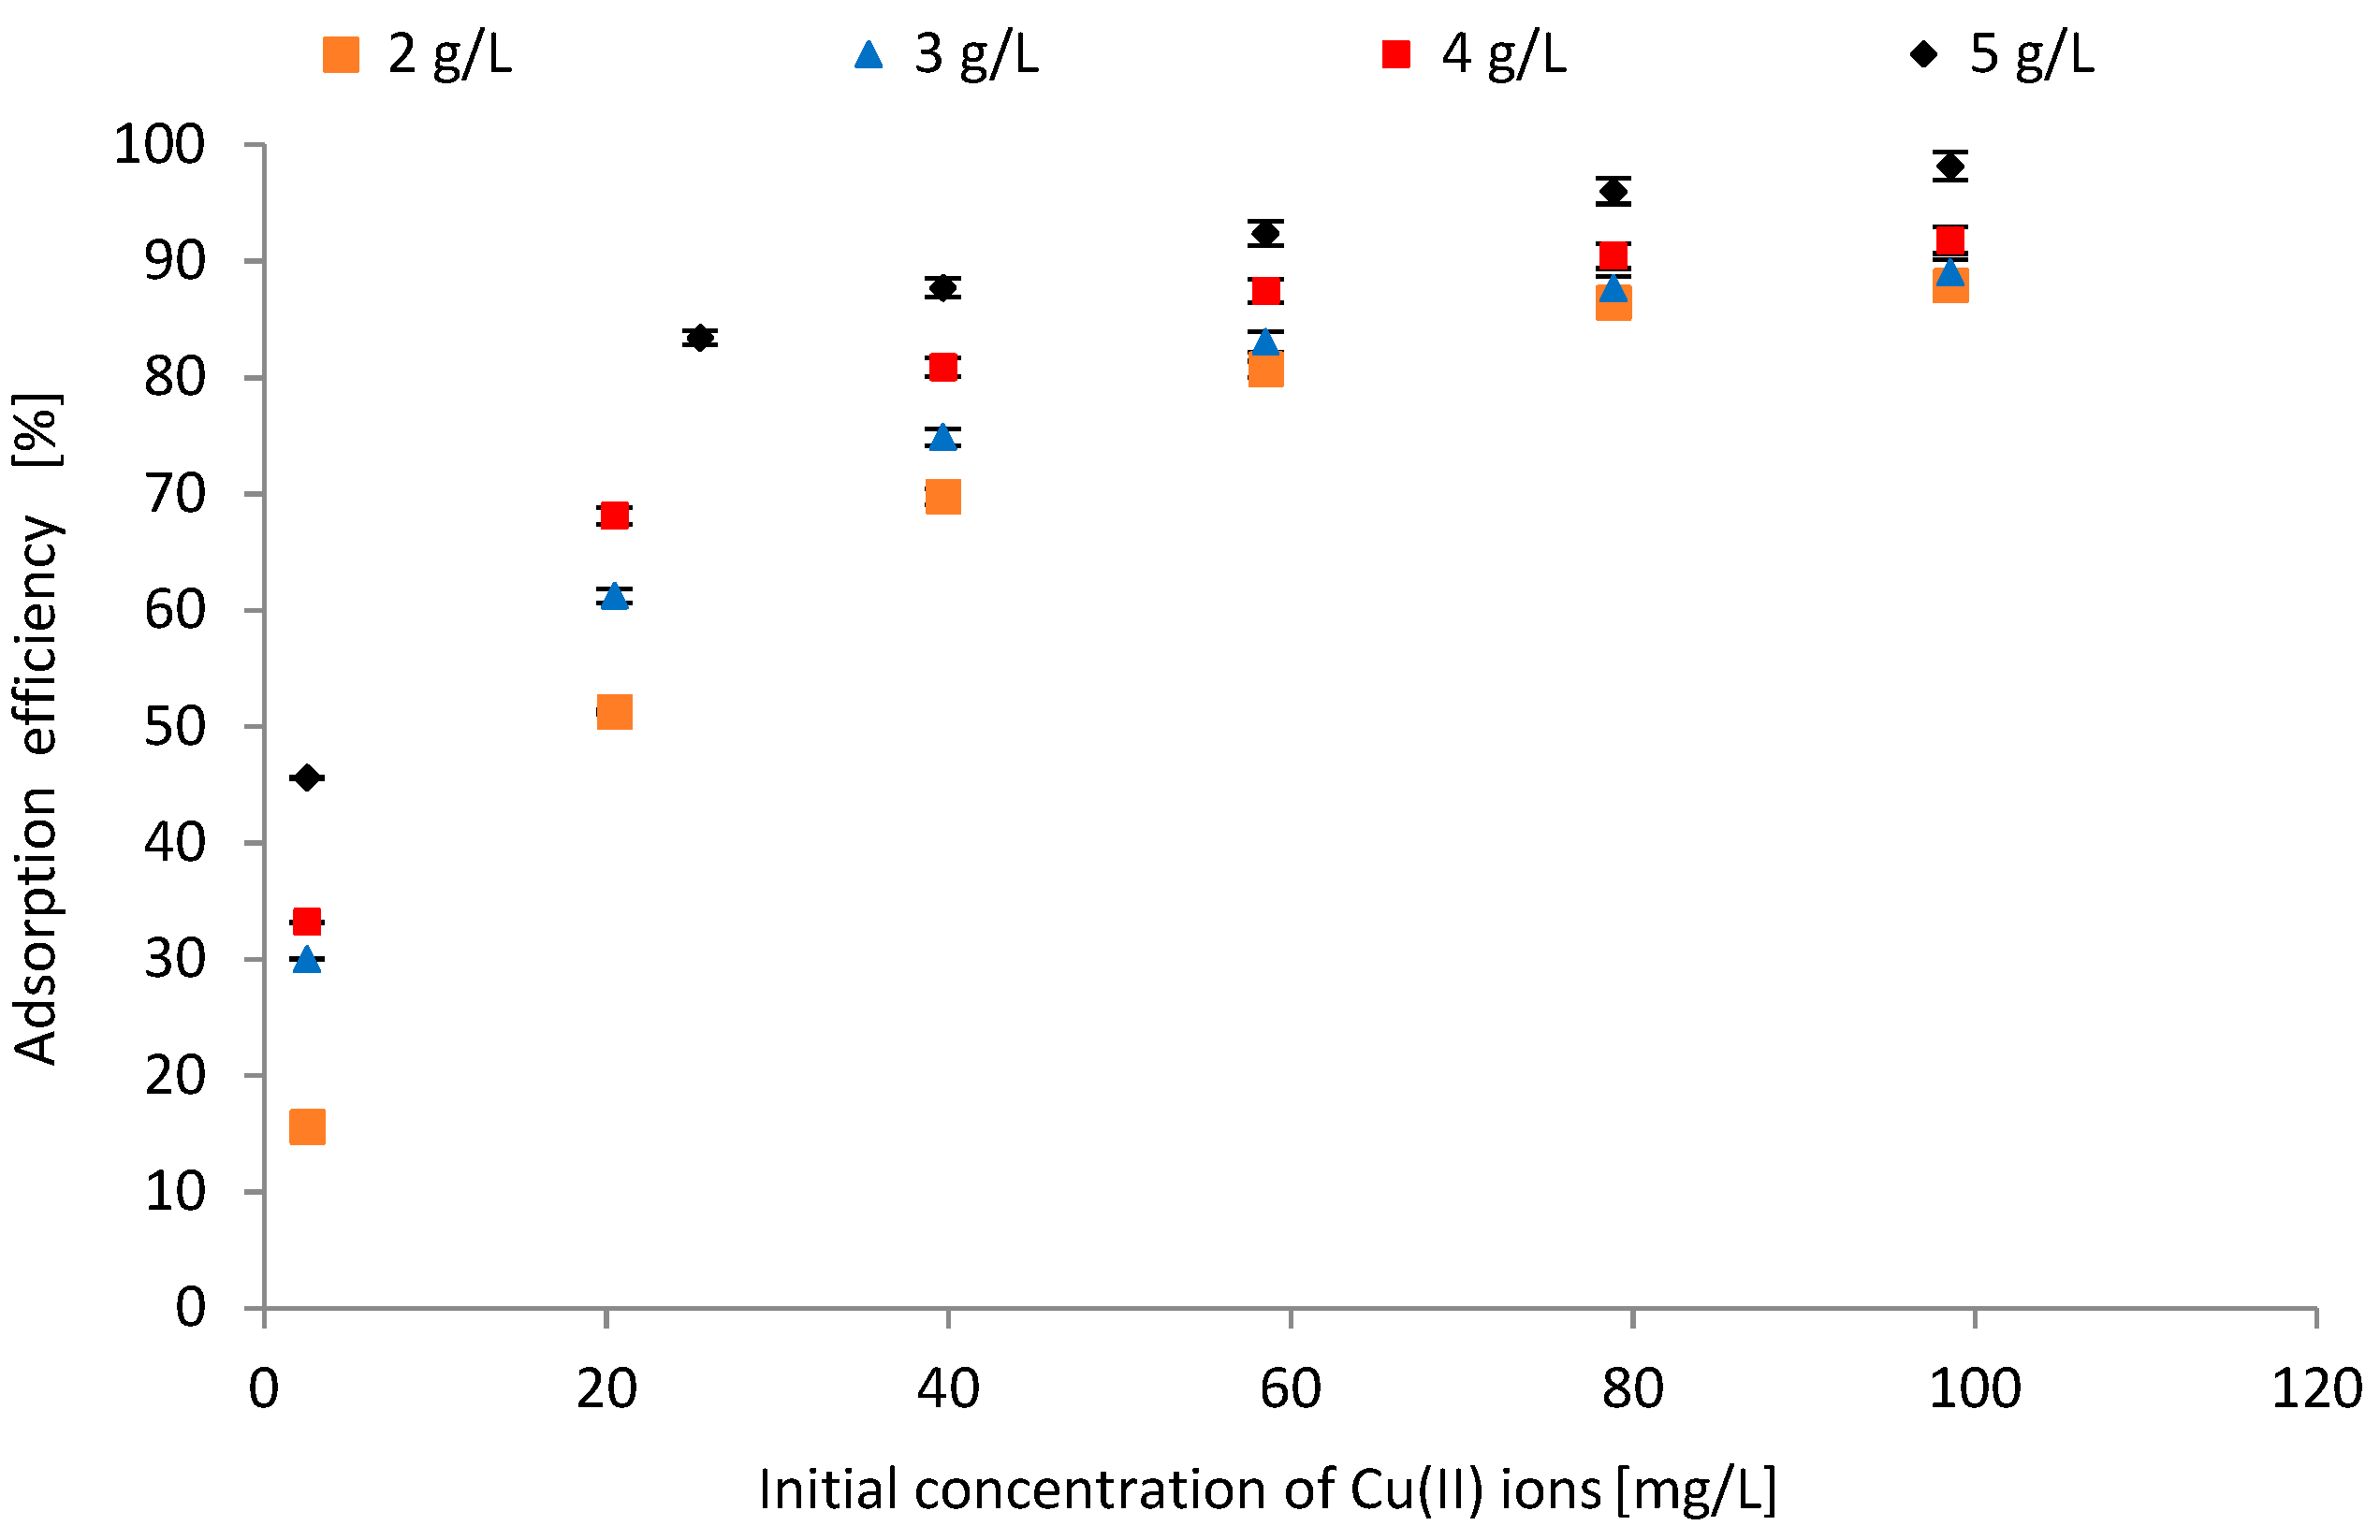
the effect of initial concentration of Cu(II) ions: initial concentration of Cu(II) (2.5–100 mg/L), slag dosage 2–5 g/L, initial pH 1.9, contact time 60 min, agitation speed 200 rpm, T = 21 °C,
(D)
the effect of contact time: initial concentration of Cu(II) ions 100 mg/L, initial pH 1.9, slag dosage 1–5 g/L, T = 21 °C, agitation speed 200 rpm.

4.2. Adsorption Reaction Models

Kinetic studies were carried out using pseudo-first-order and pseudo-second-order models. Pseudo-first-order (PFO) assumes that, firstly, sorption only occurs on localized sites and there is no interaction between the sorbed ions, which correspond to the monolayer of adsorbates on the adsorbent surface; secondly, sorption only occurs on localized sites and is proportional to the number of unoccupied sites. The pseudo-second-order (PSO) model is used to characterize the adsorption behavior over the complete range or final stage of the adsorption process [38]. The PFO and PSO models are described by the Equations (3) and (4), respectively:
q t = q e ( 1 e k 1 t )
q t = q e 2 k 2 t 1 + q e k 2 t
where: qt is the amount of Cu(II) ions adsorbed [mg/g] at any time t [min.]; qe—the maximum amount of Cu(II) ions adsorbed per mass of the biosorbent [mg/g] at equilibrium; k1—the rate constant of pseudo-first-order adsorption [1/min.]; k2—the rate constant of pseudo-second-order adsorption [g/(mg·min.)].
The intraparticle diffusion model, which relates to pore diffusion, assumes that internal diffusion of the adsorbate is assumed to be the slowest stage in the model, leading to the rate-controlling step during the adsorption process, which is immediate [39]. The model can be described by the Equation (5):
q t = k i d t 0.5 + C
where: qt is adsorbate uptake, the amount adsorbed [mg/g] at time t [min], kid is the intraparticle diffusion rate constant [mg/g/min0.5], t0.5 is square root of time [min0.5], C is a constant relating to the thickness of the boundary layer [mg/g].
Langmuir and Freundlich equilibrium isotherm models are based on the Equations (6) and (7), respectively:
q e = q m a x K L C e 1 + K L C e
q e = K F C e 1 n
where: qmax—the maximum adsorption capacity [mg/g]; KL—the Langmuir constant; Ce—the equilibrium concentration after the adsorption process [mg/L]; KF—the Freundlich constant and 1/n—the intensity of adsorption.

5. Results and Discussion

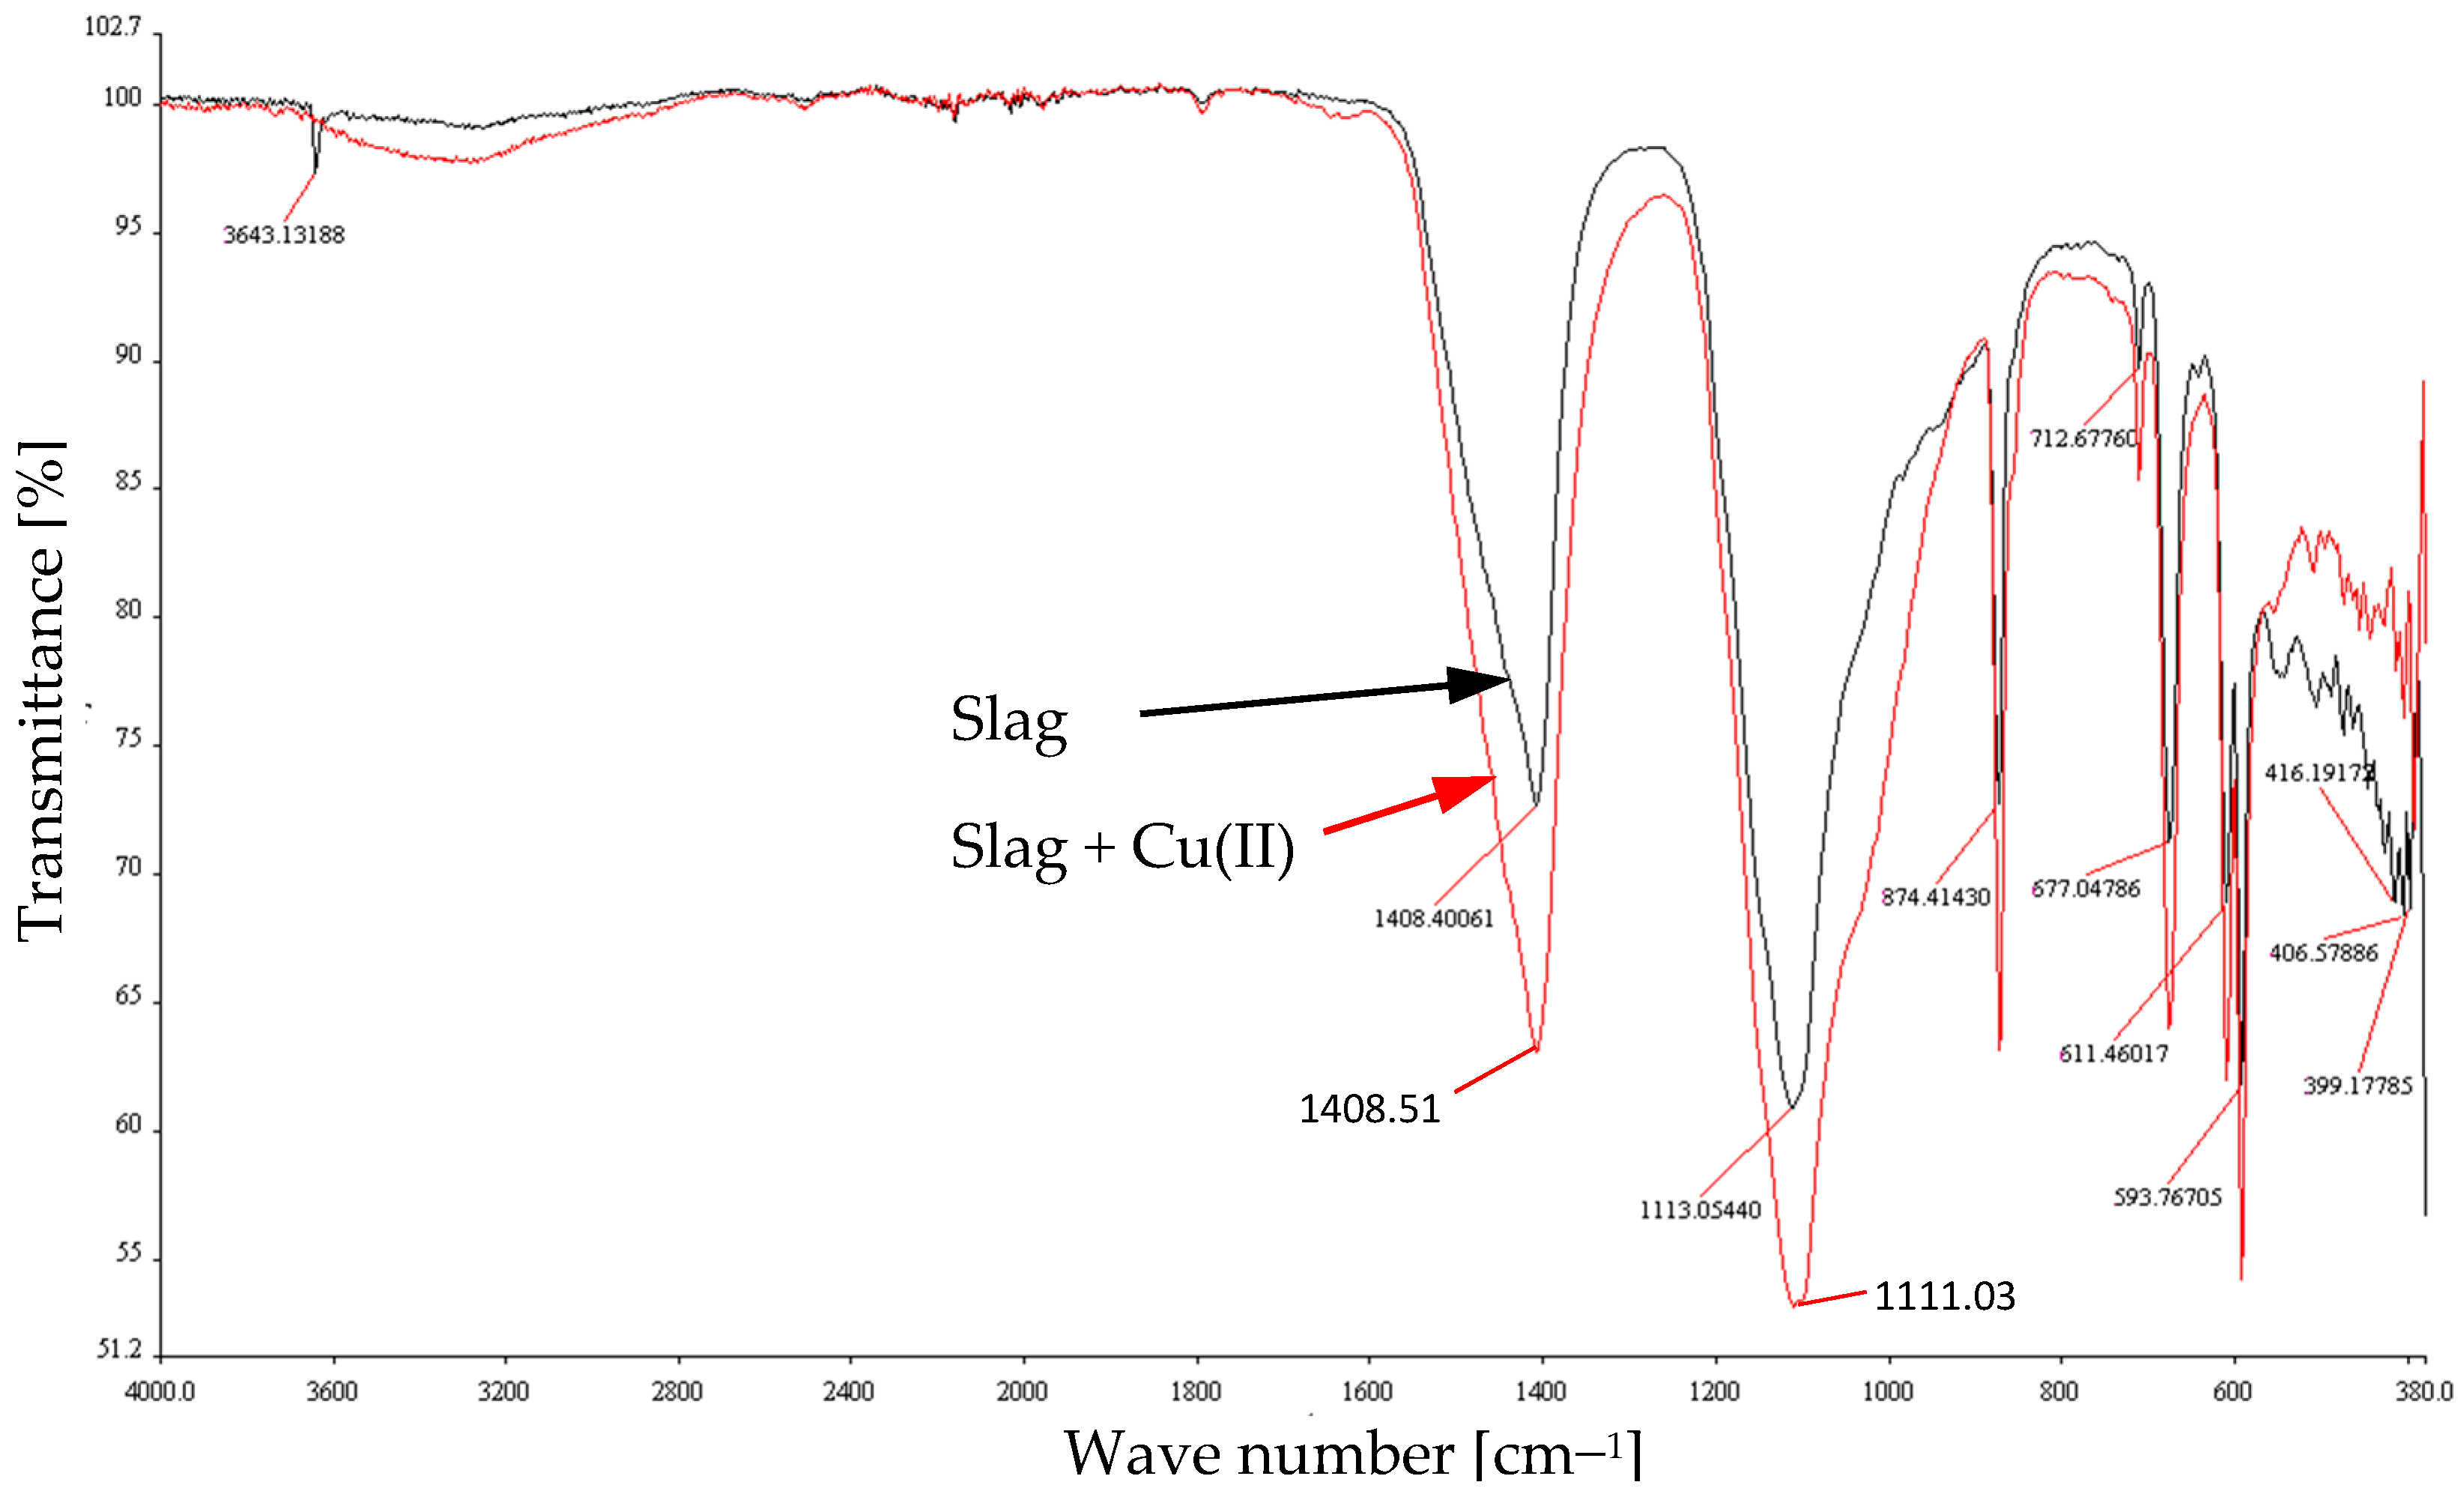
5.1. Characterization of the Slag Material

Granulation analysis was performed, and the results are as follows: slag particles in diameter 0–0.221 mm—13.1%; 0.212–0.51 mm—73.8%; 0.500–1.0 mm—11.2%; 1.0–1.7 mm—0.51%; >1.7 mm—1.39%. According to the literature, smaller slag particles are characterized by a larger specific surface area and the number of active centers, which translate into higher sorption efficiency of metal ions [40]. Consequently, the decision was made to use the smallest fractions with a diameter less than 0.212 mm in the subsequent adsorption studies.
Elemental analysis using the SEM-EDS method was performed, and the results are shown in Table S1 and Figure S1 (Supplementary Material). As it is seen, slag mainly includes the following elements: Ca, O, P, Si, Al, Mg, Fe, and C. The method is based on a spot measurement on the sample surface. Slag is a complex mixture; hence, the quantitative and qualitative compositions may slightly differ in different places of the agglomerates due to the location of the measuring point.
Moreover, the slag sample was analyzed using X-ray diffraction, and Figure 5 depicts the diffraction pattern. The research revealed that the following chemicals are the primary crystalline phases: calcium sulfate (CaSO4, 77.72%), calcite (CaCO3, 10.09%), quartz (synSiO2, 3.75%), portlandite (syn Ca(OH)2, 2.6%), lime (CaO, 4.92%), magnesium oxide (MgO, 0.93%). Slag is a combustion product and, as a heterogeneous mixture, it should be noted. The crystalline phases of the ingredients should be the same, even when an X-ray diffraction study of a sample taken from another part of the tank following a combustion process may reveal different amounts of components. In the literature, similar XRD analysis results were found [41,42].
The BET and BJH analyses revealed the following results: specific surface area of 1.87 m2/g, pore volume (Vp) of 0.0096 cm3/g, and mean pore diameter (Apd) of 21.2 nm. The obtained adsorption isotherms (Figure 6 and Figure 7) have a form that resembles the type III isotherm. This means that the remaining particles may sorb more readily if previously adsorbed Cu(II) ions are present. When the copper ions have already been adsorbed at least once, the interaction of the copper ions with the slag adsorbent has a favorable influence on the adsorption of remaining copper ions. As a result, the isotherm bulges in the direction of the pressure axis [43].
The SEM and TEM photographs of the samples are shown in Figure 8 and Figure 9, respectively, showing flocs of irregular shape and different sizes. The irregular shape depends on the temperature and duration of the combustion process. More crystalline and spherical particles result from a longer process. The particles are compact, spongy, and of different shades; the darker zones correspond to the thicker material. Similar observations were found in the literature [42,44,45].
FT-IR measurements of CFBC-S before and after Cu(II) ion adsorption were performed, and the spectra are shown in Figure 10. For this purpose, the sorption frequencies of functional groups, bonds, and types of vibrations were identified. As can be seen, there is an increase in the intensity of peaks after Cu(II) adsorption. The following peaks have been observed: 593, 416, 406, 390 cm−1 (bending vibrations Si-O-Si), 677, 611 cm−1 (stretching vibrations Al-O), and 713 cm−1 (symmetric stretching of Si-O-Si and Al-O-Si). 874 cm−1 (symmetric stretching of Al-O-M, vibration of carbonates (calcite)), 113 cm−1 (asymmetric stretching vibrations of silica Si-O-Si and Al-O-Si), 1408 cm−1 (valence vibration of carbonate ions), 3252 cm−1 (stretching vibrations O-H), and 3643 cm−1 (asymmetric and symmetric stretching vibrations O-H (probably amorphous silicates or hydrated aluminum silicates)). The wide band at around 3600–3200 cm−1 appeared after, but the weak, sharp peak at 3643 cm−1 disappeared. The peaks at 594, 611, 677, 713, 874, 1113, and 1408 cm−1 became more intensive due to a probable complexation reaction and the formation of surface complexes with Cu(II) ions or bonds with the metal ions (Cu-O) [40].

5.2. Adsorption Studies

5.2.1. The effect of Initial pH

The impact of initial pH on the adsorption efficiency and adsorption capacity was analyzed, and the results are shown in Figure 11 and Figure 12. As a result, high adsorption efficiency was reported at initial pH 1.8 for the slag doses of 1 g/L (86.6%), 3 g/L (90.7%), and 5 g/L (98.8%). An increase in initial pH resulted in a gradual decrease in adsorption efficiency. The experimental adsorption capacity also reported a stable decrease in the range of 19.5–14.7 mg/g. In considering the influence of initial pH, the surface charge of slag and the degree of speciation should be taken into account. The interfacial tension levels at the solid-liquid interface have a significant impact on the adsorption phenomenon [46]. The slag adsorbent is alkaline in nature; therefore, it may increase the pH of an aqueous solution during adsorption. The presence of such anions in the adsorbing material as SiO32−, CO32−, PO43−, OH, and SO42− may contribute to the precipitation of Cu(II) ions from the solution at higher pH when the concentration of H+ ions is reduced. The pH parameter influences the electrostatic charge of the metal oxides present in the adsorbent material, consequently, it might be the cause of the ions’ behavior. Hence, it is highly probable that the adsorption of Cu(II) ions may be associated with ion exchange and/or complexation by bonding with oxygen groups. The probable ion exchange mechanism between H+ and Cu2+ ions can be proposed by Equations (8)–(10).
X - O H + H 3 O + X - O H 2 + + H 2 O
X - O H + O H X - O + H 2 O
2 ( X - O ) + C u 2 + ( X - O ) 2 C u
where: X may be Fe, Si, Al or another element. It should be pointed out that the proposed mechanism was not confirmed by additional experiments in this research [2].
According to the isotherm study, the adsorption process obeys the multilayer sorption of Cu2+ on CFBC-S (physical adsorption) since it fits better the Freundlich isotherm. The formation of a complex between the Cu2+ ion and Si of CFBC-S through the exchange of H+ ions in the perimeter may be the cause of the inner layer sorption of Cu2+ ions on CFBC-S. Moreover, the electrostatic interaction with positive Cu2+ ions is promoted by the negatively charged CFBC-S surface. As a consequence, multilayer adsorption is related to the electrostatic interaction between Cu2+ ions and the oxygen groups (e.g., OH, CO32−) on the adsorbent. One potential explanation for the metal-ion adsorption on the CFBC-S is the production of metal-sulfur complexes through ion exchange and electrostatic interactions [47]. An exchange interaction of the slag with the effluent may be stated as follows [48]:
S i O C a + 2 H O H S i O H 2 + C a 2 + + 2 ( O H )
Given the high concentration of H+ ions in an acidic environment, it is expected that the reaction (4) will go to the left. As a result of the aforementioned strategy, the slag materials had a neutralizing effect. When the pH of the solution increased, Ca2+ ions interacted with H+ ions from the slag, demonstrating that the reaction in Equation (5) took place when the CFBC-S was present in solutions. The sorption equilibrium was consistent with the slag’s significant ion exchange capability. The Equation (12) can be written as follows for metal ions (M2+) [49]:
( S i O ) 2 C a 2 + + H 3 O + 2 ( S i O H ) + C a 2 + + O H
As indicated in the schematic diagram in Figure 13, the oxygen atoms in OH groups with their single pair of electrons play a significant part in the complexation between metal ions and these OH groups [50].

5.2.2. The Effect of CFBC-S Dosage

The impact of CFBC-S dosage on the adsorption of Cu(II) has been studied, and the results are shown in Figure 14. The experiments were conducted under following conditions: initial pH 1.9, initial concentration of Cu(II) ions100 mg/L, contact time 60 min, T = 21 °C, agitation speed 200 rpm. The results showed a rapid increase in adsorption efficiency up to 98% with the use of slag dosages of 0.25–5 g/L. The dose of 5 g/L is considered optimal under these experimental conditions. Furthermore, analysis of adsorption capacity revealed that, firstly, it increased up to 2.58 mg/g (dosage of 3 g/L), and secondly, it gradually decreased to 0.4 mg/g at a dose of 25 g/L (Figure S2). Consequently, the optimal experimental adsorption capacity can be estimated in the range between 2.0 and 2.6 mg/g. The most active step of the adsorption process, when all free active sites are loaded with Cu(II) ions, is responsible for the abrupt increase in the first phase. With higher dosages of adsorbents, active centers available for further adsorption were not fully utilized. Consequently, a gradually declining adsorption capacity was observed. Similar findings were reported in the literature [44,51].

5.2.3. The Effect of Initial Concentration of Cu(II) Ions

The influence of the initial concentration of Cu(II) ions was investigated, and the results are shown in Figure 15. The following conditions were applied in this stage: initial concentration of Cu(II) (2.5–100 mg/L), slag dosage 2–5 g/L, initial pH 1.9, contact time 60 min, agitation speed 200 rpm, T = 21 °C. The adsorption curves show an upward trend in all cases of slag doses. Higher adsorption efficiencies were obtained at the initial concentration of 100 mg/L (98.2%—5 g/L of slag, 91.8%—4 g/L, 89.0%—3 g/L, 87.9%—2 g/L). The experimental adsorption capacity likewise showed an increase (Figure S3). This is because there were still free active sites accessible, and the total number of them affected the adsorption efficiency. According to the findings of the study, surface saturation of the adsorbent materials is influenced by the initial concentration of Cu(II) ions in the solution. Ion exchange took place at the interface with an initial concentration. The literature indicates that the ion radius of the Cu2+ cation is 0.73 Å. There is a correlation between metal ions’ tendency to hydrolyze in aqueous solutions and their lower ion radii. Large diameter hydrolyzed particles have a lesser adsorption capability, which lowers the removal effectiveness [52,53].

5.2.4. The Effect of Contact Time

The research results on the influence of contact time on sorption efficiency and sorption capacity are shown in Figure 16 and Figure S4. Due to the potential for usage in industry, contact time is a key factor in research studies on the adsorption process. Finding the ideal contact time may lead to more efficient process design and industrial implementation, as well as lower costs. The results of these investigations from earlier research enabled the establishment of the following experimental conditions: initial concentration of Cu(II) ions 100 mg/L, initial pH 1.9, slag dosage 1–5 g/L, T = 21 °C, agitation speed 200 rpm. The maximum level of adsorption efficiency was achieved in the range of 20–30 min of the process, and no changes were observed until 60 min; hence, there was no need to continue the experiment for a longer time. A high concentration of Cu(II) ions at the interface and the presence of more free active sites on the adsorbent surface may have caused an initial increase in adsorption. Through Cu(II) ion occupancy of active centers, the equilibrium of this mechanism was finally attained. Similar observations can be found in the literature [54].

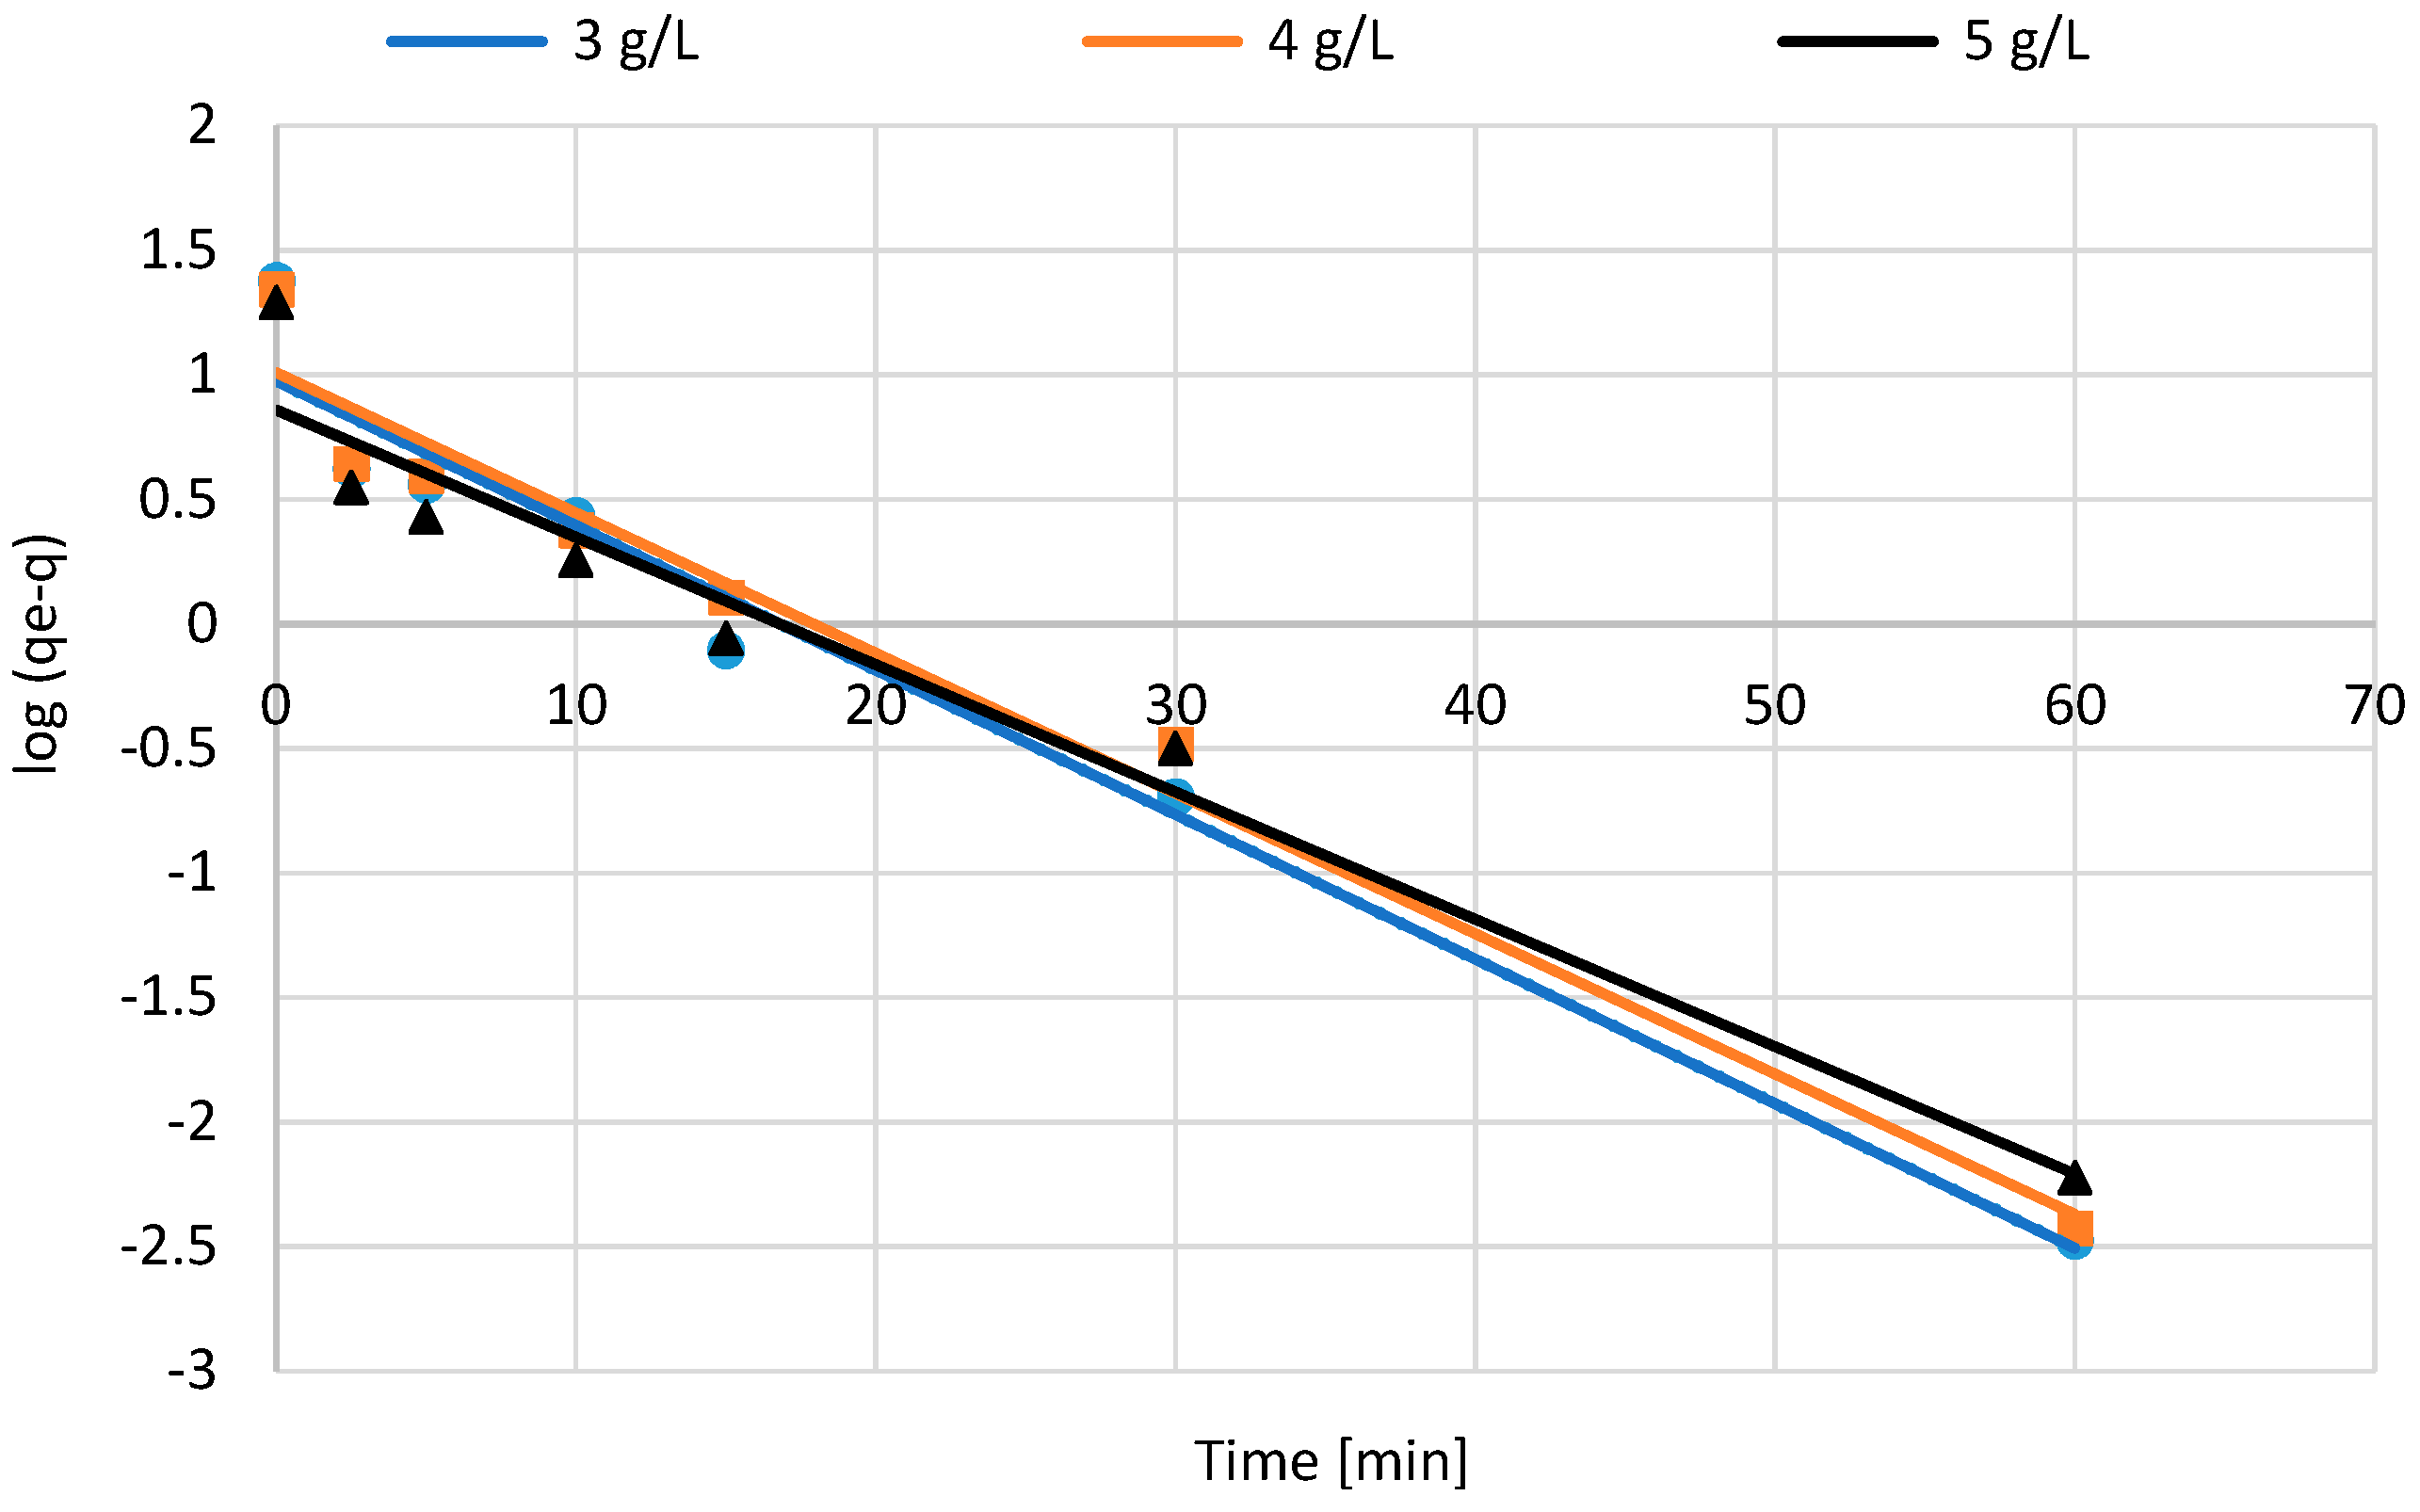
5.2.5. Kinetic Models

The kinetics of Cu(II) adsorption on CFBC-S were analyzed with pseudo-first-order (PFO) and pseudo-second-order (PSO) models. The calculation results (reaction rate constant k, equilibrium adsorption capacity qe, and correlation coefficients R2) are presented in Table 5, and the plots are shown in Figure 17 and Figure 18. The calculations showed that higher coefficients R2 were recorded in the case of the PSO model, which is related to a greater correlation between the experimental qe and the calculated qt values. Therefore, it can be concluded that the kinetics of Cu(II) adsorption on CFBC-S are better described by the PSO model. Chemisorption and electrostatic attraction on the adsorbent surface could take place during these processes.
The intraparticle particle diffusion model is yet another kinetic model that relies on chemical sorption. It involves switching off or sharing electrons between the metal ions and the sorbent [55]. It is believed that the movement of metal ions from the liquid to the sorbent’s external surface, followed by the ions’ dispersion into the pores, is what causes adsorption to occur. It is a laborious process that takes a lot of time0.5 [56]. A relationship between adsorbate uptake and the square root of time (t0.5) is shown in Figure 19 and calculated diffusion parameters are presented in Table 6. The presence of mesopores with a sizable number of sites open for the tiny ions is confirmed by the increased adsorption capacity. Calculated data demonstrated good linear regression coefficients (R2 ≈ 0.999). It shows that the models are applicable and that intraparticle diffusion is the rate-monitoring step. Based on the theoretical explanations of the intraparticle diffusion model, the boundary layer thickness is represented by the arbitrary constant C, of which a higher value denotes a thicker boundary layer [57,58]. The linear line should pass through the origin if C is equal to 0, which signifies the absence of a boundary layer. As a result, intraparticle diffusion would continue to be the rate-controlling stage throughout the whole adsorption kinetic process because the film could be ignored due to no or minimal thickness. Numerous investigations have revealed nonzero intercepts, which suggests that in most adsorption processes, the rate-limiting stage comprises both intraparticle and film diffusion. According to the literature, the macro, meso, and micro pores exhibit three regressions of intraparticle diffusion, with a horizontal line serving as the equilibrium [59]. Three linear zones were identified by another study: rapid surface loading at first, followed by pore diffusion, and then horizontal equilibrium [60]. In this investigation, it was difficult to distinguish between three or four zones. However, it is assumed that the adsorption process between the film and intraparticle diffusion can be explained by the two linear zones [61]. Film diffusion served as a representation of the first, rapid rise (surface adsorption), and a horizontal line serving as the equilibrium as the last step [62].

5.2.6. Isotherm Models

Langmuir and Freundlich isotherms were used to analyze the studied adsorption process. The calculations of isotherm parameters are shown in Table 7, and the isotherms are included in Figure 20 and Figure 21. Based on the Langmuir equation, the maximum adsorption capacities are as follows: 53.04 mg/g (CFBC-S dosage 2 g/L), 56.05 mg/g (3 g/L), 60.92 mg/g (4 g/L), and 70.34 mg/g (5 g/L). According to the calculated correlation coefficients R2, the adsorption reactions carried out in these studies are closer to the Freundlich model than to the Langmuir model.

6. Conclusions

In this research, slag (CFBC-S) obtained as a result of the incineration of municipal sewage sludge with the use of the circulating fluidized bed combustion (CFBC) technology was used. The literature part presents the latest data on the characteristics, methods, and stages of sewage sludge processing, current European Union regulations in this field, the latest statistical data on the production and disposal of sewage sludge in the European Union, the global market for sludge treatment equipment, and energy production in the EU. In addition, the most important processes of sewage treatment, sewage sludge formation, and their thermal transformation to obtain the research samples used in this study were highlighted. In the first stage, selected physicochemical properties of the adsorbent were characterized using various methods. In the second stage, adsorption experiments of Cu(II) were carried out, and the influence of such factors on the process efficiency as initial pH, slag dosage, initial concentration of Cu(II) ions, and contact time were examined. As a result of the research, a high adsorption efficiency of 98.8% was reported under the following conditions: adsorbent dose 5 g/L, initial concentration of Cu(II) ions 100 mg/L, initial pH 1.9, T = 21 °C, contact time 60 min. Many experiments have shown that it is possible to achieve high process efficiency at a level of at least 90%. In the third step, the adsorption kinetics and isotherms were analyzed. It turned out that the investigated sorption processes were best described using a pseudo-second-order kinetic model and the Freundlich model. Kinetic data were analyzed and fitted to the intraparticle diffusion model, thus showing high R2 coefficients.
In summary, it can be stated that slag obtained as a result of CFBC technology can be successfully used to remove copper from aqueous solutions. Slag is industrial waste that can be reused as a new product, which is in line with the promoted zero-waste policy. This achievement surely serves as motivation for further research in the area and could serve as a suggestion for future methods of metal removal from municipal and industrial wastewater.

Supplementary Materials

The following supporting information can be downloaded at: https://www.mdpi.com/article/10.3390/en16155688/s1, Table S1: Elemental composition of CFBC-S (SEM-EDS analysis); SM Methods; Figure S1: EDS spectrum of CFBC slag (magn. ×200); Figure S2: The impact of adsorbent dosage on adsorption capacity of Cu(II); Figure S3: The impact of initial concentration of Cu(II) ions on adsorption capacity; Figure S4: The impact of contact time on adsorption capacity of Cu(II) ions.

Author Contributions

Conceptualization, T.K.; methodology, T.K. and Y.T.; validation, T.K.; formal analysis, T.K.; investigation, T.K.; resources, T.K.; data curation, T.K.; writing—original draft preparation, T.K.; writing—review and editing, T.K. and Y.T.; visualization, T.K.; supervision, T.K.; project administration, T.K. All authors have read and agreed to the published version of the manuscript.

Funding

This research received no external funding.

Institutional Review Board Statement

Not applicable.

Informed Consent Statement

Not applicable.

Data Availability Statement

Data are contained within the article.

Acknowledgments

The authors would like to express special thanks to the Nanobiomedical Centre, Adam Mickiewicz University in Poznań (Poland) for taking TEM images in nanoscale of the research samples.

Conflicts of Interest

The author declares no conflict of interest.

References

  1. Kalak, T. High efficiency of the bioremoval process of Cu(II) ions with blackberry (Rubus L.) residues generated in the food industry. Des. Water Treat. 2021, 238, 174–197. [Google Scholar] [CrossRef]
  2. Kalak, T.; Tachibana, Y. Removal of lithium and uranium from seawater using fly ash and slag generated in the CFBC technology. RSC Adv. 2021, 11, 21964–21978. [Google Scholar] [CrossRef]
  3. Renu Agarwal, M.; Singh, K. Heavy metal removal from wastewater using various adsorbents: A review. J. Water Reuse Des. 2017, 7, 387–419. [Google Scholar]
  4. Tachibana, Y.; Kalak, T.; Nogami, M.; Tanaka, M. Combined use of tannic acid-type organic composite adsorbents and ozone for simultaneous removal of various kinds of radionuclides in river water. Water Res. 2020, 182, 116032. [Google Scholar] [CrossRef] [PubMed]
  5. Kalak, T.; Dudczak-Hałabuda, J.; Tachibana, Y.; Cierpiszewski, R. Effective bioremoval of Fe(III) ions using paprika (Capsicum annuum L.) pomace generated in the food industry. J. Mater Cycles Waste Manag. 2021, 23, 248–258. [Google Scholar] [CrossRef]
  6. Sathya, K.; Nagarajan, K.; Carlin Geor Malar, G.; Rajalakshmi, S.; Raja Lakshmi, P. A comprehensive review on comparison among effluent treatment methods and modern methods of treatment of industrial wastewater effluent from different sources. Appl. Water Sci. 2022, 12, 2190–5495. [Google Scholar] [CrossRef] [PubMed]
  7. WHO. WHO. WHO Library Cataloguing-in-Publication Data. In Guidelines for Drinking-Water Quality; WHO: Geneva, Switzerland, 2006; Volume 1. [Google Scholar]
  8. Briffa, J.; Sinagra, E.; Blundell, R. Heavy metal pollution in the environment and their toxicological effects on humans. Heliyon 2020, 6, e04691. [Google Scholar] [CrossRef] [PubMed]
  9. Taylor, A.A.; Tsuji, J.S.; McArdle, M.E.; Adams, W.J.; Goodfellow, W.L. Recommended Reference Values for Risk Assessment of Oral Exposure to Copper. Risk Anal. 2023, 43, 211–218. [Google Scholar] [CrossRef]
  10. Bezak-Mazur, E.; Widłak, M.; Gawdzik, J.; Stoińska, R.; Zapała-Sławeta, J.; Ciopińska, J. Properties of ashes formed after the combustion of sewage sludge. E3S Web Conf. 2018, 44, 00012. [Google Scholar] [CrossRef]
  11. Liang, Y.; Xu, D.; Feng, P.; Hao, B.; Guo, Y.; Shuzhong Wang, S. Municipal sewage sludge incineration and its air pollution control. J. Cleaner Prod. 2021, 295, 126456. [Google Scholar] [CrossRef]
  12. Malerius, O.; Werther, J. Modelling the adsorption of mercury in the flue gas of sewage sludge incineration. J. Chem. Eng. 2003, 96, 197–205. [Google Scholar] [CrossRef]
  13. Fytili, D.; Zabaniotou, A. Utilization of sewage sludge in EU application of old and new methods—A review. Renew. Sust. Energy Rev. 2008, 12, 116–140. [Google Scholar] [CrossRef]
  14. Cai, R.; Ke, X.; Lyu, J.; Yang, H.; Zhang, M.; Yue, G.; Ling, W. Progress of circulating fluidized bed combustion technology in China: A review. Clean Energy 2017, 1, 36–49. [Google Scholar] [CrossRef] [Green Version]
  15. Yuansheng, H.; Mengshu, S. What are the environmental advantages of circulating fluidized bed technology?—A case study in China. Energy 2021, 220, 119711. [Google Scholar] [CrossRef]
  16. Directive 2008/98/EC of the European Parliament and of the Council of 19 November 2008 on Waste and Repealing Certain Directives, Document 32008L0098. 2008. Available online: https://eur-lex.europa.eu/ (accessed on 6 June 2023).
  17. Kalak, T. Potential Use of Industrial Biomass Waste as a Sustainable Energy Source in the Future. Energies 2023, 16, 1783. [Google Scholar] [CrossRef]
  18. Ðurdević, D.; Žiković, S.; Blecich, P. Sustainable Sewage Sludge Management Technologies Selection Based on Techno-Economic-Environmental Criteria: Case Study of Croatia. Energies 2022, 15, 3941. [Google Scholar] [CrossRef]
  19. Guo, W.-Q.; Yang, S.-S.; Xiang, W.-S.; Wang, X.-J.; Ren, N.-Q. Minimization of excess sludge production by in-situ activated sludge treatment processes—A comprehensive review. Biotechnol. Adv. 2013, 31, 1386–1396. [Google Scholar] [CrossRef]
  20. Karaca, C.; Sözen, S.; Orhon, D.; Okutan, H. High temperature pyrolysis of sewage sludge as a sustainable process for Energy recovery. Waste Manag. 2018, 78, 217–226. [Google Scholar] [CrossRef]
  21. Demirbas, A.; Edris, G.; Alalayah, W.M. Sludge production from municipal wastewater treatment in sewage treatment plant. Energy Sources Part A Recovery Util. Environ. Eff. 2017, 39, 999–1006. [Google Scholar] [CrossRef]
  22. Aziz, S.Q.; Mustafa, J.S. Wastewater sludge characteristics, treatment techniques and energy production. Rec. Sustain. Dev. 2022, 15, 9–27. [Google Scholar]
  23. Bertanza, G.; Pietro, B.; Canato, M. Ranking sewage sludge management strategies by means of Decision Support Systems: A case study. Resour. Conserv. Recycl. 2016, 110, 1–15. [Google Scholar] [CrossRef]
  24. Lacroix, N.; Rousse, D.; Hausler, R. Anaerobic digestion and gasification coupling for wastewater sludge treatment and recovery. Water Manag. Res. 2014, 32, 608–613. [Google Scholar] [CrossRef] [PubMed]
  25. Raheem, A.; Sikarwar, V.S.; He, J.; Dastyar, W.; Dionysiou, D.D.; Wang, W.; Zhao, M. Opportunities and challenges in sustainable treatment and resource reuse of sewage sludge: A review. Chem. Eng. J. 2018, 337, 616–641. [Google Scholar] [CrossRef]
  26. Metcalf, L.; Eddy, H.P. Wastewater Engineering: Treatment, Disposal and Reuse, 5th ed.; McGraw Hill: New York, NY, USA, 2014; p. 2048. ISBN 978-0073401188. [Google Scholar]
  27. Kalak, T.; Dudczak, J.; Cierpiszewski, R. Characterisation of Fly Ash as a Waste Material Generated in the Municipal Wastewater Treatment Plant Using the Circulating Fluidized-Bed Combustion Technology. In Selected Problems of Industrial Products Quality; Paździor, M., Żuchowski, J., Zieliński, R., Eds.; Kazimierz Pulaski University of Technology and Humanities: Radom, Poland, 2018; pp. 191–203. ISBN 978-83-7351-848-3. [Google Scholar]
  28. Eurostat. Sewage Sludge Production and Disposal from Urban Wastewater (in Dry Substance (d.s)). Available online: https://www.eurostat.eu/ (accessed on 6 June 2023).
  29. Statista Research Department. Size of the Global Sludge Treatment Equipment Market from 2011 to 2017. Available online: https://www.statista.com/statistics/239655/projected-size-of-sludge-treatment-equipment-market/ (accessed on 6 June 2023).
  30. Global Market Insights. Sludge Dewatering Equipment Market—By Technology, by Application (Municipal, Industrial), & Global Forecast. Available online: https://www.gminsights.com/ (accessed on 6 June 2023).
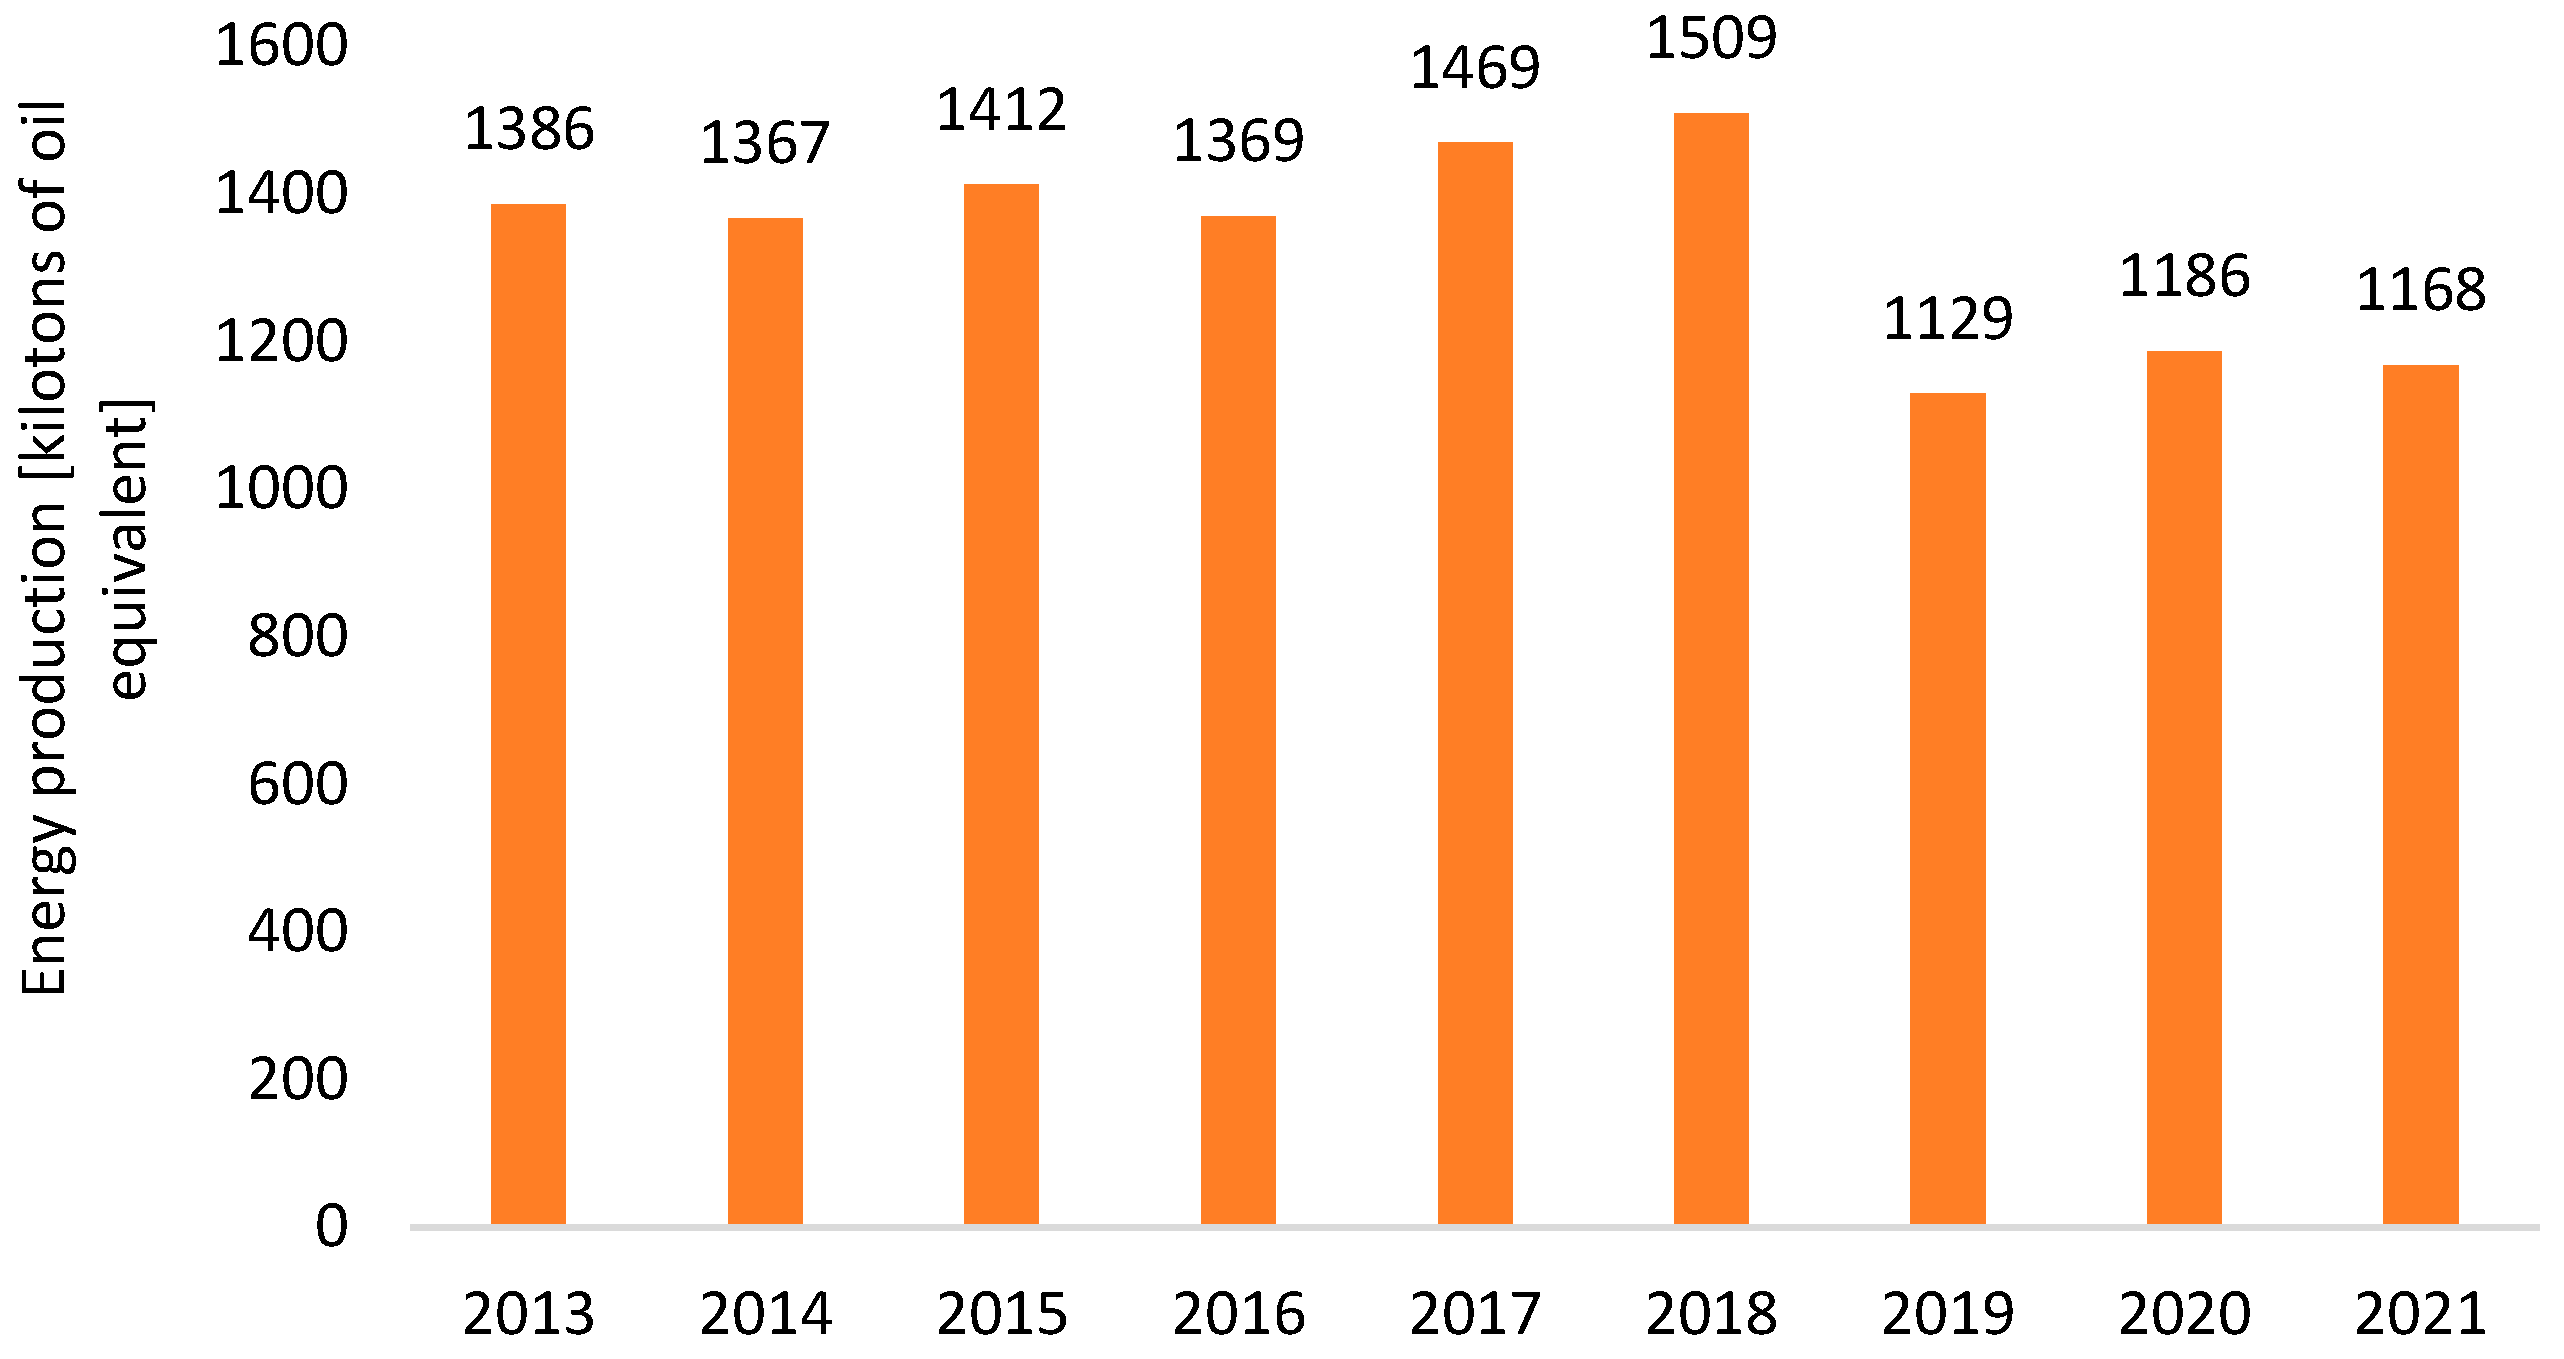
  31. Fernández, L. Primary Energy Production from Sewage Sludge Gas in the European Union (EU) from 2013 to 2021. Available online: https://www.statista.com/statistics/863335/sewage-sludge-gas-energy-production-in-the-european-union-eu/ (accessed on 6 June 2023).
  32. Smol, M. Inventory of Wastes Generated in Polish Sewage Sludge Incineration Plants and Their Possible Circular Management Directions. Resources 2020, 9, 91. [Google Scholar] [CrossRef]
  33. Zaharioiu, A.M.; Bucura, F.; Ionete, R.E.; Marin, F.; Constantinescu, M.; Oancea, S. Opportunities regarding the use of technologies of energy recovery from sewage sludge. SN Appl. Sci. 2021, 3, 775. [Google Scholar] [CrossRef]
  34. Leski, K.; Luty, P.; Łucki, A.; Jankowski, D. Application of circulating fluidized bed boilers in the fuel combustion process. Tech. Trans. 2018, 4, 83–96. [Google Scholar]
  35. Wastewater Treatment Plant. Available online: https://mwik.bydgoszcz.pl/oczyszczalnia-sciekow/ (accessed on 5 July 2023).
  36. The Regulation of the Minister of the Environment of 24 July 2006 on the Conditions to be Met When Discharging Sewage into Water or Soil, and on Substances Particularly Harmful to the Aquatic Environment. Available online: https://isap.sejm.gov.pl/isap.nsf/DocDetails.xsp?id=wdu20061370984 (accessed on 5 July 2023).
  37. Kalak, T. Efficient use of circulating fluidized bed combustion fly ash and slag generated as a result of sewage sludge incineration to remove cadmium ions. Des. Water Treat. 2022, 264, 72–90. [Google Scholar] [CrossRef]
  38. Largitte, L.; Pasquier, R. A review of the kinetics adsorption models and their application to the adsorption of lead by an activated carbon. Chem. Eng. Res. Des. 2016, 109, 495–504. [Google Scholar] [CrossRef]
  39. Wang, J.; Guo, X. Adsorption kinetic models: Physical meanings, applications, and solving methods. J. Hazar. Mater. 2020, 390, 122156. [Google Scholar] [CrossRef]
  40. Kostura, B.; Dvorsky, R.; Kukutschová, J.; Študentová, S.; Bednář, J.; Mančík, P. Preparation of sorbent with a high active sorption surface based on blast furnace slag for phosphate removal from wastewater. Environ. Prot. Eng. 2017, 43, 161–168. [Google Scholar] [CrossRef]
  41. Lagrani, S.; Aziz, A.; Bellil, A.; Felaous, K.; Achab, M.; Fekhaoui, M. Synthesis and Characterization of Slag-Sludge-Based Eco-Friendly Materials—Industrial Implications. J. Ecol. Eng. 2023, 24, 227–238. [Google Scholar] [CrossRef]
  42. Kavaliauskas, Z.; Valincius, V.; Stravinskas, G.; Milieska, M.; Striugas, N. The investigation of solid slag obtained by neutralization of sewage sludge. J. Air Waste Manag. Assoc. 2015, 65, 1292–1296. [Google Scholar] [CrossRef]
  43. Seifi, S.; Levacher, D.; Razakamanantsoa, A.; Sebaibi, N. Microstructure of Dry Mortars without Cement: Specific Surface Area, Pore Size and Volume Distribution Analysis. Appl. Sci. 2023, 13, 5616. [Google Scholar] [CrossRef]
  44. Liu, J.; Qiu, Q.; Xing, F.; Pan, D. Permeation Properties and Pore Structure of Surface Layer of Fly Ash Concrete. Materials 2014, 7, 4282–4296. [Google Scholar] [CrossRef] [PubMed] [Green Version]
  45. Li, W.; Zhou, S.; Wang, X.; Xu, Z.; Yuan, C.; Yu, Y.; Zhang, Q.; Wang, W. Integrated evaluation of aerosols from regional brown hazes over northern China in winter: Concentrations, sources, transformation, and mixing states. J. Geophys. Res. 2011, 116, 129642250. [Google Scholar] [CrossRef]
  46. Miranda, L.S.; Ayoko, G.A.; Egodawatta, P.; Goonetilleke, A. Adsorption-desorption behavior of heavy metals in aquatic environments: Influence of sediment, water and metal ionic properties. J. Hazard. Mater. 2022, 421, 126743. [Google Scholar] [CrossRef]
  47. Deng, M.; Wang, X.; Li, Y.; Fei, W.; Jiang, Z.; Yiyang, L.; Gu, Z.; Xia, S.; Zhao, J. Reduction and immobilization of Cr(VI) in aqueous solutions by blast furnace slag supported sulfidized nanoscale zerovalent iron. Sci. Total Environ. 2020, 743, 140722. [Google Scholar] [CrossRef] [PubMed]
  48. Abdelbasir, S.M.; Khalek, M.A.A. From waste to waste: Iron blast furnace slag for heavy metal ions removal from aqueous system. Environ. Sci. Pollut. Res. 2022, 29, 57964–57979. [Google Scholar] [CrossRef] [PubMed]
  49. Zhan, X.; Xiao, L.; Liang, B. Removal of Pb(II) from acid mine drainage with bentonite-steel slag composite particles. Sustainability 2019, 11, 4476. [Google Scholar] [CrossRef] [Green Version]
  50. Wang, Y.; Li, H.; Cui, S.; Wei, Q. Adsorption behavior of lead ions from wastewater on pristine and aminopropyl-modified blast furnace slag. Water 2021, 13, 2735. [Google Scholar] [CrossRef]
  51. Weyrich, J.N.; Mason, J.R.; Bazilevskaya, E.A.; Yang, H. Understanding the Mechanism for Adsorption of Pb(II) Ions by Cu-BTC Metal–Organic Frameworks. Molecules 2023, 28, 5443. [Google Scholar] [CrossRef]
  52. Mînzatu, V.; Davidescu, C.-M.; Negrea, P.; Ciopec, M.; Muntean, C.; Hulka, I.; Paul, C.; Negrea, A.; Duteanu, N. Synthesis, Characterization and Adsorptive Performances of a Composite Material Based on Carbon and Iron Oxide Particles. Int. J. Mol. Sci. 2019, 20, 1609. [Google Scholar] [CrossRef] [Green Version]
  53. Langeroodi, N.S.; Farhadravesh, Z.; Khalaji, A.D. Optimization of adsorption parameters for Fe(III) ions removal from aqueous solutions by transition metal oxide nanocomposite. Green Chem. Lett. Rev. 2018, 11, 404–413. [Google Scholar] [CrossRef] [Green Version]
  54. Chouchane, T.; Chibani, S.; Khiriddine, O.; Boukari, A. Adsorption Study of Pb(II) Ions on the Blast Furnace Slag (BFS) from Aqueous Solution. Iran. J. Mater. Sci. Eng. 2023, 20, 149–161. [Google Scholar]
  55. Jiang, M.-q.; Jin, X.-y.; Lu, X.Q.; Chen, Z.-l. Adsorption of Pb(II), Cd(II), Ni(II) and Cu(II) onto natural kaolinite clay. Desalination 2010, 252, 33–39. [Google Scholar] [CrossRef]
  56. Covelo, E.F.; Vega, F.A.; Andrade, M.L. Simultaneous sorption and desorption of Cd, Cr, Cu, Ni, Pb, and Zn in acid soils: I. Selectivity sequences. J. Hazard. Mater. 2007, 147, 852–861. [Google Scholar] [CrossRef] [PubMed]
  57. Magdy, Y.H.; Altaher, H. Kinetic analysis of the adsorption of dyes from high strength wastewater on cement kiln dust. J. Environ. Chem. Eng. 2018, 6, 834–841. [Google Scholar] [CrossRef]
  58. Wang, W.; Maimaiti, A.; Shi, H.; Wu, R.; Wang, R.; Li, Z.; Qi, Q.; Yu, G.; Deng, S. Adsorption behawior and mechanism of emerging perfluoro-2-propoxypropanoic acid (GenX) on activated carbons and resins. Chem. Eng. J. 2019, 364, 132–138. [Google Scholar] [CrossRef]
  59. Ho, Y.S.; McKay, G. The kinetics of sorption of basic dyes from aqueous solution by sphagnum moss peat. Can. J. Chem. Eng. 1998, 76, 822–827. [Google Scholar] [CrossRef]
  60. Hameed, B.H.; El-Khaiary, M.I. Malachite green adsorption by rattan sawdust: Isotherm, kinetic and mechanism modeling. J. Hazad. Mater. 2008, 159, 574–579. [Google Scholar] [CrossRef]
  61. Doke, K.M.; Khan, E.M. Equilibrium, kinetic and diffusion mechanism of Cr(VI) adsorption onto activated carbon derived from wood apple shell. Arab. J. Chem. 2017, 10, 252–260. [Google Scholar] [CrossRef] [Green Version]
  62. Hamdaoui, O. Batch study of liquid-phase adsorption of methylene blue using cedar sawdust and crushed brick. J. Hazard. Mater. 2006, 135, 264–273. [Google Scholar] [CrossRef] [PubMed]
Figure 1. General scheme of wastewater and sewage sludge treatment methods in the European Union [18].
Energies 16 05688 g001
Figure 2. The global sludge treatment equipment market from 2011 to 2022 (data from [29,30]).
Energies 16 05688 g002
Figure 3. Energy production from sewage sludge gas in the European Union 2013–2021 (data from [31]).
Energies 16 05688 g003
Figure 4. Schematic diagram of the sewage sludge utilization and fly ash and slag formation as by-products of CFBC Technology (data from [37]).
Energies 16 05688 g004
Figure 5. X-ray diffraction pattern of slag sample.
Energies 16 05688 g005
Figure 6. The low temperature BET adsorption and desorption isotherms (A) and the linear BET isotherm (B) of CFBC slag.
Energies 16 05688 g006
Figure 7. The BJH adsorption (A) and desorption (B) isotherm of CFBC slag.
Energies 16 05688 g007
Figure 8. SEM photograph of CFBC-S (magn.: ×20,000, scale bar: 2 μm).
Energies 16 05688 g008
Figure 9. TEM photographs of CFBC-S (scale bar: 200 nm (A); 500 nm (B)).
Energies 16 05688 g009
Figure 10. FT-IR plot of slag before and after Cu(II) ions adsorption.
Energies 16 05688 g010
Figure 11. The impact of initial pH on sorption efficiency.
Energies 16 05688 g011
Figure 12. The impact of initial pH on sorption capacity of Cu(II).
Energies 16 05688 g012
Figure 13. Schematic diagram of Cu2+ ions adsorption process by CFBC-S.
Energies 16 05688 g013
Figure 14. The impact of slag dosage on sorption efficiency.
Energies 16 05688 g014
Figure 15. The effect of initial concentration of Cu(II) ions on sorption efficiency and adsorbent concentration.
Energies 16 05688 g015
Figure 16. The effect of contact time on sorption efficiency and adsorbent concentration.
Energies 16 05688 g016
Figure 17. Pseudo-first-order adsorption isotherms (CFBC-S dosage 3–5 g/L).
Energies 16 05688 g017
Figure 18. Pseudo-second-order adsorption isotherms (CFBC-S dosage 3–5 g/L).
Energies 16 05688 g018
Figure 19. Weber and Morris intraparticle diffusion model (CFBC-S dosage 3–5 g/L).
Energies 16 05688 g019
Figure 20. Langmuir model adsorption isotherms (CFBC-S dosage 2–5 g/L).
Energies 16 05688 g020
Figure 21. Freundlich model adsorption isotherms (CFBC-S dosage 2–5 g/L).
Energies 16 05688 g021
Table 1. Properties and chemical composition of primary and secondary sludge (data from [22,26]).
Composition/PropertiesUntreated Primary SludgeSecondary Activated Sludge
Total solids TS [%]4–90.6–1.2
Phosphorus (P2O5 [%] of TS)0.6–2.93–10
Nitrogen ([%] of TS)1.4–4.22.5–5.0
Cellulose ([%] of TS)8–16
pH5.5–8.06.6–8.0
Ether soluble5–30
Protein ([%] of TS)18–3030–40
Volatile solids ([%] of TS)65–8060–85
Organic acids (mg/L as HAc)250–1800>1000
Alkalinity (mg/L as CaCO3)600–1500550–1200
Energy content [kJ/kg] of TS24,000–28,00018,000–23,000
Table 2. Parameters of sewage sludge and a comparison with other energy sources (data from [27]).
ParameterSewage SludgeWaste Carbon SludgeHard CoalBrown CoalWood Waste
Calorific value [MJ/kg]18–21.58–1625–308–1613
Ash [%]3030–605.310–200.8
Carbon [%]5031886650.7
Hydrogen [%]63.7655.9
Sulphur [%]1.01–1.50.80.7–70.04
Table 3. Sewage sludge production and disposal from urban wastewater (in dry substance) in European countries in 2020 [28].
CountryTotal Sludge Production [Thousand Tons]Total Sludge Disposal [Thousand Tons]Sludge Disposal—Agriculture Use [Thousand Tons]Sludge Disposal—Compost and Other Applications [Thousand Tons]Sludge Disposal—Landfill [Thousand Tons]Sludge Disposal—Incineration [Thousand Tons]Sludge Disposal—Other [Thousand Tons]
Belgium165.96155.735.9500116.842.92
Bulgaria~44~42~26~3~20~2.9
Czech Republic219.11219.1184.8192.7817.6123.91
Denmark
Germany~1750~1740~290~1500~1295~13
Estonia18.9918.0510.385.652.03
Ireland58.4558.4551.796.50.0700.08
Greece~103.28~103.28~10.19~36.8337.71~18.56
Spain~1210~1240~1100~90~70
France~1200~810~300~350~13~150~30
Croatia22.515.920.480.820.710.813.1
Italy
Cyprus~8~9~1~50~0.27~2.3
Latvia23.1522.516.464.660.7303.6
Lithuania41.0544.3712.2915.21.6514.430.8
Luxembourg9.479.471.981.4403.172.88
Hungary~230~220~44~160~1.3~12.20
Malta10.3610.360010.3600
Netherlands353.85308.36001.48294.7612.12
Austria228.01228.0148.3643.720.31118.8616.77
Poland568.86568.86137.7729.466.9598.58296.1
Portugal~14
Romania254.22254.2254.125.03140.692.1552.22
Slovenia313100.40.611.218.8
Slovakia55.5255.52026.47.0311.9310.16
Finland~160~160~64~90~1.8~0.7~0.12
Sweden~210~200~100~552.3~2.8~57
Iceland
Liechtenstein
Norway157.15125.3268.7436.6311.990.017.95
Switzerland~180~1770
United Kingdom
Montenegro
North Macedonia
Albania97.197.13.7893.32
Serbia105.55.5
Turkey314.33285.423.510129.2483.9468.74
Bosnia and Herzegovina~9.5~9.500~9.500
“—“ no data available, “~” estimated data.
Table 4. Pollutant concentrations in treated wastewater discharged from the treatment plant in 2022 (data from [35]).
Pollutant IndicatorConcentration of Pollutants in Raw WastewaterConcentration of Pollutants in Treated WastewaterDegree of Pollution Reduction in the Sewage Treatment Plant [%]Permissible Concentration of Pollutants [36]
Five-day biochemical oxygen demand (BOD5) [mg O2/L]550.44.9799.115.0
Chemical oxygen demand [mg O2/L]1220.236.9697.0125.0
General suspensions [mg/L]677.57.9698.835.0
Total nitrogen [mg/L]95.68.3691.310.0
Total phosphorus [mg/L]12.20.4596.31.0
Table 5. Kinetic parameters of pseudo-first-order and pseudo-second-order models.
AdsorbentAdsorbent Dosage [g/L]PFO Kinetic ModelPSO Kinetic Model
kad
[min−1]
qe
[mg/g]
R2k
[g/mg min]
qe
[mg/g]
R2
CFBC-S30.1349.4490.9710.00824.1100.999
40.13010.2230.9340.01022.3320.999
50.1187.2290.9580.01219.7110.999
Table 6. Diffusion parameters for the Weber and Morris intraparticle model for Cu(II) adsorption.
AdsorbentAdsorbent Dosage [g/L]Intraparticle Diffusion Model Parameters
Kid
[mg/g/min0.5]
C
[mg/g]
R2
CFBC-S30.40215.2930.999
40.38313.8280.999
50.32512.6030.999
Table 7. Parameters of Langmuir and Freundlich isotherm models.
AdsorbentAdsorbent Dosage [g/L]Langmuir IsothermFreundlich Isotherm
Calculated qm [mg/g]KL [L/mg]R2Kf
[mg/g] [L/mg](1/n)
nR2
CFBC-S253.040.0490.8241.3150.9860.933
356.050.0370.8881.2130.9380.938
460.920.0310.9101.1710.9060.940
570.340.0190.9291.0490.9640.950
Disclaimer/Publisher’s Note: The statements, opinions and data contained in all publications are solely those of the individual author(s) and contributor(s) and not of MDPI and/or the editor(s). MDPI and/or the editor(s) disclaim responsibility for any injury to people or property resulting from any ideas, methods, instructions or products referred to in the content.

