

Optimization of Circulating Fluidized Bed Boiler Combustion Key Control Parameters Based on Machine Learning
Abstract
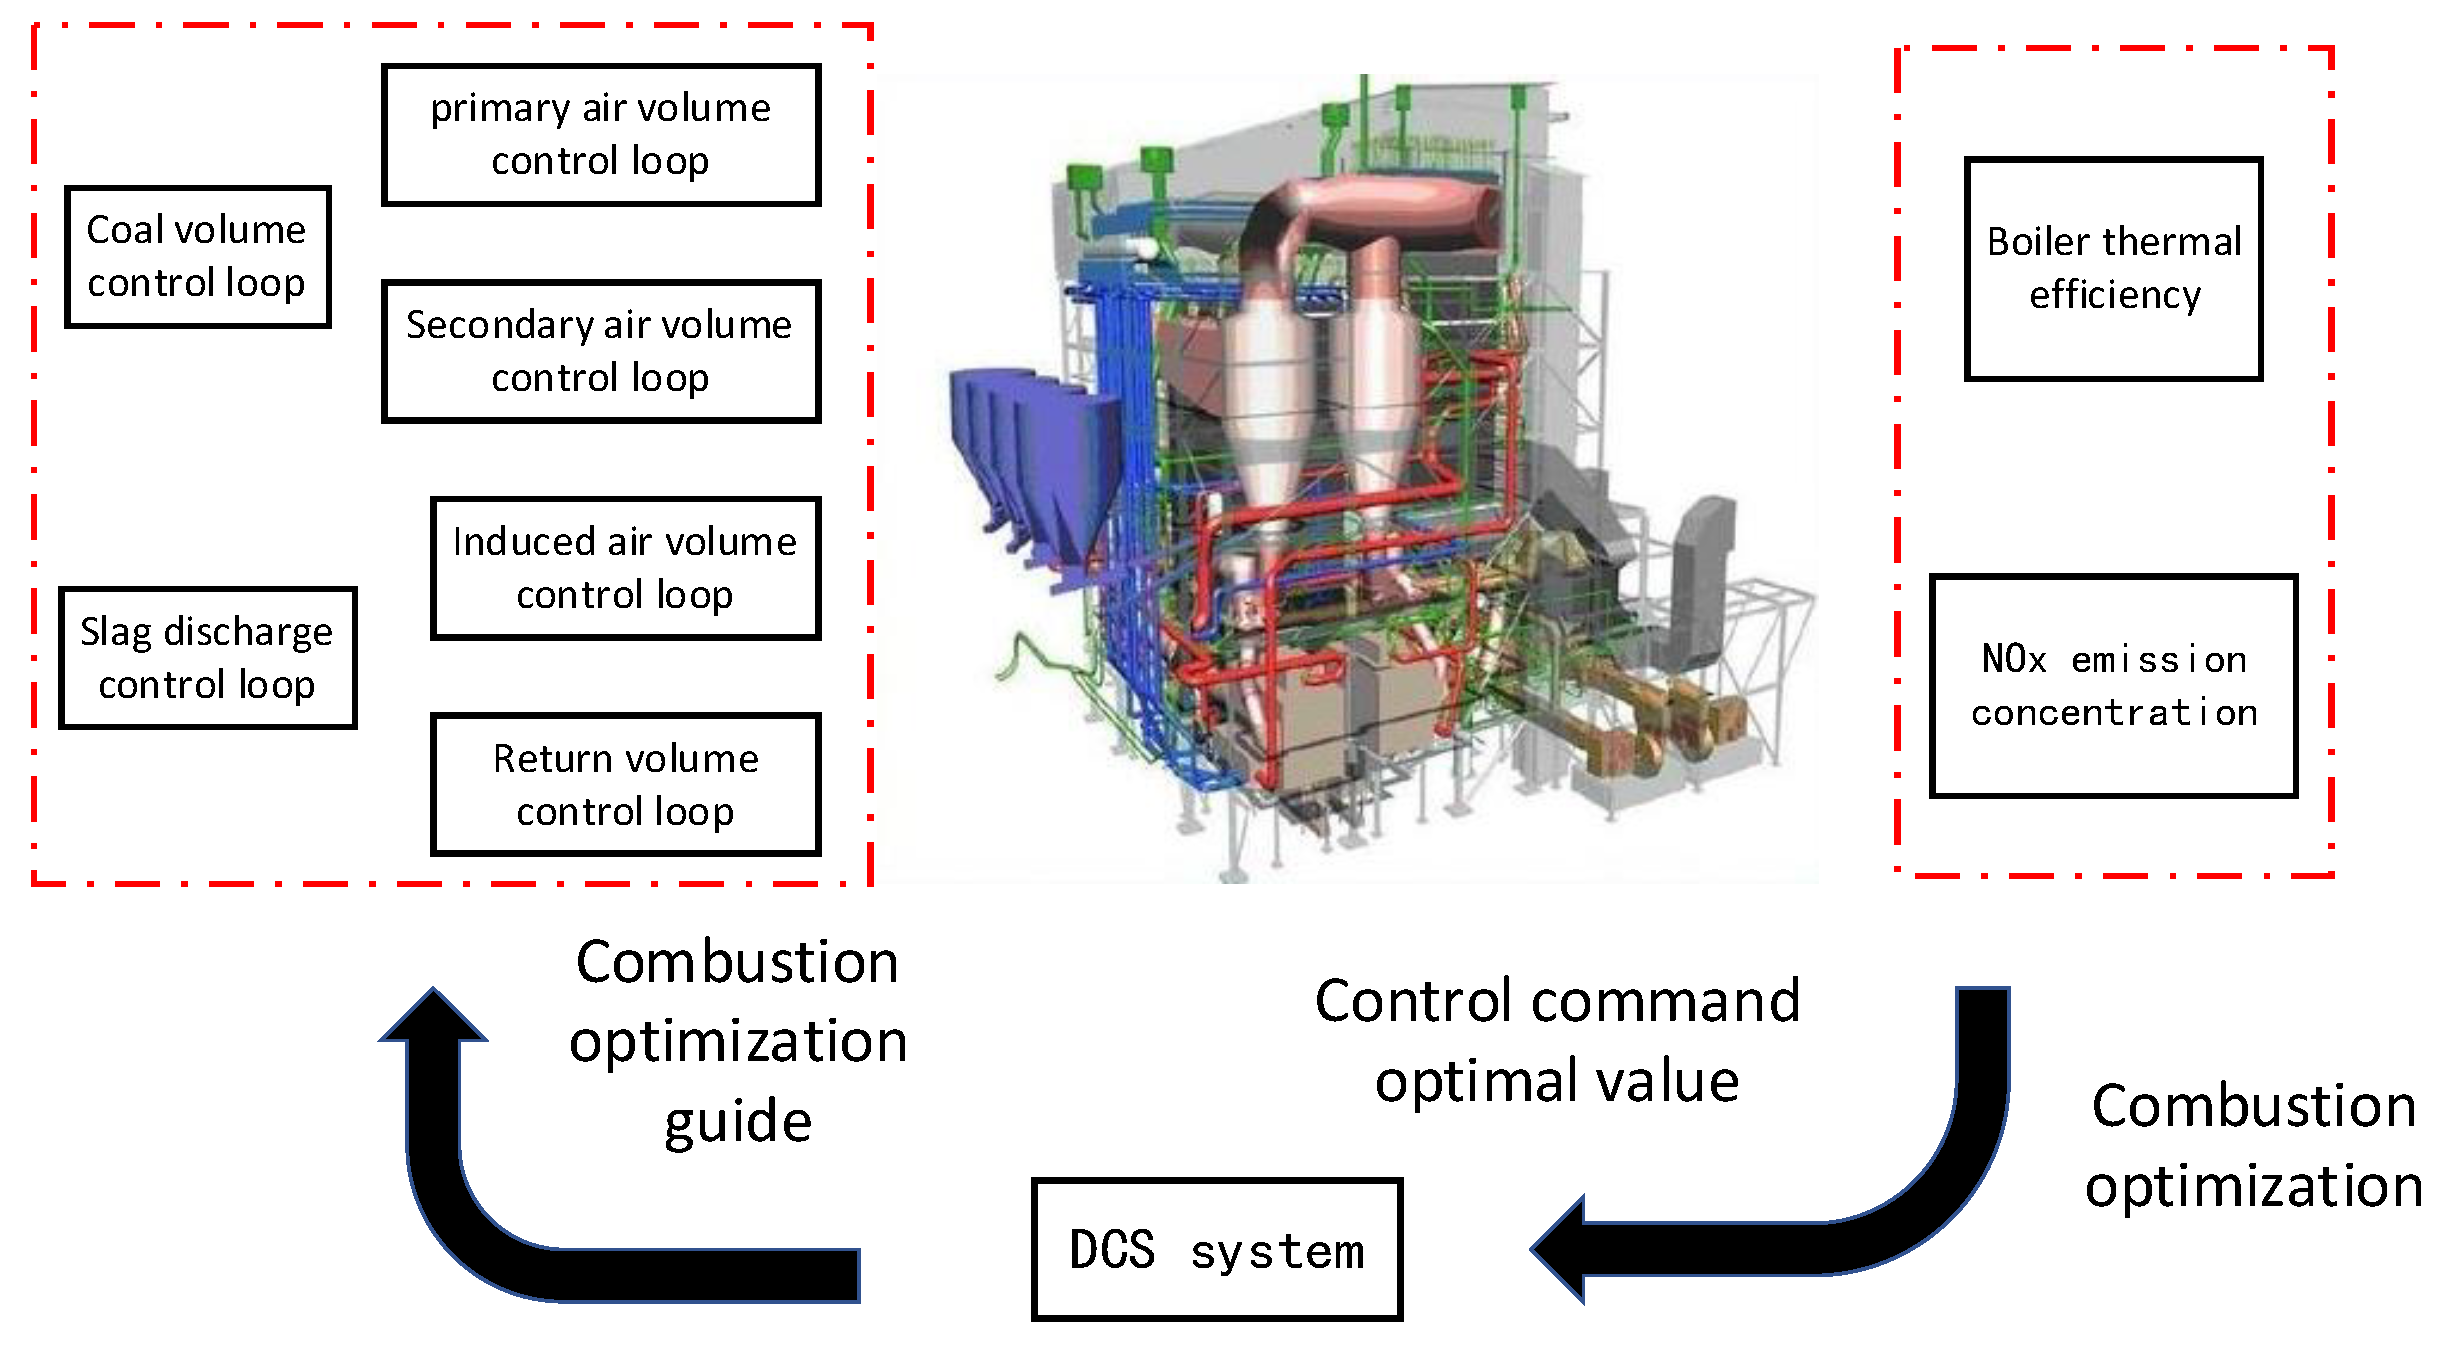
:1. Introduction
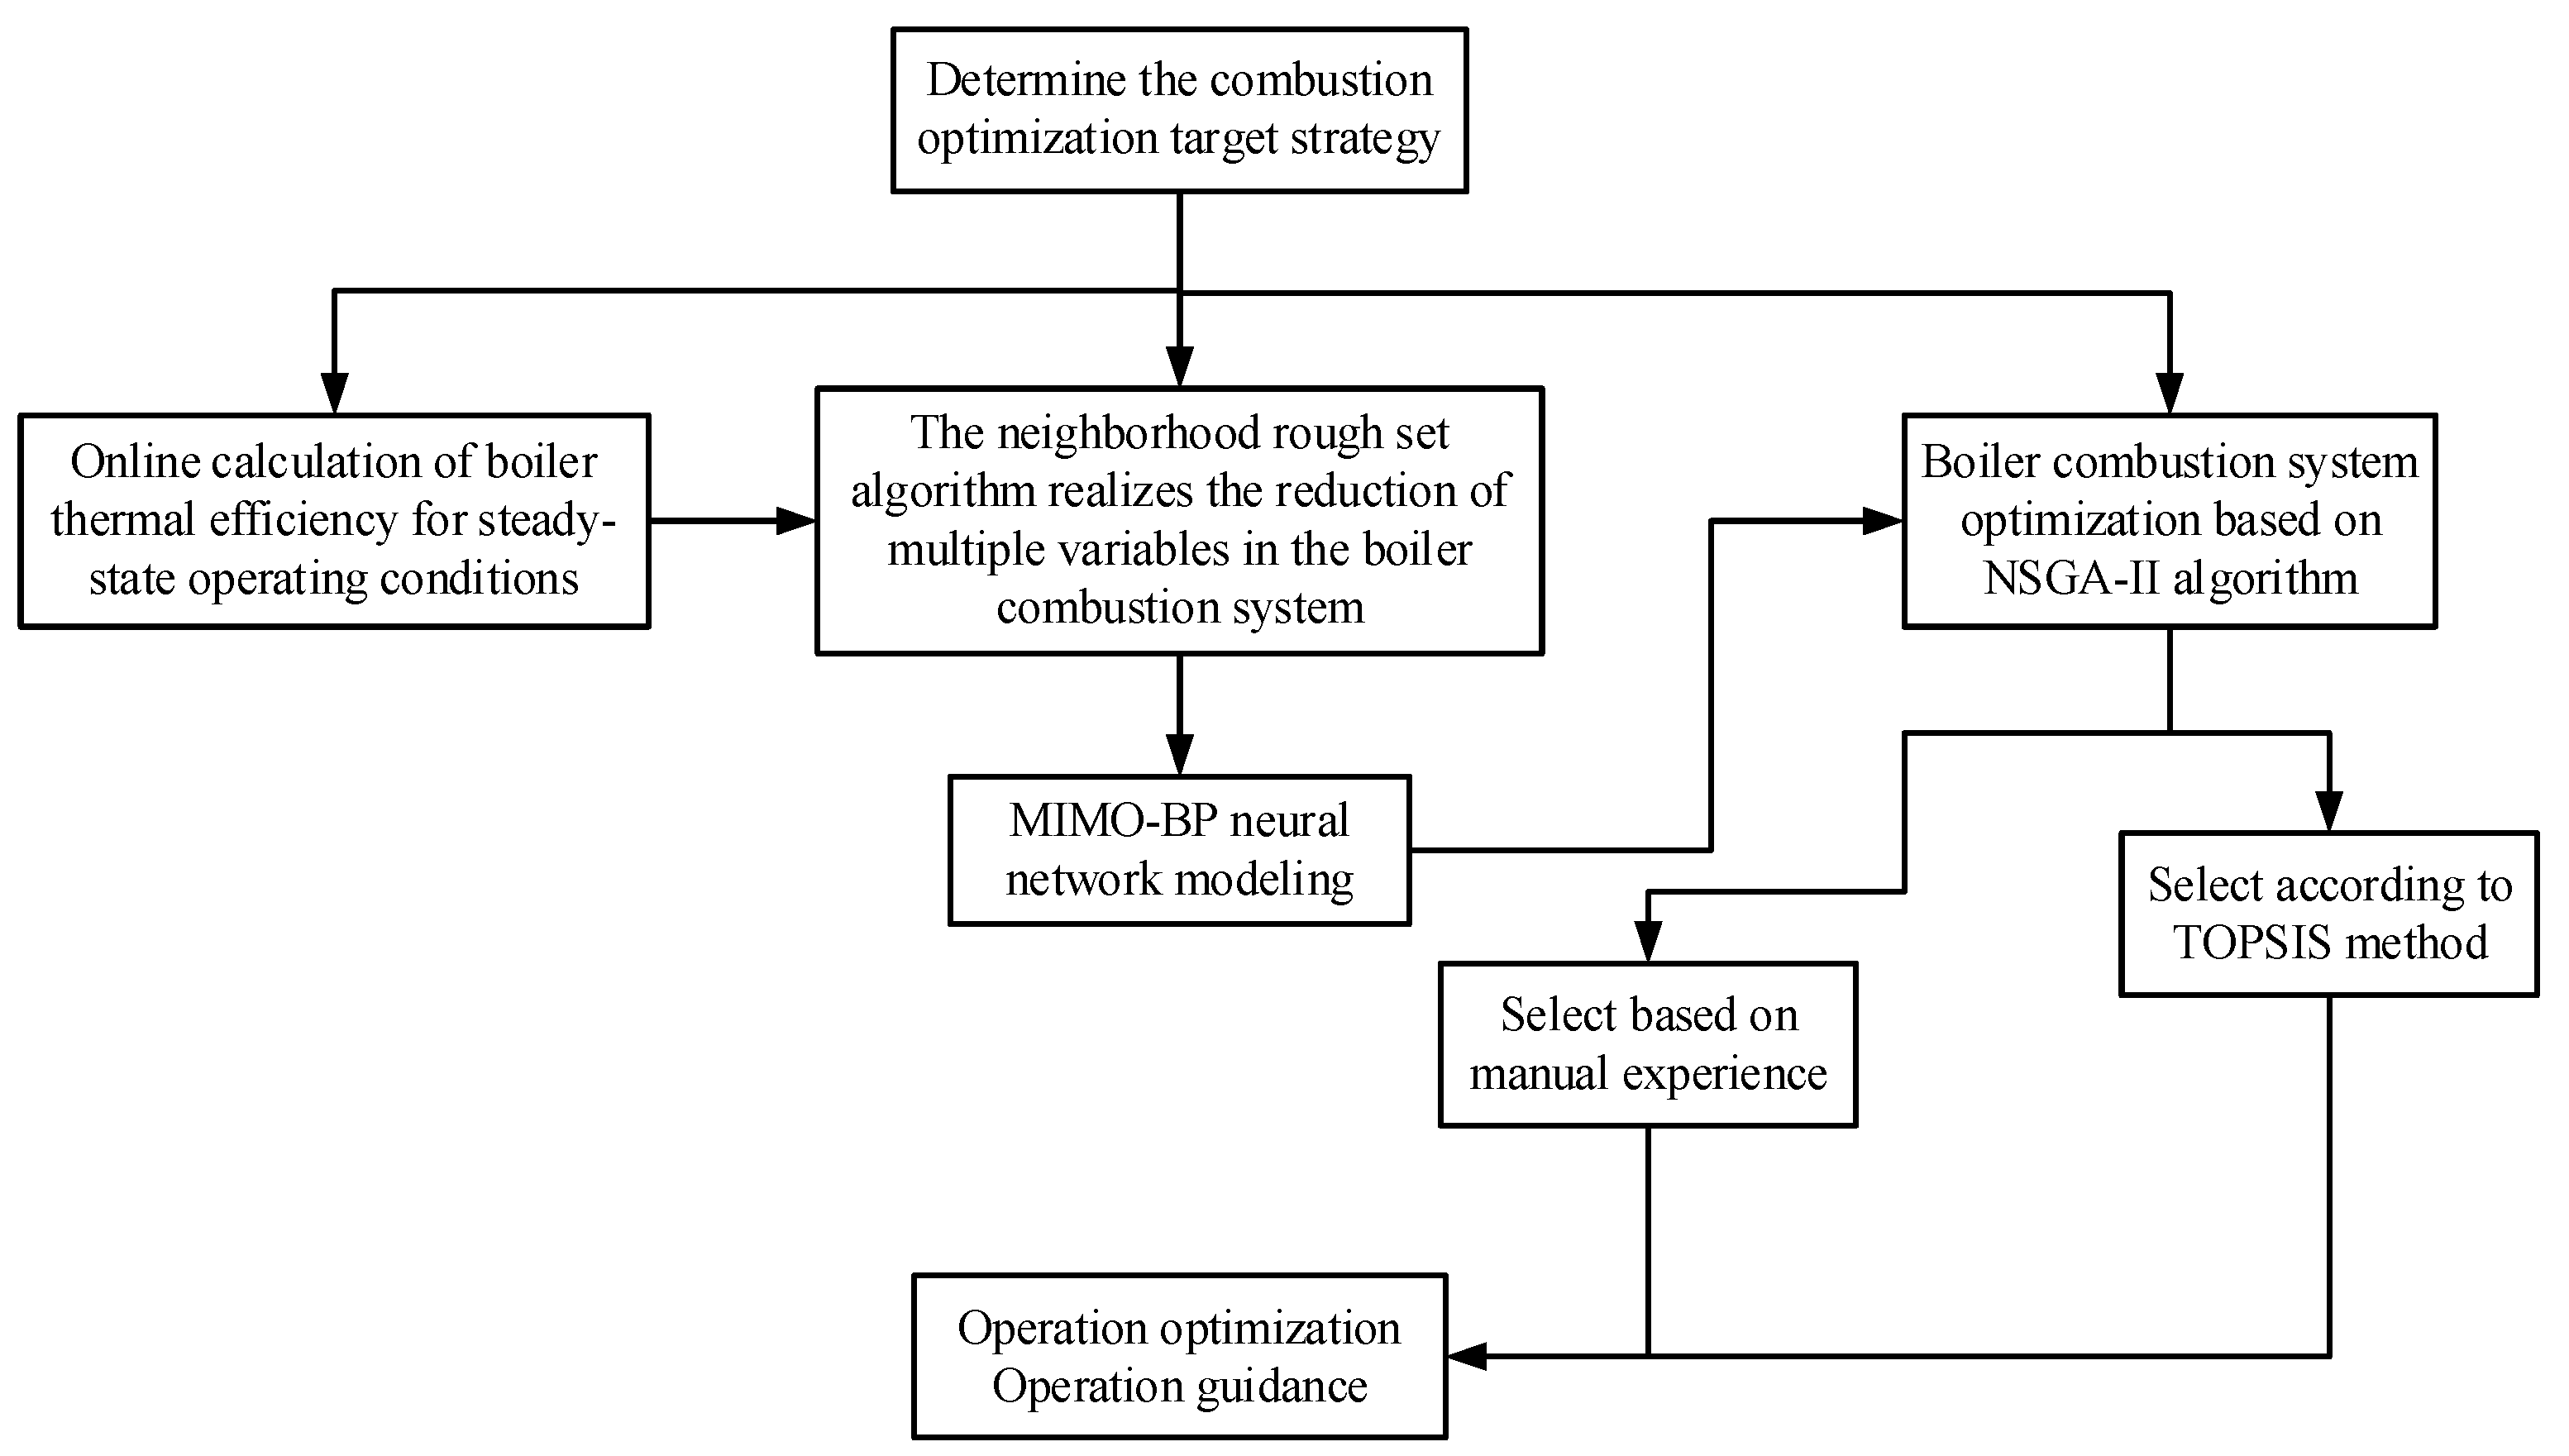
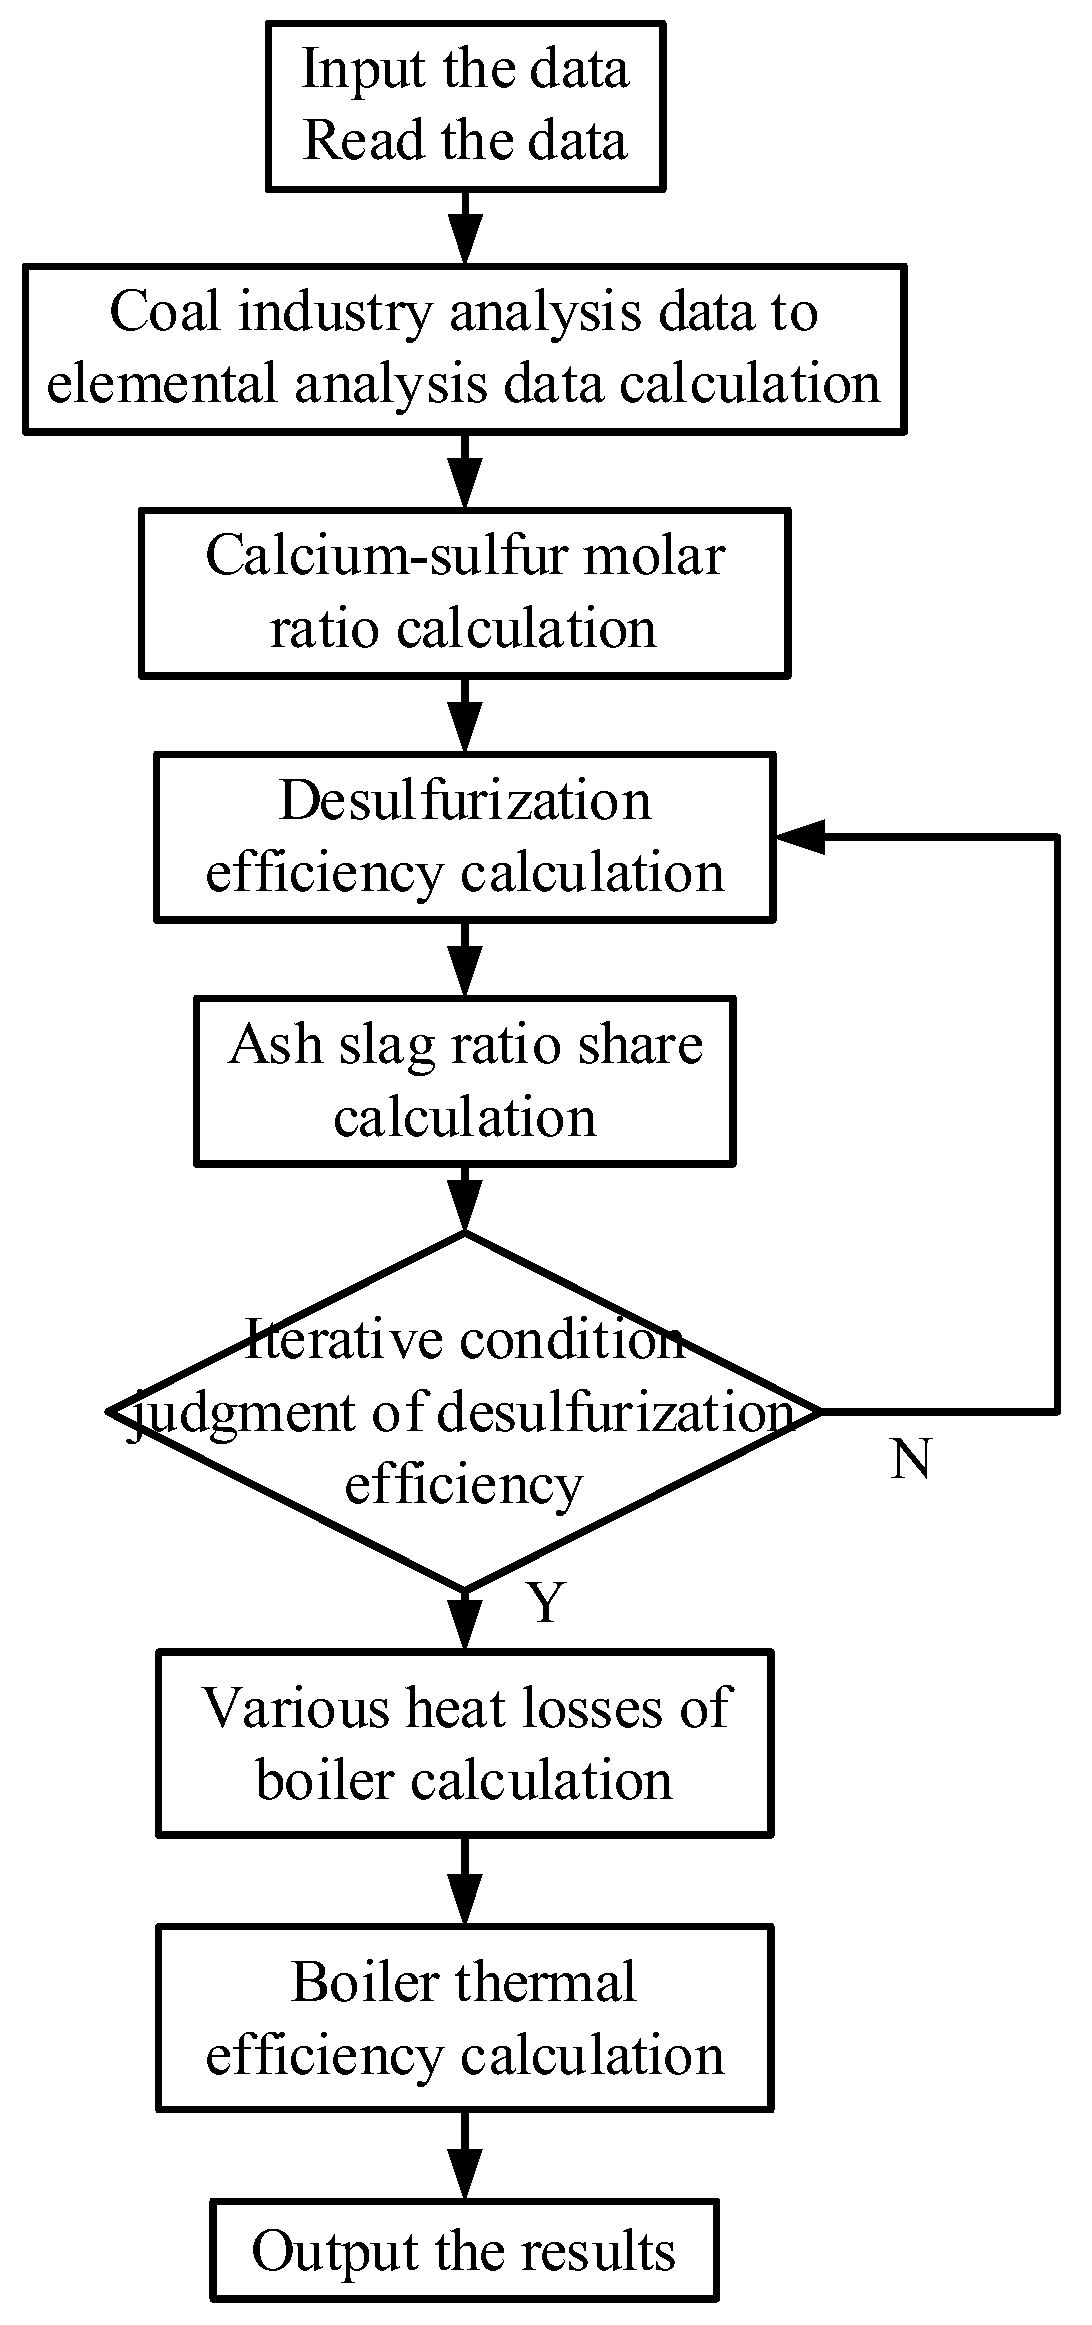
2. Methods
2.1. Based on Neighborhood Rough Set Attribute Reduction Algorithm
| Algorithm 1. Neighborhood Rough Set Attribute Reduction Algorithm. |
| Input: A complete collection of information table |
| Step 1 Normalize the information table entered; |
| Step 2 Calculate the neighborhood radius for each conditional attribute ; Step 3 Calculate the positive domain of the entire attribute relative to the decision attribute , let be ; Step 4 Take any one and calculate the importance of each attribute separately, namely ; Step 5 Select the attribute with the greatest importance of the reduction attribute, then there is ; Step 6 Compare the size of and , if , Then , return to Step 4; Output: A reduced collection of the information table |
2.2. Based on BP Neural Network Combustion Optimization Model
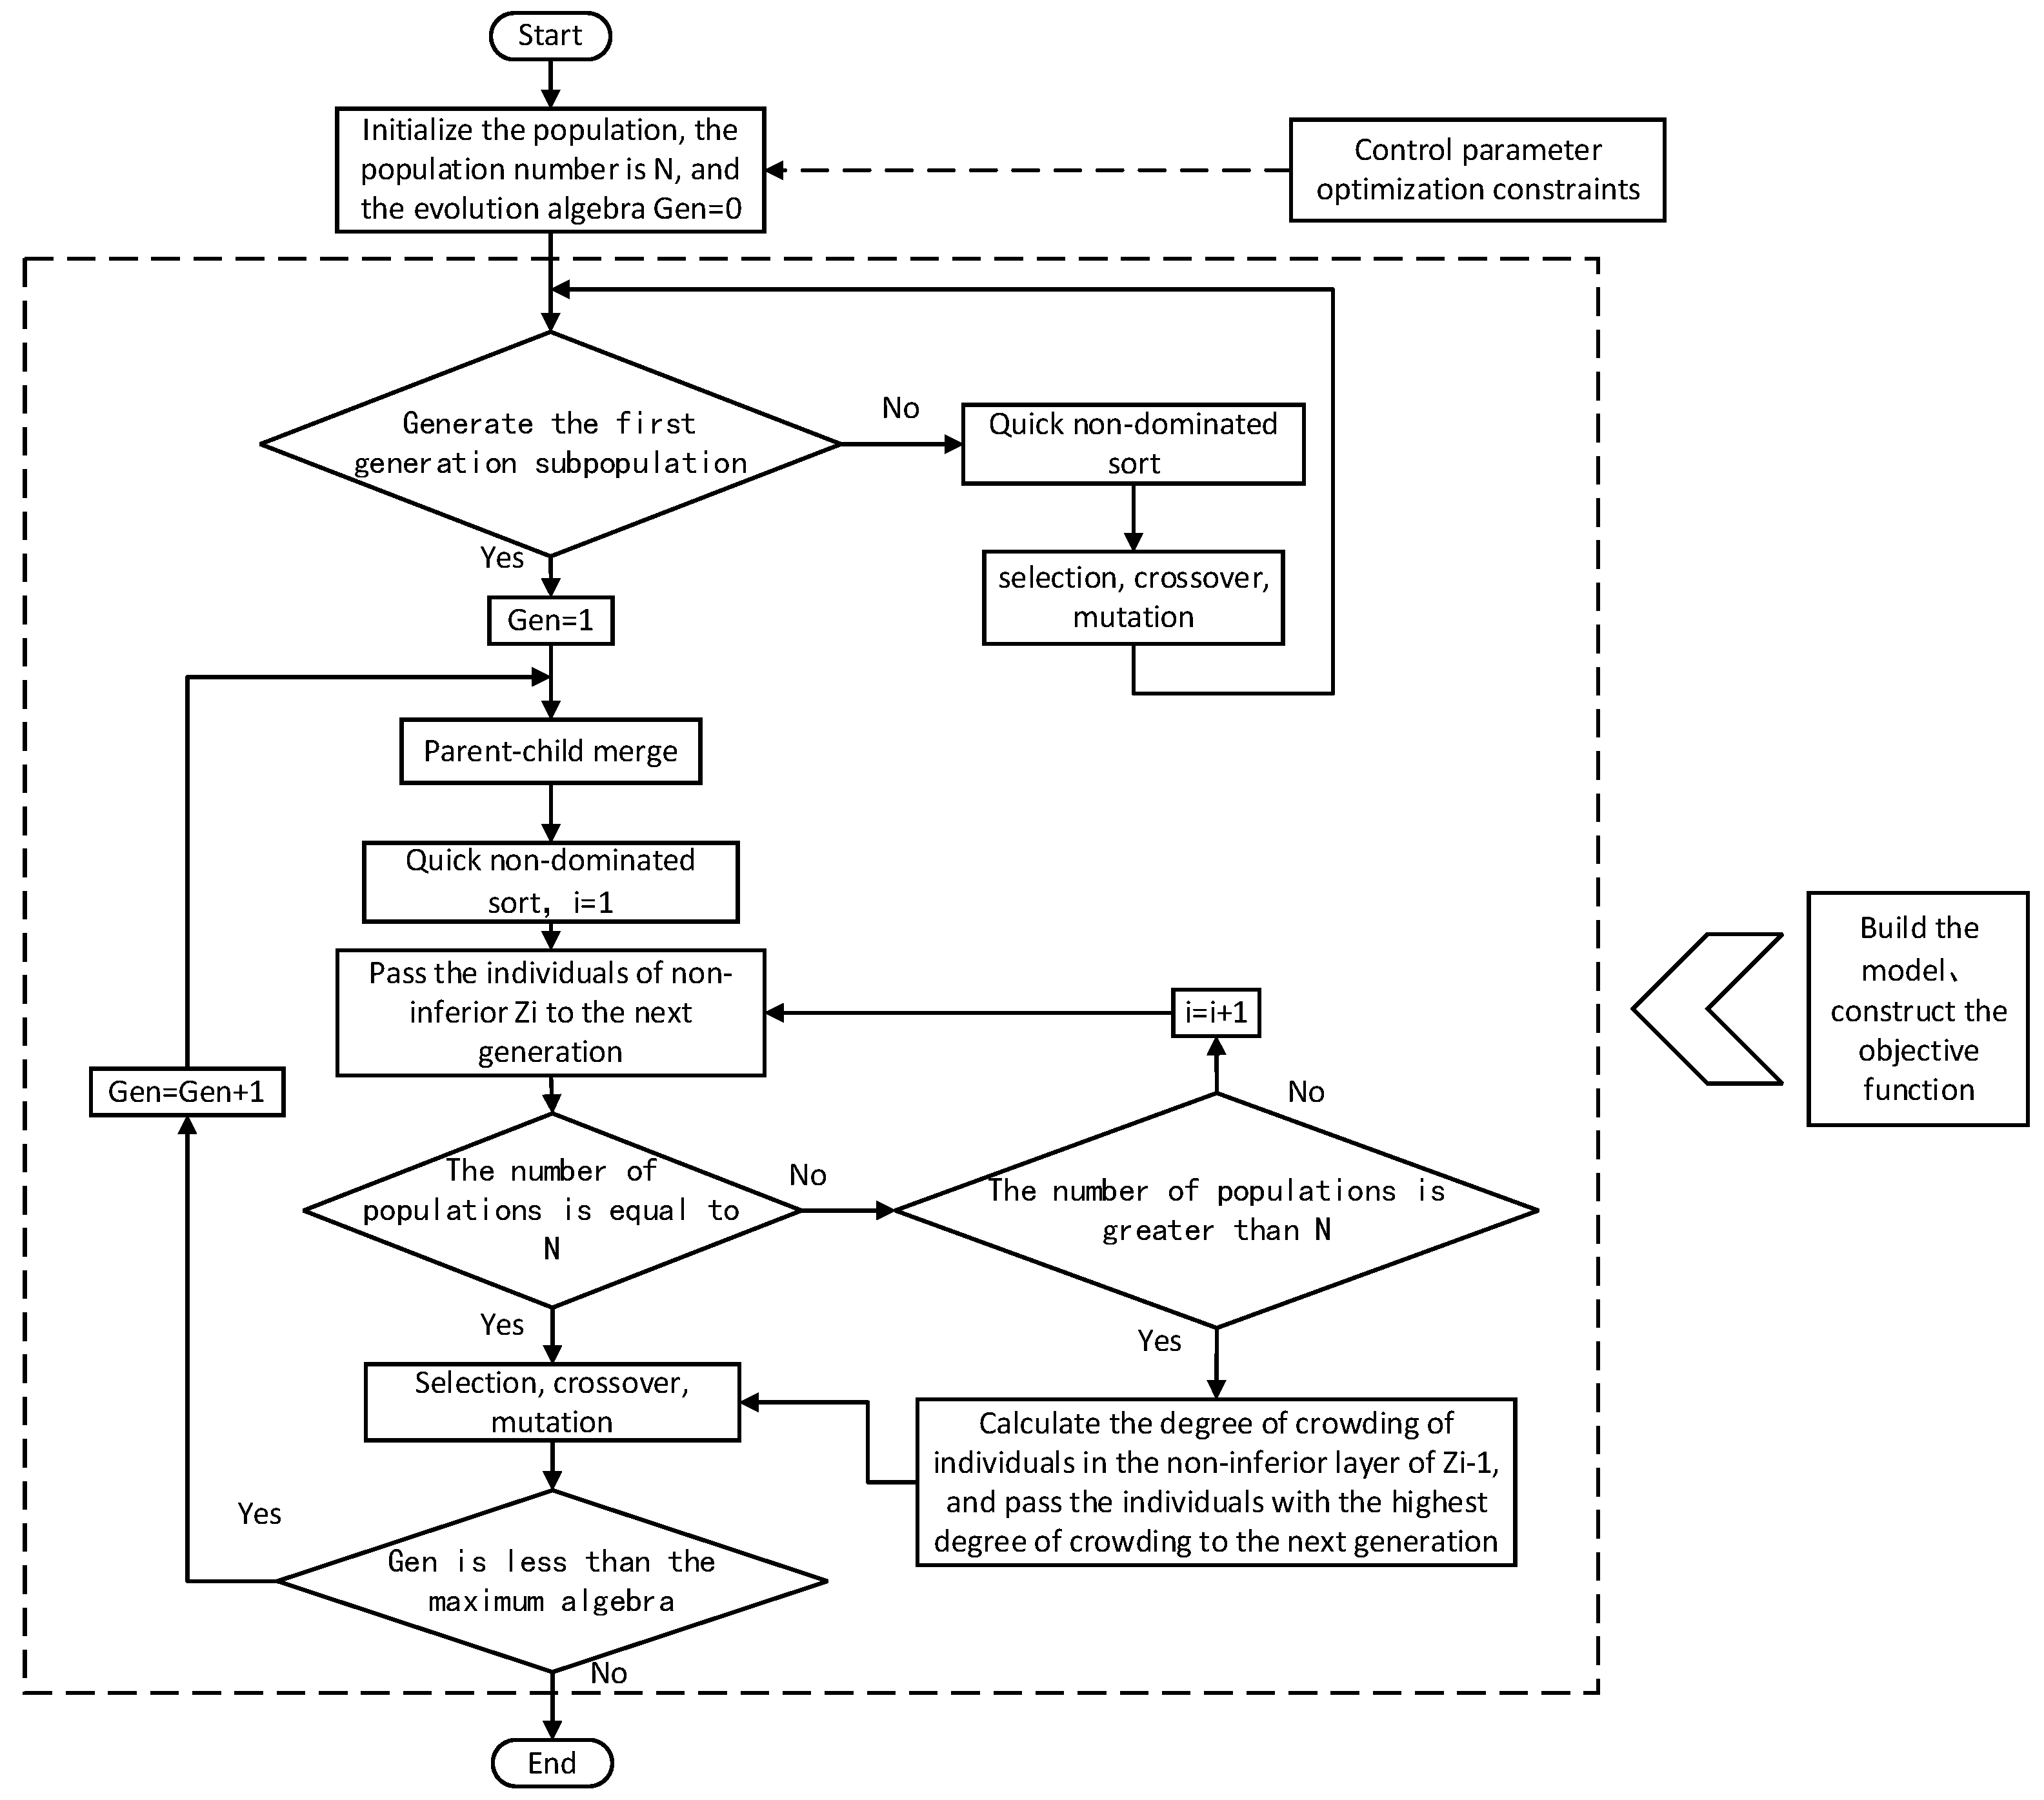
2.3. Based on NSGA-II Algorithm Multi-Objective Optimization Solution
- (1)
- Standardize processing to obtain the decision matrix .
- (2)
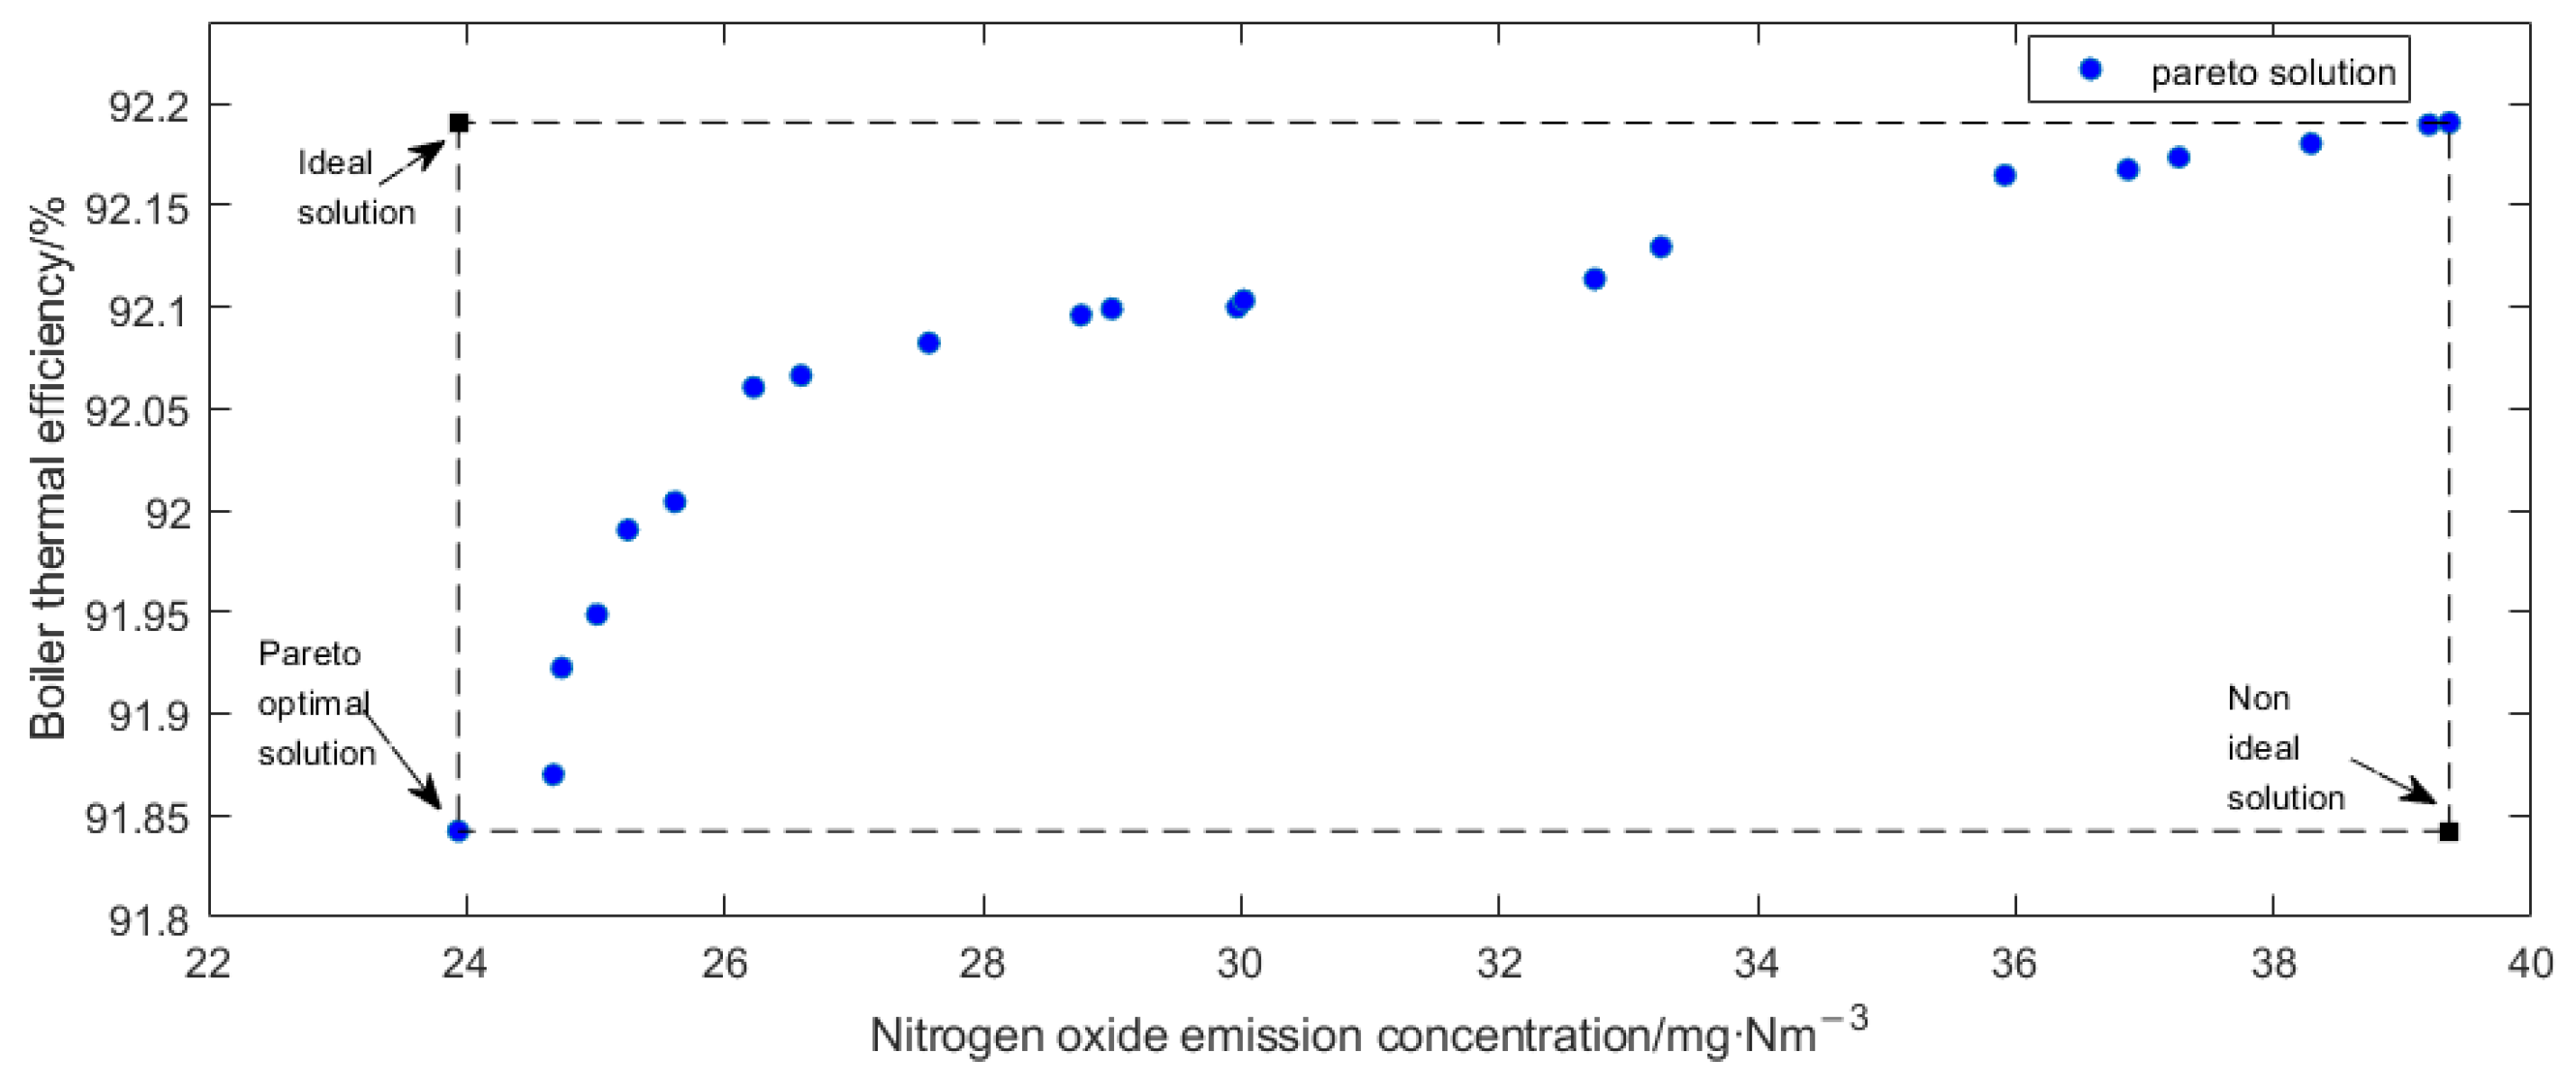
- Determine the positive ideal point and the negative ideal point .
- (3)
- Use the Euclidean distance method to calculate the distance between each non-inferior solution and the positive and negative ideal points.
- (4)
- Calculate the relative closeness of each non-inferior solution and then take the maximum value in the order of relative closeness from large to small as the optimal compromise solution.
3. Case and Study
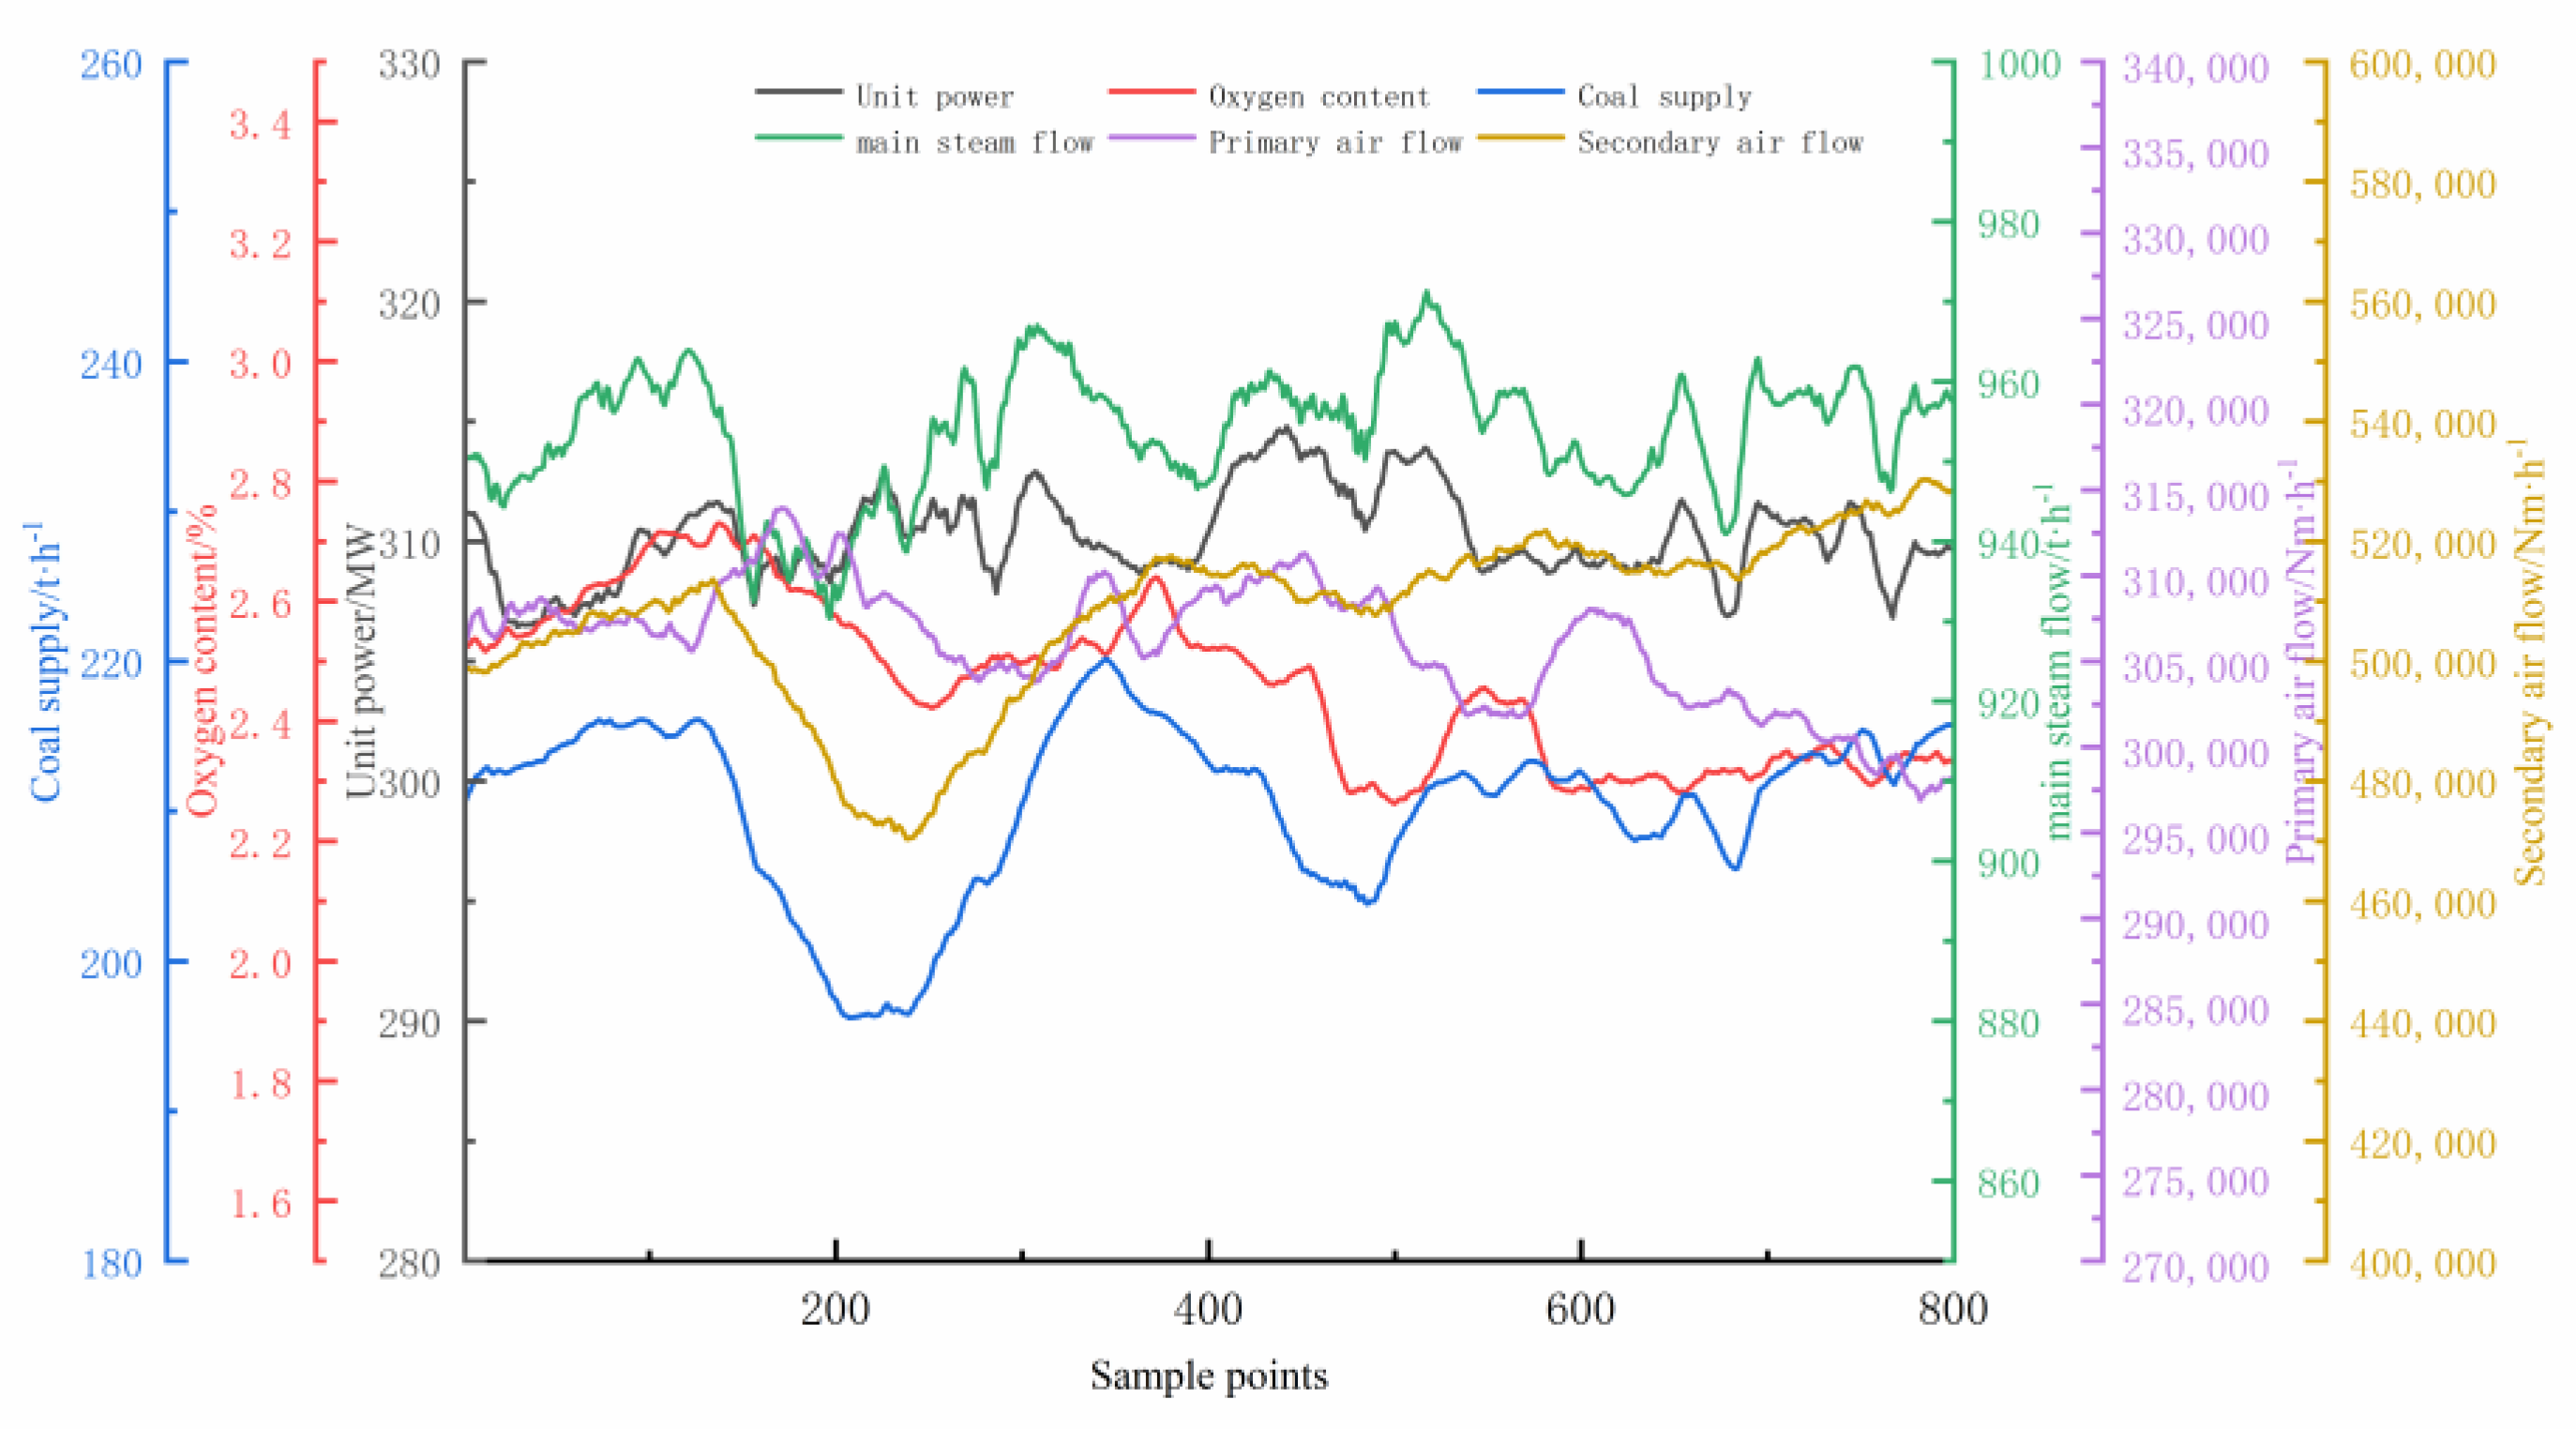
3.1. Variable Selection
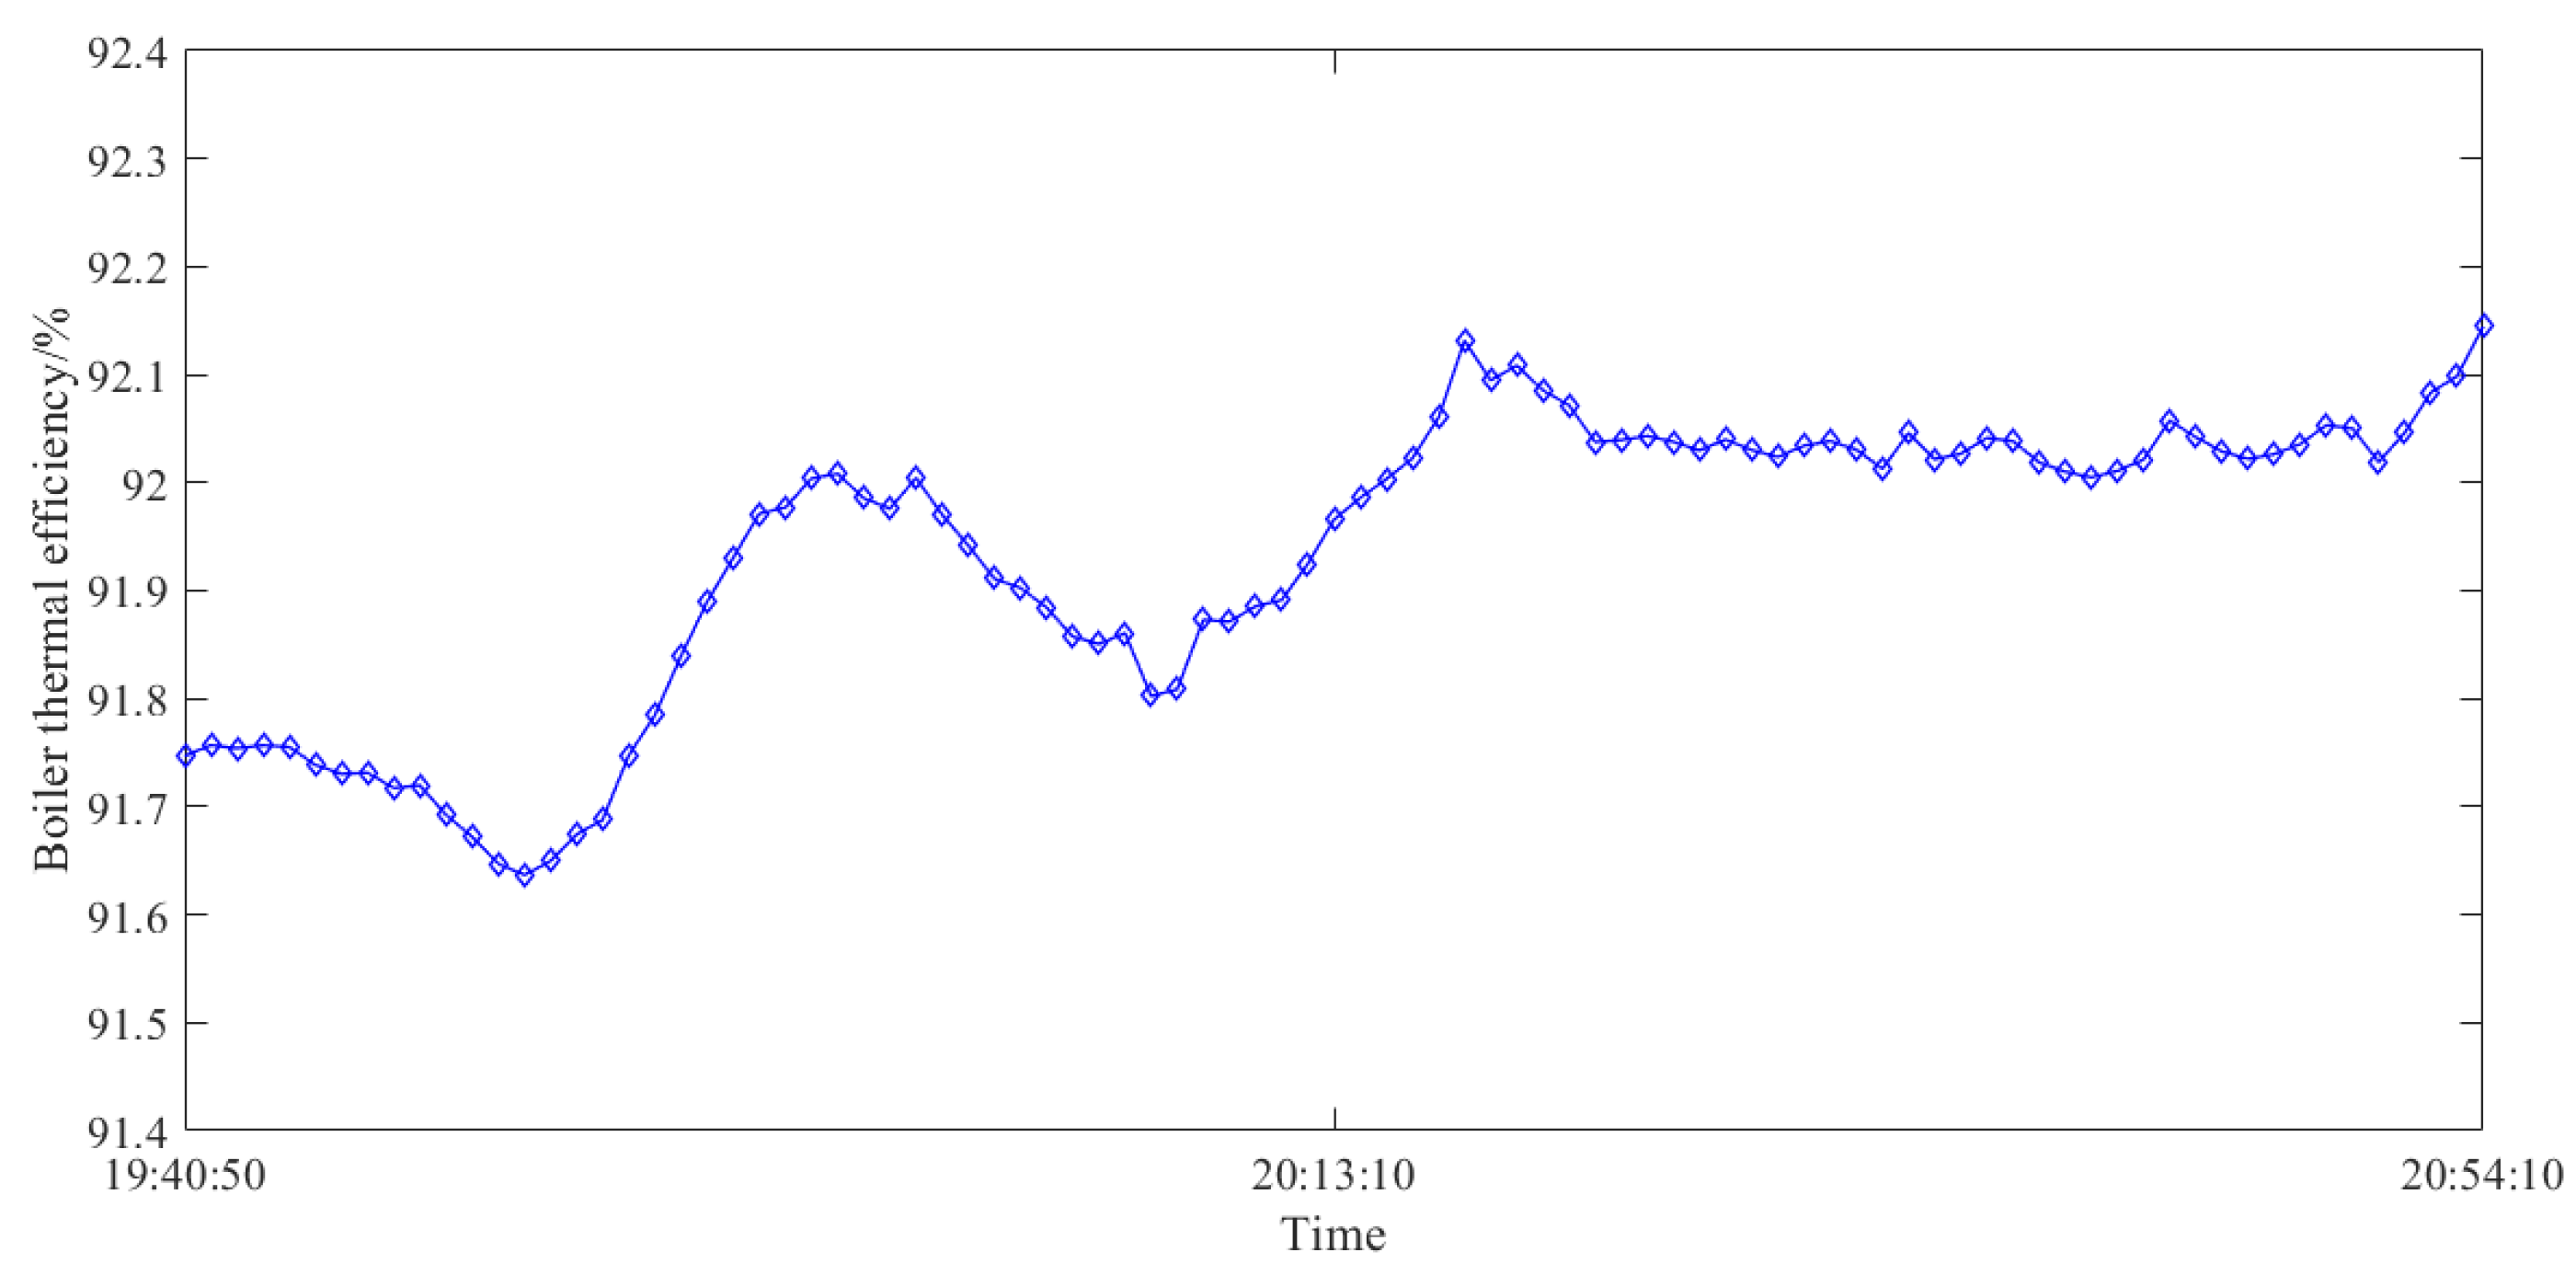
3.2. Optimization of High Load Combustion Regulation Instructions in the Unit
4. Discussion
4.1. Effect of Feature Selection on Prediction Results
4.2. Optimization of Medium and Medium-Low Load Combustion Regulation Instructions in the Unit
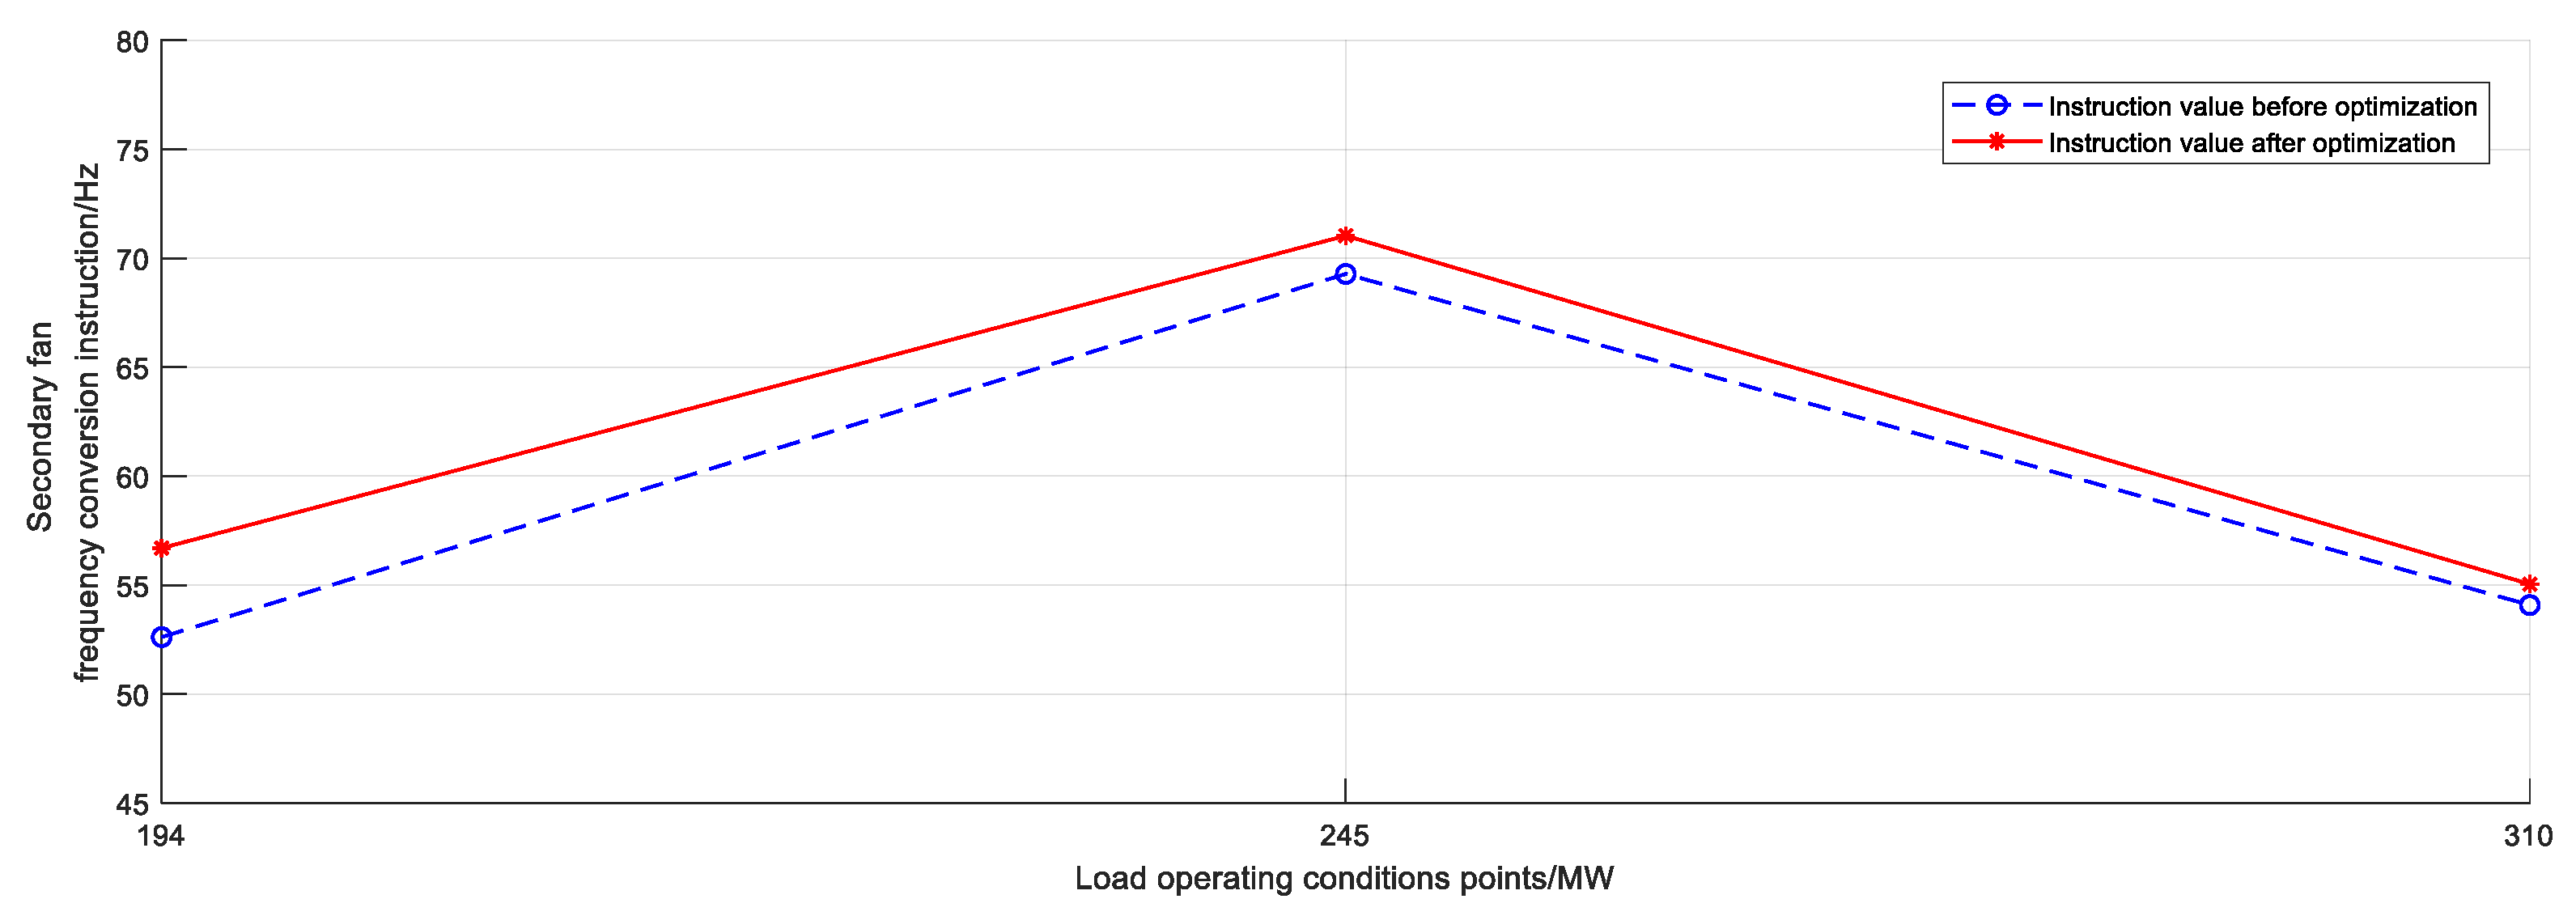
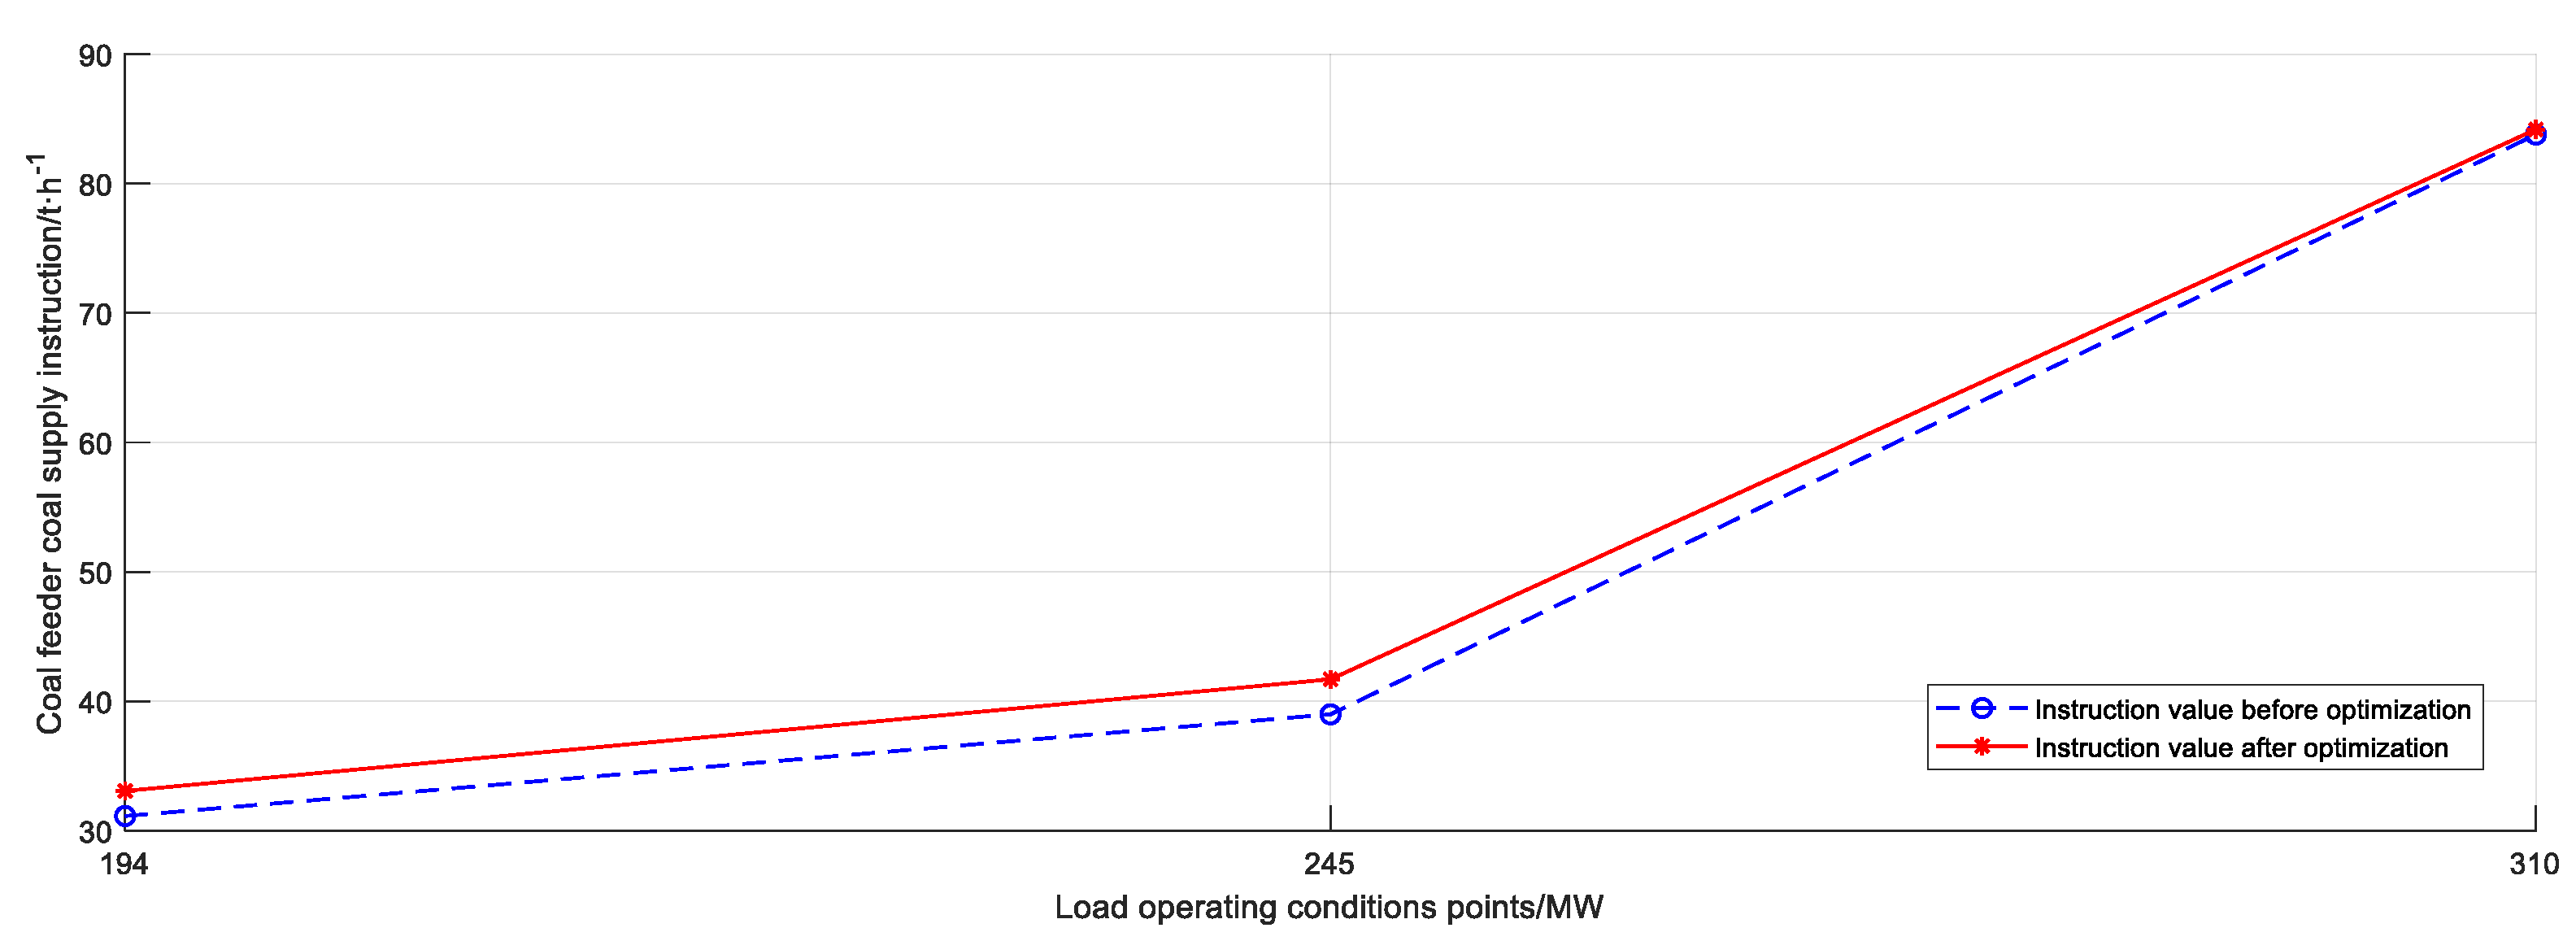
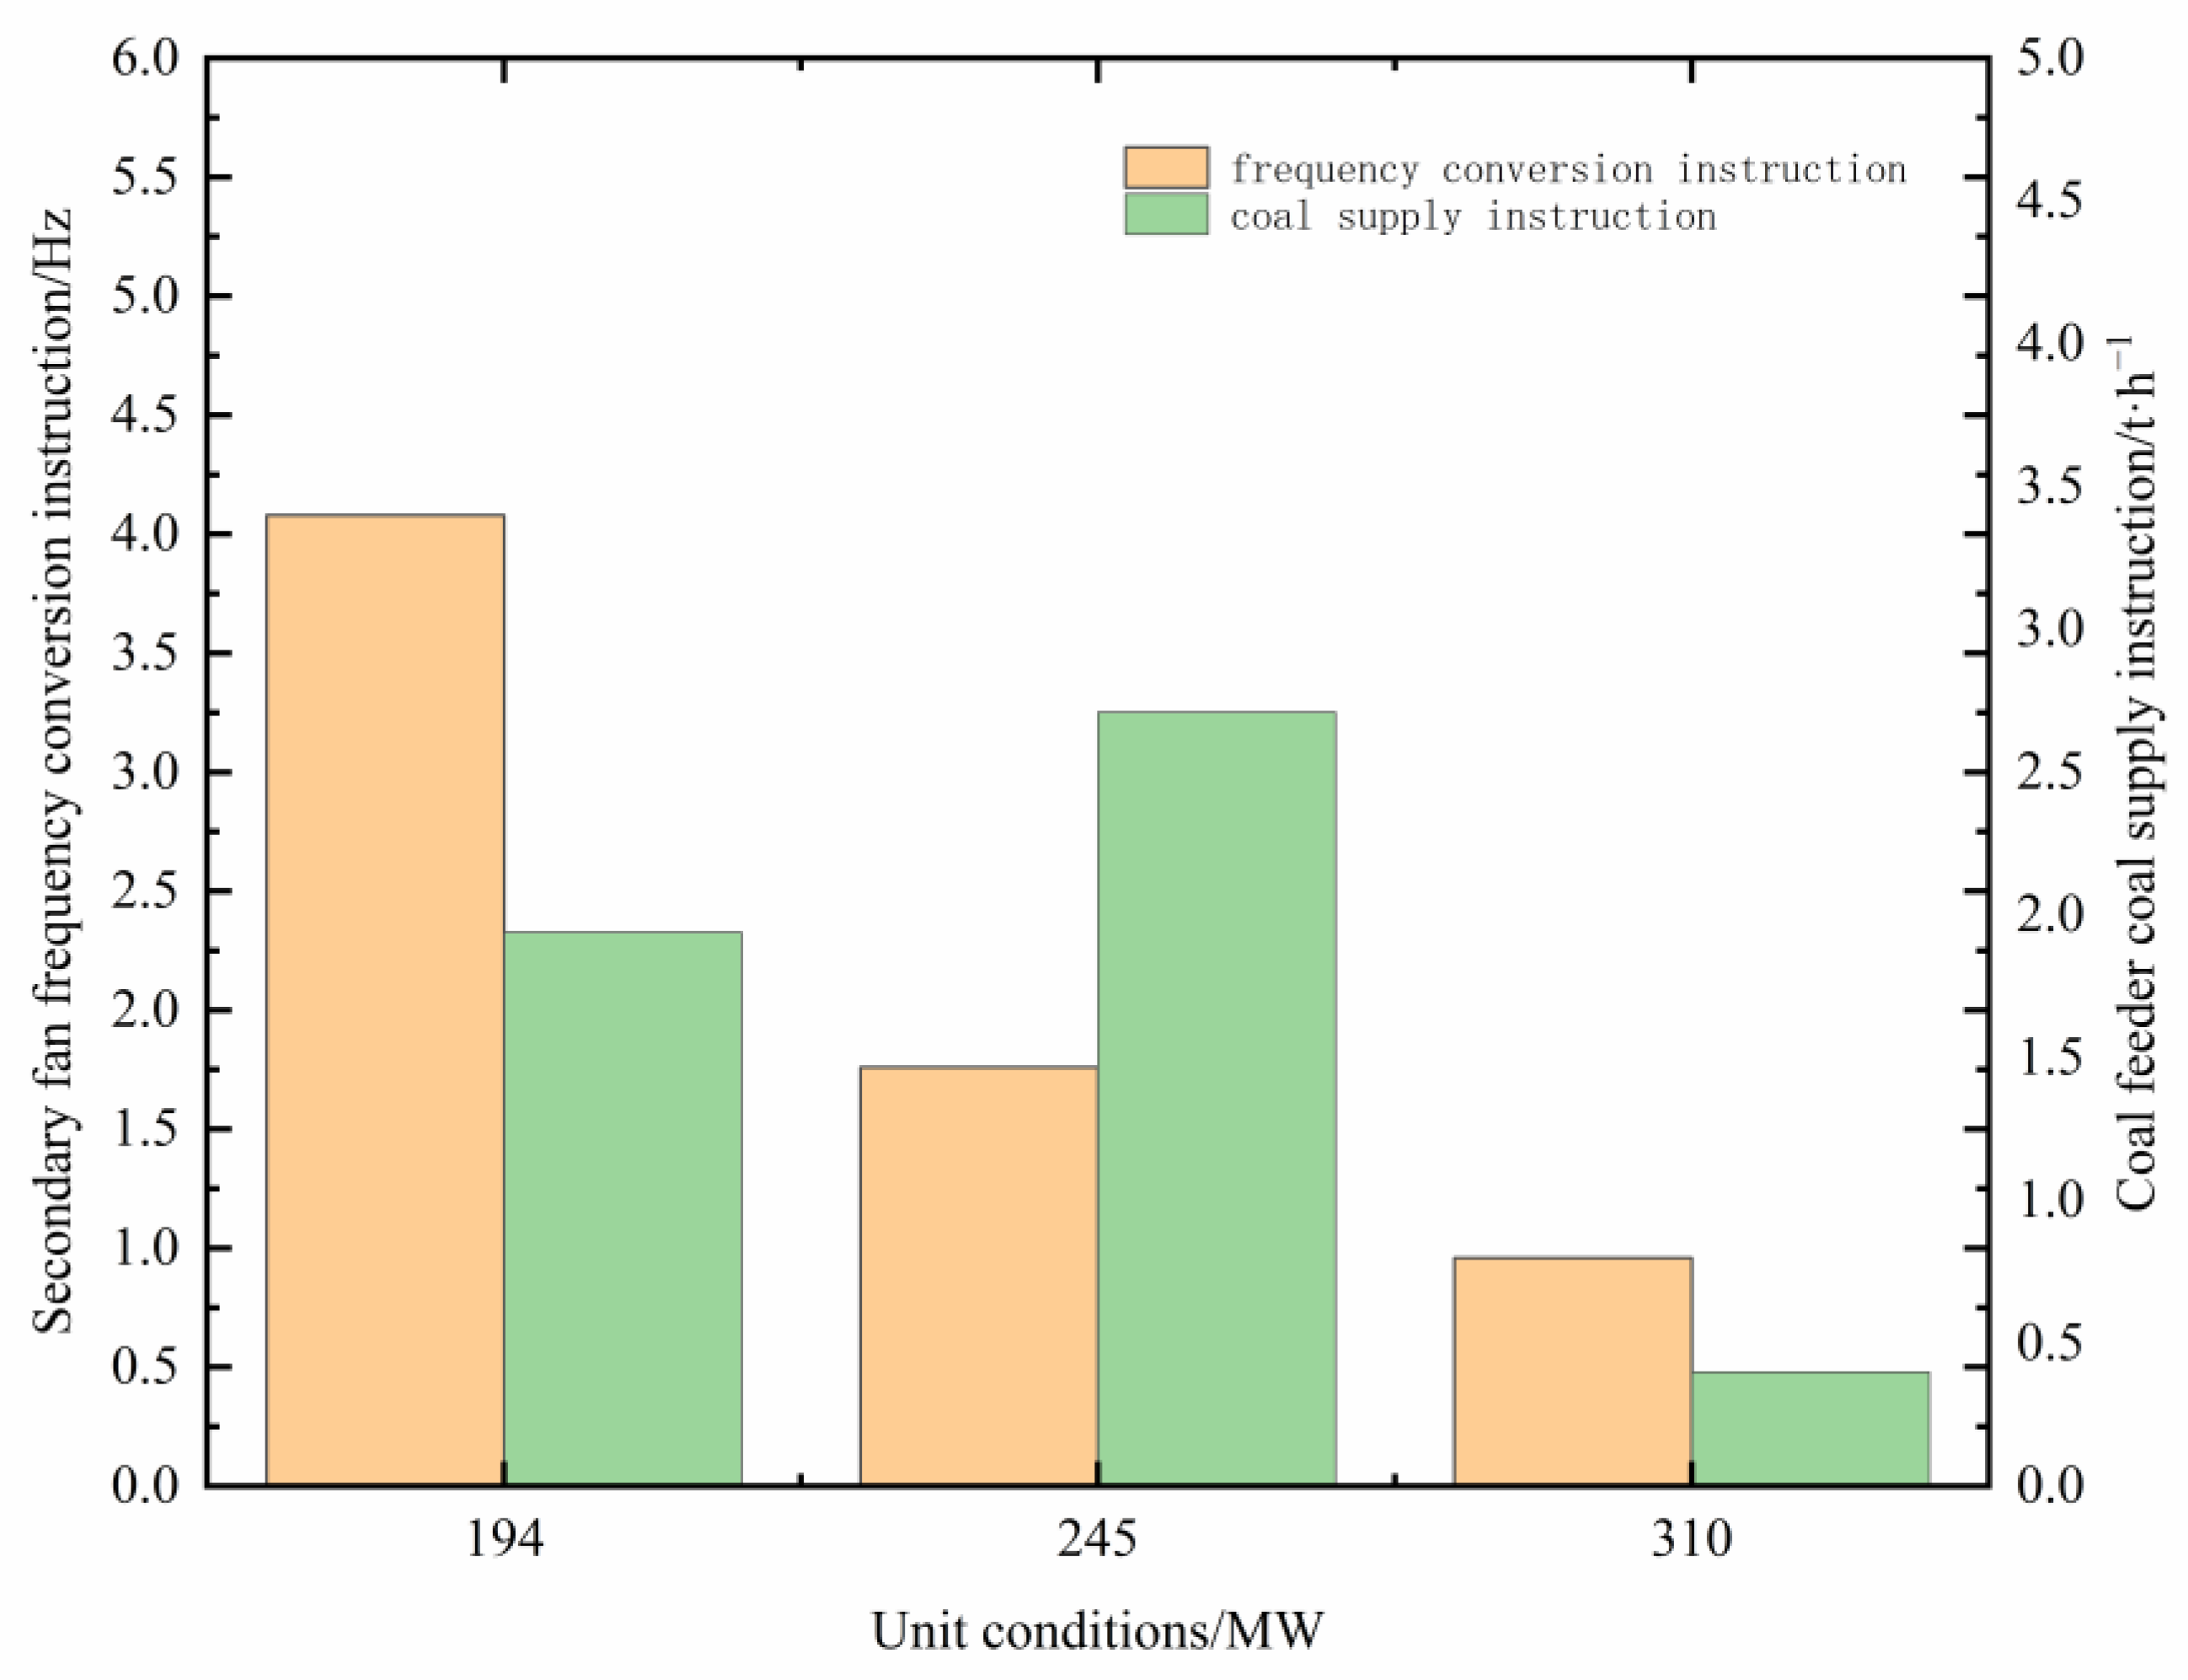
4.3. Analysis of the Law of Different Load Combustion Regulation Instructions of the Unit
5. Conclusions
Author Contributions
Funding
Data Availability Statement
Acknowledgments
Conflicts of Interest
References
- Gaspari, M.; Lorenzoni, A.; Frías, P.; Reneses, J. Integrated Energy Services for the industrial sector: An innovative model for sustainable electricity supply. Util. Policy 2017, 45, 118–127. [Google Scholar] [CrossRef]
- Perdan, S.; Azapagic, A. Carbon trading: Current schemes and future developments. Energy Policy 2011, 39, 6040–6054. [Google Scholar] [CrossRef]
- Chen, S. Development Status and Prospect of Intelligent Power Station. In Proceedings of the 2013 Annual Conference on Intelligent Power Station Technology Development and Power Station Automation, Shanghai University of Electric Power. Shanghai, China, 12–13 October2013; pp. 37–47. [Google Scholar]
- Immonen, E.; Lauren, M.; Roininen, L.; Särkkä, S. Multiobjective model-based optimization of diesel injection rate profile by machine learning methods. In Proceedings of the 2020 IEEE International Systems Conference (SysCon), Montreal, QC, Canada, 24 August–20 September 2020; pp. 1–6. [Google Scholar]
- Bao, X.; Li, Y.; Zhu, C. Deep deterministic policy gradient-based combustion optimization method for coal-fired boiler. In Proceedings of the 2021 40th Chinese Control Conference (CCC), Shanghai, China, 26–28 July 2021; pp. 6255–6260. [Google Scholar]
- Zhang, P.; Jiang, Y.; Wang, M.; Fei, M.; Wang, L.; Rakić, A. Furnace Temperature Prediction Using Optimized Kernel Extreme Learning Machine. In Proceedings of the 2021 40th Chinese Control Conference (CCC), Shanghai, China, 26–28 July 2021; pp. 2711–2715. [Google Scholar]
- Pan, G. Research progress of coal-fired power plant pulverization and combustion optimization based on machine learning. Energy Energy Conserv. 2021, 113–115. [Google Scholar] [CrossRef]
- Aminmahalati, A.; Fazlali, A.; Safikhani, H. Multi-objective optimization of CO boiler combustion chamber in the RFCC unit using NSGA II algorithm. Energy 2021, 221, 119859. [Google Scholar] [CrossRef]
- Yao, Z.; Romero, C.; Baltrusaitis, J. Combustion optimization of a coal-fired power plant boiler using artificial intelligence neural network. Fuel 2023, 344, 128145. [Google Scholar] [CrossRef]
- Wang, C.; Liu, Y.; Zheng, S.; Jiang, A. Optimizing combustion of coal fired boilers for reducing NOx emission using Gaussian Process. Energy 2018, 153, 149158. [Google Scholar] [CrossRef]
- Wei, Z.; Li, X.; Xu, L.; Cheng, Y. Comparative study of computational intelligence approaches for NOx reduction of coal-fired boiler. Energy. 2013, 55, 683–692. [Google Scholar] [CrossRef]
- Wu, F.; Zhou, H.; Zheng, L.; Cen, K.F. Multi-objective optimization of coal-fired boiler combustion based on nondominated sorting genetic algorithm. Proceed CSEE 2009, 29, 7–12. [Google Scholar]
- Wei, Z.; Chao, W.; Yajun, Y.; Yongfei, Z. Multi-objective combustion optimization based on data-driven hybrid strategy. Energy 2019, 191, 116478. [Google Scholar]
- Perazzini, H.; Perazzini, M.T.B.; Meili, L.; Freire, F.B.; Freire, J.T. Artificial neural networks to model kinetics and energy efficiency in fixed, fluidized and vibro-fluidized bed dryers towards process optimization. Chem. Eng. Process. Process Intensif. 2020, 156, 108089. [Google Scholar] [CrossRef]
- Safdarnejad, S.M.; Tuttle, J.F.; Powell, K.M. Dynamic modeling and optimization of a coal-fired utility boiler to forecast and minimize NOx and CO emissions simultaneously. Comput. Chem. Eng. 2019, 124, 62–79. [Google Scholar] [CrossRef]
- Zhang, J.; Zhang, X.; Wang, Z. Modeling and optimization of boiler combustion system in power station. MATEC Web Conf. 2018, 232, 04073. [Google Scholar] [CrossRef] [Green Version]
- Li, X.; Niu, P.; Liu, J. Combustion optimization of a boiler based on the chaos and Levy flight vortex search algorithm. Appl. Math. Modell. 2018, 58, 3–18. [Google Scholar] [CrossRef]
- Xu, W.; Huang, Y.; Song, S.; Chen, B.; Qi, X. A novel online combustion optimization method for boiler combining dynamic modeling, multi-objective optimization and improved case-based reasoning. Fuel 2023, 337, 126854. [Google Scholar] [CrossRef]
- Ma, Y.; Wang, H.; Zhang, X.; Hou, L.; Song, J. Three-objective optimization of boiler combustion process based on multi-objective teaching-learning based optimization algorithm and ameliorated extreme learning machine. Mach. Learn. Appl. 2021, 5, 100082. [Google Scholar] [CrossRef]
- Rahat, A.A.M.; Wang, C.L.; Everson, R.M.; Fieldsend, J.E. Data-driven multi-objective optimization of coal-fired boiler combustion systems. Apply Energy 2018, 229, 446–458. [Google Scholar] [CrossRef] [Green Version]
- Sinha, A.; Das, D.; Palavalasa, S.K. dClink: A data-driven based clinkering prediction framework with automatic feature selection capability in 500 MW coal-fired boilers. Energy 2023, 276, 127448. [Google Scholar] [CrossRef]
- Hong, F.; Wang, R.; Song, J.; Gao, M.; Liu, J.; Long, D. A performance evaluation framework for deep peak shaving of the CFB boiler unit based on the DBN-LSSVM algorithm. Energy 2022, 238, 121659. [Google Scholar] [CrossRef]
- Wang, Z.; Peng, X.; Cao, S.; Zhou, H.; Fan, S.; Li, K.; Huang, W. NOx emission prediction using a lightweight convolutional neural network for cleaner production in a down-fired boiler. J. Clean. Prod. 2023, 389, 136060. [Google Scholar] [CrossRef]
- Shi, Y.; Zhong, W.; Chen, X.; Yu, A.B.; Li, J. Combustion optimization of ultra supercritical boiler based on artificial intelligence. Energy 2019, 170, 804–817. [Google Scholar] [CrossRef]
- Yu, H.; Gao, M.; Zhang, H.; Yue, G.; Zhang, Z. Data-driven optimization of pollutant emission and operational efficiency for circulating fluidized bed unit. Energy 2023, 281, 128338. [Google Scholar] [CrossRef]
- Ye, T.; Dong, M.; Long, J.; Zheng, Y.; Liang, Y.; Lu, J. Multi-objective modeling of boiler combustion based on feature fusion and Bayesian optimization. Comput. Chem. Eng. 2022, 165, 107913. [Google Scholar] [CrossRef]
- Xu, X.; Chen, Q.; Ren, M.; Cheng, L.; Xie, J. Combustion optimization for coal fired power plant boilers based on improved distributed ELM and distributed PSO. Energies 2019, 12, 1036. [Google Scholar] [CrossRef] [Green Version]
- Hu, X.; Niu, P.; Wang, J.; Zhang, X. Multi-objective prediction of coal-fired boiler with a deep hybrid neural networks. Atmos. Pollut. Res. 2020, 11, 1084–1090. [Google Scholar] [CrossRef]
- Li, W.; Zhuang, L.; Wang, H. GCNs–FSMI: EEG recognition of mental illness based on fine-grained signal features and graph mutual information maximization. Expert Syst. Appl. 2023, 228, 120227. [Google Scholar] [CrossRef]
- Wang, J.; Liu, P.; Lu, S.; Zhou, M.; Chen, X. Decentralized plant-wide monitoring based on mutual information-Louvain decomposition and support vector data description diagnosis. ISA Trans. 2023, 133, 42–52. [Google Scholar] [CrossRef] [PubMed]
- Hassani, H.; Hallaji, E.; Razavi-Far, R.; Saif, M. Unsupervised concrete feature selection based on mutual information for diagnosing faults and cyber-attacks in power systems. Eng. Appl. Artif. Intell. 2021, 100, 104150. [Google Scholar] [CrossRef]
- Chen, H.; Chang, X. Photovoltaic power prediction of LSTM model based on Pearson feature selection. Energy Rep. 2021, 7, 1047–1054. [Google Scholar] [CrossRef]
- Jebli, I.; Belouadha, F.-Z.; Kabbaj, M.I.; Tilioua, A. Prediction of solar energy guided by Pearson correlation using machine learning. Energy 2021, 224, 120109. [Google Scholar] [CrossRef]
- Nicoulaud-Gouin, V.; Mourlon, C.; Tanaka, T.; Le Dizes-Maurel, S.; Garcia-Sanchez, L.; Attard, J.C.; Zorko, B.; Mora, J.C.; Simon-Cornu, M. Sensitivity analysis in a radiological impact assessment of a nuclear power plant discharge. A comparison of the Morris, Spearman and Sobol’ approaches. J. Environ. Radioact. 2022, 242, 106770. [Google Scholar] [CrossRef]
- Yin, L.; Xie, J. Multi-feature-scale fusion temporal convolution networks for metal temperature forecasting of ultra-supercritical coal-fired power plant reheater tubes. Energy 2022, 238 Pt A, 121657. [Google Scholar] [CrossRef]
- Ren, X.; Xue, F. Heuristic attribute reduction algorithm based on fuzzy neighborhood rough set. Comput. Eng. Appl. 2018, 54, 47–53+212. [Google Scholar]
- Ren, Y.; Xu, C. Analysis of missing material data based on neighborhood rough set and neural network. Firepower Command Control 2022, 47, 132–138. [Google Scholar]
- DL/T 964-2005; Performance Test Code for Circulating Fluidized Bed Boiler. National Development and Reform Commission: Beijing, China, 2005.
- Deb, K.; Pratap, A.; Agarwal, S.; Meyarivan TA, M.T. A fast and elitist multi objective genetic algorithm: NSGA-II. IEEE Trans. Evol. Comput. 2002, 6, 182–197. [Google Scholar] [CrossRef] [Green Version]
- Jayakumar, D.N.; Venkatesh, P. Glowworm swarm optimization algorithm with topsis for solving multiple objective environmental economic dispatch problem. Appl. Soft Comput. 2014, 23, 375–386. [Google Scholar] [CrossRef]
- Liu, Y. The Latest Boiler, Pressure Vessel, Pressure Pipeline Design, Operation and Inspection of Common Data and Standard Specification Quick Reference Manual; Contemporary China Audio-Visual Press: Beijing, China, 2004; pp. 110–112. [Google Scholar]
- Hou, X.; Li, J.; Zhang, H.; Zhao, S.; Lv, J.; Yue, G. Limestone effects on NOx formation and emission in CFB combustors. Power Plant Syst. Eng. 2005, 21, 5–7+16. [Google Scholar]
- Li, J.; Zhang, M.; Liu, Q.; Guo, X.; Zhang, J. Theory and practice of ultra-low NOx emission in circulating fluidized bed boilers. Clean Coal Technol. 2020, 26, 139–145. [Google Scholar]
- Mollo, M.; Kolesnikov, A.; Makgato, S. Simultaneous reduction of NOx emission and SOx emission aided by improved efficiency of a Once-Through Benson Type Coal Boiler. Energy 2022, 248, 123551. [Google Scholar] [CrossRef]
- Li, J.; Heng, P.; Wang, B.; Wang, B.; Liu, N.; Wang, X. Initial unimolecular decomposition of 3,4-bis(3-fluorodinitromethylfuroxan-4-yl) furoxan from quantum mechanics and ReaxFF molecular dynamics simulation. FirePhysChem 2023, 3, 149–157. [Google Scholar] [CrossRef]
- Li, S.; Xu, T.; Hui, S.; Wei, X. NOx emission and thermal efficiency of a 300 MWe utility boiler retrofitted by air staging. Appl. Energy 2009, 86, 1797–1803. [Google Scholar] [CrossRef]
- Liu, X.; Yin, W.; Wang, P.; Yang, H. Effect of bed pressure drop on combustion efficiency of CFB boiler. J. Coal Sci. Eng. 2016, 41, 2484–2489. [Google Scholar]
- Li, J.; Yang, H.; Lv, J.; Zhang, J.; Cao, P.; Zhao, Y.; Bai, Y. Low NOx emission characteristic of low energy consumption CFB boiler. Combust. Sci. Technol. 2013, 19, 293–298. [Google Scholar]
- Ke, X.; Zhang, M.; Yang, H.; Lyu, J.; Guo, X.; Li, J.; He, H. Research progress on the characteristics of NOx emission in circulating fluidized bed boiler. Proc. CSEE 2021, 41, 2757–2770. [Google Scholar]
- Ji, Z.; Song, G.; Yang, Z.; Xiao, Y.; Yang, X.; Wang, C.; Zhang, X. Effect of post-combustion air distribution on NOx original emission and combustion characteristics of 75 t/h coal slime circulating fluidized bed boiler. J. Energy Inst. 2021, 99, 154–160. [Google Scholar] [CrossRef]
- Ke, X.; Zhu, S.; Huang, Z.; Zhang, M.; Lyu, J.; Yang, H.; Zhou, T. Issues in deep peak regulation for circulating fluidized bed combustion: Variation of NOx emissions with boiler load. Environ. Pollut. 2023, 318, 120912. [Google Scholar] [CrossRef] [PubMed]


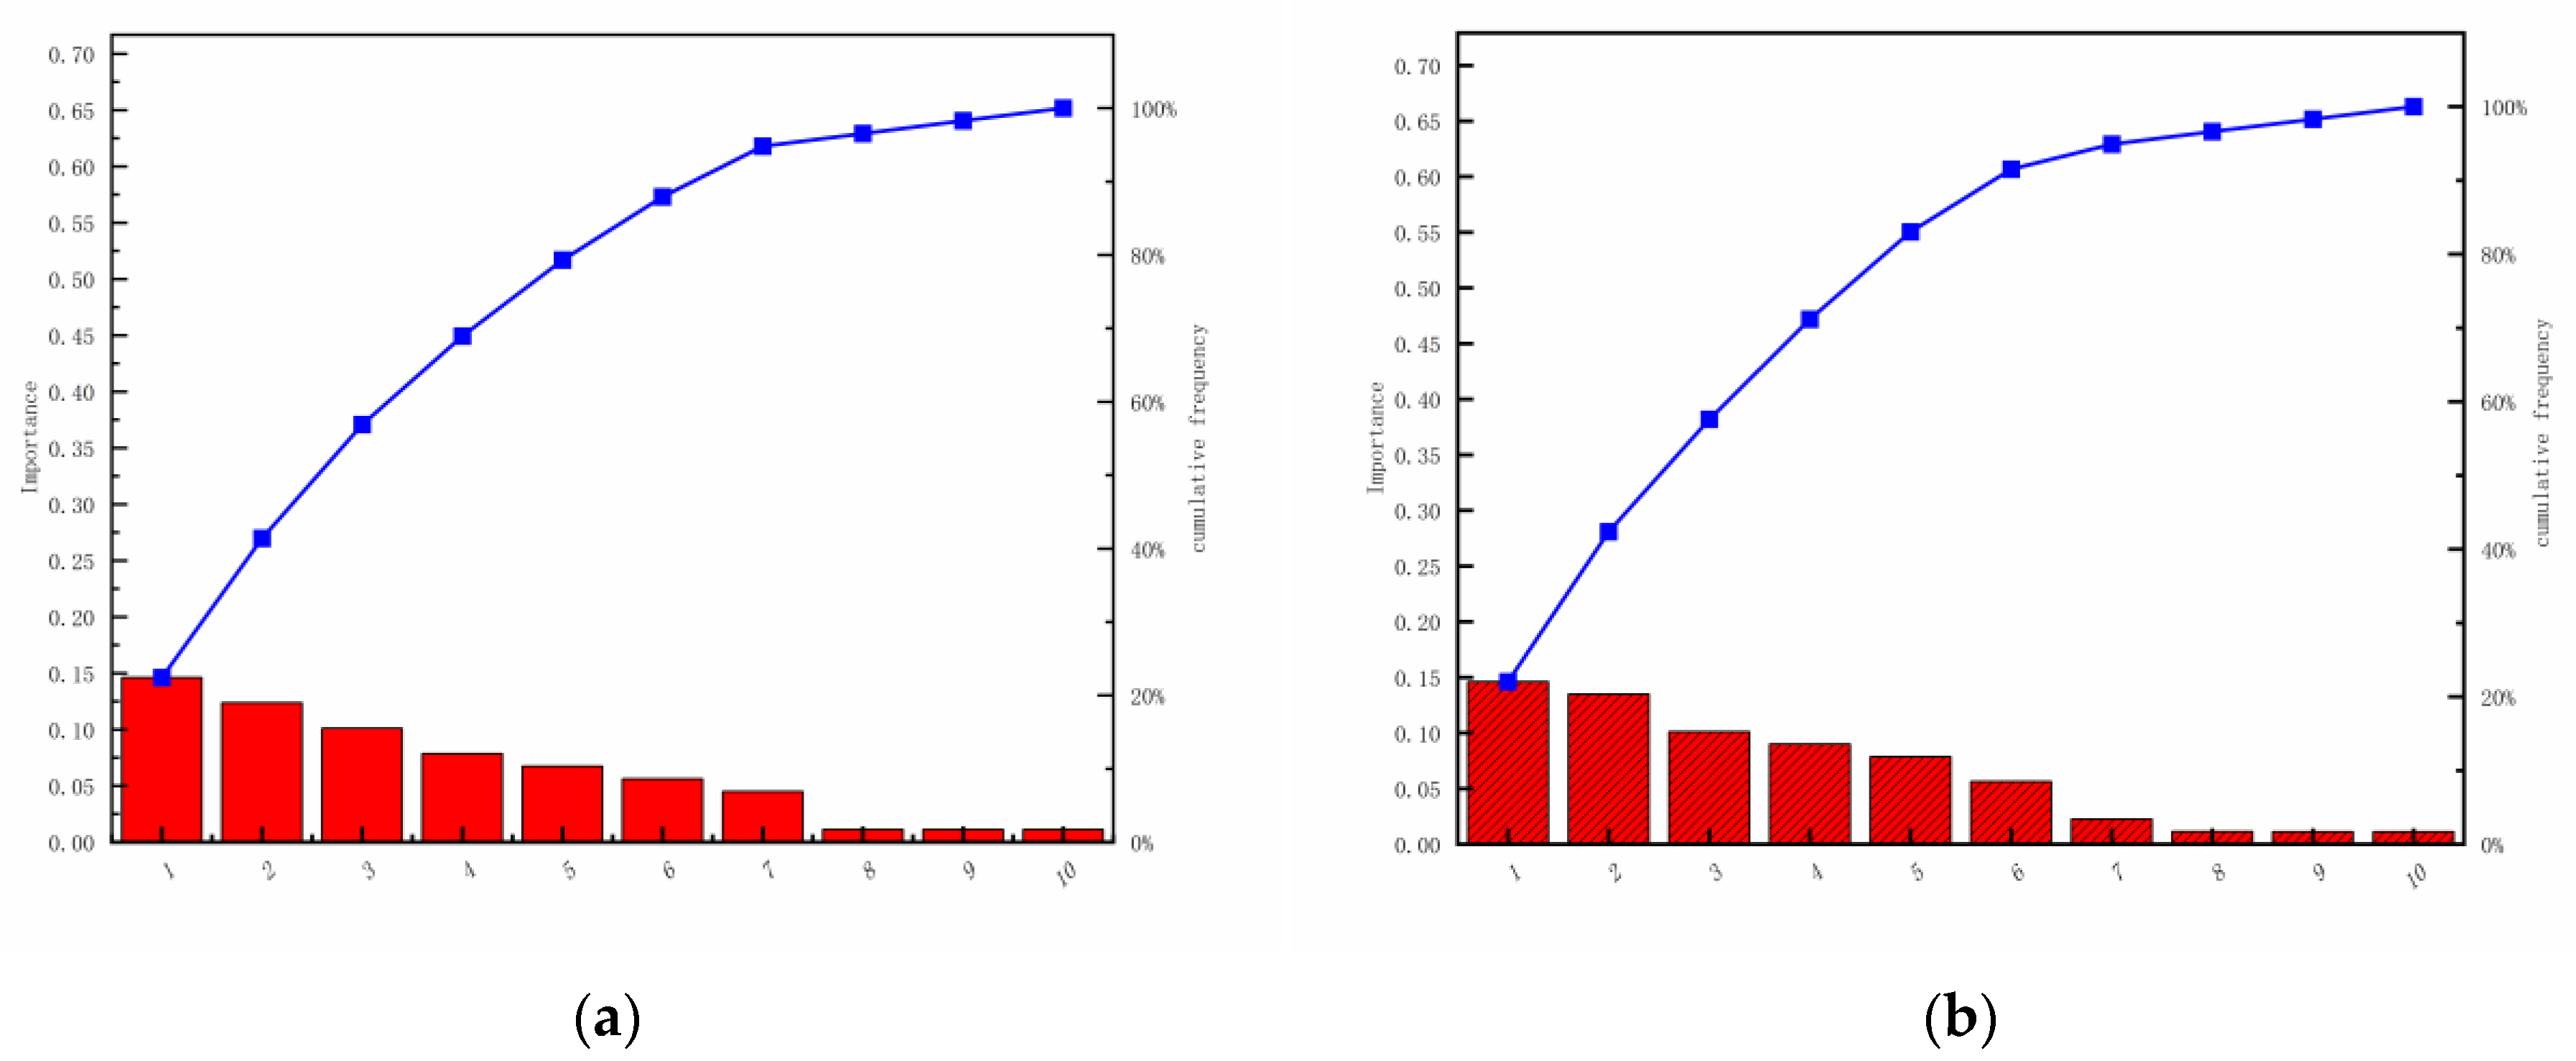
| Decision Attribute | Parameters in Condition Attribute | Importance |
|---|---|---|
| NOx emission concentration | 1# Primary fan frequency conversion instruction | 0.1461 |
| 2# Secondary fan frequency conversion instruction | 0.1236 | |
| Secondary air baffle opening instruction on the left rear wall upper part | 0.1011 | |
| 1# Slag cooler frequency conversion instruction | 0.0786 | |
| Secondary air baffle opening instruction on the left front wall lower part | 0.0674 | |
| Secondary air baffle opening instruction on the right front wall upper part | 0.0562 | |
| Secondary air baffle opening instruction on the right rear wall upper part | 0.0449 | |
| 1# Coal feeder coal supply instruction | 0.0113 | |
| Secondary air baffle opening instruction on the left rear wall lower part | 0.0113 | |
| 1# Secondary fan frequency conversion instruction | 0.0112 | |
| Boiler thermal efficiency | 2# Secondary fan frequency conversion instruction | 0.1461 |
| 1# Primary fan frequency conversion instruction | 0.1348 | |
| 1# Slag cooler frequency conversion instruction | 0.1011 | |
| Secondary air baffle opening instruction on the left front wall lower part | 0.0899 | |
| Secondary air baffle opening instruction on the left rear wall upper part | 0.0786 | |
| Secondary air baffle opening instruction on the right front wall upper part | 0.0562 | |
| Secondary air baffle opening instruction on the right rear wall upper part | 0.0225 | |
| 2# Coal feeder coal supply instruction | 0.0113 | |
| 1# Secondary fan frequency conversion instruction | 0.0112 | |
| Secondary air baffle opening instruction on the left rear wall lower part | 0.0112 |
| Hidden Layer Nodes | RMSE of Boiler Thermal Efficiency/% | RMSE of NOx Emission Concentration/mg·Nm−3 | R Correlation Coefficient | Hidden Layer Nodes | RMSE of Boiler Thermal Efficiency/% | RMSE of NOx Emission Concentration/mg·Nm−3 | R Correlation Coefficient |
|---|---|---|---|---|---|---|---|
| 5 | 0.0954 | 4.187 | 0.8768 | 12 | 0.0667 | 3.328 | 0.8182 |
| 6 | 0.0889 | 3.260 | 0.7096 | 13 | 0.0887 | 5.002 | 0.3741 |
| 7 | 0.0889 | 2.905 | 0.9179 | 14 | 0.0983 | 3.950 | 0.8166 |
| 8 | 0.1 | 3.067 | 0.4635 | 18 | 0.1030 | 5.949 | 0.6380 |
| 9 | 0.0980 | 3.331 | 0.7686 | 20 | 0.13 | 4.496 | 0.7847 |
| 10 | 0.0893 | 3.679 | 0.9094 | 21 | 0.0899 | 3.942 | 0.9246 |
| 11 | 0.0910 | 3.485 | 0.8094 |
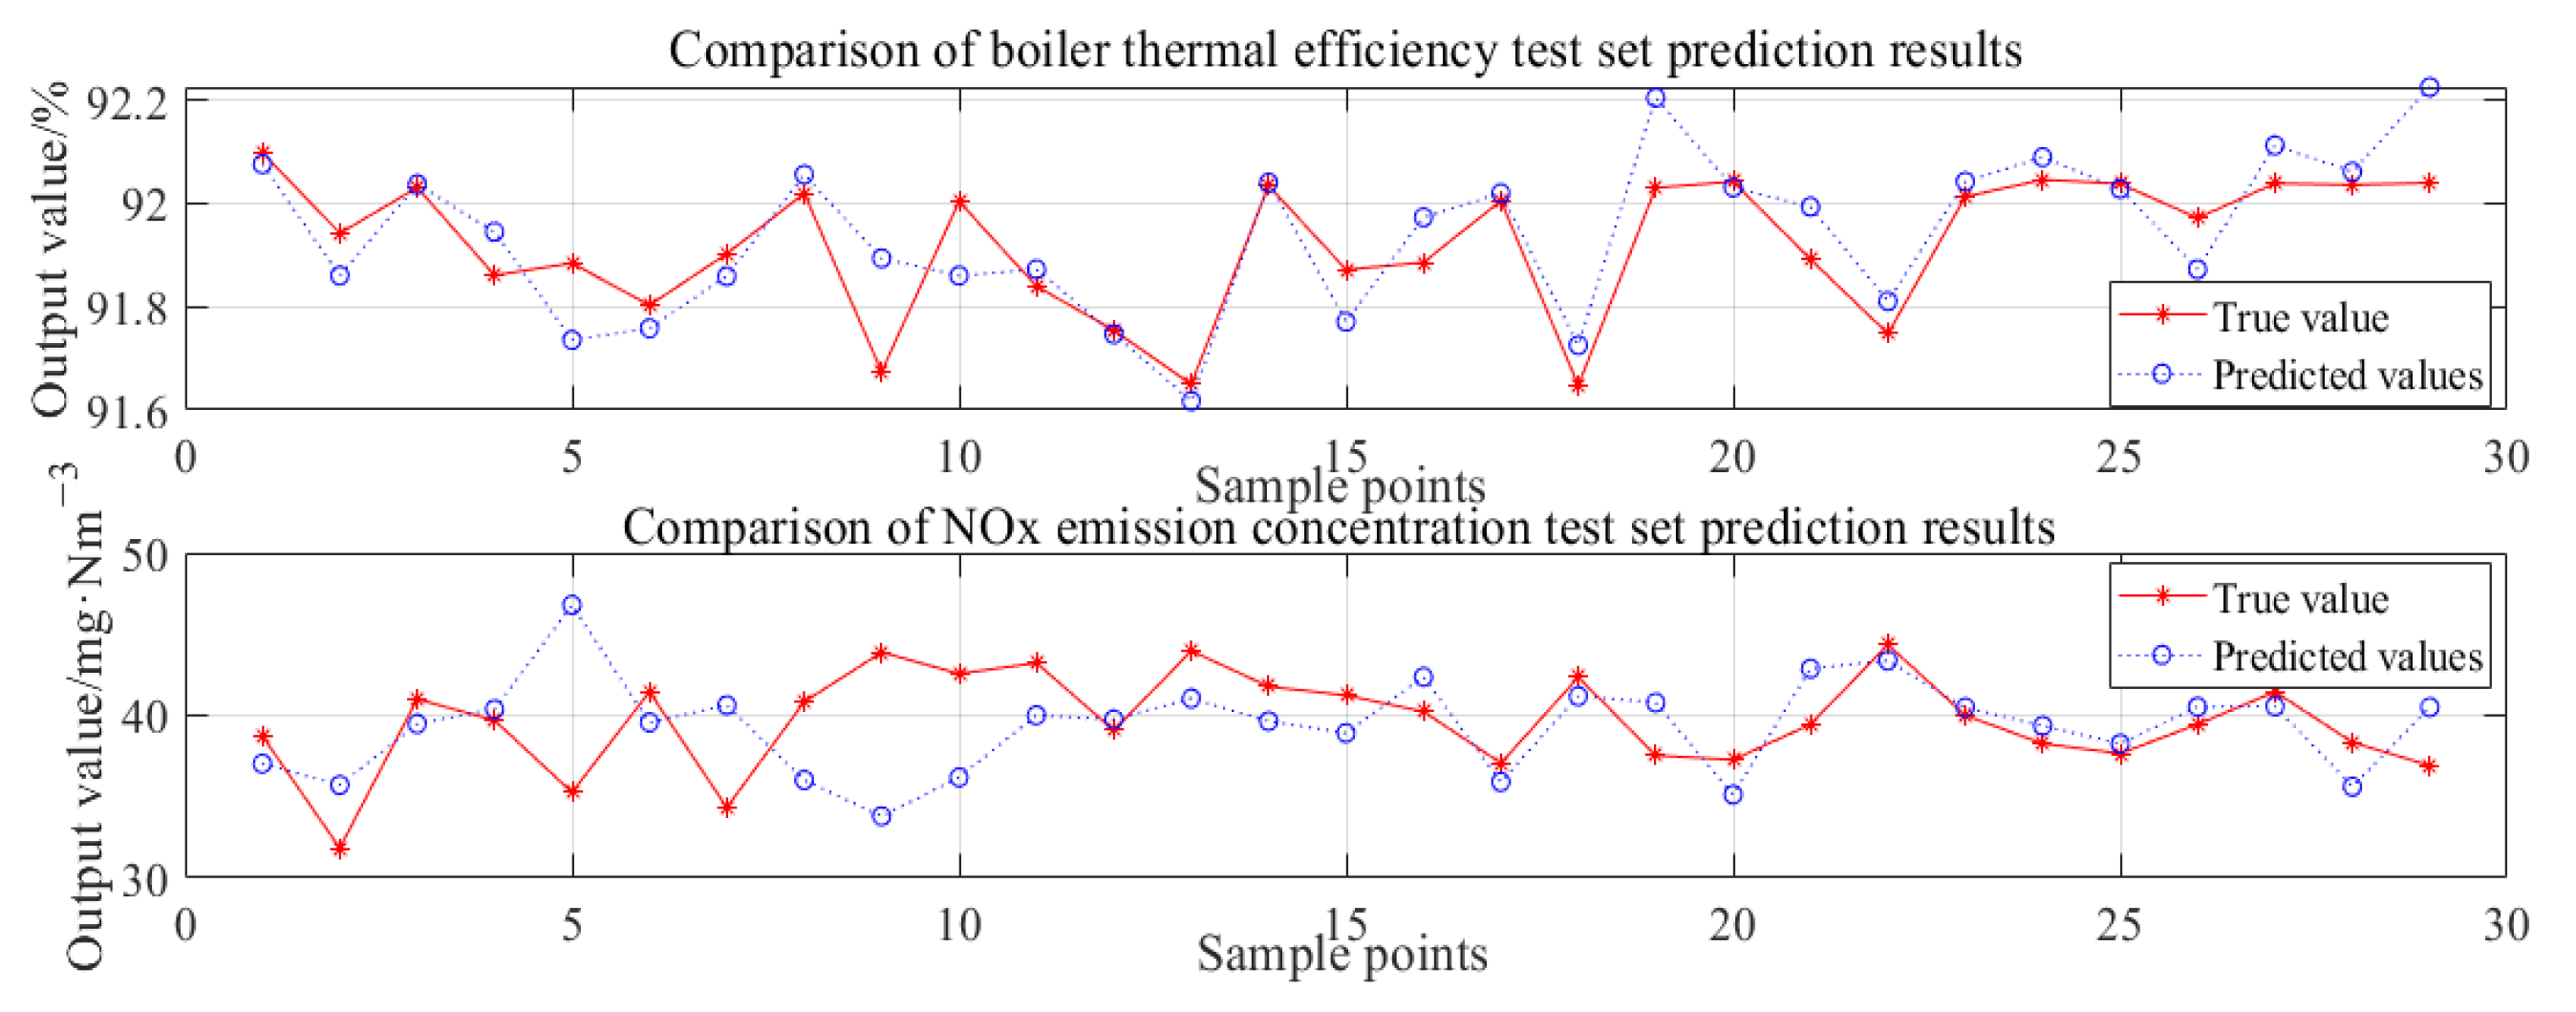
| Project | RMSE | Mean Absolute Error | Maximum Absolute Error | Minimum Absolute Error |
|---|---|---|---|---|
| Boiler thermal efficiency/% | 0.0899 | 0.0692 | 0.2191 | 0.0058 |
| NOx emission concentration/mg·Nm−3 | 3.942 | 2.921 | 11.5311 | 0.4826 |
| Main Manipulated Parameter | 1# Primary Fan Frequency Conversion Instruction/Hz | 1# Secondary Fan Frequency Conversion Instruction/Hz | 1# Secondary Fan Frequency Conversion Instruction/Hz | #1 Coal Feeder Coal Supply Instruction /t·h−1 | #2 Coal Feeder Coal Supply Instruction /t·h−1 |
|---|---|---|---|---|---|
| Before optimization | 41.67 | 27.04 | 27.04 | 42.16 | 41.63 |
| Strategy 1: After optimization | 42.1 | 27.56 | 27.49 | 43.61 | 40.57 |
| Instruction difference under strategy 1 | 0.43 | 0.51 | 0.45 | 1.45 | −1.05 |
| Strategy 2: After optimization | 40.77 | 26.45 | 27.54 | 43.48 | 40.55 |
| Instruction difference under strategy 2 | −0.9 | −0.6 | 0.49 | 1.31 | −1.07 |
| Method of Prediction | Boiler Thermal Efficiency/% | NOx Emission Concentration/mg·Nm−3 | ||||||
|---|---|---|---|---|---|---|---|---|
| Model A | 0.0716 | 0.0495 | 0.2549 | 0.0010 | 4.2550 | 3.1337 | 12.2940 | 0.1387 |
| Model B | 0.0899 | 0.0692 | 0.2191 | 0.0058 | 3.942 | 2.921 | 11.5311 | 0.4826 |
| Manipulated Parameter | Before Optimization | After Optimization | Instruction Difference |
|---|---|---|---|
| 1# Secondary fan frequency conversion instruction/Hz | 34.65 | 35.42 | 0.77 |
| 2# Secondary fan frequency conversion instruction/Hz | 34.63 | 35.62 | 0.99 |
| 1# Coal feeder coal supply instruction/t·h−1 | 20.0 | 21.4 | 1.4 |
| 2# Coal feeder coal supply instruction/t·h−1 | 19.00 | 20.30 | 1.31 |
| 1# Slag cooler frequency conversion instruction/Hz | 32.06 | 32.22 | 0.16 |
| Secondary air baffle opening instruction on the left rear wall upper part/% | 58.83 | 58.32 | −0.50 |
| Secondary air baffle opening instruction on the right front wall upper part/% | 58.95 | 58.59 | −0.36 |
| Secondary air baffle opening instruction on the right rear wall upper part/% | 59.63 | 58.11 | −1.52 |
| Manipulated Parameter | Before Optimization | After Optimization | Instruction Difference |
|---|---|---|---|
| 1# Primary fan frequency conversion instruction/Hz | 38.42 | 38.14 | −0.28 |
| 1# Secondary fan frequency conversion instruction/Hz | 26.44 | 28.38 | 1.94 |
| 2# Secondary fan frequency conversion instruction/Hz | 26.18 | 28.32 | 2.14 |
| 1# Coal feeder coal supply instruction/t·h−1 | 15.56 | 16.91 | 1.35 |
| 2# Coal feeder coal supply instruction/t·h−1 | 15.57 | 16.16 | 0.59 |
| 1# Slag cooler frequency conversion instruction/Hz | 37.09 | 31.62 | −5.47 |
| Secondary air baffle opening instruction on the left front wall lower part/% | 20.72 | 18.43 | −2.29 |
| Secondary air baffle opening instruction on the left rear wall upper part/% | 31.15 | 29.34 | −1.81 |
| Secondary air baffle opening instruction on the left rear wall lower part/% | 20.15 | 17.27 | −2.88 |
| Secondary air baffle opening instruction on the right front wall upper part/% | 29.94 | 28.93 | −1.01 |
| Secondary air baffle opening instruction on the right rear wall upper part/% | 29.2 | 30.02 | 0.82 |
Disclaimer/Publisher’s Note: The statements, opinions and data contained in all publications are solely those of the individual author(s) and contributor(s) and not of MDPI and/or the editor(s). MDPI and/or the editor(s) disclaim responsibility for any injury to people or property resulting from any ideas, methods, instructions or products referred to in the content. |
© 2023 by the authors. Licensee MDPI, Basel, Switzerland. This article is an open access article distributed under the terms and conditions of the Creative Commons Attribution (CC BY) license (https://creativecommons.org/licenses/by/4.0/).
Share and Cite
Han, L.; Wang, L.; Yang, H.; Jia, C.; Meng, E.; Liu, Y.; Yin, S. Optimization of Circulating Fluidized Bed Boiler Combustion Key Control Parameters Based on Machine Learning. Energies 2023, 16, 5674. https://doi.org/10.3390/en16155674
Han L, Wang L, Yang H, Jia C, Meng E, Liu Y, Yin S. Optimization of Circulating Fluidized Bed Boiler Combustion Key Control Parameters Based on Machine Learning. Energies. 2023; 16(15):5674. https://doi.org/10.3390/en16155674
Chicago/Turabian StyleHan, Lei, Lingmei Wang, Hairui Yang, Chengzhen Jia, Enlong Meng, Yushan Liu, and Shaoping Yin. 2023. "Optimization of Circulating Fluidized Bed Boiler Combustion Key Control Parameters Based on Machine Learning" Energies 16, no. 15: 5674. https://doi.org/10.3390/en16155674