Article

Attention-Focused Machine Learning Method to Provide the Stochastic Load Forecasts Needed by Electric Utilities for the Evolving Electrical Distribution System

1
DTE Electric, Detroit, MI 48226, USA
2
Department of Electrical and Computer Engineering, University of Michigan-Dearborn, Dearborn, MI 48128, USA
*
Author to whom correspondence should be addressed.
Energies 2023, 16(15), 5661; https://doi.org/10.3390/en16155661
Submission received: 20 June 2023 / Revised: 17 July 2023 / Accepted: 25 July 2023 / Published: 27 July 2023

Abstract

:
Greater variation in electrical load should be expected in the future due to the increasing penetration of electric vehicles, photovoltaics, storage, and other technologies. The adoption of these technologies will vary by area and time, and if not identified early and managed by electric utilities, these new customer needs could result in power quality, reliability, and protection issues. Furthermore, comprehensively studying the uncertainty and variation in the load on circuit elements over periods of several months has the potential to increase the efficient use of traditional resources, non-wires alternatives, and microgrids to better serve customers. To increase the understanding of electrical load, the authors propose a multistep, attention-focused, and efficient machine learning process to provide probabilistic forecasts of distribution transformer load for several months into the future. The method uses the solar irradiance, temperature, dew point, time of day, and other features to achieve up to an 86% coefficient of determination (R2).

1. Introduction

The intensifying need to reduce carbon emissions, the increased penetration of electric vehicles (EVs) and indoor agriculture, the growing deployment of customer-owned distributed energy resources (DERs), the maturing of non-wires alternatives (NWAs) and microgrid technology, and the promise of adaptive networked microgrids (ANMs) present great opportunities to evolve the traditional electrical system for greater customer benefits. However, for these opportunities to be made into practical solutions, the complexities introduced must also be recognized, researched, and addressed. The two-way power flow on distribution systems must be understood, new control and protection methods must be developed for NWA and microgrid technologies, and even the risks of lightly loaded energized equipment must be acknowledged and considered [1,2]. Greater spatial and temporal resolution is needed to avoid power quality and reliability concerns, increase capital efficiency, prevent equipment damage, and turn new opportunities into customer benefits. This knowledge of load also must go beyond the traditional deterministic approaches currently leveraged by utilities. The likelihood of outcomes must be considered with the dramatic changes expected as the needs of end users evolve.
Utilities’ past practices have been focused on determining the annual peak load on substations, distribution circuits, or larger areas. A review of the research on the topic shows a focus on either day-ahead forecasts at the customer and equipment level or longer-term forecasts for larger areas, like distribution circuits, substations, or larger areas. Hourly forecasts are needed on circuit elements months into the future to give electric utilities the visibility and time needed to address issues before they cause equipment damage, power quality concerns, or reliability issues for customers. These forecasts are also needed for the visibility to deploy NWAs and microgrids to serve smaller pockets of load. A further improvement and needed paradigm shift for electric utilities is to move toward a probabilistic view of electrical distribution system planning. This can lead to more efficient use of capital and allow for consideration of outcomes that have not yet been experienced, which is more critical with the evolution of the electrical distribution system.
Considering these current and practical opportunities and challenges facing utilities, this manuscript presents a method to provide the insight into the electrical load that is needed. The method does so while considering the scalability of the solution by minimizing the training time, and it has been developed and validated with real-world data. Specifically, the contributions of the method presented in this manuscript are as follows:
(1)
The method provides automated meter infrastructure (AMI) data-driven hourly forecasts at the distribution transformer level with much greater spatial and temporal resolution compared to past practices and available research.
(2)
It delivers the data required to develop and deploy NWA solutions and microgrids to serve smaller pockets of load.
(3)
It creates the visibility needed to avoid reliability, power quality, and protection issues due to changing customer needs.
(4)
It establishes the fundamental basis for an integrated framework to determine the likelihood of occurrences using stochastic methods.

2. State of the Art

2.1. Overview

The predominant practice among electric utilities studying load for distribution planning purposes is focused on an annual and labor-intensive process of finding the peak load on major electrical infrastructure, such as substation transformers. This deterministically identified peak load is used to design the electrical system. The premise behind this approach is that if the system can withstand the peak load, lighter loads can also be accommodated. While this has led to a highly reliable and effective electrical system, it leaves room for improvements. Researchers have recognized this opportunity and considered forecasting horizons up to 1 h (Very-Short-Term Forecasts or VSTFs), up to 1 or 2 weeks (Short-Term Forecasts or STFs), up to 1 or 3 years (Medium-Term Forecasts or MTFs), and up to 30 years (Long-Term Forecasts or LTFs) [3]. There has been a great deal of excellent research into forecasting electrical loads, with three areas receiving the most attention: VSTFs and STFs (typically day-ahead or a few days-ahead) for small areas, such as an individual customer; MTFs and LTFs for large areas, such as a substation, city, or country; and classification to develop representative load shapes. While this research promises improvements over traditional approaches, the evolving electrical system will demand more. Considering the growing interest in and promise of NWA and microgrid deployments, especially those that are networked with dynamic and adaptive boundaries, longer-term forecasts for smaller areas are necessary. Furthermore, customer deployments of DERs, such as rooftop solar and behind-the-meter storage, present great opportunities but must be balanced with preventative measures that address the risks of power quality concerns and equipment damage. This also requires understanding load with much greater spatial and temporal resolution than previously studied.

2.2. Short-Term Forecasts

This section summarizes the research that has been completed to provide short-term forecasts, typically day-ahead and up to a few weeks in the future. These forecasts are typically created for smaller areas, such as homes or individual loads. The countermeasures to address electrical system issues typically require material to be ordered, easements and permits to be obtained, crews to be mobilized, construction to be completed, new installations to be commissioned and tested, and other activities to be completed. The load-related issues will increase with the evolution of the electrical system, and identifying them earlier will be critical. Furthermore, the deployment of NWAs and microgrids will be designed to serve customers for years into the future. This will require a longer-term view of the electrical load.
Smart meter data are used in [4] to test different dimensionality reduction methods with linear regression and neural networks to produce day-ahead forecasts. A layered architecture with various data types is presented in [5] to forecast 24 h into the future. The authors achieved correlation coefficients between 88% and 86% for 3 to 24 h into the future. Several machine learning methods are used to predict hourly electricity consumption for 370 houses a week in advance in [6]. Two datasets are used in [7]. In one case, the authors predict the average hourly load by day for 30 days in advance. In the second case, they predict the hourly load for the next day. A parallel neural network architecture (PLCNet) with two datasets is used by [8] to forecast the hourly day-ahead load for Germany and a city in Malaysia. Three one-dimensional convolutional (conv1d) layers are presented in [9] to provide one day-ahead predictions of hourly loads. The authors of [10] weigh the use of several models, including time series autoregressive, linear regression, gray, and quadratic, to determine an overall forecast for three days. Long short-term memory (LSTM), dense and then conv1d are considered in [11] to forecast for three days in the future. Two linear, short-term load-forecasting models are described in [12] for the customer baseline load on aggregate and on average distribution transformer data. A thermal model of a transformer is developed in [13], and it uses different models to predict the load data for the next 24 h. The authors of [14] use time-series data spanning over 2 million minutes in 1 min intervals from a single household in France to predict the load for that house five minutes into the future and achieve an R2 of 83%. A stacked autoencoder neural network (SAE) is used in [15] to create a 50 h load forecast. The load of an area in China served by a 2500 kVA transformer is forecast in [16]. The authors use 999 days of data to predict the load on day 1000 for an R2 of 99%. The authors of [17] forecast one day-ahead and one week-ahead for a 400 kV substation area. Ref. [18] predicts 25 to 250 h into the future. The authors of [19] experiment with LSTM, Recurrent Neural Networks (RNN) and Gated Recurrent Unit (GRU) networks to produce day-ahead forecasts. The authors of [20] use outlier correction and Q-learning to forecast approximately 2 days into the future for 25 households in the Austin area of the United States. Several machine learning approaches are compared by the authors of [21] to forecast the load in Ontario, Canada two days into the future. Finally, the authors of [22] provide an overview of the methods for performing short-term forecasts.

2.3. Large Area Forecasts

Research has been completed to provide longer-term forecasts for larger areas, such as the area served by a substation. The evolution of the electrical system will come with two-way power flow on infrastructure that has been designed for one-way power flow. The future electrical system likely will see concentrations of load that must be addressed. Furthermore, NWAs and microgrids will be designed to serve smaller load areas. For these reasons, forecasting methods must focus on smaller areas to identify issues quickly or proactively to prevent issues that could impact proper service.
The area focuses of [8,16,17,21] have already been described. The authors of [23] forecast the load for the entire PJM area for over a year in advance to achieve an R2 between 75% and 80%. Ref. [24] tests several distance measures, including Dynamic Time Warping (DTW) and Euclidean Distance (ED) with K-Means clustering as a precursor to forecasting the load for a substation bus. Similarly, Ref. [25] uses the data from one substation in Thailand to cluster the load on feeders as a precursor to load forecasting. The authors of [26] predict the load for the city of Philadelphia. Hourly load data for Pakistan from the Islamabad Electric Supply Company (IESCO) between 2015 to 2019 are used by [27] to forecast weekly and monthly hourly forecasts to achieve an R2 of 98%. The authors of [28] use training data from 2004 to 2010 with an LSTM–RNN method to forecast the load from 2011 to 2015 for the six-state area covered by the New England ISO. Ref. [29] is focused on stochastic forecasting at the feeder level and uses load profiles with a roulette wheel approach. The authors of [30] produce national, regional, area, and substation load forecasts for distribution planning in Korea. Forecasting the load to charge EVs in an area expected to have a peak of approximately 4000 MW for EV charging is the focus of [31]. The authors of [32] forecast the load of a six-bus transmission system. Forecasting the annual electricity consumption in China and a region of China from 2016 to 2019 is developed in [33] by combining models and using forecasts for the independent variables, such as the Gross National Product (GNP) and per capita disposable income. Refs. [34,35] develop user classes and apply them to determine the area load expansion capability. The authors of [36] study several methods of forecasting the load of the Greek power system.

2.4. Representative Load Shapes

The authors of the present work found some beneficial work on load classification and representative load shapes. For example, Refs. [37,38,39,40,41,42] all compare methods for determining the representative load shapes for groups of customers. Ambient temperature and categorical data are used by [43] to create clusters of transformers with similar load shapes and then that data are used to determine the impact on the insulation life. New tariff structures are developed by [44] based on a clustering algorithm and measures the authors developed.
There is some interesting research that allows users to set key parameters, such as EV penetration, to determine system impacts. For example, Ref. [45] clusters feeders and then allows for variation in the EV penetration. Similarly, Ref. [46] forecasts the load based on clustering and adjusts that forecast based on a questionnaire. Ref. [47] considers increases in PV penetration in Brazil. It allows users to set a PV level then places them with a Monte Carlo approach for evaluating transformer overcurrent probability.

2.5. State of the Art Summary

In summary, existing solutions are primarily focused on: (i) shorter-term solutions, such as day-ahead forecasts, for individual customer or circuit elements; (ii) longer-term forecasts for larger areas, such as countries, cities, substations, or circuits; or (iii) load classification to provide representative load shapes for study or use. For the evolving electrical system with expanded DERs and sophisticated microgrids, the aim of the state of the art must shift to provide longer time horizon forecasts for distribution circuit elements, and those forecasts must consider greater variation than traditionally applied deterministic approaches. The work that is presented in this document is focused on the evolving electrical distribution system, specifically the deployment of NWAs, networked microgrids with adaptive boundaries, and customer-owned DERs and EVs. Deploying these technologies has the promise of increasing capital efficiency, improving reliability, and supporting carbon emissions goals, but these benefits must be balanced with potential risks that could result from mismatches in supply and demand in the distribution system. To avoid these concerns, new methods are needed that expand past day-ahead or area forecasts that have been the focus of so much great research. Utilities have also typically been focused on deterministic views of load that focus on the peak load on assets based on annual assessments. Load forecasts that are several months to over a year in the future and on portions of distribution circuits are needed. In addition, to efficiently use these new technologies, traditional deterministic approaches must shift to stochastic methods. This is the focus of this work.

2.6. Influence on Current Work

The method described in this manuscript has been influenced by past research. The clustering precursor to load forecasting presented in [24,25] was helpful in shaping the overall process described in this paper. The PLCNet and three conv1d layer concepts presented in [8,9], respectively, were found to improve the results of the neural network element to be discussed. Load clusters and day stages used with Markov modeling to create state transition rules are described by [48]. The concept described in [48] is contemplated for future study and shaped some of the direction of the present work.

3. Method Overview and Development

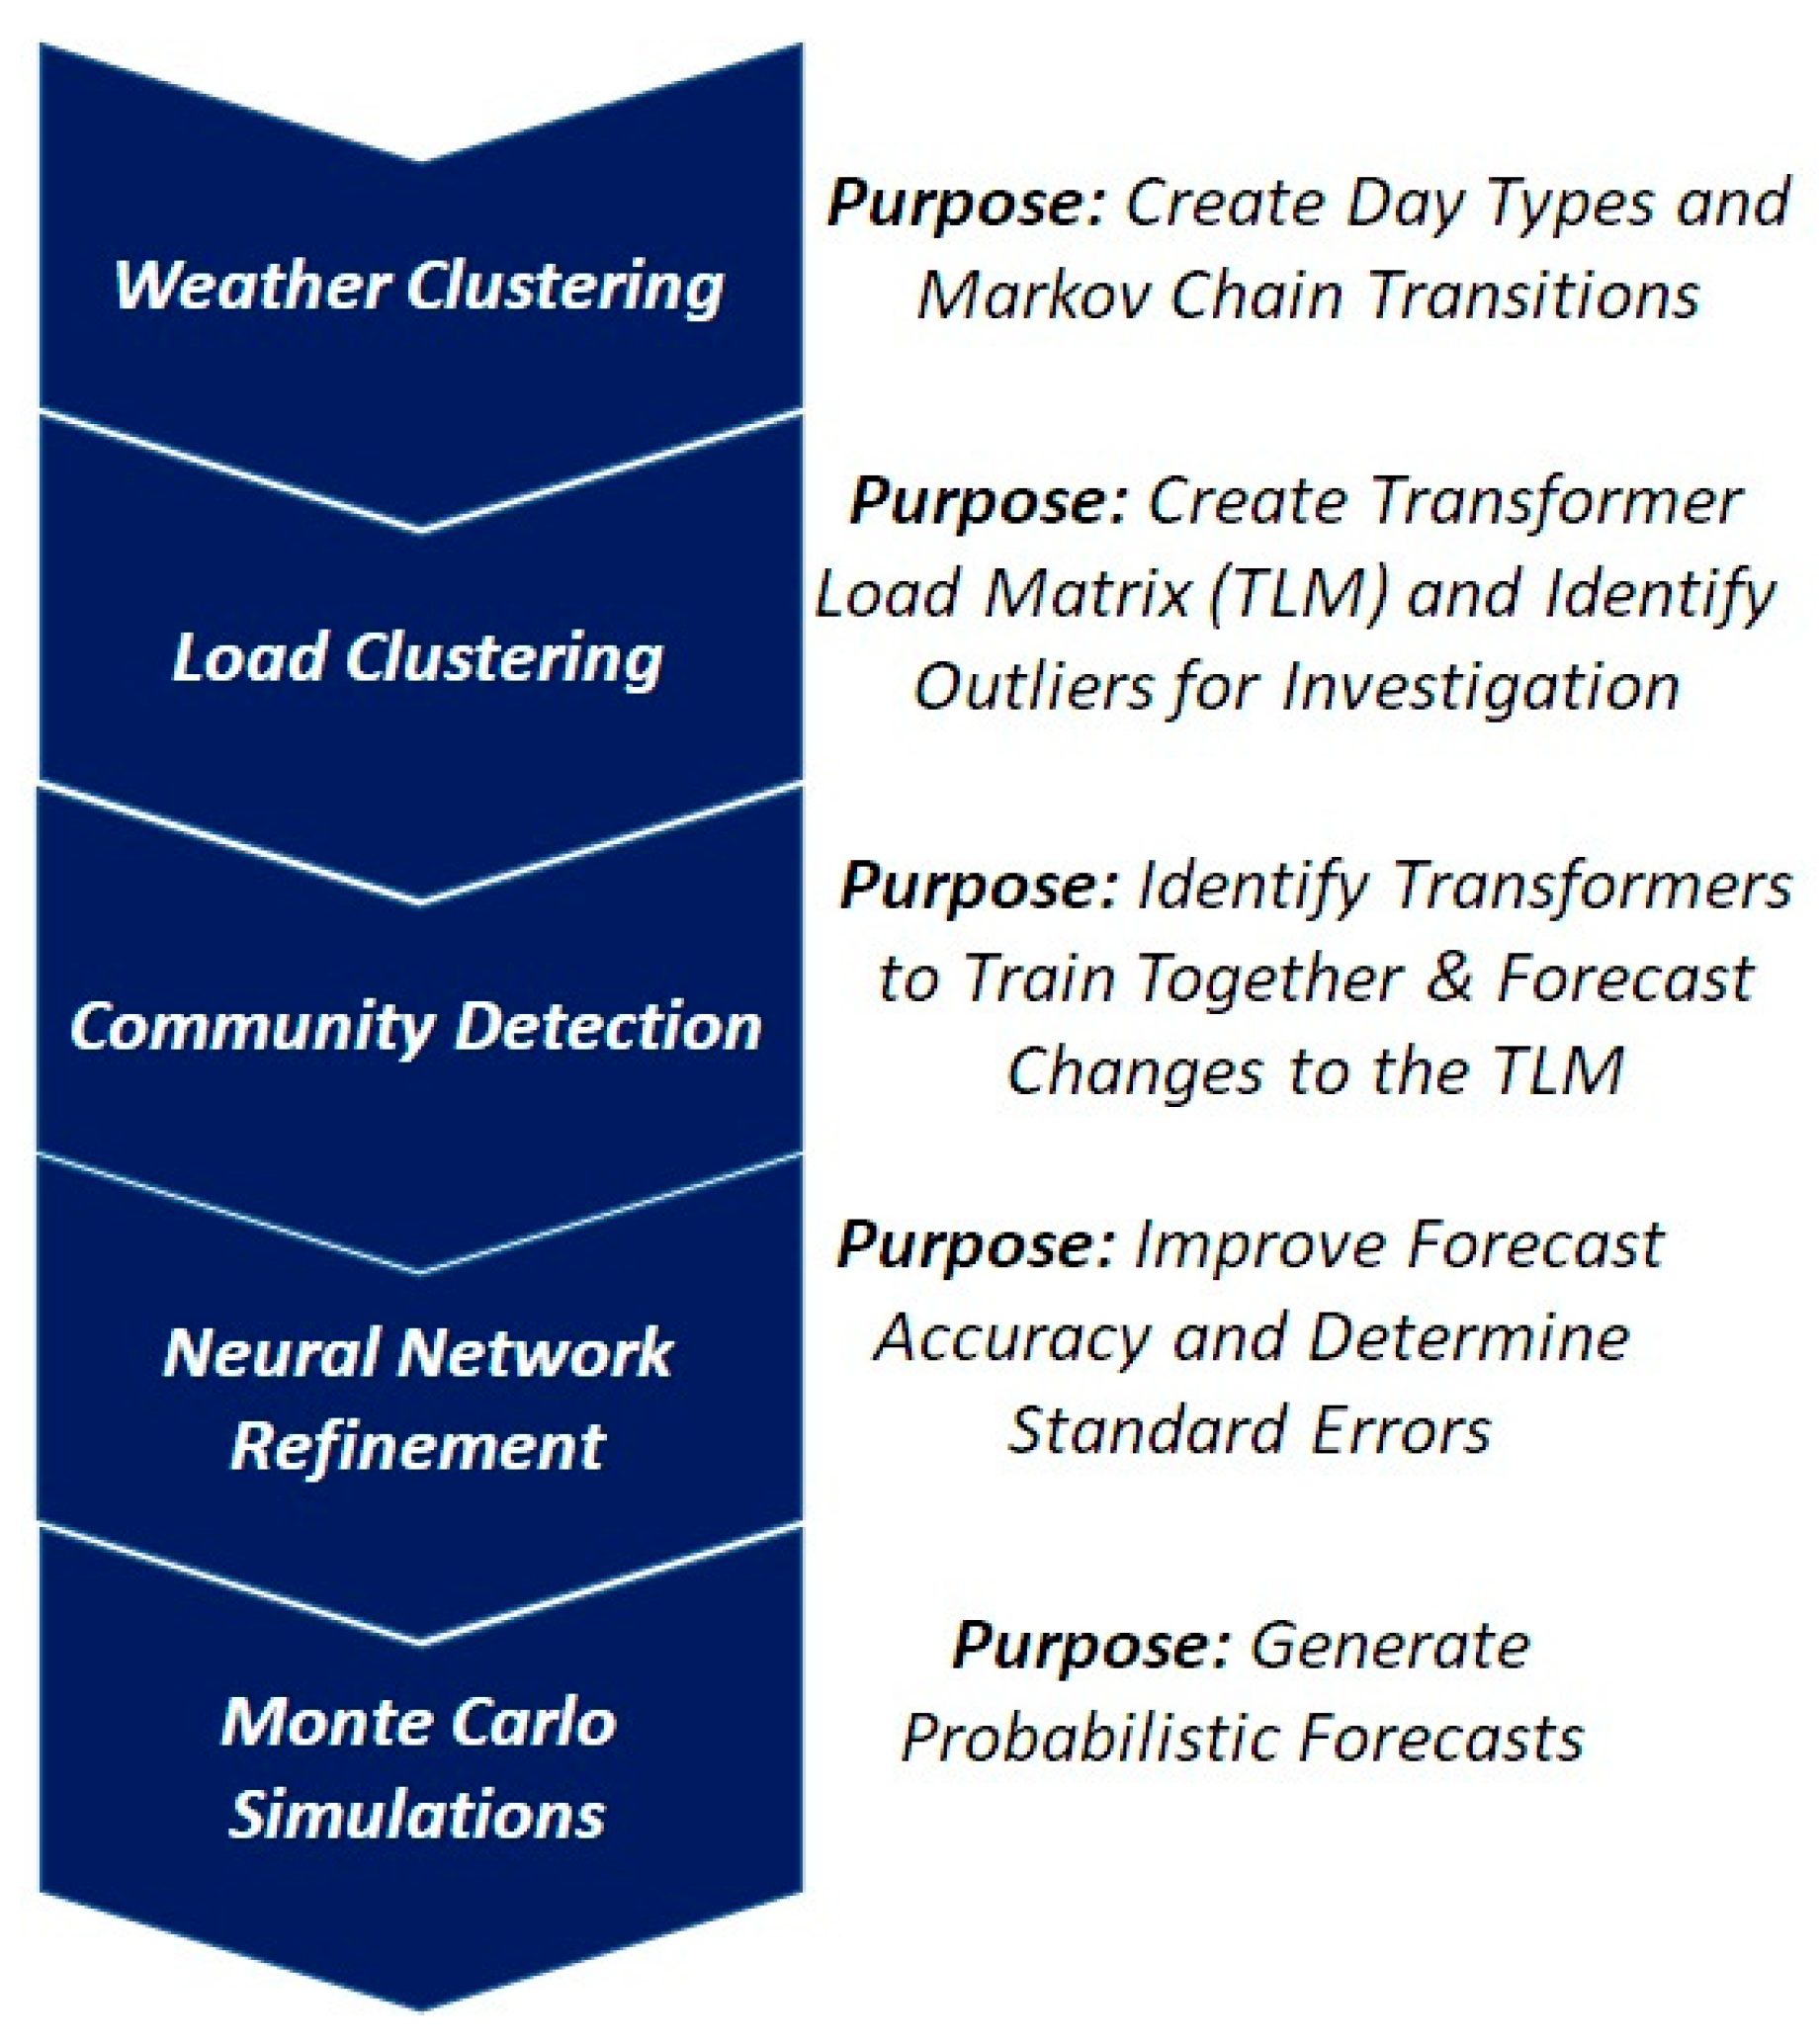
3.1. Method Overview

Considering the challenges of the evolving electrical system, the authors set objectives for developing a new method that focuses on developing (i) forecasts on circuit elements; (ii) forecasts months into the future; (iii) a scalable solution that is time efficient; and (iv) a stochastic method that provides a range of potential situations to be managed. Various forms of neural networks were originally contemplated by the authors, but it was realized that evaluation would be needed before training. First, analysis of the data is needed to establish the framework to step through the Monte Carlo simulations in a time-efficient and effective manner. Second, to meet the need for longer time horizon forecasts for circuit elements, the authors recognized the need for additional support for the neural network. Third, all these early processing steps would have to be performed with a time-efficient method to provide a scalable solution. For the second and third points, the authors recognized the need to leverage Graphics Processing Unit (GPU) computing for the training process and were inspired by attention methods [49] to improve the accuracy and processing time. The resulting overall multistep method is illustrated in Figure 1. The following sections and the rest of this manuscript will elaborate on this process.

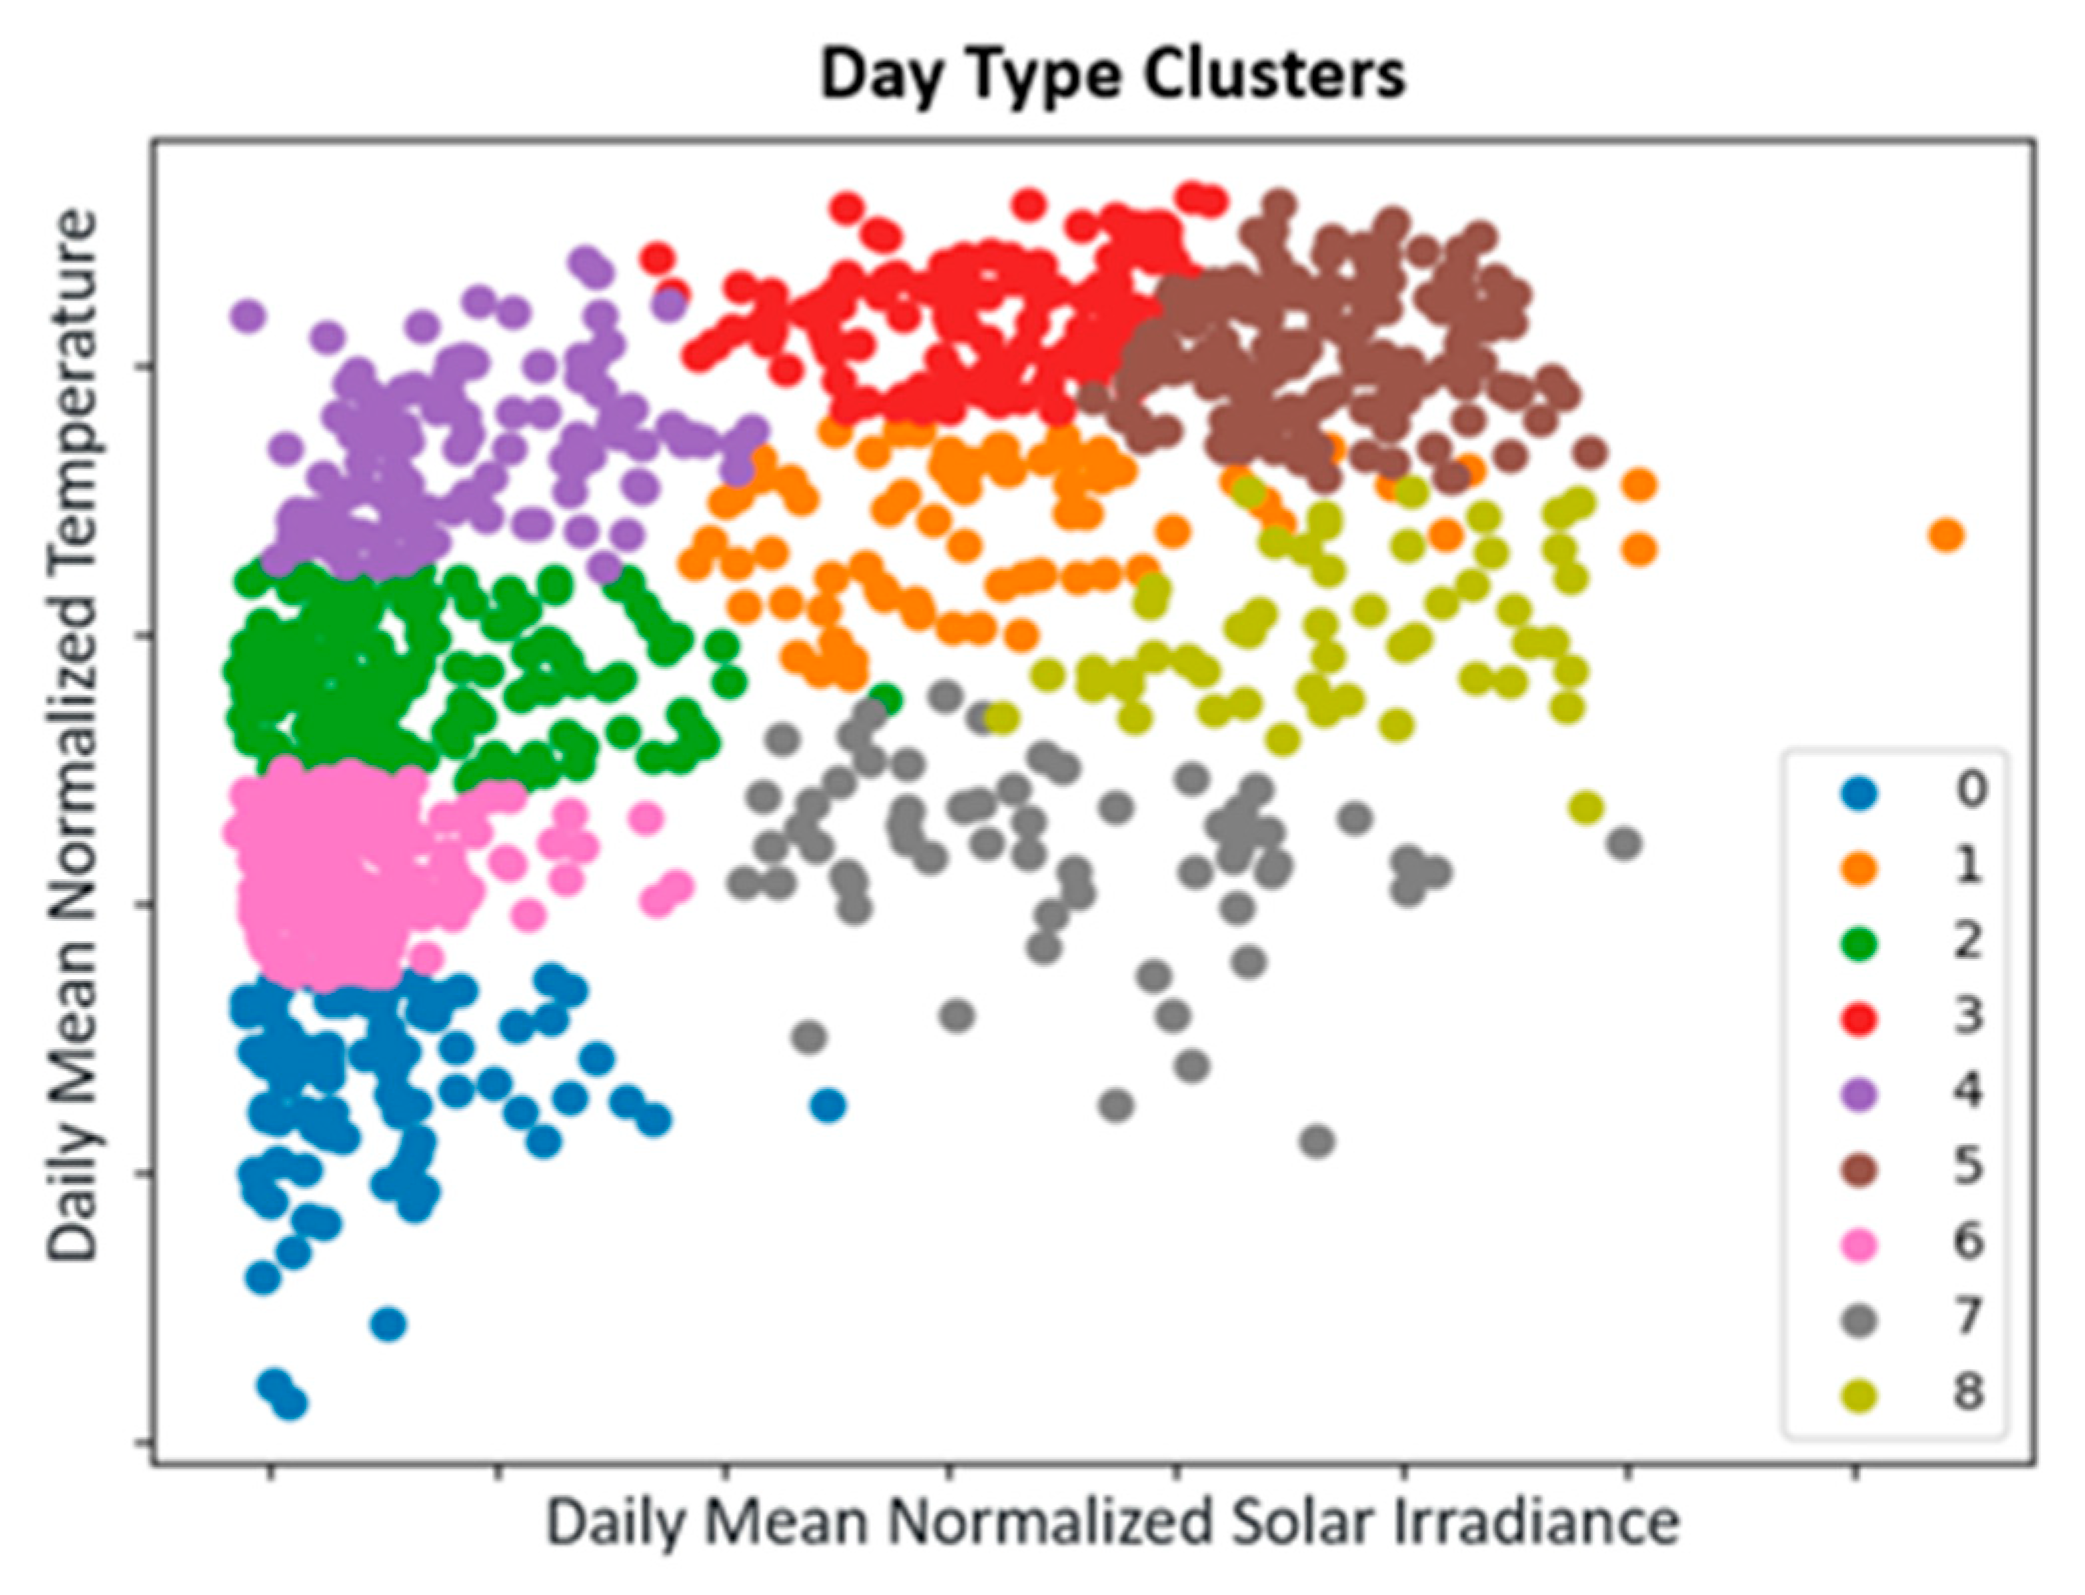
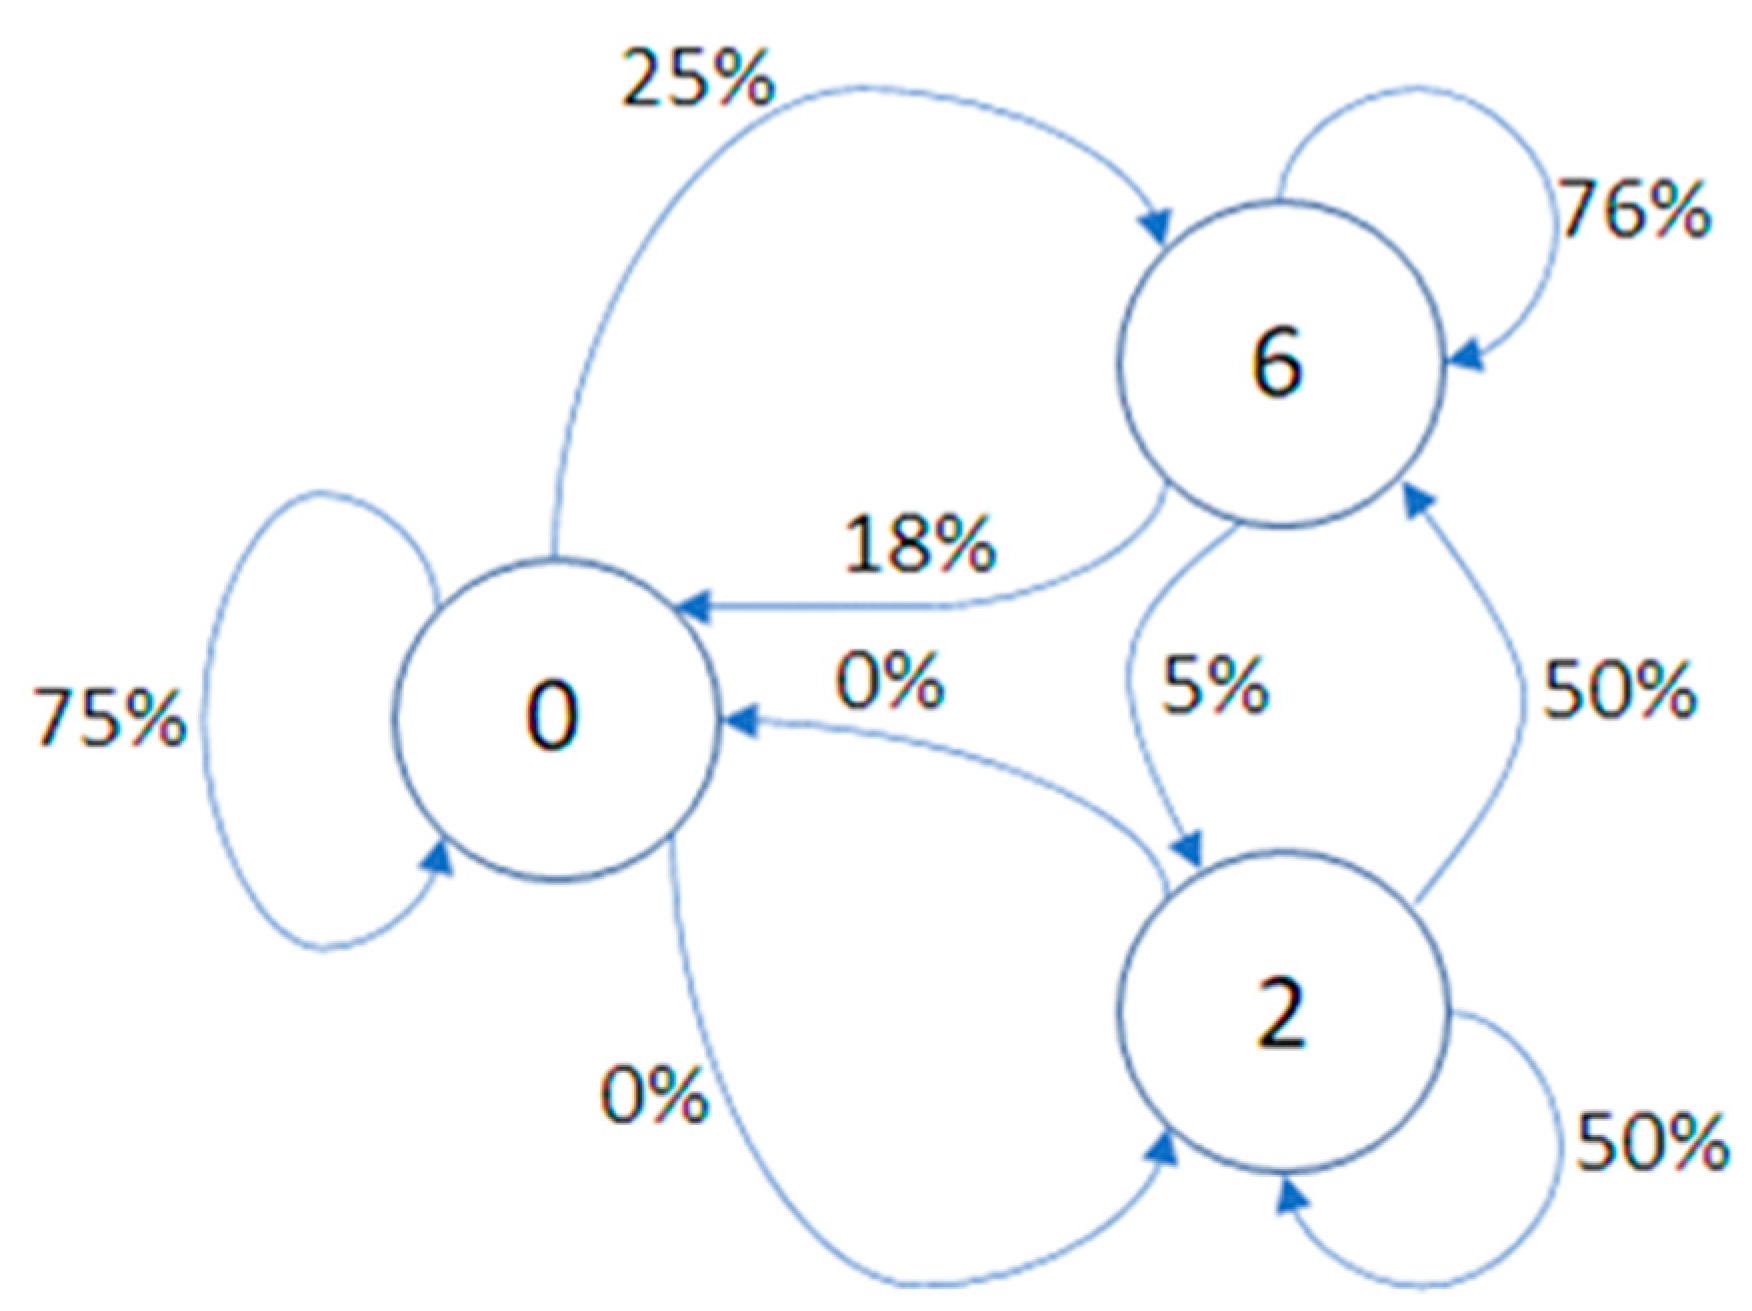
3.1.1. Weather Clustering

The Weather Clustering element determines the day types based on weather conditions, specifically the temperature, solar irradiance, and dew point. These day types have two purposes. First, they provide a logical framework to sequence through the Monte Carlo simulations with variations of the parameters within the day type. Next, they provide common weather conditions to consider the load on transformers.

3.1.2. Load Clustering

The Load Clustering element first groups transformers together with similar load patterns on each day type. Next, it develops an initial forecast for each transformer for each day type. These initial forecasts provide the basis for the attention methods to be used in the following steps.

3.1.3. Community Detection

The frequency with which transformers have similar load patterns on different day types can be used in Community Detection algorithms. Transfer learning within the detected communities can reduce the overall training time.

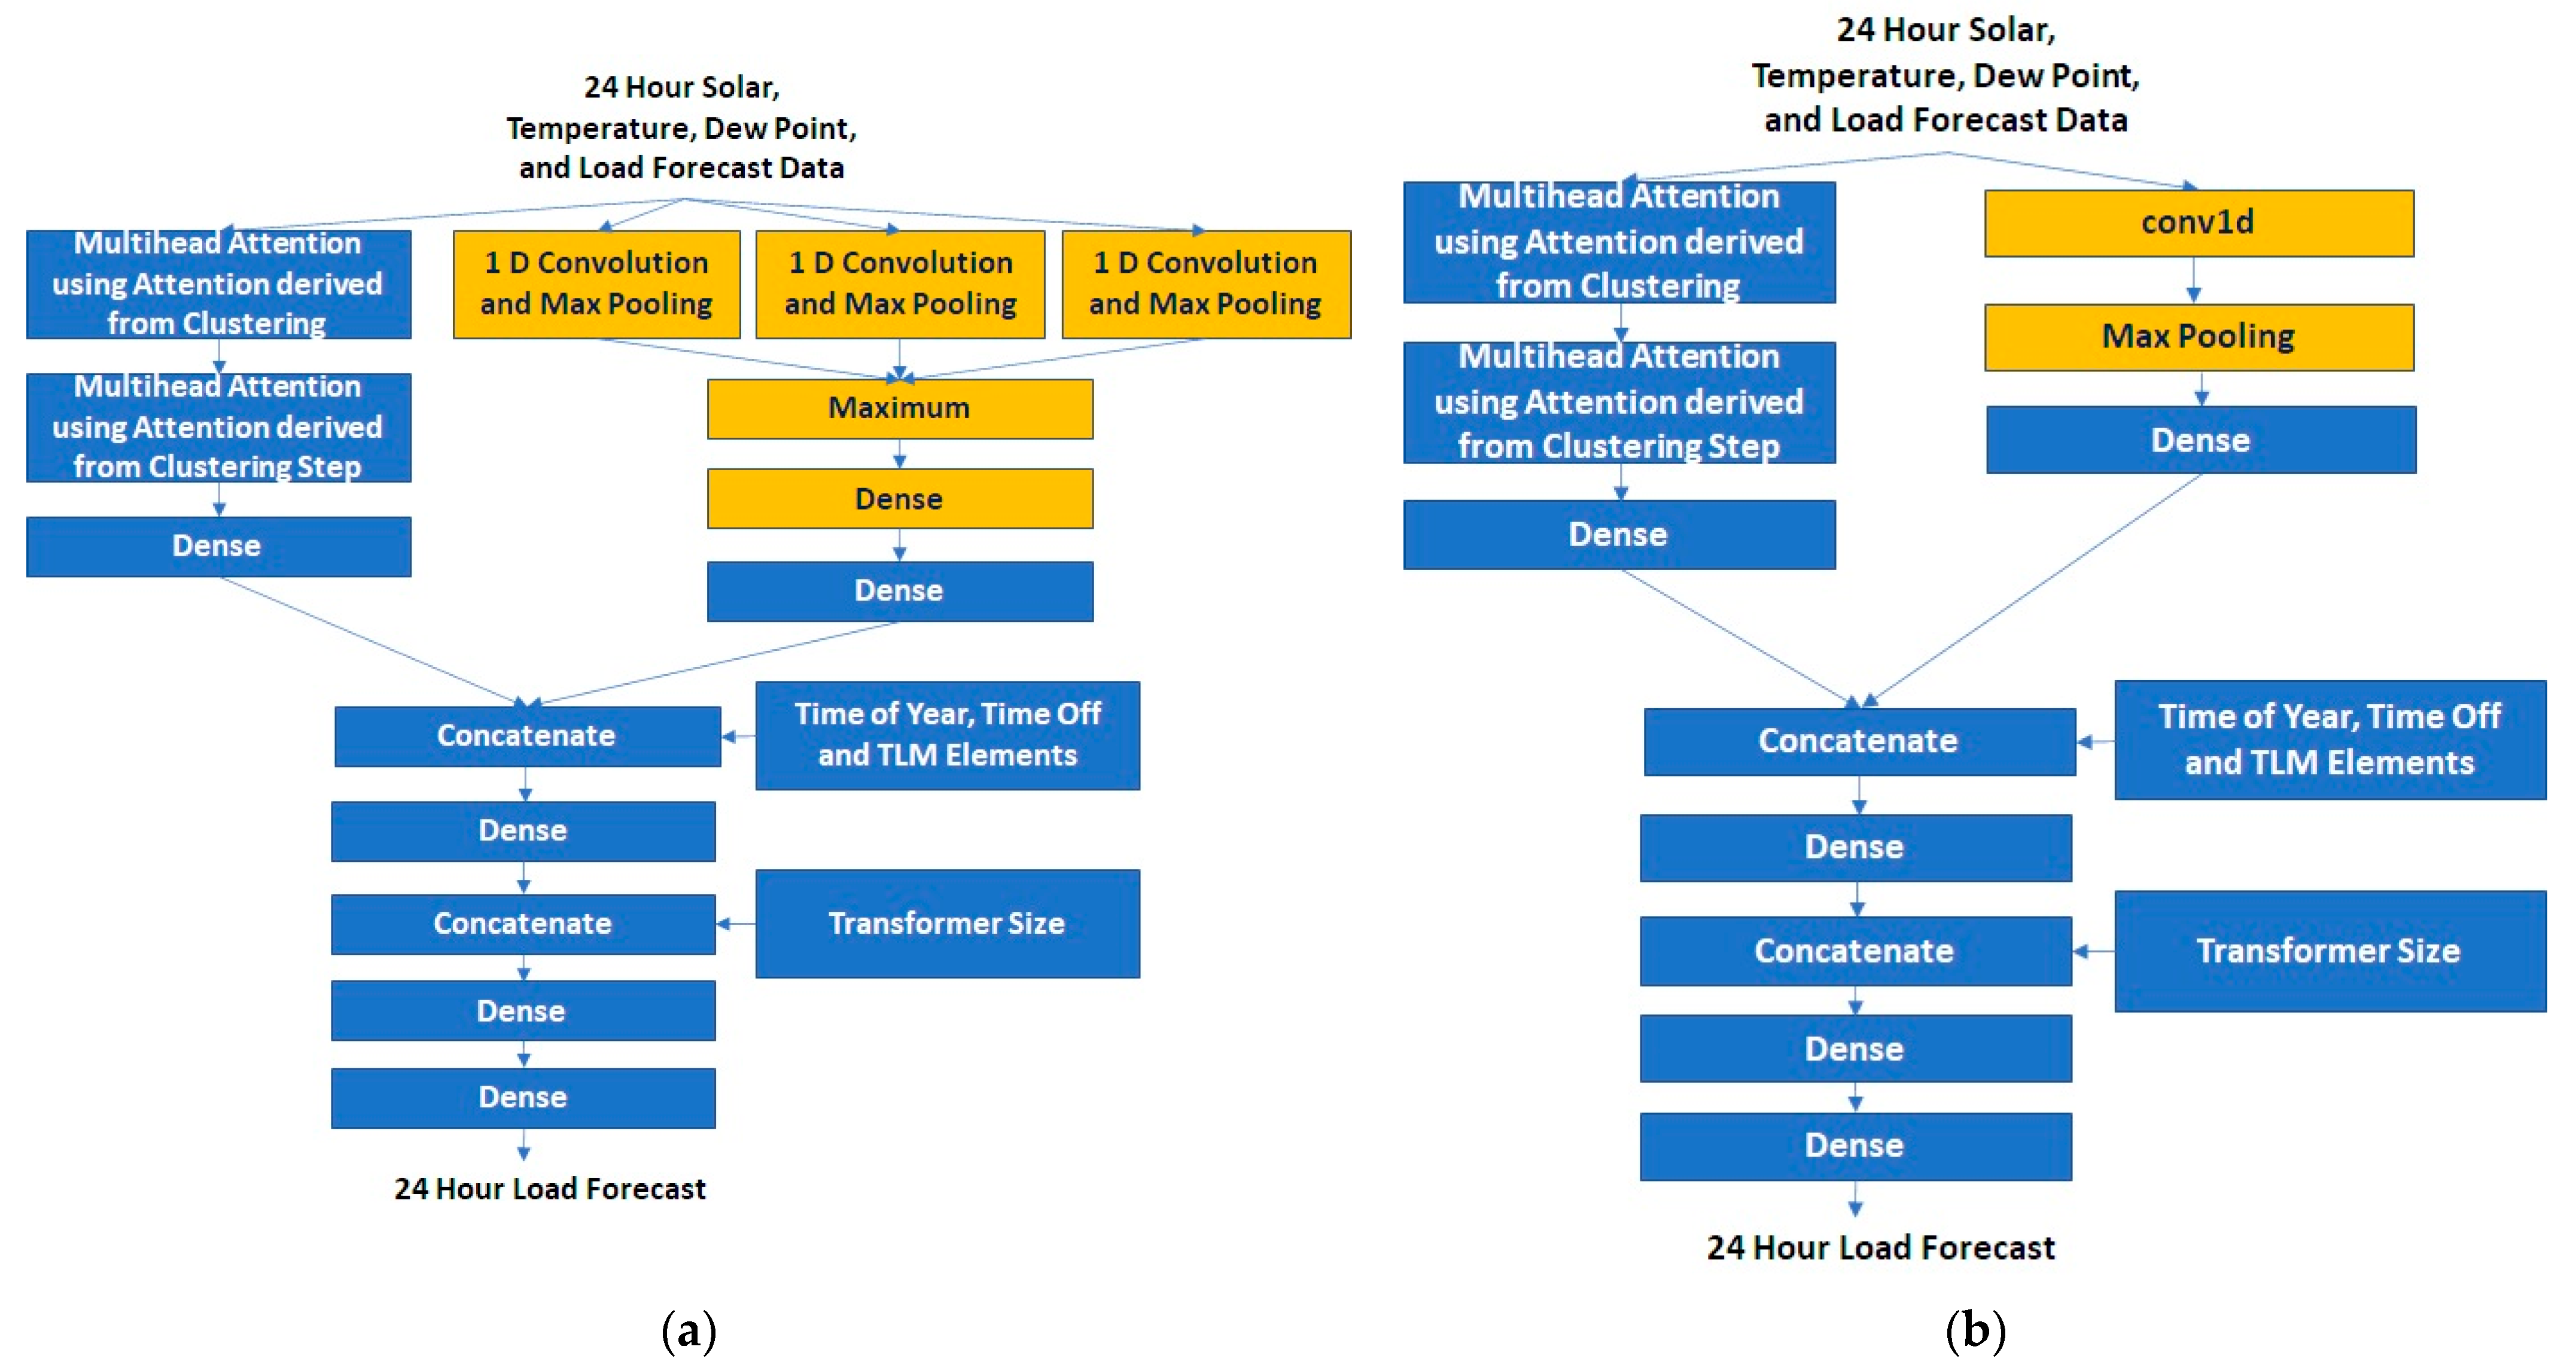
3.1.4. Neural Network Refinement

All the earlier steps are combined in attention-focused neural networks in the Neural Network Refinement element. It uses the initial forecast from the Load Clustering element as a starting point and then uses the determined attention with transfer learning within the identified communities to produce the results.

3.1.5. Monte Carlo Simulations

The previous steps of this method have been developed to support Monte Carlo simulations in future work. The Monte Carlo simulations will consider the proper use of computer hardware, such as the Central Processing Unit (CPU), memory, and GPU, for time-efficiency and scalability considerations. The results of the Monte Carlo simulations will be used for the engineering analysis, including a focus on identifying potential transformer failures, reliability concerns, power quality issues, and protection problems. The Monte Carlo simulations will also be used for designing NWA solutions, microgrids, and ANMs. Integrating the engineering analysis and Monte Carlo simulations will again be critical for time efficiency and scalability.

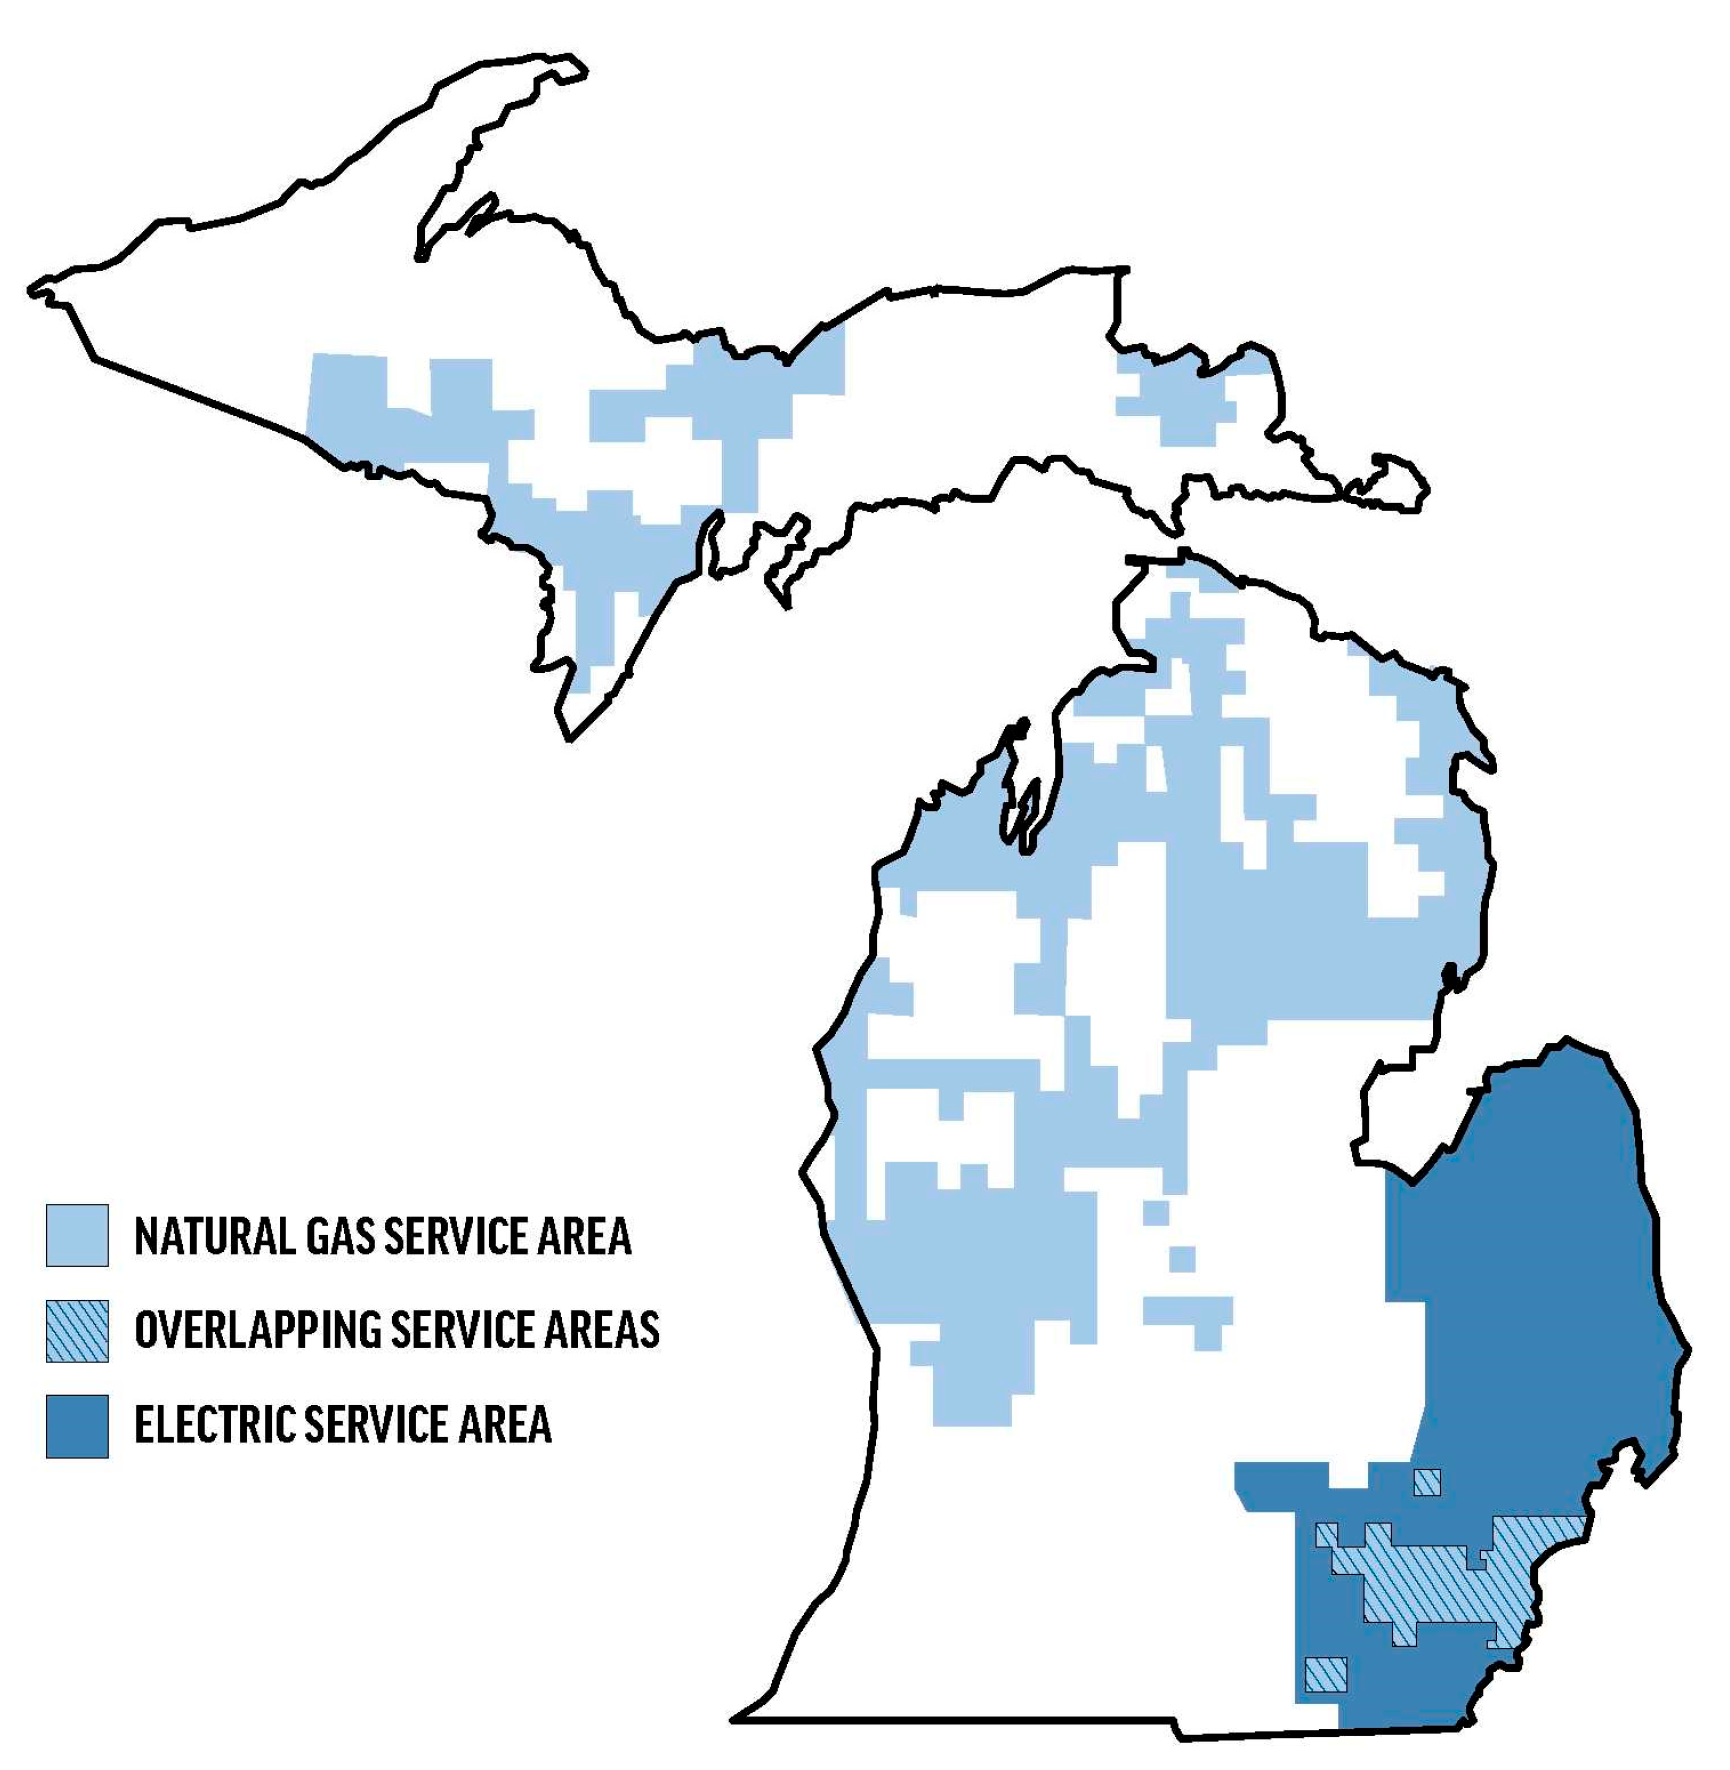
3.2. Development Approach and Datasets

These methods have been carefully and thoroughly developed and tested with multiple techniques and extensive datasets to identify the best balance of accuracy and training time. The datasets consist of the load from over 1000 distribution transformers. There are a variety of transformers in the dataset, including single-phase and three-phase transformers, overhead and underground transformers, primary voltages of 4.8 kV ungrounded delta and 13.2 kV grounded wye, and capacities less than 1500 kVA. The data were collected over approximately two and a half years in two areas approximately 130 miles apart in DTE Electric’s service territory (Figure 2). Area 1 is a suburban area, and Area 2 is a rural area.
The load is normalized by the transformer capacity, as illustrated in Figure 3.

4. Weather and Load Clustering

4.1. Purpose

The purpose of these steps is to group transformers by characteristics for further analysis, transfer learning, forecasting, and change identification. It provides initial forecasts and identifies problematic areas for attention in future steps. The weather clustering steps also provide the framework to be used in the Monte Carlo simulations.

4.2. Influence of Weather

Weather, among other factors, heavily influences electrical load. For that reason, the authors first take steps to determine days with similar weather. This work was originally based on hourly temperature and solar irradiance data only. After the initial work, dew point was found to be a good addition to improve accuracy.
Piecewise Aggregate Approximation (PAA) was used with the hourly temperature, solar irradiance, and dew point data for dimensionality reduction prior to K-Means clustering. The number of clusters was planned as an independent variable for the following steps. Figure 4 provides an example of the results of the day clustering with only solar irradiance and temperature considered (dew point was added after the initial work).
Considering the z-scores for the solar irradiance (S), ambient temperature (T), and dew point (D) for each day d in the period under investigation, that day has a combination of solar irradiance, temperature, and dew point represented by d ( S , T , D ) . Each 24 h data point is converted into a PAA equivalent with m segments using the following for S. The same method is applied for T and D.
S s 1 , s 2 , s 3 , s n s i R ,   i = 1,2 , , n n = 24   i n   t h e   p r e s e n t   a p p l i c a t i o n S s 1 , s i , , s m s j R , j = 1,2 , , m   w i t h   m n m = 6   i n   t h e   p r e s e n t   a p p l i c a t i o n
These data are used to determine a unique day-type index ( d t ) via K-Means clustering with a specific number of clusters ( n d n u m b e r _ o f _ d a y _ t y p e s ) . These day types will be used for further analysis.
[ d ( S , T , D ) ] !   d t [ d t = k m e a n s ( d ( S , T , D ) ) ] d t Z , 0 d t < n d
where k m e a n s ( d ( S , T , D ) ) is the cluster index that results for a point represented by (S′, T′, D′) after clustering all the days in the period under investigation.
Contemplating a method that would be used for stochastic forecasts, Markov chains were developed to be used for transitions that will be used in Monte Carlo simulations in the future. Figure 5 shows an example of the results for January. In Figure 5, a set of day types present in January is included as the nodes (represented by indices 0, 2, 6 in this example), and the probability of transitioning between these day types is represented by the percentages on the edges.

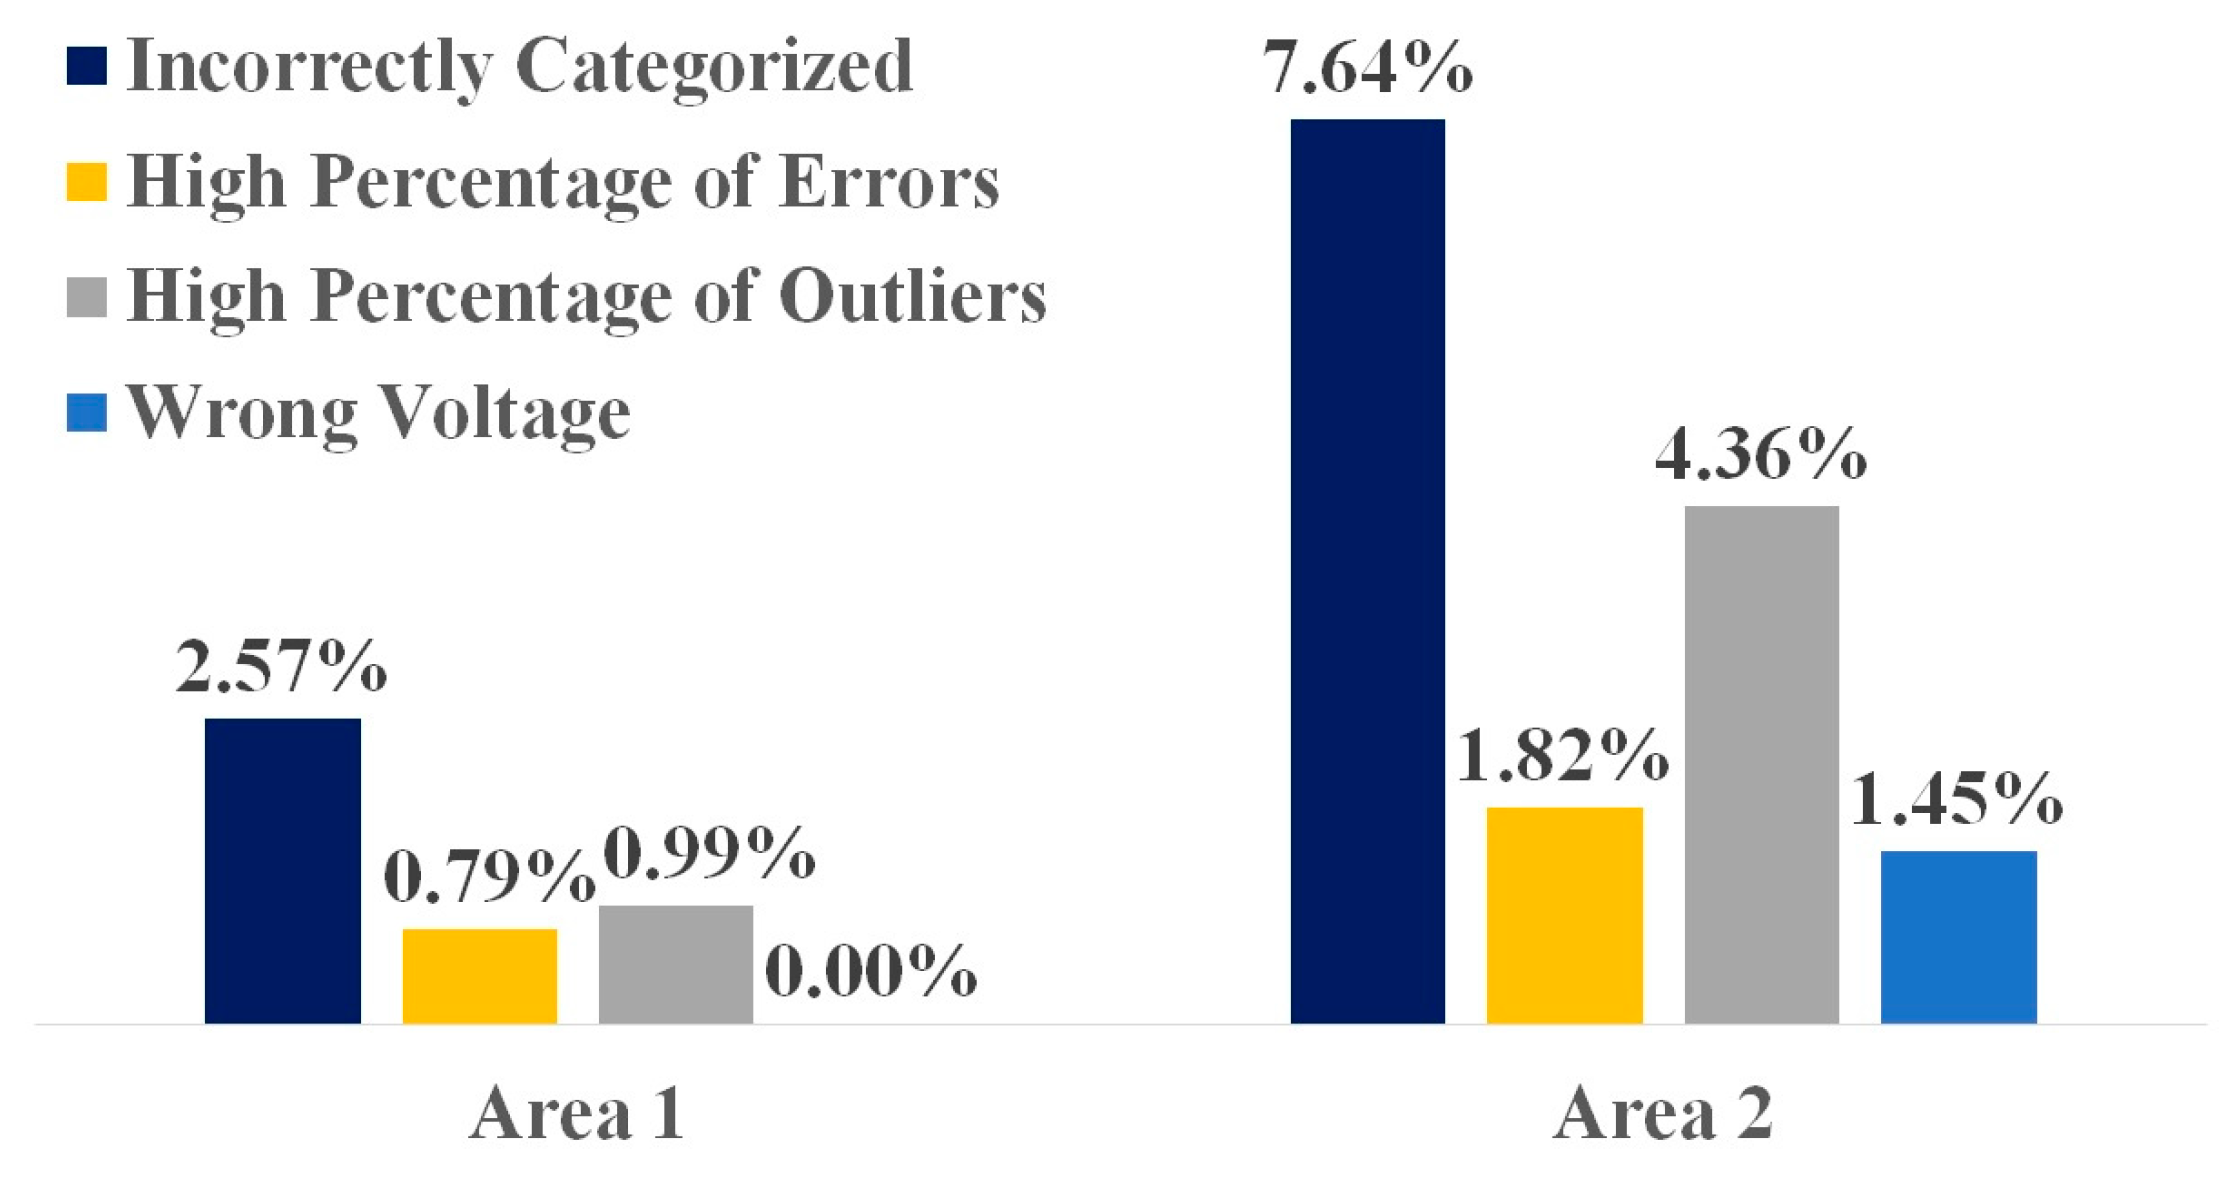
4.3. Error and Outlier Detection and Correction

The Local Outlier Factor (LOF) method, as described in [50], was used to highlight data issues for additional investigation and correction. This resulted in correcting several errors in system databases, as illustrated in Figure 6. “Incorrectly Categorized” are transformers that have the wrong number of phases and/or overhead/underground categorization. “High Percentage of Errors” refers to clearly incorrect data, such as transformers with the real power being higher than the apparent power reading. “High Percentage of Outliers” refers to the designation of the transformer determined from the LOF analysis. “Wrong Voltage” refers to transformers in an area served by a different primary voltage, for example, a 13.2 kV transformer served from a 4.8 kV area. Additionally, the impact of moving meters between locations had to be considered to provide accurate load data.

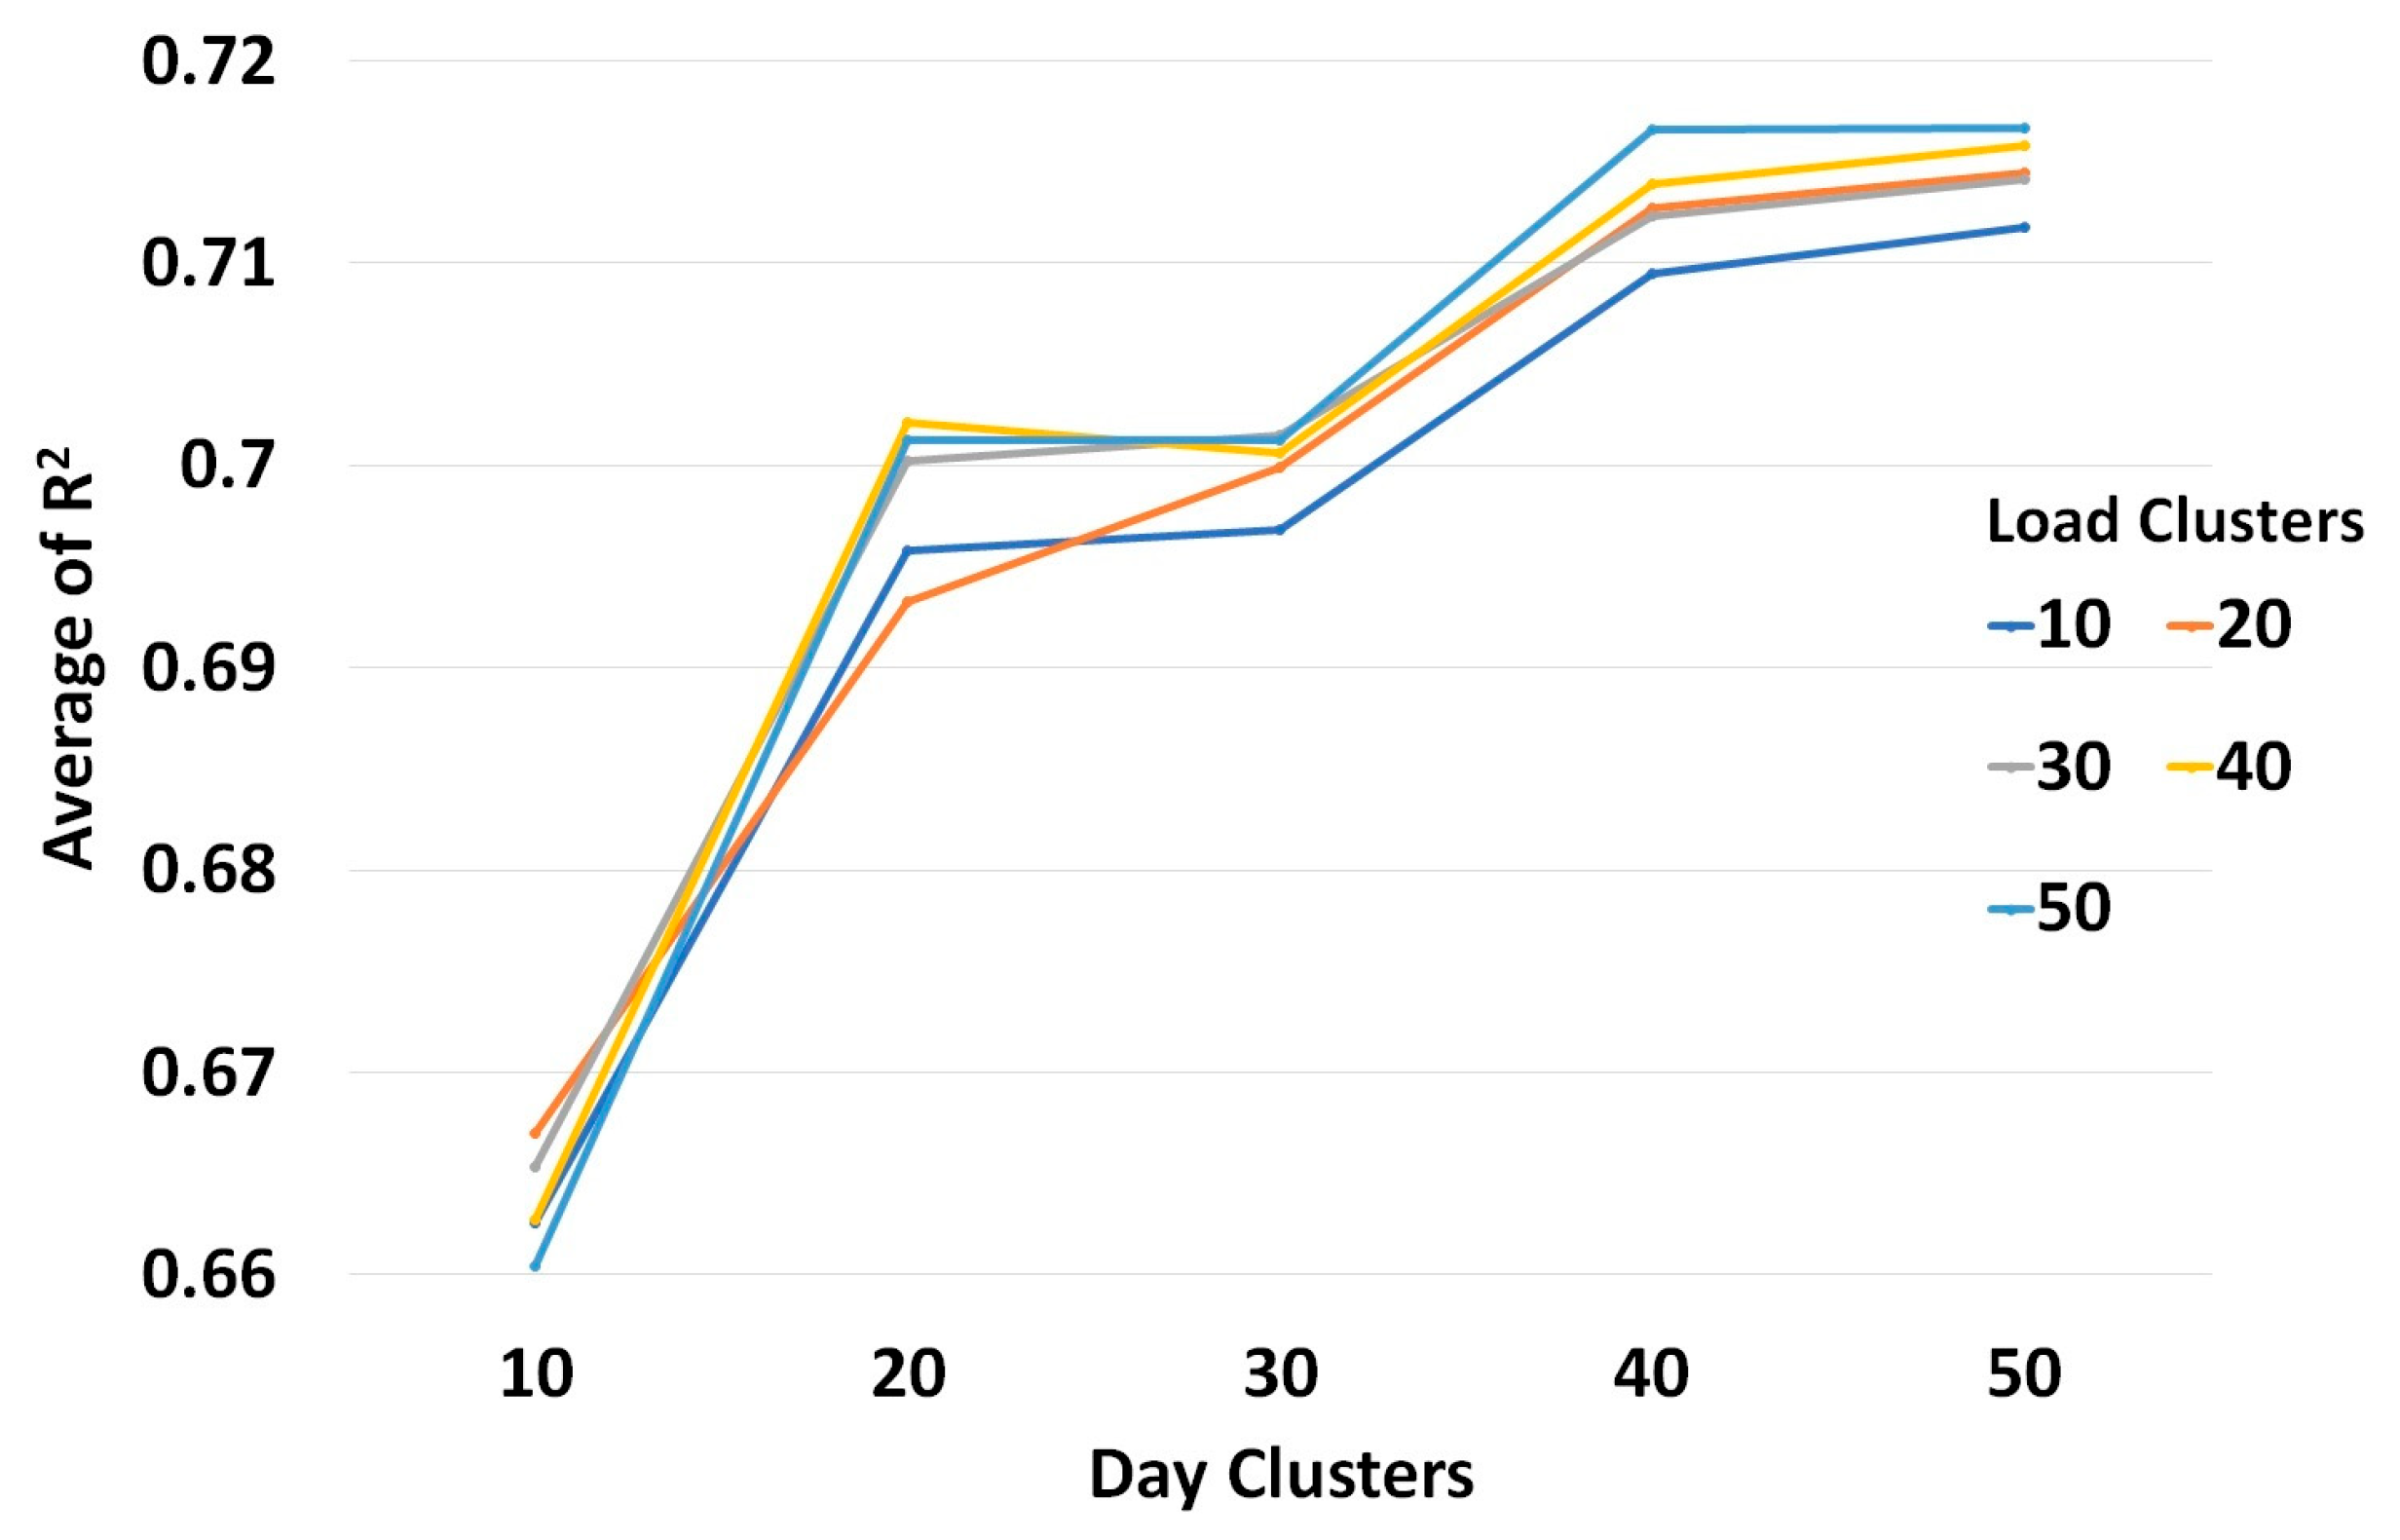
4.4. Clustering Methods for Load

The authors intended to identify a method suitable for the purpose by testing several with the number of day clusters and the number of load clusters as key inputs. The factors for evaluation were focused on the accuracy of fit using the R2 and processing time, considering a scalable method is desired.
Several methods have found success in the literature, including k-shape clustering in [51,52]; DTW in [24,38,48]; Agglomerative Clustering in [4]; Principal Component Analysis in [4,33,48]; and PAA and Slopewise Aggregate Approximation in [38,39]. Figure 7 provides an example of the output for one method tested.
In the end, K-Means clustering with PAA was selected as the most promising method and used for further analysis (details of the experiments are provided in Section 6—Results and Comprehensive Model in this document) [53,54,55,56].

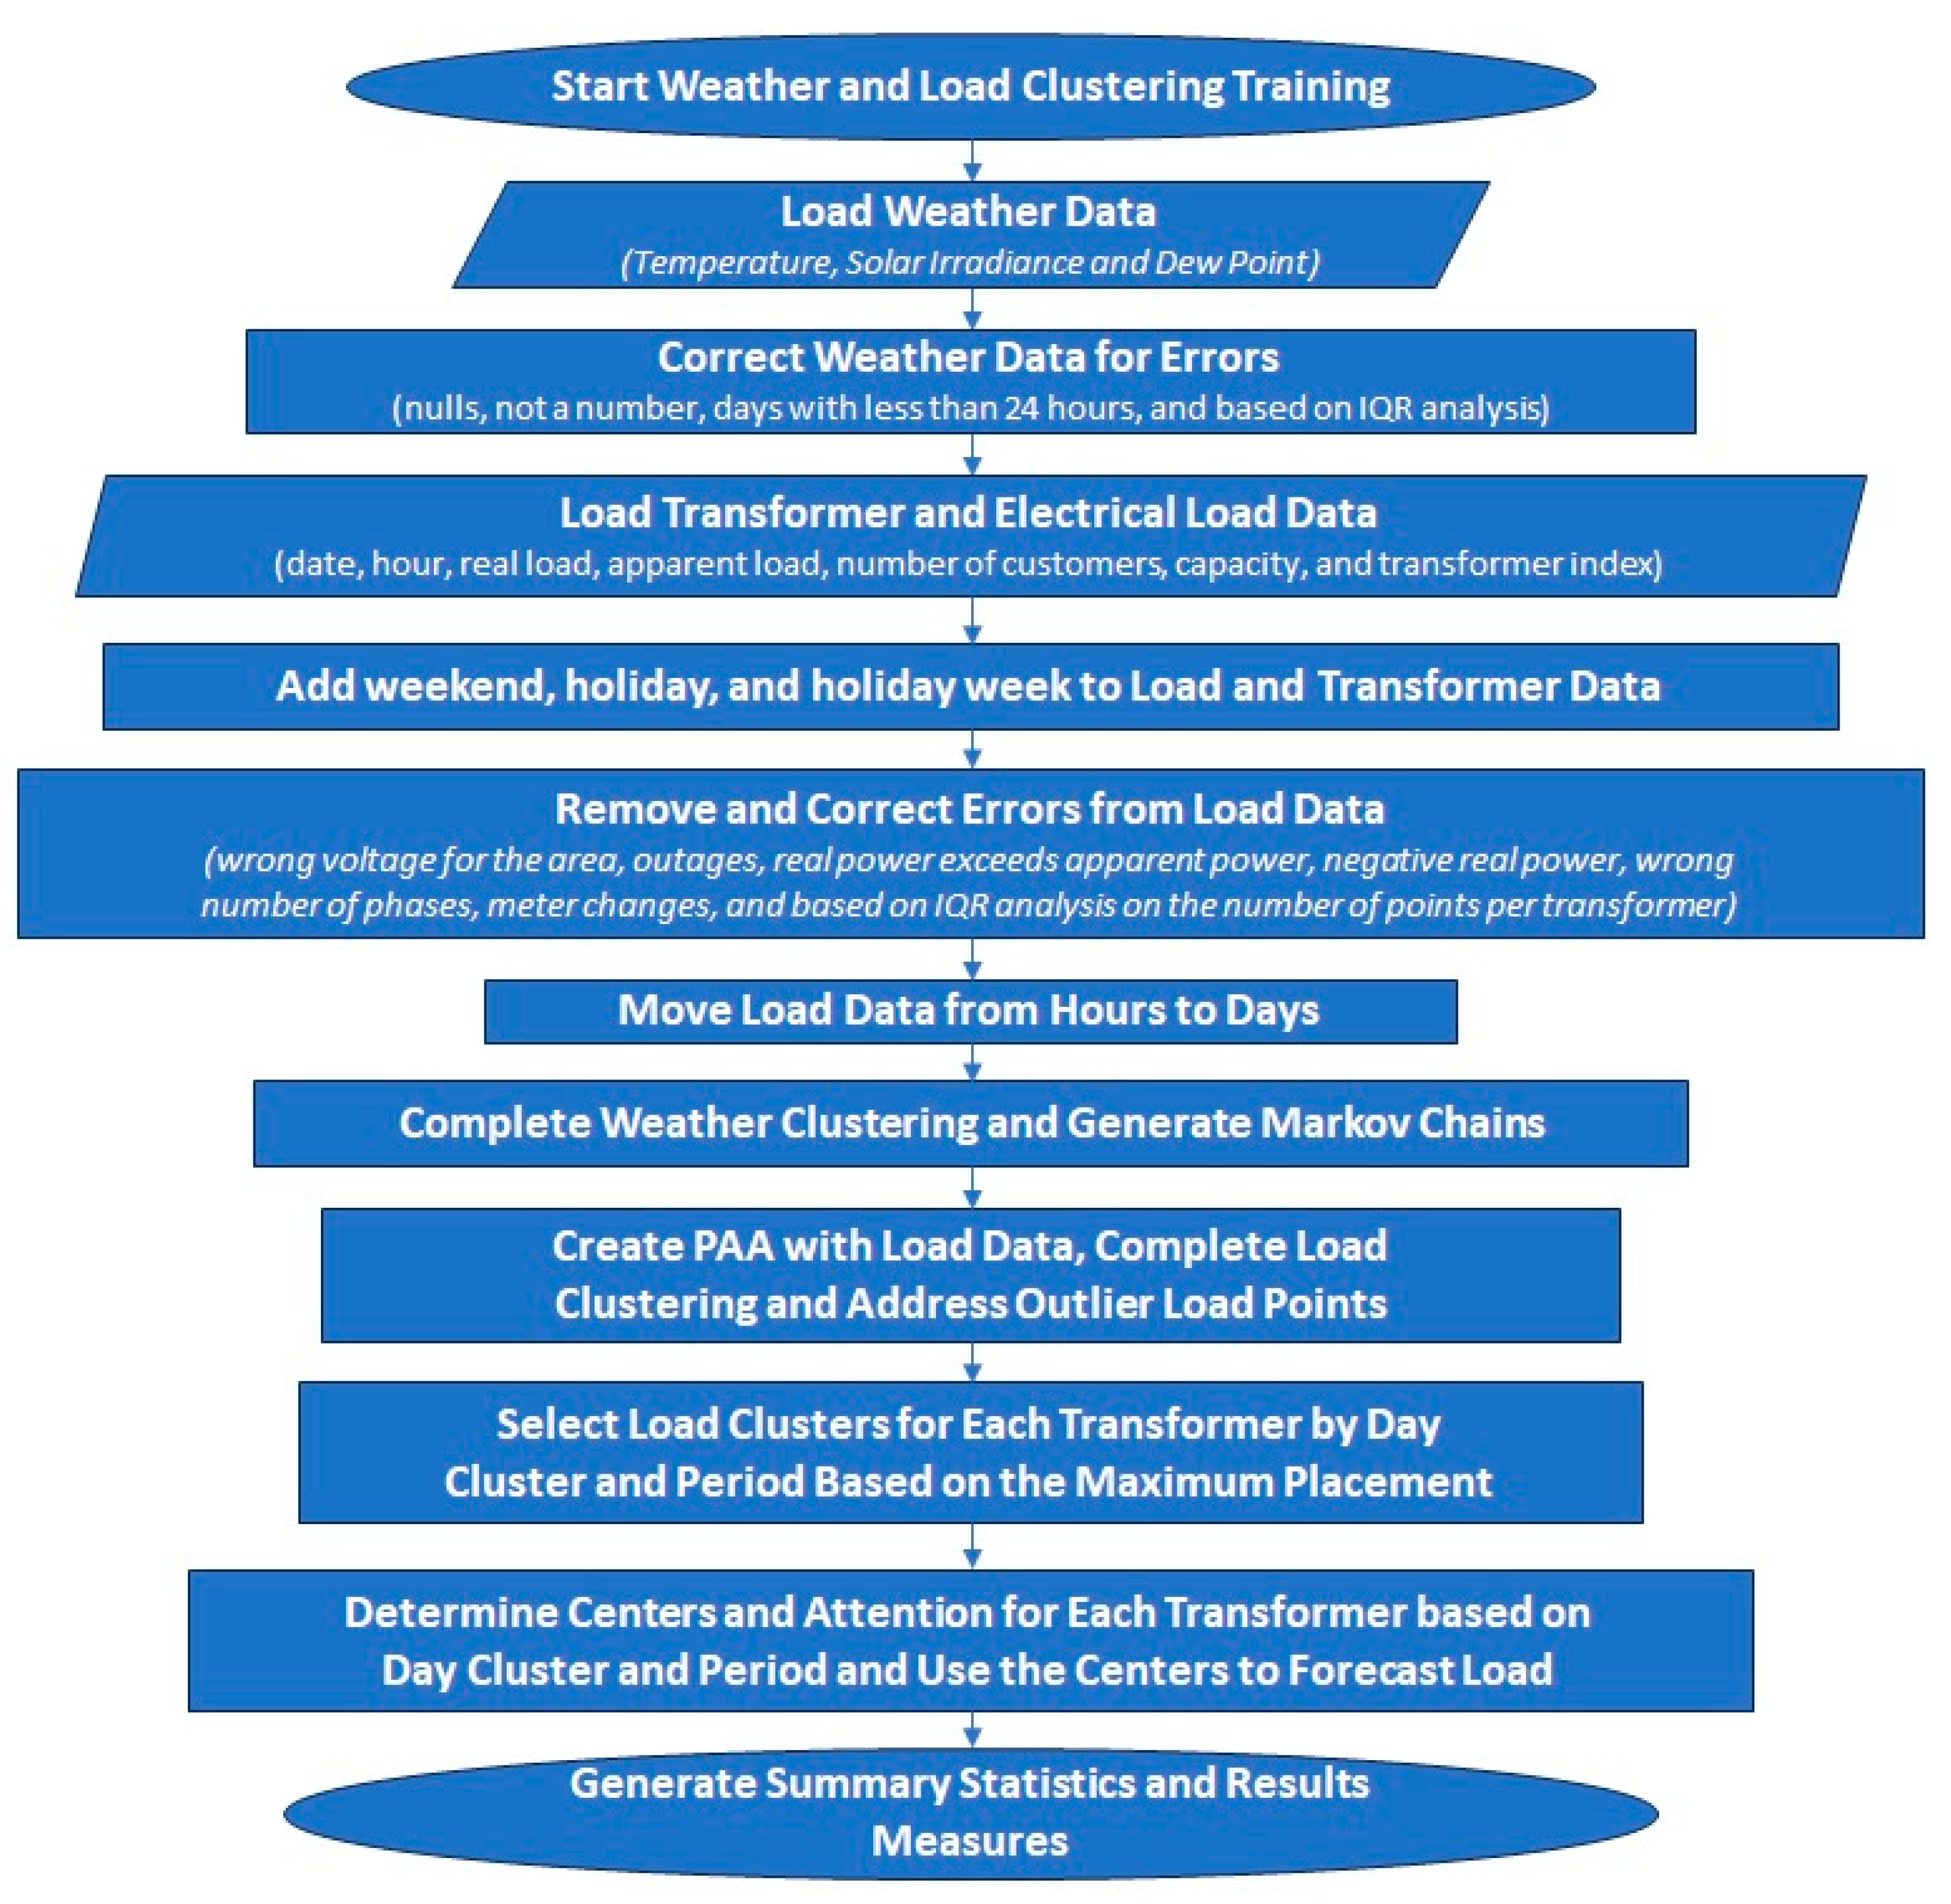
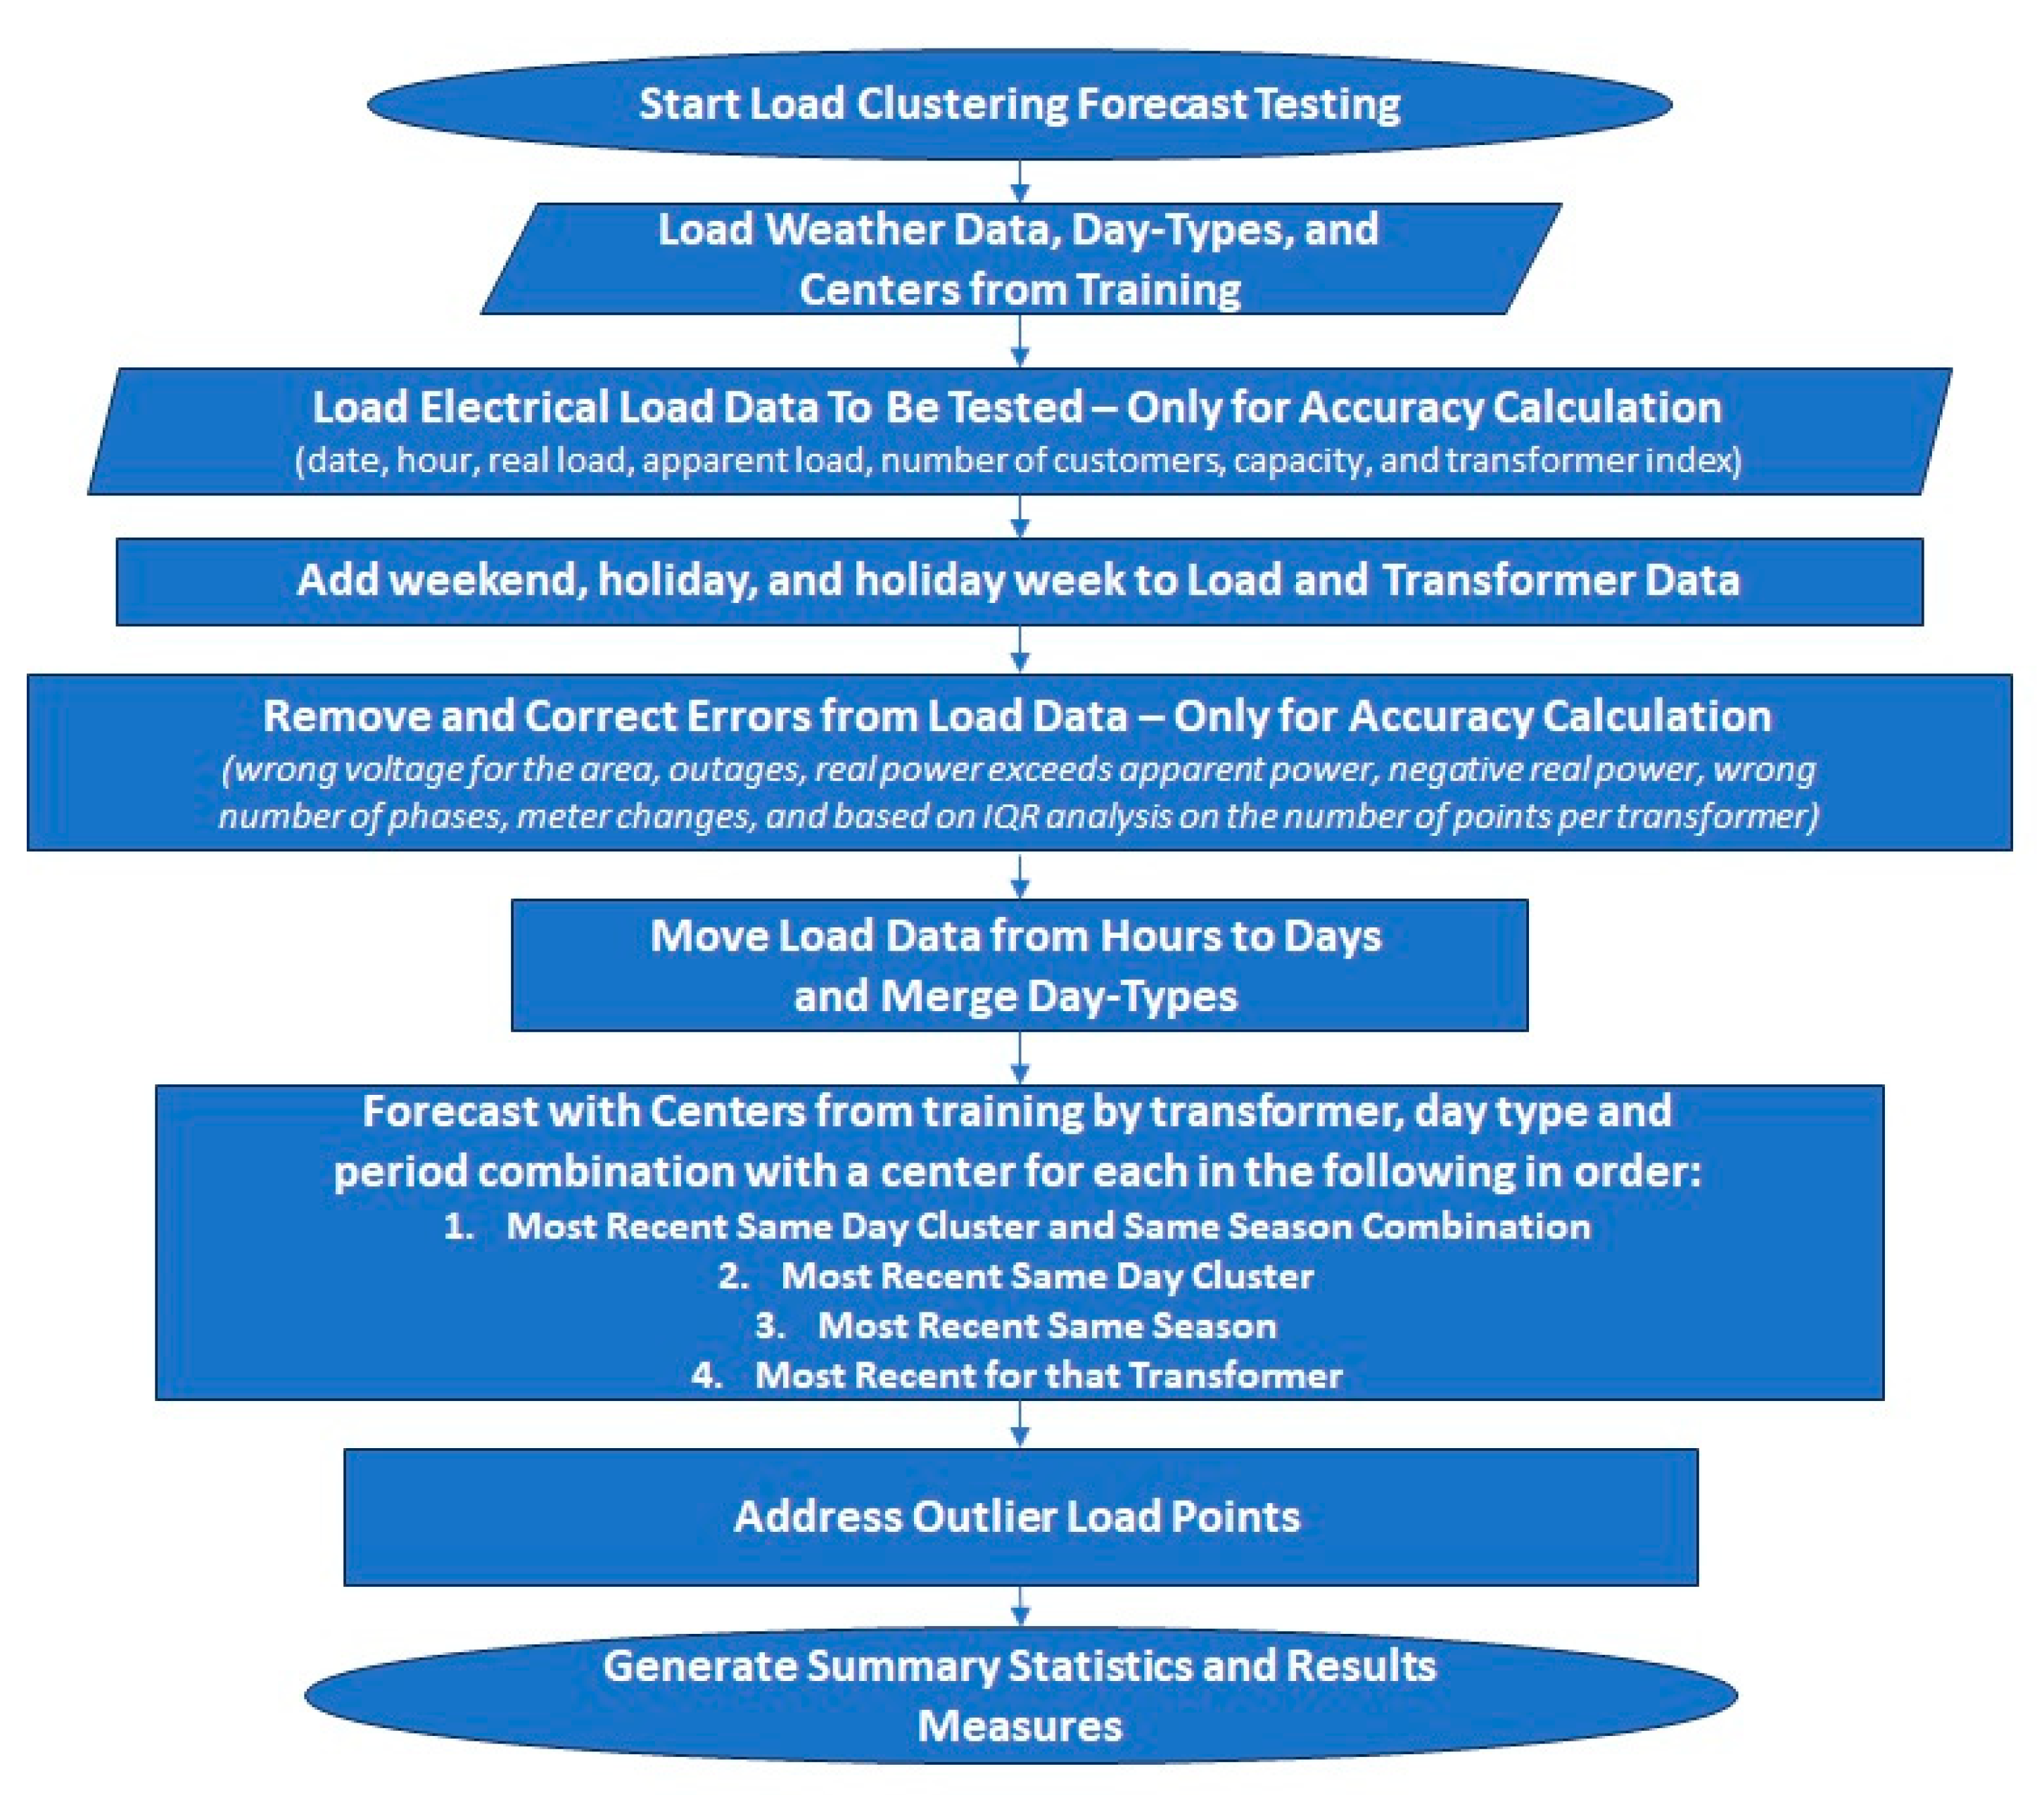
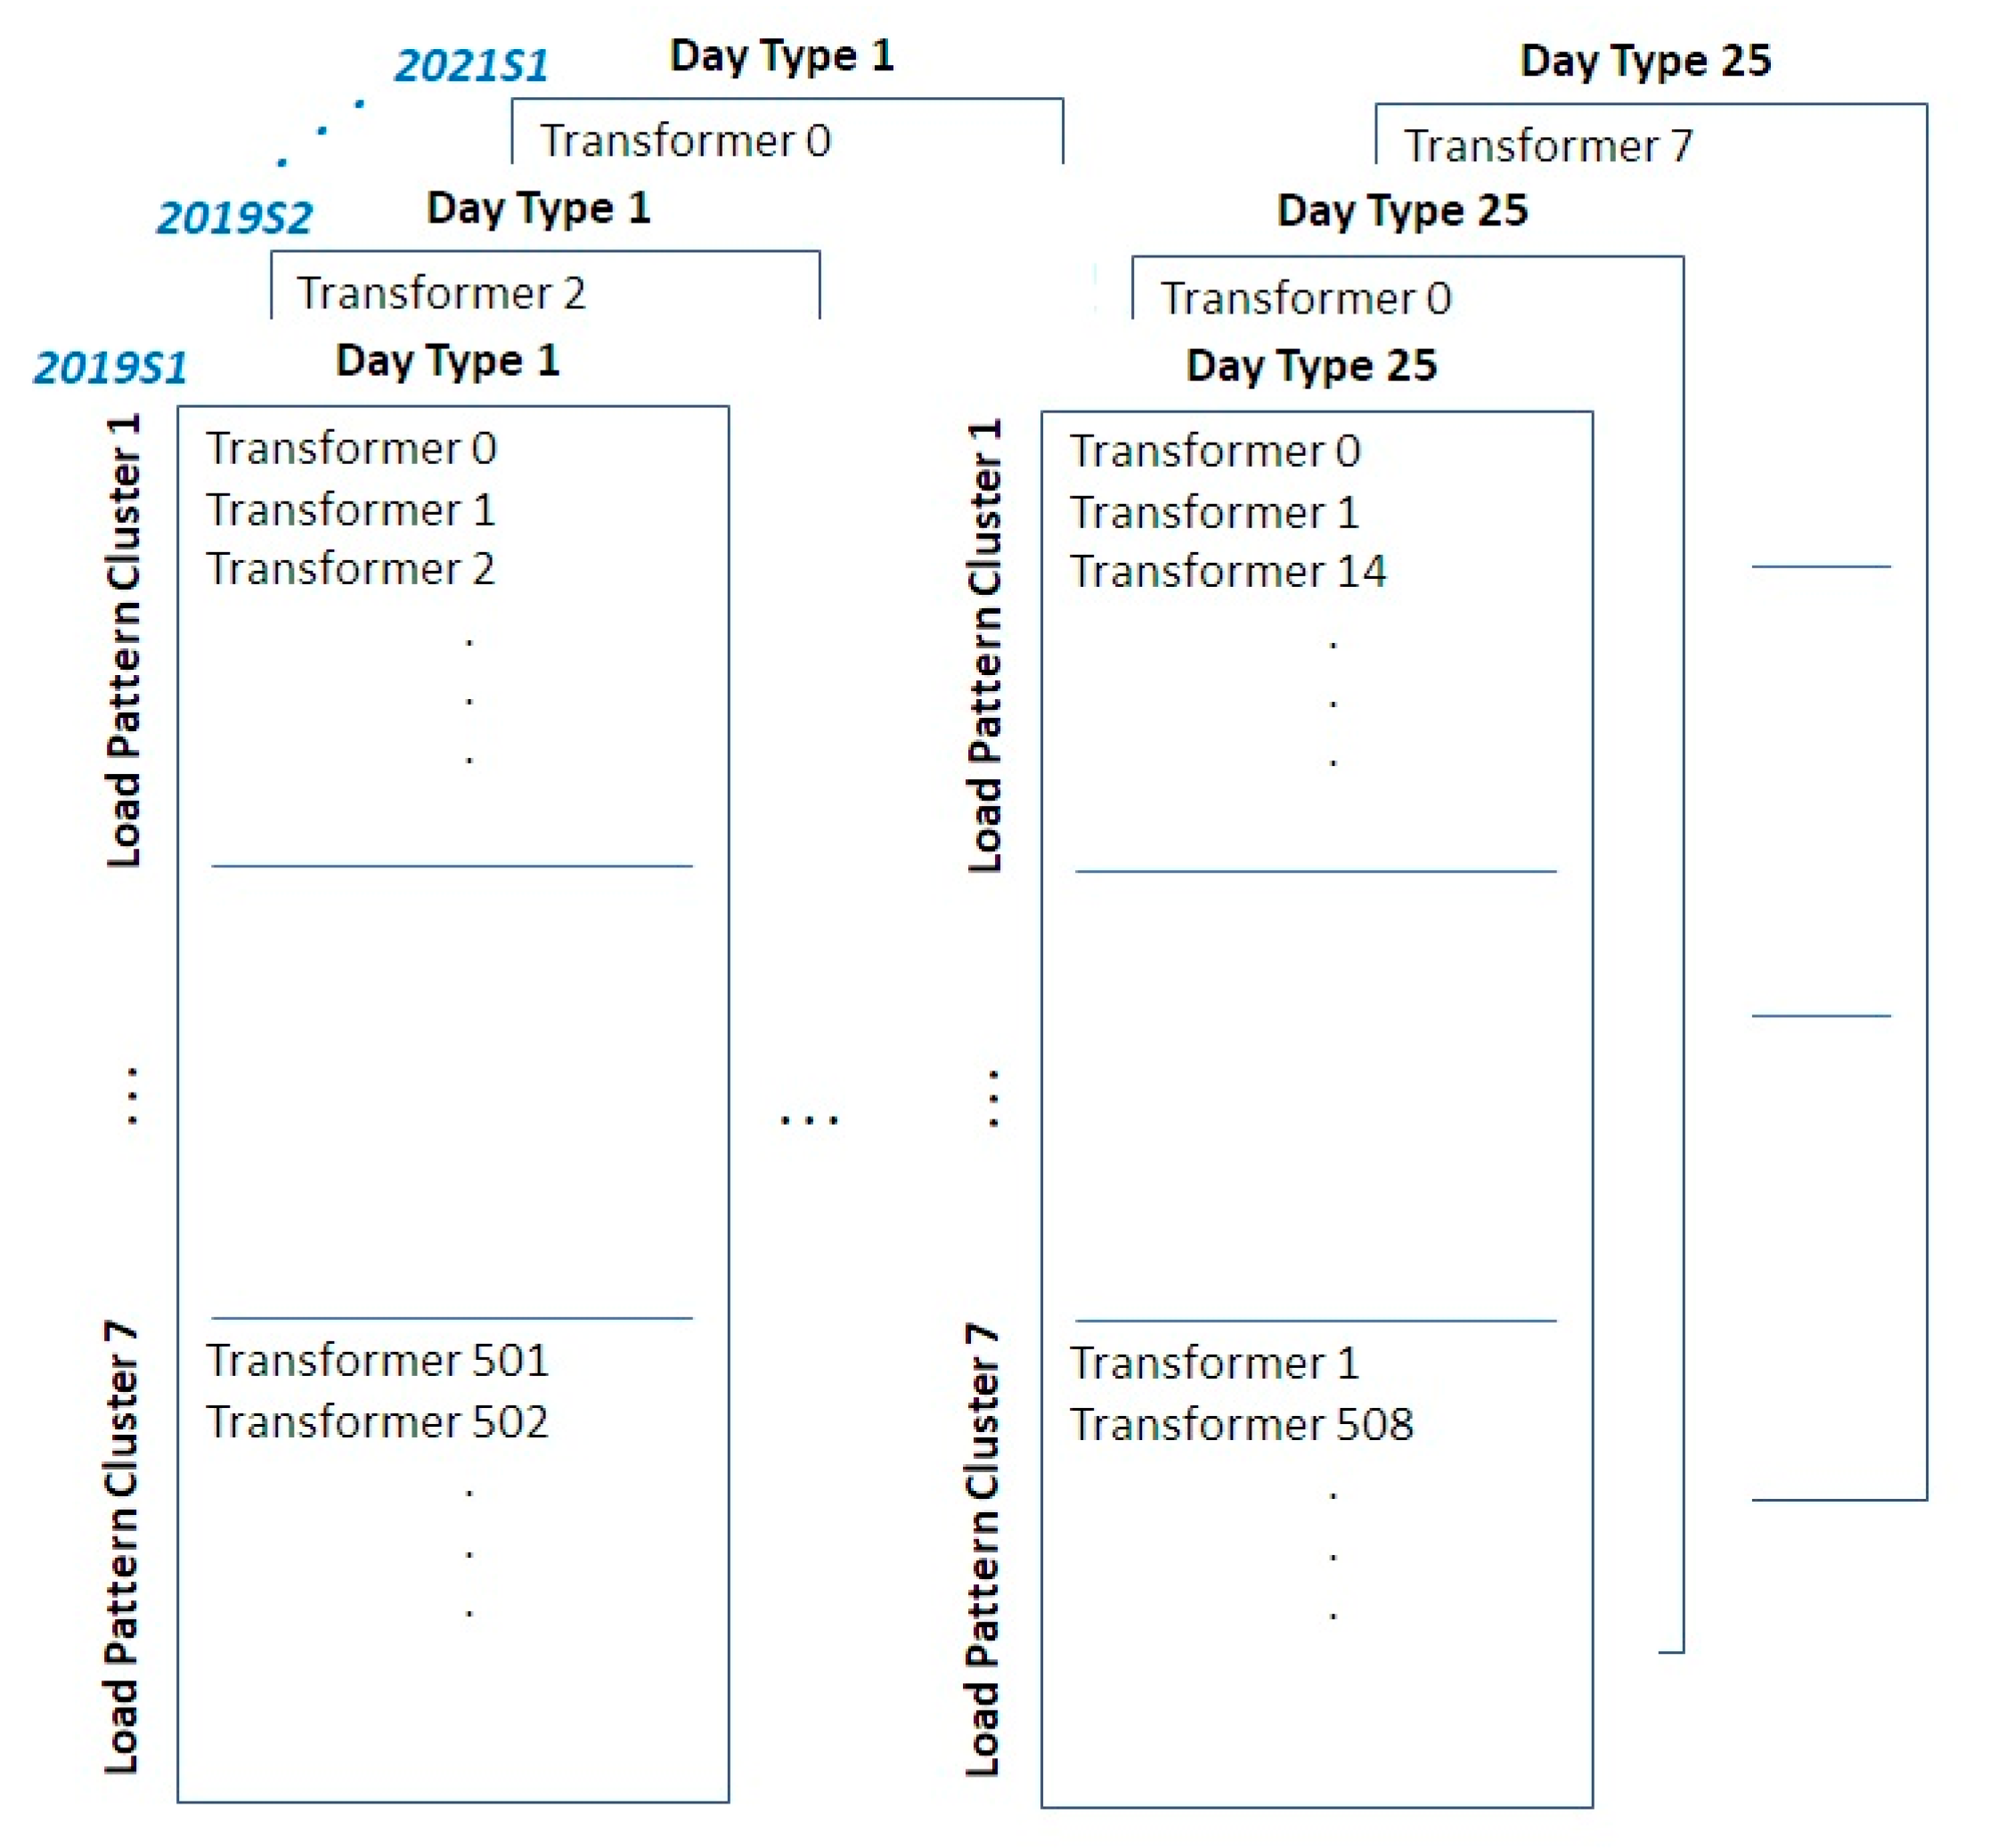
4.5. Process Details
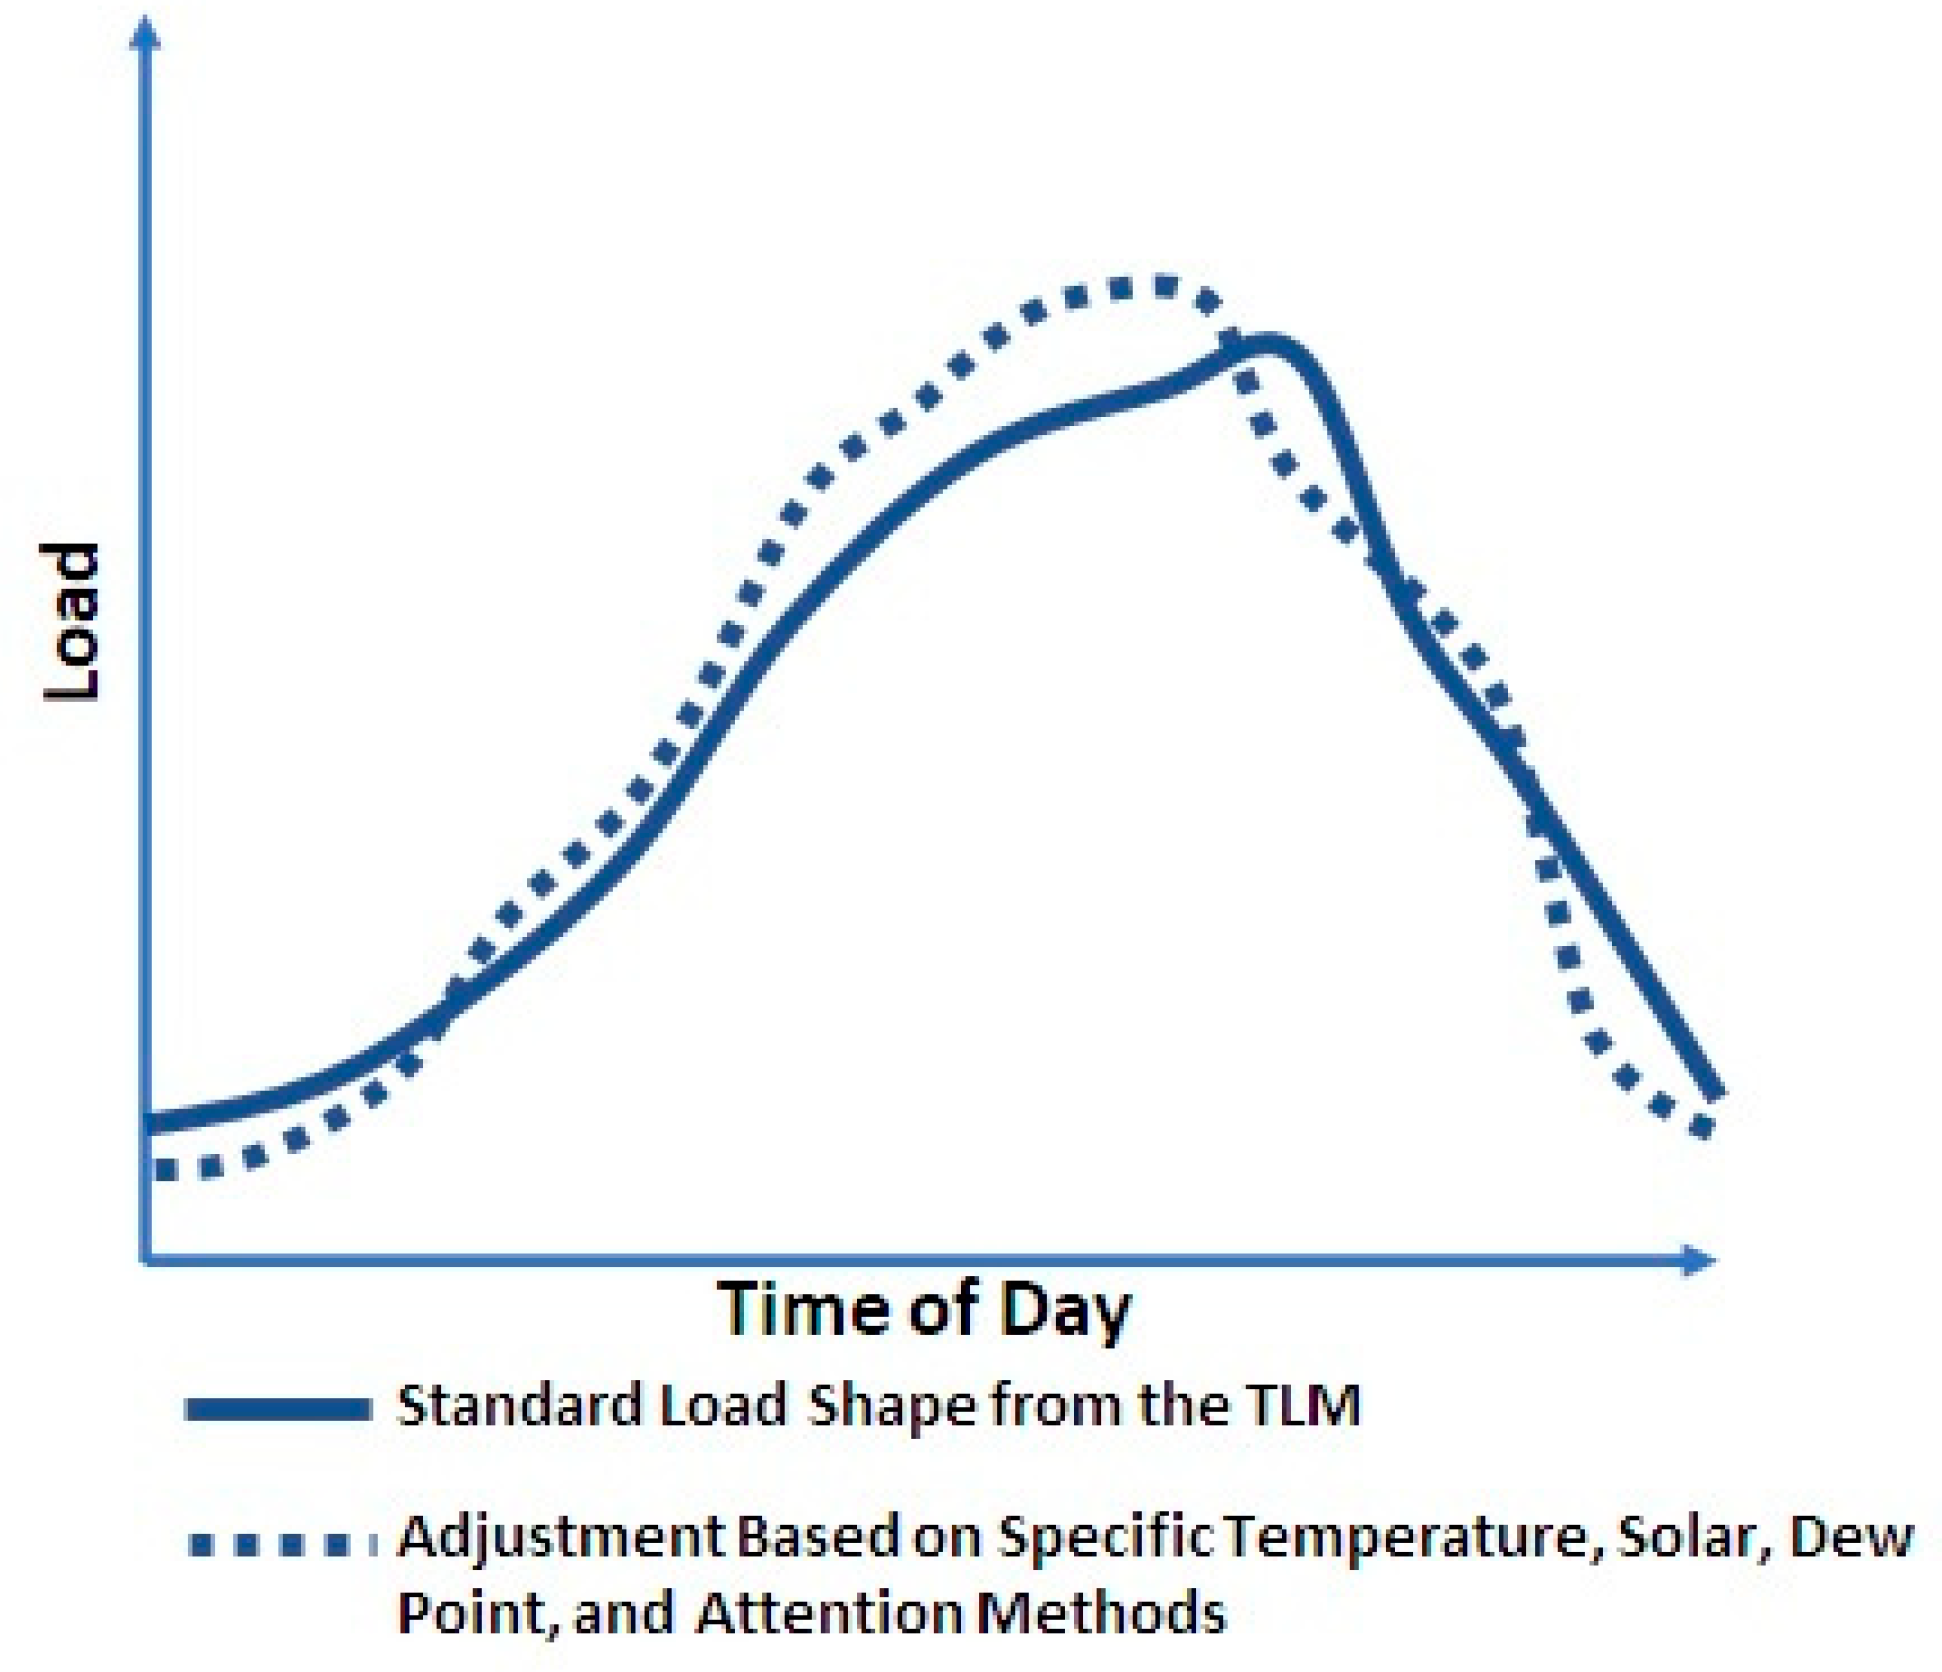
Considering the 24 h load data for a transformer for each day in the period under investigation, the load data are normalized by the rating of the transformer serving that load L , as shown in Figure 3. Each 24 h data point for each transformer is converted into a PAA equivalent with p segments with o overlap using the following ( p = 12 and o = 0 are found to be the preferred values in the current application):
l j = 1 U T + 1 L T i = L T U T l i U T = = m i n ( n 1 , ( ( n p ) ( j + 1 ) 1 ) + o ) L T = = max 0 , n p j o L l 0 , l 1 , l 2 , l n 1 l i R , l i 0 , i = 0,1 , , n 1 L l 0 , l 1 , l 2 , l p 1 l j R , l j 0 , j = 0,1 , , p 1 n = 24   i n   t h e   p r e s e n t   a p p l i c a t i o n
These data are used to determine a unique load-type index ( l t ) for each transformer day combination through K-Means clustering with a specific number of clusters ( k n u m b e r _ o f _ l o a d _ t y p e s ). The datasets used are separated from the overall dataset by day type ( d t ), transformer type t t , and season (se). These load types will be used for further analysis, including community detection.
L ( L , t t , s e , d t ) !   l t l t = k m e a n s L d t Z , 0 d t < n d t t Z , 0 t t 7 l t Z , 0 l t < k s e [ 2019 S 1 , 2019 S 2 , 2019 S 3 , 2019 S 4 , 2020 S 1 , 2020 S 2 , 2020 S 3 , 2020 S 4 , 2021 S 1 ,   2021 S 2 , 2021 S 3 , 2021 S 4 ]
In Equation (4), k m e a n s L is the cluster index that results for a point represented by ( L ) after clustering all the transformer and day combinations within the dataset (segmented by day type, transformer type, and season).
The final unique load-type index ( l t ) for each transformer on a day type and within a season (se) is chosen based on the most frequent occurrence of the load-type index for that transformer on a specific day type within that season.
T s e , d t ! l t   [ l t = m a x i m u m _ c o u n t ( l t ) ]
Furthermore, load forecasts (F) for each transformer on a day type and within a season (T) are developed using:
F T s e , d t = c e n t r o i d ( L ( T s e , d t )
Figure 8 and Figure 9 provide the detailed steps to train and test using the method described in this section.

4.6. Attention

One benefit of developing an initial forecast using the more time-efficient clustering method described earlier is that it identifies problematic areas for attention to be applied. Only the training data were used in the clustering steps to develop two attention mechanisms to support the neural network step that will be described in Section 5—Community Detection and Neural Network Refinement. First, any transformer and day combination in the training data that had a low R2 was more highly weighted using the Keras/Tensorflows sample weight feature. This will be referred to as “sample weight training attention” in the remainder of the paper, and it is intended to increase the neural network training focus on areas where accuracy is likely to be a challenge. The second method will be used with multihead attention in the following steps. The multihead attention is calculated for each transformer, on each day type, and in each period.
a i = f i l i / j = 0 n 1 f j l j A A t t e n t i o n A a 0 , a 1 , a 2 , , a n 1 a i R ,     a i 0 , i = 0,1 , , n 1 F C l u s t e r i n g   S t e p   F o r e c a s t F f 0 , f 1 , f 2 , , f n 1 f i R ,     f i 0 , i = 0,1 , , n 1 n = 24   i n   t h e   p r e s e n t   a p p l i c a t i o n

4.7. Conclusions

Figure 10 illustrates the Transformer Load Matrix (TLM) result of the clustering steps of the method proposed. It was developed by first determining the days with similar weather in the Weather Clustering step. The results of that Weather Clustering step were used to determine the Load Clusters for each day type. This provided initial forecasts for each transformer on each day type, transformers with similar load patterns, and attention methods to be used in downstream steps.

5. Community Detection and Neural Network Refinement

5.1. Purpose

The problem being solved requires forecasts several months into the future. This is a long window for standard neural networks and other forecasting methods. Supporting their use with the standard load profiles from the TLM shown in Figure 10 will provide better accuracy, as illustrated in Figure 11.

5.2. Neural Network Areas of Focus

There were three areas of focus for the development of the neural network element: (1) Training Data Segmentation, including by transformer, community detection (Louvain, Walk Trap, Spectral Agglomerative, Leading Eigenvector), TLM element, error/outlier detection and correction, data augmentation and others; (2) Training Methods, including sample weighting, optimizers, regularization, dropout, stopping criteria, and others; and (3) Neural Network Architecture, including dense, attention, multihead attention, scaled dot product, residual connections, embeddings, convolutional, autoregressive, LSTM, parallel paths, and others [53,56].

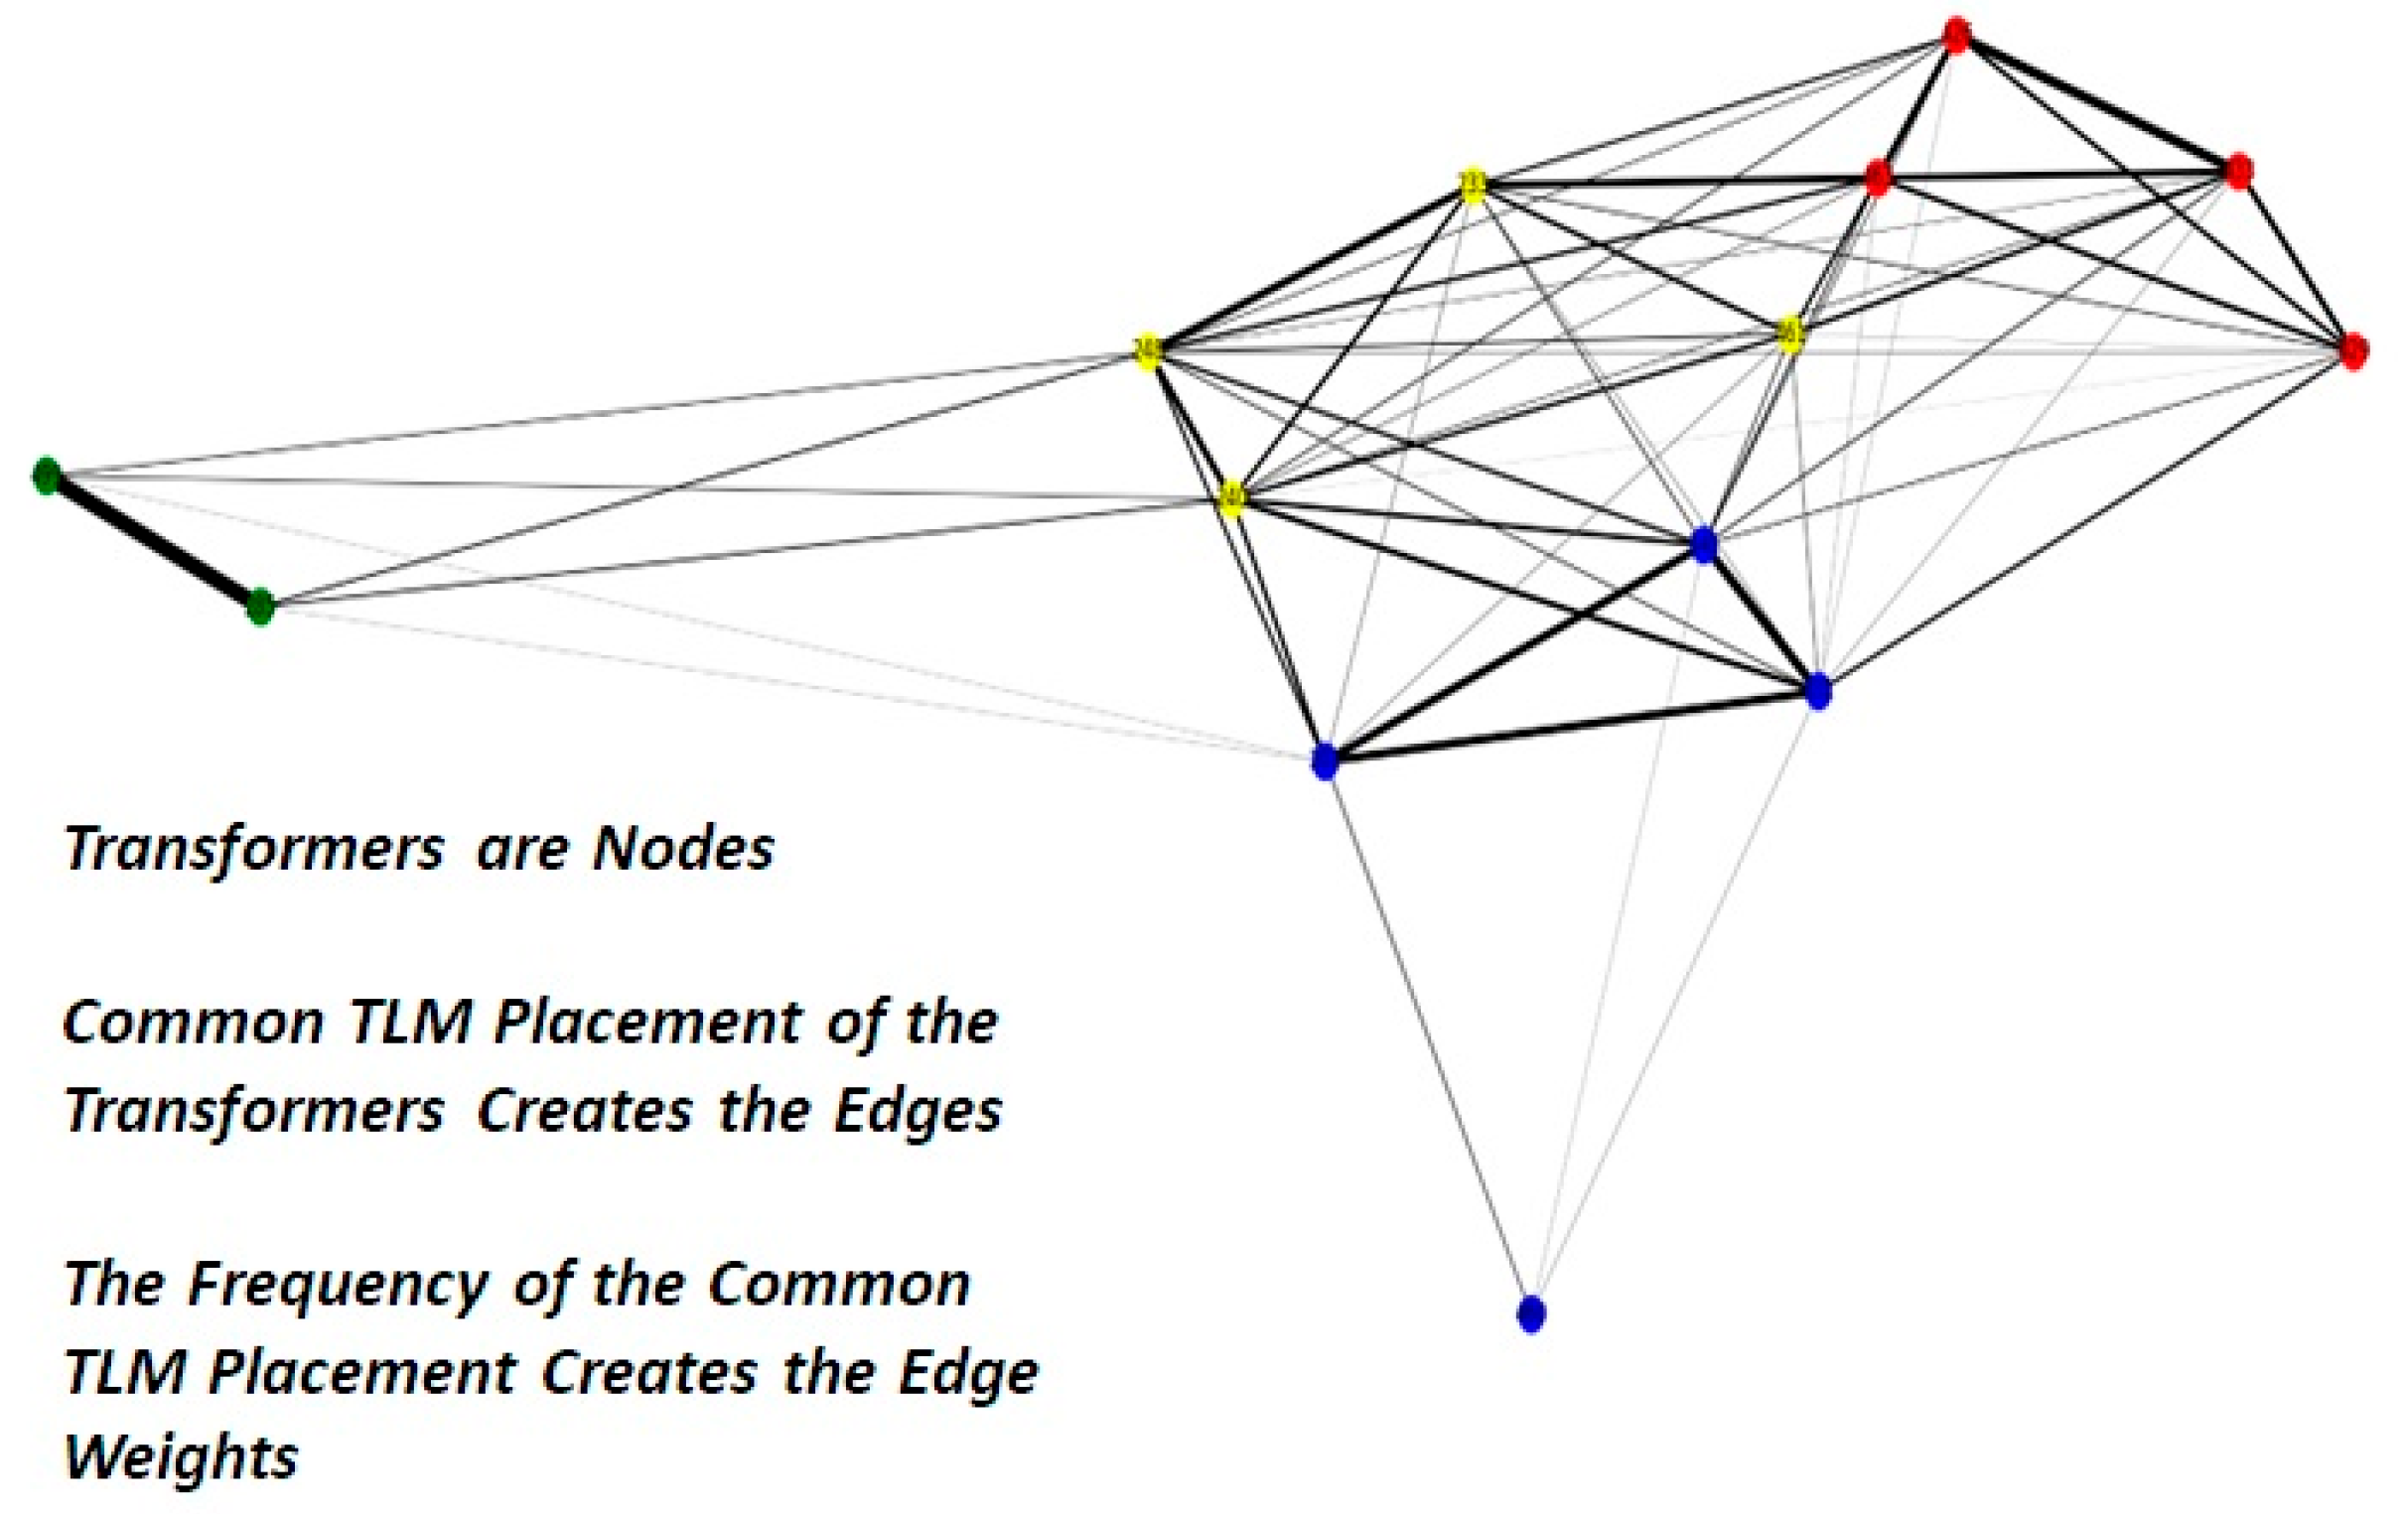
5.3. Community Detection

Community Detection was an interesting method in which experimentation was completed in the Training Data Segmentation area of focus, and it is illustrated in Figure 12. The intent was to identify transformers with similar load patterns across multiple day types to use with transfer learning. The work in [57,58] provided methods to identify communities. The authors found that the Louvain method provided the best results. The steps for the Community Detection process were: 1. Create a TLM-based Graph; 2. Create Adjacency and Laplacian Matrices; 3. Apply Community Detection Algorithms; and 4. Use Transfer Learning to Train Transformers in the Same Community [59].
Well over 400 experiments were completed with numerous data segmentation approaches, training methods, and architectures. The most successful architectures are illustrated in Figure 13. These architectures were influenced by [8,9,49]. The parallel architectures proposed in [8] produced better results, which are included in both architectures. Both architectures also include multihead attention inspired by the Transformer model described in [49]. Architecture A also includes three different sized one-dimensional convolutional filters in one of the paths, like what is described in [9] with the Averaging layer replaced by a Maximum layer [60].

6. Results and Comprehensive Model

6.1. Clustering Results

Table 1 provides a summary of the training time and accuracy of all the methods considered in the clustering steps. From this analysis, K-Means clustering with PAA was selected as the most promising option considering a balance of the accuracy of the results and the time to train.
The impacts on the R2 and cluster consistency (how consistently a transformer was placed into a load cluster) of slight variations in the number of load clusters, day clusters, PAA segments and PAA segment offsets were considered. This led to 25 day clusters, 7 load clusters, and 12 PAA segments, with 0 overlap being selected as the best option. The method was applied to a new dataset that was not used in the development of the method. This dataset was from the same area but for approximately seven months following the training period. The R2 dropped from 78% to 67% with the test dataset.
Further analysis showed that including weekends was not as impactful as other features, clustering by location did not provide a significant change in the accuracy, and including a division by year and season did improve the results. In the end, the R2 on the training dataset was 81%, and it was 68% on the test dataset. The entire method was then applied to a new area (Area 2) that was 130 miles north of the original area (Area 1). The R2 on the training dataset was 66% and it was 54% on the test dataset. Using the weather information from the first area did not significantly change the results for the second area.

6.2. Community Detection Results

As shown in Figure 14, transfer learning within the communities detected between transformers based on the TLM is the most consistent method for reducing the neural network training time while achieving accuracy.

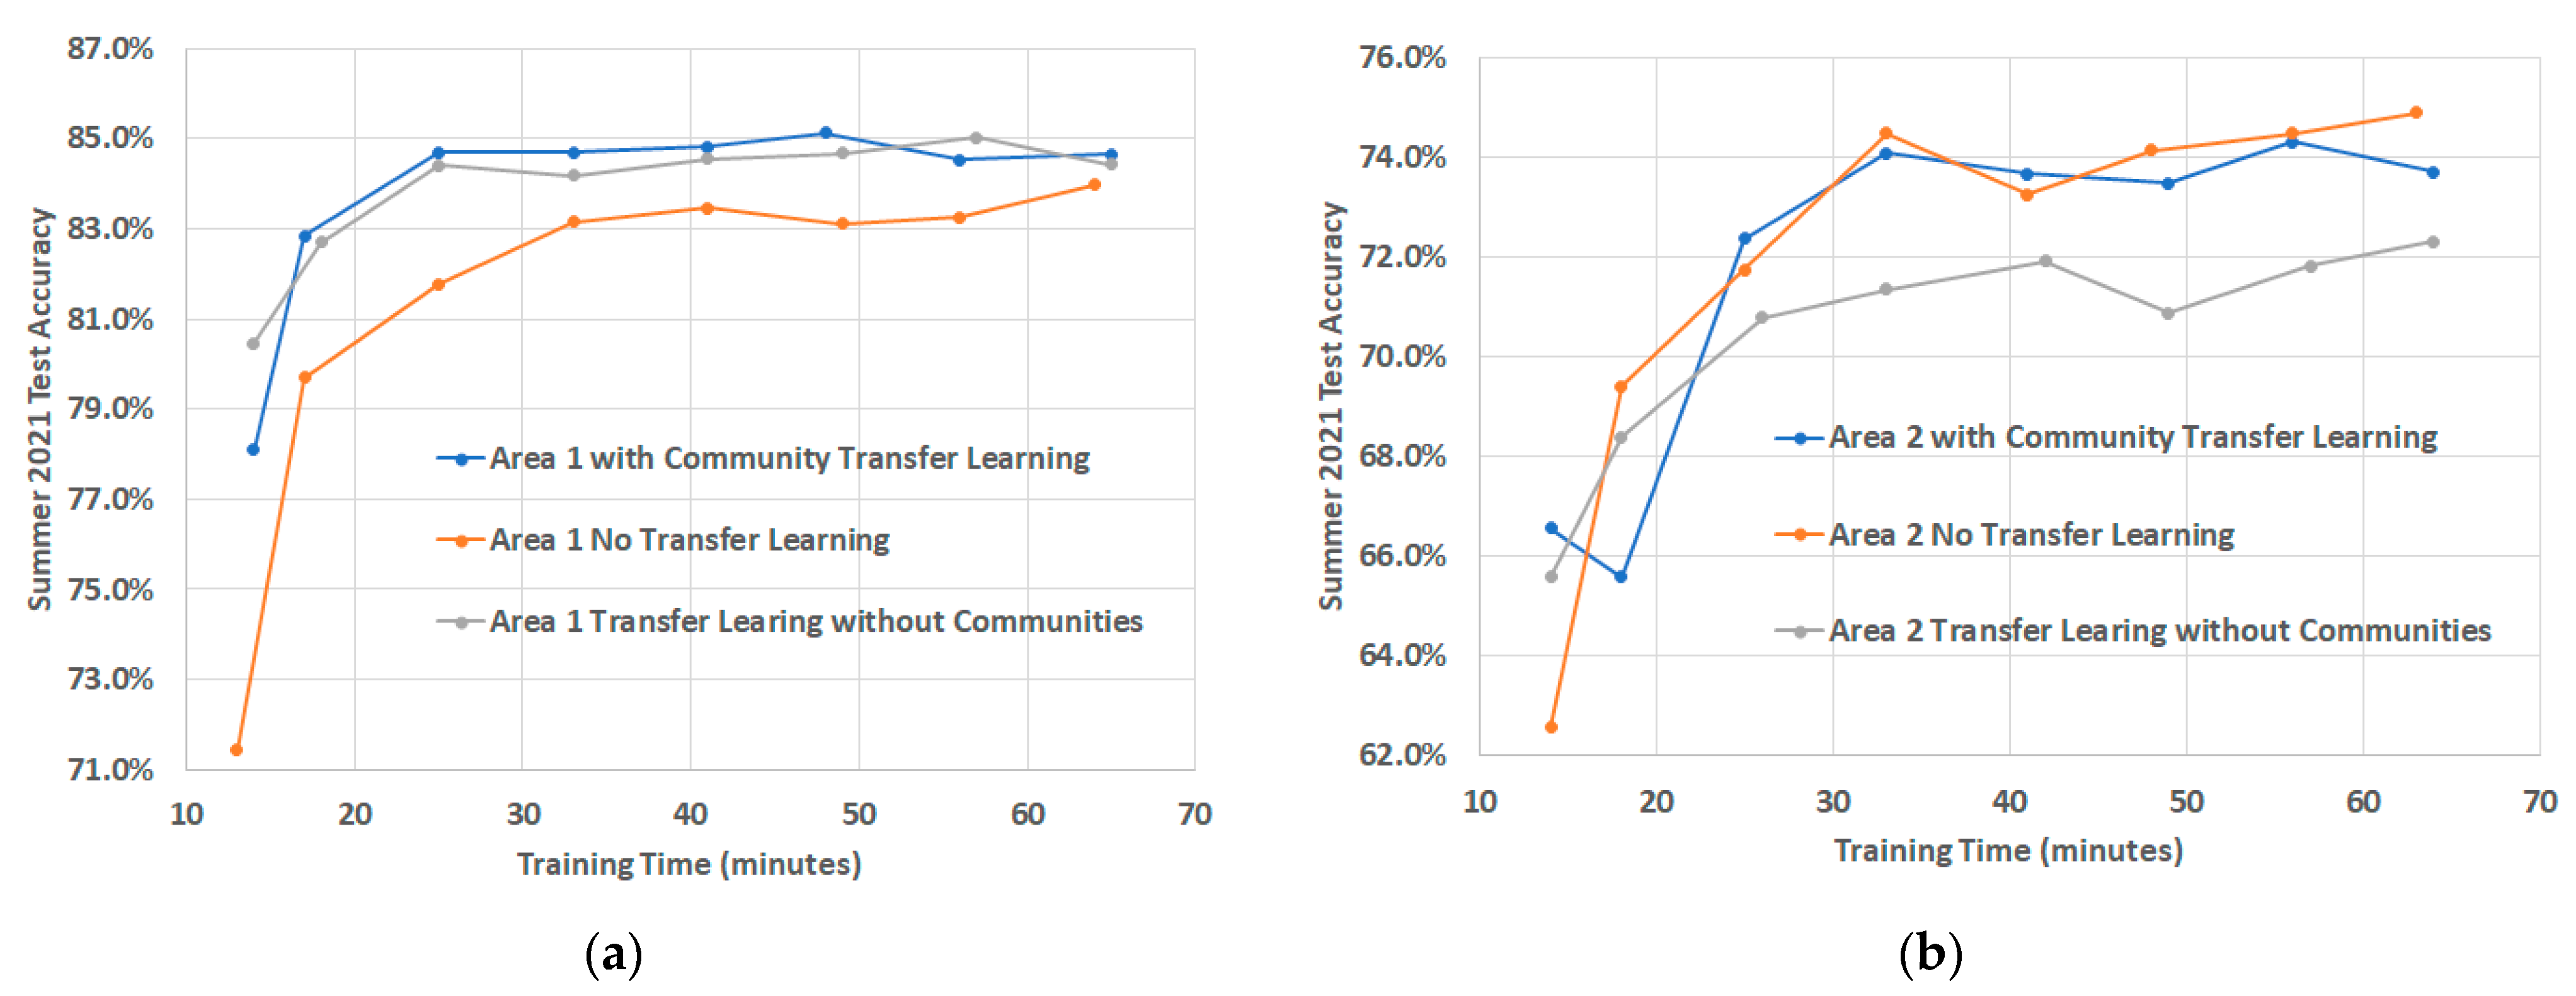
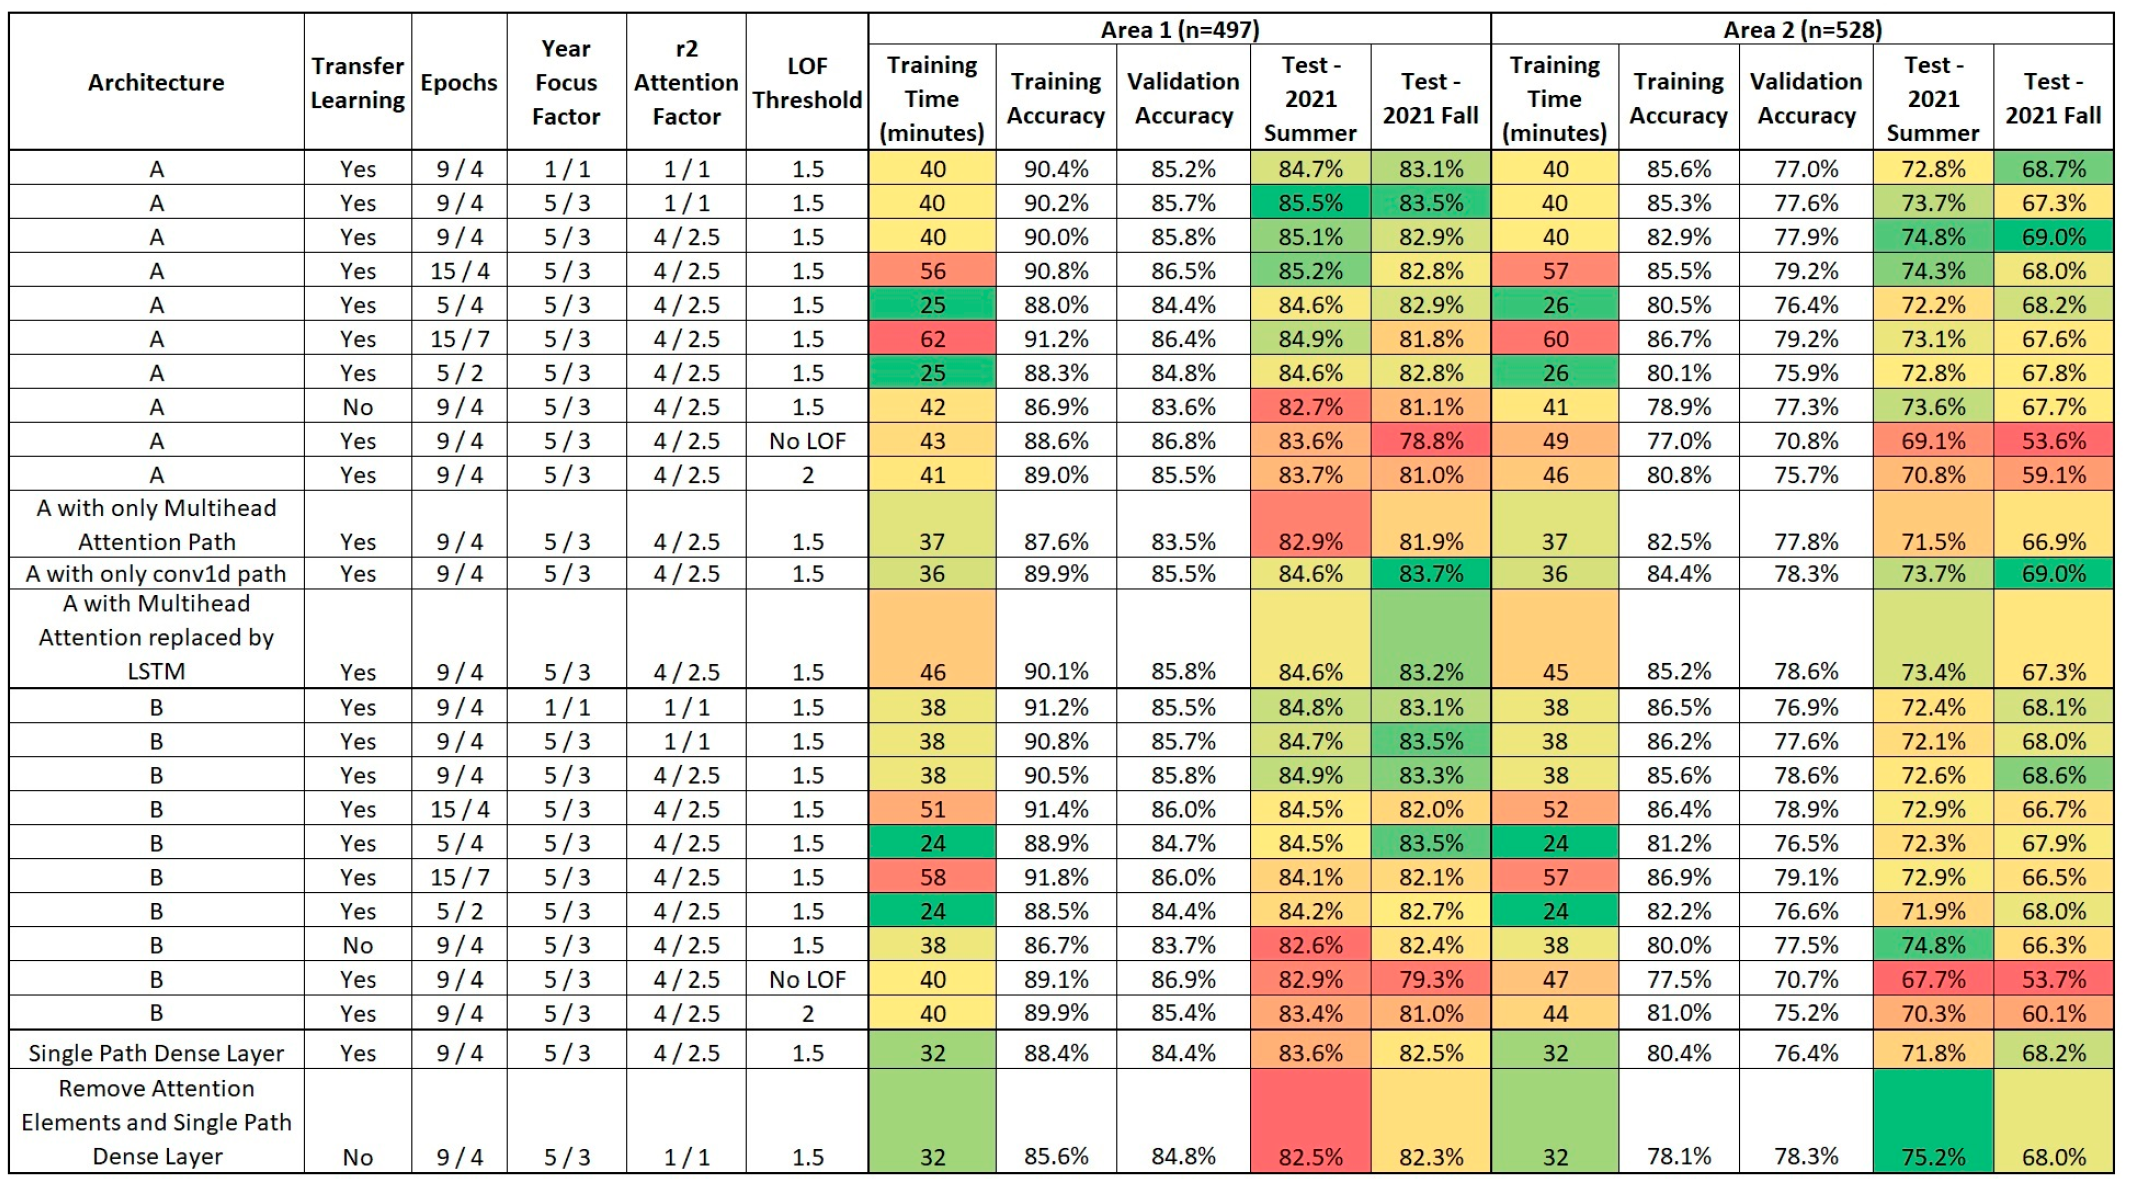
6.3. Neural Network Results

Figure 15 provides a summary of the training time and accuracy results of the Neural Network Refinement element. The first number in the Epoch column is the maximum number of epochs, and the second is the maximum number of epochs without an improvement in the validation accuracy. The first number in the Year Focus Factor column is the sample weight factor applied to the most recent year training data (2021), and the second is the sample weight factor applied in the next most recent year (2020). The first number in the r2 Attention Factor column is the sample weight factor applied for transformer day combinations with an R2 less than 0%, and the second is the factor applied to transformer day combinations less than 50% but greater than 0%.
Area 1 includes approximately 500 transformers with training from July 2019 to early June 2021, the validation is 10% of the points from the July 2019 to early June 2021, and the testing is from early July 2021 to November 2021. LOF = 1.5 showed approximately 11% outliers, and LOF = 2 showed approximately 3% outliers. Area 2 has approximately 550 transformers with training from July 2019 to June 2021, the validation is 10% of the points from July 2019 to June 2021, and the testing is from July 2021 to December 2021. LOF = 1.5 shows approximately 35% outliers, and LOF = 2 shows approximately 14% outliers.
The authors found Architecture A, transfer learning within the communities, 9 maximum epochs, 4 epochs without improvement, sample weight training attention, and an LOF threshold of 1.5 to be the preferred option, although a reader may find benefit from others depending on the specific problem that the reader is trying to solve. The training and accuracy of the results columns were color-coded with the best value green, the worst value red, and the median value yellow. The color coding for the remaining values was determined based on how close each value was to those thresholds.

6.4. Overall Results

The overall results for the authors’ preferred form are presented in Table 2.
Table 2 illustrates that an area including approximately 500 distribution transformers of different primary voltages (13.2 kV grounded wye and 4.8 kV ungrounded delta), construction types (overhead and underground), and primary feeds (three phase and single phase) can be trained in approximately 48 min and result in an hourly forecasting accuracy up to the mid-80% range for 5 to 7 months in the future.

7. Research Findings and Future Work

7.1. Research Findings

The evolving electrical distribution system will require utilities to have greater visibility into the electrical load to avoid issues like power quality concerns, protection inadequacy, and ferroresonance. Such greater understanding of load is also critical to take advantage of new opportunities, like deploying NWAs and ANMs. The insight into the electrical load will have to expand beyond short-term forecasts for specific customers or small areas. Forecasts will need to be at least months into the future, they must be on circuit elements, and they must consider a range of cases.
To address this need, the authors have proposed a multistage process after completing hundreds of experiments with an extensive dataset. Based on that work, clustering approaches are a good precursor to improving accuracy and processing time. Specifically, weather clustering provides the foundation for future Monte Carlo simulations and the basis for identifying circuit elements with similar load patterns (see Section 4.2). Load clustering identifies portions of the data to focus the attention of neural network steps and provides the data to complete community detection to identify circuit elements with similar load characteristics across days with different weather (see Section 4.4 and Section 6.1). The resulting communities reduced the overall training time for the neural network step (see Section 5.3 and Section 6.2). Considering neural networks, parallel path architectures that use attention methods can provide accurate forecasts for circuit elements (distribution transformers in this study) months in the future (see Section 5.2 and Section 6.3). Finally, GPU computing reduces the training time (see Section 6.1 and Section 6.3), and data correction steps are critical and time consuming (see Section 4.3 and Section 6.3).
The result is a method suitable for Monte Carlo simulations that can be trained to hourly load forecasts with an accuracy up to 86% in approximately 48 min for an area including approximately 500 transformers (see Section 6.4).

7.2. Future Work

The work presented in this manuscript will be used in Monte Carlo simulations to create a range of electrical load scenarios for circuit elements. The results will be used to identify potential concerns with high and low equipment loading, protection risks, and power quality issues. The results will also be used to consider the deployment of NWAs and in the design of ANMs. During this work, the overall process will be refined to produce more accurate results with lower training times.

Author Contributions

Conceptualization, J.O.; methodology, J.O.; software, J.O.; validation, J.O.; formal analysis, J.O.; investigation, J.O.; resources, J.O.; data curation, J.O.; writing—original draft preparation, J.O.; writing—review and editing, W.S.; visualization, J.O.; supervision, W.S.; project administration, J.O.; funding acquisition, J.O. and W.S. All authors have read and agreed to the published version of the manuscript.

Funding

This research received no external funding.

Data Availability Statement

The data and electrical system configurations used in this research are confidential. The code and results are available.

Acknowledgments

The authors wish to thank Alex Little at DTE Electric for identifying and providing data to correct the data concerning meter changes, and Yong Li at DTE Electric for providing the data that supported this research.

Conflicts of Interest

The authors declare no conflict of interest.

References

  1. Iravani, M.R.; Chaudhary, A.K.S.; Giesbrecht, W.J.; Hassan, I.E.; Keri, A.J.F.; Lee, K.C.; Martinez, J.A.; Morched, A.S.; Mork, B.A.; Parniani, M.; et al. Modeling and Analysis Guidelines for Slow Transients. III. The Study of Ferroresonance. IEEE Trans. Power Deliv. 2000, 15, 255–265. [Google Scholar] [CrossRef]
  2. Mork, B. Understanding and Dealing with Ferroresonance. In Proceedings of the Minnesota Power Systems Conference, St. Paul, MN, USA, 7–9 November 2006. [Google Scholar]
  3. Pinheiro, M.G.; Madeira, S.C.; Francisco, A.P. Short-Term Electricity Load Forecasting—A Systematic Approach from System Level to Secondary Substations. Appl. Energy 2023, 332, 120493. [Google Scholar] [CrossRef]
  4. Syed, D.; Refaat, S.S.; Abu-Rub, H.; Bouhali, O. Short-Term Power Forecasting Model Based on Dimensionality Reduction and Deep Learning Techniques for Smart Grid. In Proceedings of the 2020 IEEE Kansas Power and Energy Conference (KPEC), Manhattan, KS, USA, 13–14 July 2020; 2020; pp. 1–6. [Google Scholar] [CrossRef]
  5. Lai, G.; Chang, W.-C.; Yang, Y.; Liu, H. Modeling Long- and Short-Term Temporal Patterns with Deep Neural Networks 2018. In Proceedings of the 41st International ACM SIGIR Conference on Research & Development in Information Retrieval, Ann Arbor, MI, USA, 8–12 July 2018. [Google Scholar] [CrossRef]
  6. Agarwal, K.; Dheekollu, L.; Dhama, G.; Arora, A.; Asthana, S.; Bhowmik, T. Deep Learning Based Time Series Forecasting. In Proceedings of the 2020 19th IEEE International Conference on Machine Learning and Applications (ICMLA), Miami, FL, USA, 14–17 December 2020; 2020; pp. 859–864. [Google Scholar] [CrossRef]
  7. Huang, Y.; Zhao, R.; Zhou, Q.; Xiang, Y. Short-Term Load Forecasting Based on a Hybrid Neural Network and Phase Space Reconstruction. IEEE Access 2022, 10, 23272–23283. [Google Scholar] [CrossRef]
  8. Farsi, B.; Amayri, M.; Bouguila, N.; Eicker, U. On Short-Term Load Forecasting Using Machine Learning Techniques and a Novel Parallel Deep LSTM-CNN Approach. IEEE Access 2021, 9, 31191–31212. [Google Scholar] [CrossRef]
  9. He, W. Load Forecasting via Deep Neural Networks. Procedia Comput. Sci. 2017, 122, 308–314. [Google Scholar] [CrossRef]
  10. Sun, W.; Zhang, X. Application of Self-Organizing Combination Forecasting Method in Power Load Forecast. In Proceedings of the 2007 International Conference on Wavelet Analysis and Pattern Recognition, Beijing, China, 2–4 November 2007; Volume 2, pp. 613–617. [Google Scholar] [CrossRef]
  11. Luo, S.; Rao, Y.; Chen, J.; Wang, H.; Wang, Z. Short-Term Load Forecasting Model of Distribution Transformer Based on CNN and LSTM. In Proceedings of the 2020 IEEE International Conference on High Voltage Engineering and Application (ICHVE), Beijing, China, 6–10 September 2020; pp. 1–4. [Google Scholar] [CrossRef]
  12. Kampezidou, S.I.; Grijalva, S. Distribution Transformers Short-Term Load Forecasting Models. In Proceedings of the 2016 IEEE Power and Energy Society General Meeting (PESGM), Boston, MA, USA, 17–21 July 2016; pp. 1–5. [Google Scholar] [CrossRef]
  13. Guo, J.; Zhang, Z.; Gao, W.; Hu, H.; Wang, D.; Mao, Y. Overheating Risk Warning Model Based on Thermal Circuit Model and Load Forecasting for Distribution Transformers. In Proceedings of the 2019 IEEE Sustainable Power and Energy Conference (iSPEC), Beijing, China, 21–23 November 2019; pp. 2891–2895. [Google Scholar] [CrossRef]
  14. Rashid, R.A.; Chin, L.; Sarijari, M.A.; Sudirman, R.; Ide, T. Machine Learning for Smart Energy Monitoring of Home Appliances Using IoT. In Proceedings of the 2019 Eleventh International Conference on Ubiquitous and Future Networks (ICUFN), Zagreb, Croatia, 2–5 July 2019; pp. 66–71. [Google Scholar] [CrossRef]
  15. Luo, A.; Yuan, J.; Liang, F.; Yang, Q.; Mu, D. Load Forecasting of Electric Vehicle Charging Station Based on Edge Computing. In Proceedings of the 2020 IEEE 3rd International Conference on Computer and Communication Engineering Technology (CCET), Beijing, China, 14–16 August 2020; pp. 34–38. [Google Scholar] [CrossRef]
  16. Zhang, L.; Tang, Y.; Zhou, T.; Tang, C.; Pang, B.; Liang, H. Research on Short-Term Power Load Forecasting in Distribution Station Area and Adjustable Load Participating in Demand-Side Cluster Control. In Proceedings of the 2021 IEEE 5th Conference on Energy Internet and Energy System Integration (EI2), Taiyuan, China, 22–24 October 2021; pp. 2353–2358. [Google Scholar] [CrossRef]
  17. Lekshmi, M.; Subramanya, K.N.A. Short-Term Load Forecasting of 400kV Grid Substation Using R-Tool and Study of Influence of Ambient Temperature on the Forecasted Load. In Proceedings of the 2019 Second International Conference on Advanced Computational and Communication Paradigms (ICACCP), Gangtok, India, 25–28 February 2019; pp. 1–5. [Google Scholar] [CrossRef]
  18. Eskandari, H.; Imani, M.; Moghadam, M.P. Correlation Based Convolutional Recurrent Network for Load Forecasting. In Proceedings of the 2020 28th Iranian Conference on Electrical Engineering (ICEE), Tabriz, Iran, 4–6 August 2020; pp. 1–5. [Google Scholar] [CrossRef]
  19. Hossen, T.; Nair, A.S.; Chinnathambi, R.A.; Ranganathan, P. Residential Load Forecasting Using Deep Neural Networks (DNN). In Proceedings of the 2018 North American Power Symposium (NAPS), Fargo, ND, USA, 9–11 September 2018; pp. 1–5. [Google Scholar] [CrossRef]
  20. Wang, J.; Liu, H.; Zheng, G.; Li, Y.; Yin, S. Short-Term Load Forecasting Based on Outlier Correction, Decomposition, and Ensemble Reinforcement Learning. Energies 2023, 16, 4401. [Google Scholar] [CrossRef]
  21. Alotaibi, M.A. Machine Learning Approach for Short-Term Load Forecasting Using Deep Neural Network. Energies 2022, 15, 6261. [Google Scholar] [CrossRef]
  22. Akhtar, S.; Shahzad, S.; Zaheer, A.; Ullah, H.S.; Kilic, H.; Gono, R.; Jasiński, M.; Leonowicz, Z. Short-Term Load Forecasting Models: A Review of Challenges, Progress, and the Road Ahead. Energies 2023, 16, 4060. [Google Scholar] [CrossRef]
  23. Xu, J. Research on Power Load Forecasting Based on Machine Learning. In Proceedings of the 2020 7th International Forum on Electrical Engineering and Automation (IFEEA), Hefei, China, 25–27 September 2020; pp. 562–567. [Google Scholar] [CrossRef]
  24. Ausmus, J.R.; Sen, P.K.P.; Wu, T.; Adhikari, U.; Zhang, Y.; Krishnan, V. Improving the Accuracy of Clustering Electric Utility Net Load Data Using Dynamic Time Warping. In Proceedings of the 2020 IEEE/PES Transmission and Distribution Conference and Exposition (T&D), Chicago, IL, USA, 12–15 October 2020; pp. 1–5. [Google Scholar] [CrossRef]
  25. Phetsangkat, P.; Chalermyanont, K.; Duangsoithong, R. Hierarchical Clustering Electric Load: Case Study in Lower South Region of Thailand. In Proceedings of the 2019 16th International Conference on Electrical Engineering/Electronics, Computer, Telecommunications and Information Technology (ECTI-CON), Pattaya, Thailand, 10–13 July 2019; pp. 881–884. [Google Scholar] [CrossRef]
  26. Yasin, Z.M.; Salim, N.A.; Ab Aziz, N.F. Long Term Load Forecasting Using Grey Wolf Optimizer—Artificial Neural Network. In Proceedings of the 2019 7th International Conference on Mechatronics Engineering (ICOM), Putrajaya, Malaysia, 30–31 October 2019; pp. 1–6. [Google Scholar] [CrossRef]
  27. Mir, A.A.; Khan, Z.A.; Altmimi, A.; Badar, M.; Ullah, K.; Imran, M.; Kazmi, S.A.A. Systematic Development of Short-Term Load Forecasting Models for the Electric Power Utilities: The Case of Pakistan. IEEE Access 2021, 9, 140281–140297. [Google Scholar] [CrossRef]
  28. Agrawal, R.K.; Muchahary, F.; Tripathi, M.M. Long Term Load Forecasting with Hourly Predictions Based on Long-Short-Term-Memory Networks. In Proceedings of the 2018 IEEE Texas Power and Energy Conference (TPEC), College Station, TX, USA, 8–9 February 2018; pp. 1–6. [Google Scholar] [CrossRef]
  29. Leou, R.-C.; Su, C.-L.; Lu, C.-N. Stochastic Analyses of Electric Vehicle Charging Impacts on Distribution Network. IEEE Trans. Power Syst. 2014, 29, 1055–1063. [Google Scholar] [CrossRef]
  30. Hwang, K.J.; Kim, G.W. Spatial Load Forecasting Model for Electrical Distribution Planning. In Proceedings of the 8th Russian-Korean International Symposium on Science and Technology, Tomsk, Russia, 26 June–3 July 2004; Volume 1, pp. 237–241. [Google Scholar] [CrossRef]
  31. Liu, D.; Li, Z.; Jiang, J.; Cheng, X.; Wu, G. Electric Vehicle Load Forecast Based on Monte Carlo Algorithm. In Proceedings of the 2020 IEEE 9th Joint International Information Technology and Artificial Intelligence Conference (ITAIC), Chongqing, China, 11–13 December 2020; Volume 9, pp. 1760–1763. [Google Scholar] [CrossRef]
  32. Hinojosa, V.; Gil, E.; Calle, I. A Stochastic Generation Capacity Expansion Planning Methodology Using Linear Distribution Factors and Hourly Load Modeling. In Proceedings of the 2018 IEEE International Conference on Probabilistic Methods Applied to Power Systems (PMAPS), Boise, ID, USA, 24–28 June 2018; pp. 1–6. [Google Scholar] [CrossRef]
  33. Zhang, K.; Feng, X.; Tian, X.; Hu, Z.; Guo, N. Partial Least Squares Regression Load Forecasting Model Based on the Combination of Grey Verhulst and Equal-Dimension and New-Information Model. In Proceedings of the 2020 7th International Forum on Electrical Engineering and Automation (IFEEA), Hefei, China, 25–27 September 2020; pp. 915–919. [Google Scholar] [CrossRef]
  34. Chaturvedi, A.; Murthy, M.B.R.; Ranjan, R.; Prasad, K. A Novel Scheme of Load Forecasting Pertaining to Long Term Planning of a Distribution System. In Proceedings of the TENCON 2005—2005 IEEE Region 10 Conference, Melbourne, VIC, Australia, 21–24 November 2005; pp. 1–6. [Google Scholar] [CrossRef]
  35. Padmakumari, K.; Mohandas, K.P.; Thiruvengadam, S. Long Term Distribution Demand Forecasting Using Neuro Fuzzy Computations. Int. J. Electr. Power Energy Syst. 1999, 21, 315–322. [Google Scholar] [CrossRef]
  36. Kandilogiannakis, G.; Mastorocostas, P.; Voulodimos, A.; Hilas, C. Short-Term Load Forecasting of the Greek Power System Using a Dynamic Block-Diagonal Fuzzy Neural Network. Energies 2023, 16, 4227. [Google Scholar] [CrossRef]
  37. Chicco, G.; Napoli, R.; Piglione, F. Comparisons among Clustering Techniques for Electricity Customer Classification. IEEE Trans. Power Syst. 2006, 21, 933–940. [Google Scholar] [CrossRef]
  38. Zhu, Z.; Cai, R.; Cui, X.; Xu, L.; Xue, Y.; Zhang, G.; Wang, L.; Yu, X. Time Series Mining Based on Multilayer Piecewise Aggregate Approximation. In Proceedings of the 2016 International Conference on Audio, Language and Image Processing (ICALIP), Shanghai, China, 11–12 July 2016; pp. 174–179. [Google Scholar] [CrossRef]
  39. Pappa, L.; Karvelis, P.; Georgoulas, G.; Stylios, C. Slopewise Aggregate Approximation SAX: Keeping the Trend of a Time Series. In Proceedings of the 2021 IEEE Symposium Series on Computational Intelligence (SSCI), Orlando, FL, USA, 5–7 December 2021; pp. 1–8. [Google Scholar] [CrossRef]
  40. Xu, L.; Zhang, Y.; Shao, Z. An Approach to Cluster Electrical Load Profiles Based on Piecewise Symbolic Aggregation. In Proceedings of the 2021 6th Asia Conference on Power and Electrical Engineering (ACPEE), Chongqing, China, 8–11 April 2021; pp. 1000–1004. [Google Scholar] [CrossRef]
  41. Figueiredo, V.; Rodrigues, F.; Vale, Z.; Gouveia, J.B. An Electric Energy Consumer Characterization Framework Based on Data Mining Techniques. IEEE Trans. Power Syst. 2005, 20, 596–602. [Google Scholar] [CrossRef] [Green Version]
  42. Kwac, J.; Flora, J.; Rajagopal, R. Household Energy Consumption Segmentation Using Hourly Data. IEEE Trans. Smart Grid 2014, 5, 420–430. [Google Scholar] [CrossRef]
  43. Dong, M.; Nassif, A.B.; Li, B. A Data-Driven Residential Transformer Overloading Risk Assessment Method. IEEE Trans. Power Deliv. 2019, 34, 387–396. [Google Scholar] [CrossRef] [Green Version]
  44. Chicco, G.; Napoli, R.; Postolache, P.; Scutariu, M.; Toader, C. Customer Characterization Options for Improving the Tariff Offer. IEEE Trans. Power Syst. 2003, 18, 381–387. [Google Scholar] [CrossRef]
  45. Dow, L.; Marshall, M.; Xu, L.; Romero Agüero, J.; Willis, H.L. A Novel Approach for Evaluating the Impact of Electric Vehicles on the Power Distribution System. In Proceedings of the IEEE PES General Meeting, Minneapolis, MN, USA, 25–29 July 2010; pp. 1–6. [Google Scholar] [CrossRef]
  46. Imani, M.; Ghassemian, H. Electrical Load Forecasting Using Customers Clustering and Smart Meters in Internet of Things. In Proceedings of the 2018 9th International Symposium on Telecommunications (IST), Tehran, Iran, 17–19 December 2018; pp. 113–117. [Google Scholar] [CrossRef]
  47. Oliveira, A.C.; Lourenço, L.F.N.; Monaro, R.M.; Salles, M.B.C.; Cardoso, J.R. Probabilistic Assessment of Transformer Overcurrent in Distribution Systems with Increasing PV Penetration Levels. In Proceedings of the 2019 International Conference on Clean Electrical Power (ICCEP), Otranto, Italy, 2–4 July 2019; pp. 71–75. [Google Scholar] [CrossRef]
  48. Shen, S.k.; Liu, W.; Zhang, T. Load Pattern Recognition and Prediction Based on DTW K-Mediods Clustering and Markov Model. In Proceedings of the 2019 IEEE International Conference on Energy Internet (ICEI), Nanjing, China, 27–31 May 2019; pp. 403–408. [Google Scholar] [CrossRef]
  49. Vaswani, A.; Shazeer, N.; Parmar, N.; Uszkoreit, J.; Jones, L.; Gomez, A.N.; Kaiser, L.; Polosukhin, I. Attention Is All You Need. In Advances in Neural Information Processing Systems; NeurIPS Proceedings: La Jolla, CA, USA, 2017. [Google Scholar] [CrossRef]
  50. Breunig, M.M.; Kriegel, H.-P.; Ng, R.T.; Sander, J. LOF: Identifying Density-Based Local Outliers. In Proceedings of the 2000 ACM SIGMOD International Conference on Management of Data, Dallas, TX USA, 15–18 May 2000; pp. 93–104. [Google Scholar] [CrossRef]
  51. Paparrizos, J.; Gravano, L. K-Shape: Efficient and Accurate Clustering of Time Series. In Proceedings of the 2015 ACM SIGMOD International Conference on Management of Data, Melbourne, VIC, Australia, 31 May–4 June 2015; pp. 1855–1870. [Google Scholar] [CrossRef]
  52. Zhang, Y.; Liu, Y.; Yu, Z.; Xiong, W.; Wang, L.; Ai, Q.; Li, Z.; Huang, K.; Hao, R.; Jiang, Z. Improving Aggregated Load Forecasting Using Evidence Accumulation K-Shape Clustering. In Proceedings of the 2020 IEEE Power & Energy Society General Meeting (PESGM), Montreal, QC, Canada, 2–6 August 2020; pp. 1–5. [Google Scholar] [CrossRef]
  53. RAPIDS Development Team RAPIDS: Libraries for End to End GPU Data Science. Available online: https://rapids.ai/ (accessed on 1 July 2023).
  54. Pedregosa, F.; Varoquaux, G.; Gramfort, A.; Michel, V.; Thirion, B.; Grisel, O.; Blondel, M.; Prettenhofer, P.; Weiss, R.; Dubourg, V.; et al. Scikit-Learn: Machine Learning in Python. J. Mach. Learn. Res. 2011, 12, 2825–2830. [Google Scholar]
  55. Tslearn, a Machine Learning Toolkit for Time Series Data|The Journal of Machine Learning Research. Available online: https://dl.acm.org/doi/abs/10.5555/3455716.3455834 (accessed on 15 July 2023).
  56. Reback, J.; McKinney, W.; Jbrockmendel; Bossche, J.V.D.; Augspurger, T.; Cloud, P.; Gfyoung; Hawkins, S.; Sinhrks; Roeschke, M.; et al. Pandas-Dev/Pandas: Pandas 1.2.2. 2021. Available online: https://zenodo.org/record/4524629 (accessed on 1 July 2023). [CrossRef]
  57. Berardo de Sousa, F.; Zhao, L. Evaluating and Comparing the IGraph Community Detection Algorithms. In Proceedings of the 2014 Brazilian Conference on Intelligent Systems, Sao Paulo, Brazil, 18–22 October 2014; pp. 408–413. [Google Scholar] [CrossRef]
  58. Chejara, P.; Godfrey, W.W. Comparative Analysis of Community Detection Algorithms. In Proceedings of the 2017 Conference on Information and Communication Technology (CICT), Gwalior, India, 3–5 November 2017; pp. 1–5. [Google Scholar] [CrossRef]
  59. Csardi, G.; Nepusz, T. The Igraph Software Package for Complex Network Research. InterJournal Complex Syst. 2006, 1695, 1–9. [Google Scholar]
  60. Abadi, M.; Agarwal, A.; Barham, P.; Brevdo, E.; Chen, Z.; Citro, C.; Corrado, G.S.; Davis, A.; Dean, J.; Devin, M.; et al. Tensorflow. Available online: https://zenodo.org/record/8118033 (accessed on 1 July 2023).
Figure 1. An overview of the method being developed by the authors.
Energies 16 05661 g001
Figure 2. DTE Energy’s service territory.
Energies 16 05661 g002
Figure 3. An illustration of the data for a single transformer on a single day.
Energies 16 05661 g003
Figure 4. An example of the day-type determination using PAA and K-Means clustering with nine clusters considering the solar irradiance and temperature.
Energies 16 05661 g004
Figure 5. An example Markov chain for day cluster transitions with nine day-type clusters in the month of January. The temperature and solar irradiance for these day types are shown in Figure 4 with day-type 0 having the lowest temperature range and day-type 2 having the highest temperature range. The temperature range for day-type 6 is between day-type 0 and day-type 2, and the solar irradiance for all cases is a similar distribution.
Energies 16 05661 g005
Figure 6. Data issues identified via the LOF method.
Energies 16 05661 g006
Figure 7. R2 fit to the training data with variations in the number of day clusters and load clusters using the k-shape clustering method.
Energies 16 05661 g007
Figure 8. Clustering training process steps.
Energies 16 05661 g008
Figure 9. Clustering forecast testing process steps.
Energies 16 05661 g009
Figure 10. Illustration of the TLM results of the clustering steps.
Energies 16 05661 g010
Figure 11. Illustration of Neural Network Refinement.
Energies 16 05661 g011
Figure 12. Community detection illustration used in the data segmentation area of focus.
Energies 16 05661 g012
Figure 13. (a) Architecture A used in the Neural Network Refinement experiments; and (b) Architecture B used in the Neural Network Refinement experiments.
Energies 16 05661 g013
Figure 14. (a) Area 1 neural network test accuracy compared to the training time with and without transfer learning; and (b) Area 2 neural network test accuracy compared to the training time with and without transfer learning.
Energies 16 05661 g014
Figure 15. Neural Network Refinement summary of results.
Energies 16 05661 g015
Table 1. Clustering summary of results.
Clustering Method *R2 **Training Time (s) ***
K-Shape 69.3%1716
K-Means with Dynamic Time Warping (DTW)78.5%7175
Agglomerative with Average Linkage78.1% 69.92
Agglomerative with Ward Linkage and PCA78.5% 66.18
Agglomerative with Ward Linkage and
Piecewise Aggregate
79% 69.13
Agglomerative with Ward Linkage and
Slopewise Aggregate Approximation
78.3%69.96
Agglomerative with Ward Linkage, Piecewise Aggregate Approximation and Slopewise Aggregate Approximation79%72.27
K-Means with Piecewise Aggregate Approximation and Slopewise Aggregate Approximation—Using a GPU79%66.84
K-Means with Piecewise Aggregate
Approximation—Using a GPU
79%56.83
* DBSCAN was another method attempted, which showed poor results; ** With 20 Day Clusters and 20 Load Clusters using solar irradiance and temperature data; *** System Specifications: CPU: AMD Ryzen 7 5800X with 3801 MHz Default Clock Speed, GPU: NVIDIA GeForce RTX 3060 It, RAM: 2 X Kingston HP37D4U1S8ME-8XR-DD4 for 16 GB, Motherboard: HP 8876.
Table 2. Overall process results.
StepTime (min)Area 1 R2Area 2 R2
Weather and Load Clustering6Train: 90%Train: 87%
Forecast: 78%Forecast: 63%
Community Detection2N/AN/A
Neural Network Refinement40Train: 90%Train: 83%
Forecast: 85%/83%Forecast: 75%/69%
Disclaimer/Publisher’s Note: The statements, opinions and data contained in all publications are solely those of the individual author(s) and contributor(s) and not of MDPI and/or the editor(s). MDPI and/or the editor(s) disclaim responsibility for any injury to people or property resulting from any ideas, methods, instructions or products referred to in the content.

