Article

A Study on the Spatial Distribution and Gradient Transfer of Atmospheric Pollution Intensive Industries Such as the Thermal Power Industry in Hebei Province

1
School of Business, Ludong University, 186 Hongqizhong Road, Yantai 264025, China
2
School of Business Administration, Hebei University of Economics and Business, Shijiazhuang 050061, China
3
School of Sports and Arts, Hebei Sport University, Shijiazhuang 050041, China
4
School of Public Administration, Hebei University of Economics and Business, Shijiazhuang 050061, China
*
Author to whom correspondence should be addressed.
Energies 2023, 16(13), 5114; https://doi.org/10.3390/en16135114
Submission received: 11 May 2023 / Revised: 29 June 2023 / Accepted: 30 June 2023 / Published: 2 July 2023

Abstract

:
Owing to a long-term, extensive development model and inadequate industrial development planning, cases of atmospheric environment pollution frequently occur in Hebei province. By using such approaches as the Spatial Gini Coefficient, the Herfindahl–Hirschman Index and location entropy, this paper analyzes the spatial-distribution characteristics of atmospheric pollution-intensive industries such as the thermal power industry in Hebei province. As shown, atmospheric pollution-intensive industries, such as the thermal power industry in Hebei province, excessively cluster. As industrial agglomeration continuously intensifies, the spatial imbalance becomes increasingly prominent. Taking the number of days with excellent air quality as a benchmark, this paper divides prefecture-level cities of Hebei province into four types of industrial management and designs targeted strategies for the optimization of atmospheric pollution-intensive industries, such as the thermal power industry. In terms of policies, Type I and Type II cities are advised to strengthen the transfer of atmospheric pollution-intensive industries such as the thermal power industry, and Type III and Type IV cities are advised to improve capacities in atmospheric self-purification and green-technology innovation in a bid to help government departments to scientifically manage atmospheric pollution-intensive industries such as the thermal power industry.

1. Introduction

As the 2021 China Ecological Environment Status Bulletin released by the Ministry of Ecology and Environment of the People’s Republic of China suggested, among 337 prefecture-level cities nationwide, the average proportion of cities with excellent air quality reached 87.5%, and 121 cities failed to meet the standards of excellent air quality. In cities in the Beijing–Tianjin–Hebei Region and the neighboring regions, the average number of days with excellent air quality was 67.2%, which is 19.5% lower than that in the Yangtze River Delta. In the treatment of the atmospheric environment, Hebei province should give priority to the prevention of fog-haze pollution in the autumn and winter. Because of the excessive agglomeration of atmospheric pollution-intensive industries such as iron and steel, petrochemical and thermal power in Hebei province, its atmospheric pollution features soot-type particulate matter. Atmospheric pollutants are immensely emitted. Hebei ranks first in the emission of nitrogen oxides and particulate matter (PM) and second in the emission of sulfur dioxide in China. Simultaneously, with the coordinated development of the Beijing–Tianjin–Hebei Region and the continuous adjustment of regional industrial structure, Hebei undertakes the transfer of atmospheric pollution-intensive industries such as steel and iron and thermal power in Beijing and Tianjin, which aggravates atmospheric pollution. Tian et al. [1] analyze the status quo of industrial transfer in Beijing–Tianjin–Hebei urban agglomeration by using the model of the ‘transfer-receive-dynamic process’, arguing that industrial transfer has become an inevitable trend and that the overall capacity of Hebei to undertake industrial transfer has obvious regional heterogeneity, which has different effects on regional economic development.
The existing scholarship on atmospheric pollution-intensive industries, such as the thermal power industry (hereinafter called ‘APIISTPI’), mainly centers on three aspects. The first aspect is the relationship between industrial agglomeration and environmental pollution. He et al. [2] examined the spatial location and development trend of the agglomeration of pollution-intensive industries and environmental pollution, revealing that they form an inverted U-shaped nonlinear relationship. Chen et al. [3] discovered the spatial effect in the agglomeration of the manufacturing industry. As suggested, the agglomeration of both local and non-local manufacturing industries has a non-linear effect on local environmental pollution, reducing the emission of pollutants in the long term. Chen and Huang et al. [4] emphasized that industrial agglomeration promotes industrial cooperation and enhances the innovation capacity of technological systems, thus improving the treatment of environmental pollution. Chen et al. [5] argued that industrial agglomeration significantly optimizes end-of-pipe treatment technology among industries. Gai and Zhou et al. [6] noticed that industrial agglomeration leads to the homogenization of industrial structures and the waste of resources, which intensifies environmental pollution. Qiu et al. [7] stressed that presently, the industrialization agglomeration index has peaked in China, and therefore, environmental pollution deteriorates with the expansion of industrial agglomeration. These studies show a nonlinear relationship between industrial agglomeration and environmental pollution.
The second aspect is the study of the spatial distribution of industries. Tang and Dou et al. [8] regarded the spatial-transfer pattern of pollution-intensive industries as a key issue for local and national sustainable development. Wen and Su et al. [9] confirmed that local pollutant-emission standards remarkably affect the spatial distribution of pollution-intensive industries. He and Wu et al. [10] believed that the positive externality of technological spillover and the negative externality of environmental pollution that arise from the agglomeration of economic activities have an important impact on the behavior of spatial choice of economic entities and then on the structural balance of industrial spatial distribution. Wang et al. [11] concluded that industrial pollution constitutes the main source of urban atmospheric pollutants and that coal-fired energy-intensive industries have the greatest impact on sulfur dioxide concentration. The above research shows that atmospheric pollution-intensive industries have significant spatial effects.
The third aspect is the study of industrial transfer. Kaname A. [12], a Japanese economist, first proposed the Flying Geese Paradigm for industrial transfer, which originally intended to summarize the development trajectory of Japanese industrial transfer. Ma et al. [13] initiated a ‘multi-center radiation’ industrial transfer model, which achieves large-scale gradient progress via small-scale multi-center radiation. Chen et al. [14] proposed the ‘marginal penetration’ transfer model, which requires the coordination and integration of economic development in developed and developing regions that are geographically connected, and to boost the full flow of economic resources in various regions. In this way, some industries in economically developed regions, which gradually lose comparative advantages with the rise of marginal cost, eventually transfer to economically developing regions. Jiang and Sun et al. [15] suggested the holistic transfer model, which involves the overall transfer of technology, equipment, management and talents from industries in developed regions to developing regions so as to establish new industrial production bases. Fu and Zeng et al. [16] summed up two models of industrial transfer, i.e., selective transfer and replicable transfer. Xiang and Hu et al. [17] noted that developed regions could transfer non-core-value production chains without competitive advantages to developing regions by means of outsourcing and OEM while promoting industrial integration and divestiture.
In the research on industrial transfers between eastern and western China, Huang et al. [18] proposed six models, i.e., factor flow and direct investment, corporate internal integration, virtual corporate integration, the new Flying Geese Paradigm, industrial cluster transfer and industrial transfer parks. Ma and Hu et al. [19] stated that inter-regional industrial transfer models in China basically include cost-oriented transfer, market development transfer, diversified operation transfer, competition follow-up transfer, supply-chain connection transfer, economies-of-scale-oriented transfer and policy-oriented transfer. Li and Li et al. [20] measured the industrial transfer via the transfer of embodied carbon. The above shows that industrial transfers are primarily oriented toward the government and the economy. Developing regions often undertake the industrial transfer of developed regions. Additionally, the development conditions remain inadequate in some transfer-in regions, which exacerbates the negative externalities of industrial agglomeration.
In summary, a few researchers have studied the industrial gradient transfer based on the time–space distribution of industrial agglomeration, and the time–space distribution of industrial agglomeration can objectively reflect the quality of the industrial transfer and provide a basis for the scientific design of industrial gradient transfer. This paper takes APIISTPI in Hebei province as a research subject. In the ‘Twelfth Five-Year Plan’, six major industries, including thermal power, steel and iron, non-ferrous metal, petrochemical, cement and chemical industries, are the key industries in the prevention and treatment of atmospheric pollution [21]. This paper chooses the electric and thermal power production and supply industry, the ferrous metal smelting and calendering processing industry, the petroleum processing and coking industry, the chemical raw material and chemical product manufacturing industry, the non-metallic mineral product industry and the non-ferrous metal smelting and calendering processing industry as index parameters for APIISTPI. By using such approaches as the Spatial Gini Coefficient, Herfindahl–Hirschman Index and location entropy, this paper analyzes the spatial-distribution characteristics of APIISTPI in Hebei province, designs a mechanism for the gradient transfer of APIISTPI, and provides recommendations for achieving sustainable economic development in Hebei province.

2. Research Methods and Data Sources

2.1. Research Methods

Traditional measures of industrial agglomeration include the Spatial Gini Coefficient, location entropy index, Herfindahl–Hirschman Index, regional entropy index and Krugman Specialization Index [22]. The location entropy index is a measurement of relative agglomeration, while the Spatial Gini Coefficient Herfindahl–Hirschman Index is the measurement of absolute agglomeration. The measurement of absolute agglomeration requires more detailed industry data. The Spatial Gini Coefficient only considers the degree of agglomeration between industries and ignores the differences in corporate size and concentration among different industries. The Herfindahl–Hirschman Index(HHI) focuses on reflecting the differences in industrial concentration between regions [23].
Spatial balance refers to the spatial allocation model of various production factors in industrial development, as well as the layout of regional production capacity that proves compatible and coordinated with natural resources and the environmental endowment of one country or region and meets the needs of sustainable development. As an important technological approach, the Gini Coefficient is widely used to describe the distribution differences between various spatial factors and compare regional distribution and differences between research subjects and cities in order to reveal regional distribution and change trends. The comprehensive calculation formula of the Gini Coefficient is expressed as follows:
G = i N S i x i 2
In particular, G stands for the Spatial Gini Coefficient, Si stands for the proportion of relevant indexes of APIISTPI in region i in Hebei province, xi stands for the proportion of relevant indexes of region i in Hebei Province, and N stands for the number of enterprises in Hebei Province. Among them, the value of G is between 0 and 1. If the average value of G is closer to 0, the distribution of the industry is more balanced; if the average value of G is closer to 1, the imbalance enlarges, or industrial agglomeration intensifies.
Restricted by the availability of data, this paper analyzes the degree and trend of agglomeration in APIISTPI in Hebei province by using location entropy, calculates the regional agglomeration of APIISTPI in Hebei province by using the Spatial Gini Coefficient, and measures the industrial agglomeration of APIISTPI in Hebei province by using the Herfindahl–Hirschman Index (HHI), with an attempt to further test the analysis results.

2.2. Data Sources

The panel data in this paper are mainly derived from China Statistical Yearbook, China Industrial Statistical Yearbook and China Environmental Statistical Yearbook. The area data are derived from China Statistical Yearbook. The PM10 data are derived from local Environmental Statistics Bulletins. The PM2.5 data are derived from the Chinese PM2.5 Concentration Data of Columbia University. In terms of emission scale and intensity, the data on the emissions of industrial sulfur dioxide, industrial nitrogen oxide and industrial particulate matter, as well as the total industrial output value and the number of enterprises, are derived from China Industrial Statistical Yearbook.

3. Research Analysis

Using the emission scale and intensity of industrial atmospheric pollutants and the industrial data of various provinces in China, this paper first calculates the atmospheric pollution intensity index of different industries in China, and proceeds to choose six industries with higher atmospheric pollution intensity index as atmospheric pollution-intensive industries, i.e., the electric and thermal power production and supply industry, the ferrous metal smelting and calendering processing industry, the petroleum processing and coking industry, the chemical raw material and chemical product manufacturing industry, the non-metallic mineral product industry and the non-ferrous metal smelting and calendering processing industry [24]. The spatial quantile-quantile plot can classify corresponding indicator observations of various spatial units according to a numerical value and represent the spatial distribution of the research indicators. In order to detail the overall spatial distribution and change of APIISTPI, this paper classifies the gross industrial output value of APIISTPI in Hebei province and draws quantile-quantile (Q-Q) plots of APIISTPI in various regions in 2006, 2009, 2012, 2015 and 2019. By comparing the Q-Q plots, this paper investigates the regional agglomeration of APIISTPI. A larger gross industrial output value of APIISTPI in one region means a larger number or scale of enterprises in APIISTPI. Or the region has a dense distribution of APIISTPI. Otherwise, the region has a sporadic distribution of APIISTPI.

3.1. The Overall Space-Time Distribution of APIISTPI

In Figure 1, 11 prefecture-level cities in Hebei Province are categorized into six levels in line with the gross industrial output value of APIISTPI. The deepest color represents the densest distribution of APIISTPI. As the color becomes lighter, the intensity of APIISTPI weakens. In 13 years, from 2006 to 2019, Tangshan produced the highest gross industrial output value of APIISTPI, and Shijiazhuang and Handan stayed in the second gradient. Tangshan adjoins the suburbs of Beijing. By dint of favorable geographical location and abundant natural resources, Tangshan undertakes the transfer of a large number of APIISTPI from Beijing, with a relatively high gross industrial output value. Since 2010, Tangshan has accelerated the adjustment of its industrial structure. Concerning the industrial added value of enterprises above designated size, six industries, i.e., steel and iron, building material, energy, chemical engineering, coking and thermal power, have achieved an added value of 137.832 billion yuan, with a year-on-year increase of 8.7%. As the capital of Hebei Province, Shijiazhuang attracts a good deal of funds and talent. In addition, advanced railway transportation ensures an adequate supply of raw materials and fuels for APIISTPI. Therefore, Shijiazhuang has stood in the second gradient. Located in the south of Hebei Province, Handan possesses rich natural resources for relevant industries. It has been an old resource-based industrial base in Hebei Province and an important production base for metallurgy, coal, power, textiles, ceramic and building material industries in China.
From 2006 to 2019, Baoding, Qinhuangdao, Zhangjiakou and other cities stayed in the end-of-pipe gradient. The main reason lies in that Baoding, Langfang, Zhangjiakou and other places encircle Beijing and Tianjin. To guarantee air quality in Beijing, these cities curb the development of APIISTPI.

3.2. The Spatial Distribution of APIISTPI

3.2.1. The Spatial Distribution of the Chemical Raw Material and Chemical Product Manufacturing Industry

As Figure 2 shows, the overall distribution of the industry roughly forms a radial pattern centered on Shijiazhuang. From 2006 to 2019, the overall development level of the industry in Hebei Province continued to rise, and Shijiazhuang stayed in the first quantile. In 2006, Cangzhou and Tangshan stayed in the second quantile; in 2009, Cangzhou and Langfang stayed in the second quantile, and in 2015, Cangzhou and Tangshan stayed in the second quantile.
There are multiple reasons. In 2006, Shijiazhuang maintained rapid industrial development and realized the simultaneous growth of economic benefit and production. In addition, Shijiazhuang has attained remarkable achievements in building a ‘medical city’ and has become one of three national bases for the biological industry, with the gross industrial output value of the pharmaceutical industry continuing to grow. The high degree of industrial correlation substantiates that the chemical industry (mainly the pharmaceutical industry) produces scale economies effect and considerable economic benefit. As an economic mainstay in Shijiazhuang, the chemical industry enlarges relative industrial agglomeration of the chemical raw material and chemical product manufacturing industry.
In 2006, Baoding deepened the reform of industrial enterprises and achieved an overall upturn in economic performance. Based on the IPOs of Swan Chemical Fiber, Lucky Film and Baoshuo Group, Baoding completed the capital increase and equity allocation of Swan Chemical Fiber and Baoshuo Group, as well as the shareholding system reform of large enterprises or groups, such as Tianwei Group, Fengfan Group and Lingyun Electronic. In 2006, the competitive industries in Baoding were mainly textiles, the production and supply of electricity, steam and hot water, chemical raw material and chemical product manufacturing, electrical machinery and equipment manufacturing, and non-metallic mineral product. In 2009, transportation equipment manufacturing with strong capital and technological strengths and high economic benefits developed rapidly in the ‘16th Five-Year Plan’, whose overall strength ranked first in the entire industry. Meanwhile, the non-ferrous metal smelting and calendering processing industry developed fast, yet, the chemical raw material and chemical product manufacturing industry dropped to the seventh place, whose industrial agglomeration decreased.
Tangshan slipped from the second gradient in 2006 to the third gradient in 2009. The reason was that in 2009, hammered by the global financial crisis, Tangshan vigorously implemented the ‘Five Decisive Campaigns’ and ‘Eight Major Projects’, furthered the adjustment of industrial structure, and significantly improved the level of industrial intensification. Nevertheless, the salt chemical industry, the coal chemical industry, the chemical fertilizer industry and the petrochemical industry were buffeted. The elimination of outdated production capacity was another reason.
In 2006, in Qinhuangdao, the primary processing and low-value-added raw material industry dominated the secondary industry. Enterprises that engaged in basic raw material products (e.g., glass, cement, paper-making, fertilizer and medium-thick steel sheet), primary processing products and labor-intensive products accounted for a high proportion of all manufacturing enterprises. Owing to technological progress, these long-term products, as well as high energy consumption and high pollution products, were sifted out, resulting in a decrease in industrial agglomeration.

3.2.2. The Spatial Distribution of the Non-Ferrous Metal Smelting and Calendering Processing Industry

As Figure 3 shows, in 2006, Shijiazhuang stayed in the first quantile; from 2009 to 2019, Baoding stayed in the first quantile, with a significant change in the spatial distribution of the non-ferrous metal smelting and calendering processing industry. In terms of industrial output value, Qinhuangdao also stayed in the second quantile. The reason is that Baoding possesses rich natural resources. The western mountainous areas contain abundant mineral resources, including over 50 varieties of metallic and non-metallic mineral resources, such as iron, copper, lead, zinc, granite, limestone and ceramic raw material, with vast potential markets and superior geographical location. With the implementation of the ‘Beijing Economic Circle’ strategy, Baoding expands outwardly. Within a radius of 150 km, a multi-level high-capacity consumption market takes shape, which covers a population of over 40 million and comprises Beijing, Tianjin, Shijiazhuang, Baoding and other cities. In the non-ferrous metal smelting and calendering processing industry, Baoding has a market share of up to 47% of Hebei, with great technological innovation strength and a prominent development advantage.
In 2005, Qinhuangdao was beset by an imbalanced industrial structure. As the demand outstripped the supply, the prices of major production materials skyrocketed. The grade of raw ore in mines decreased, the supply of resources remained severely inadequate, and structural contradictions worsened. In most varieties of non-ferrous metals, the processing capacity exceeds the smelting capacity, and the smelting capacity exceeds the concentrate guarantee capacity, with a prominent problem of blind investment in aluminum oxide, copper and lead-zinc smelting industries. In the aluminum processing industry, industrial agglomeration proves low, and product structure proves unreasonable. The high price of electrolytic copper causes business distress to copper processing enterprises. In lead-zinc smelting enterprises, environmental pollution accidents occur frequently. These factors reduce the industrial agglomeration of the non-ferrous metal smelting industry in Qinhuangdao.

3.2.3. The Spatial Distribution of the Electric and Thermal Power Production and Supply Industry

As Figure 4 shows, from 2006 to 2019, Tangshan stayed in the first quantile, and Shijiazhuang and Handan stayed in the second quantile. Douhe Power Plant, a national first-class thermal power plant, is in Tangshan. Since 2000, the industrial agglomeration of the electric and thermal power industry has remained high in Tangshan. In order to provide powerful support for other industries and secure industrial profits, Shijiazhuang and Handan enthusiastically developed the thermal power industry.

3.2.4. The Spatial Distribution of the Petroleum Processing and Coking Industry

As Figure 5 shows, from 2006 to 2019, the spatial distribution color of Cangzhou embodied the deepest color. The main reason was that in 2000, the petroleum processing industry developed slowly in Hebei. Noticeably, the advantage of the port facilitated the development of the petroleum industry in Cangzhou. According to the data, in 2015, leading industries in Cangzhou, e.g., petrochemical, pipeline equipment, metallurgy, mechanical manufacturing, textiles, clothing and food processing, achieved an industrial added value of 107.21 billion yuan, accounting for 85.3% of enterprises above designated size in Cangzhou, with an increase of 7.2%. Particularly, the petrochemical industry realized an industrial-added value of 34.37 billion yuan, accounting for the highest proportion of 27.3%. In 2017, the industrial added value increased by 3% vis-à-vis 2015. That is mainly because, in the mid-and long-term development plan for the oil refining industry, China advocates and guides the transfer of resource-based industries from resource-based cities to coastal areas with huge market demands and favorable conditions for the import of raw materials.
Additionally, large resource-based enterprises, especially large transnational corporations, draw their strategic blueprints in China, which form an important factor in promoting the distribution of large petrochemical and steel and iron projects in coastal areas. Their strategic choices are grounded in comprehensive factors in coastal areas, such as market size, transportation conditions, policy orientation, and proximity to international markets and raw material sources. The petrochemical industry in Cangzhou enjoys a long history. After several years of development, a complete production system matures, which covers the petrochemical, coal chemical and fine chemical industries. Generally speaking, the petrochemical industry shows a trend of chain and group-based development, becoming the foremost pillar industry in Cangzhou.

3.2.5. The Spatial Distribution of the Non-Metallic Mineral Product Industry

As Figure 6 shows, from 2006 to 2019, the spatial distribution of Shijiazhuang and Tangshan embodied deeper colors. Since 2006, the spatial distribution of Hengshui has displayed a trend of industrial agglomeration. After 2005, under the influence of national macro-control, the entire cement industry fluctuated wildly. In Tangshan, the industrial agglomeration of the cement industry diminishes. FRP products in Hengshui have a high market share nationwide. At the end of 2004, the production capacity was discontinued for the sake of environmental protection in Hengshui, resulting in a decrease in marginal supply in 2005. As environmental protection was upgraded and environmental supervision was tightened, the industrial agglomeration of the glass industry continued to decrease. In the ‘10th Five-Year Plan’, industrial resources were optimized with policy support.
In 2011, the BBMG Group restructured Hebei Taihang Cement, which tremendously increased its production capacity. The production capacities of Dingxin Group and Quzhai Group in Shijiazhuang rivaled that of Tangshan Jidong Cement in 2001. This solved the problems of high energy consumption per unit output value, systematic drawback, insufficient investment and weak functionality of the cement industry in Shijiazhuang in the ‘9th Five-Year Plan’. Taking the Liulihe Cement Plant as the benchmark, the BBMG Group quickened the transformation of its cement plant. By the end of the ‘13th Five-Year Plan’, the BBMG Group had realized the transformation and upgrading of 42 enterprises, invested in 58 environmental-protection industrial projects, and further improved the industrial agglomeration of the non-metallic mineral product industry in Shijiazhuang.

3.2.6. The Spatial Distribution of the Ferrous Metal Smelting and Calendering Processing Industry

As Figure 7 shows, from 2006 to 2019, the spatial distribution of Zhangjiakou changed from deep to light. The spatial distribution of Handan embodied deeper color with a high level of industrial agglomeration. The spatial distribution of Tangshan embodied the deepest color, showing a high level of industrial agglomeration. In 2005, the spatial distribution shifted from Zhangjiakou and Handan to Tangshan and formed industrial agglomeration. This trend continued until 2017. There are multiple reasons. In the ‘10th Five-Year Plan’, the domestic steel and iron market continued to thrive, and China introduced a series of policies so that the craze for the export of steel material would wear off. Urged by The Policies on the Development of the Steel and Iron Industry, Zhangjiakou swiftly eliminated outdated production capacity, formulated the standards for steel and iron energy consumption, and supervised energy conservation and emission reduction. Many small and medium-sized enterprises had to be closed, converted or restructured.
In 2005, in Handan, the supply-demand relationship in the steel and iron industry presented a landscape of ‘excessive supply and structural imbalance’. Small and medium-sized steel and iron enterprises in Handan developed quickly. With no substantial progress in industrial mergers and acquisitions, the industrial agglomeration of the steel and iron industry tended to decline. Restricted by the existence of regional barriers, the deterioration of market performances and the absence of investors, the industrial agglomeration of the steel and iron industry in Handan can hardly be improved in the short term. After 2004, Hebei prioritized the optimization of industrial layout and the adjustment of product structure in the development of the steel and iron industry and re-distributed the newly added production capacity along the coastal cities. Based on the Caofeidian Port for large ores, Hebei organized a steel and iron complex and built Tangshan into the largest steel and iron base in China [21].

3.3. The Analysis of Spatial Balance of APIISTPI

The spatial quantile–quantile plot basically shows the spatial distribution pattern of APIISTPI in Hebei Province. However, it fails to effectively explain the intrinsic spatial correlation of APIISTPI among cities in Hebei Province. Therefore, this paper uses such approaches as Spatial Gini Coefficient to further analyze the issue. Table 1 and Table 2 show the calculation results.
In Table 1, the emissions of industrial dust and the balance degree of industrial sulfur dioxide in APIISTPI in Hebei province are relatively high. From 2006 to 2009, the G-values were higher than 0.3. The mean value of the emission and the balance degree tended to be close to 1, with an overall trend of imbalanced development. The G-values of PM2.5 and PM10 tend to be close to 0, indicating that the distribution of PM2.5 and PM10 is more balanced. The atmospheric pollution comprehensive index mainly refers to the measurement of the level of industrial agglomeration by using the Spatial Gini Coefficient, Herfindahl–Hirschman Index and location entropy [24]. The results show that atmospheric pollution in Hebei province presents a trend of balance. Hebei relies heavily on the petroleum, coal and other fuel processing industry, the ferrous metal smelting and calendering processing industry and the chemical raw material and chemical product manufacturing industry, which emit lots of industrial smoke and dust and industrial sulfur dioxide. Particularly, since the implementation of the Beijing–Tianjin–Hebei Coordinated Development, Hebei has undertaken the transfer of the heavy industries in Beijing and Tianjin and increased the degree of industrial agglomeration. Therefore, the spatial imbalance of pollutant emission in APIISTPI in Hebei became more prominent after 2010. As Table 2 verifies, the spatial imbalance of APIISTPI in Hebei province enlarges. Notably, in the petroleum, coal and other fuel processing industry and the ferrous metal smelting and calendering processing industry, the Spatial Gini Coefficients reach higher than 0.5 and approach 1. This means that as industrial agglomeration intensifies and spatial imbalance arises, the industrial agglomeration has a significant impact of negative externality on the environment. Under such circumstances, Hebei must scientifically control or regulate industrial agglomeration so as to balance the spatial distribution of industrial agglomeration and achieve the positive externality of industrial agglomeration on the environment.

4. Conclusions

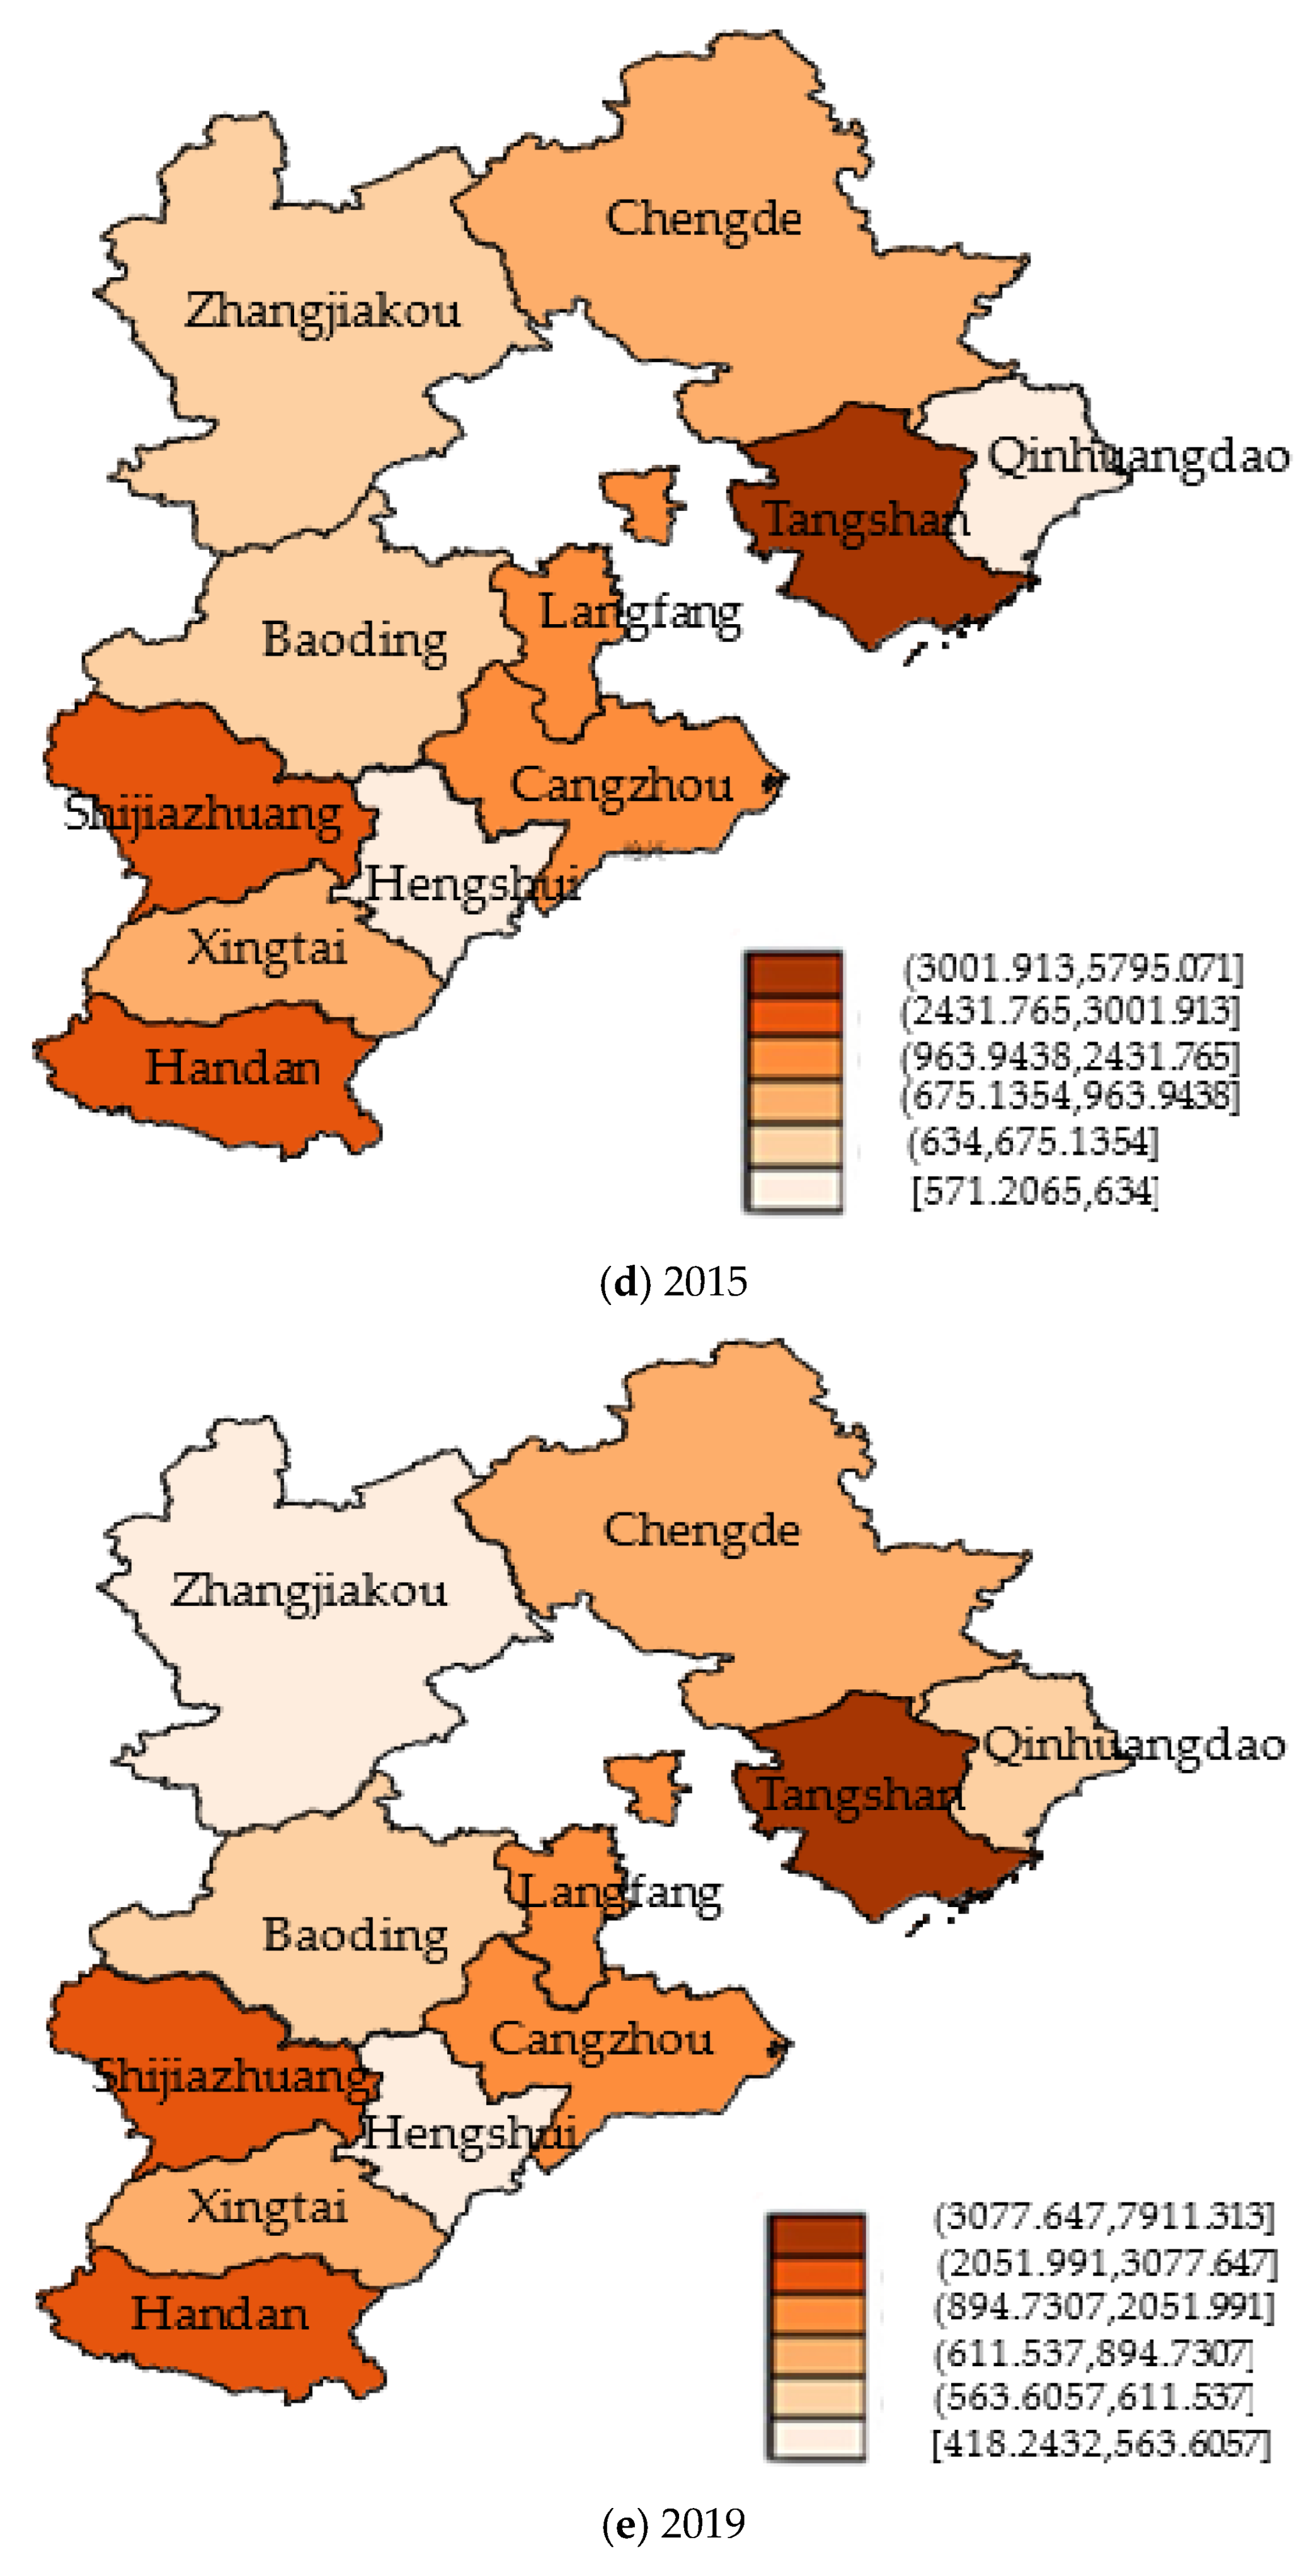
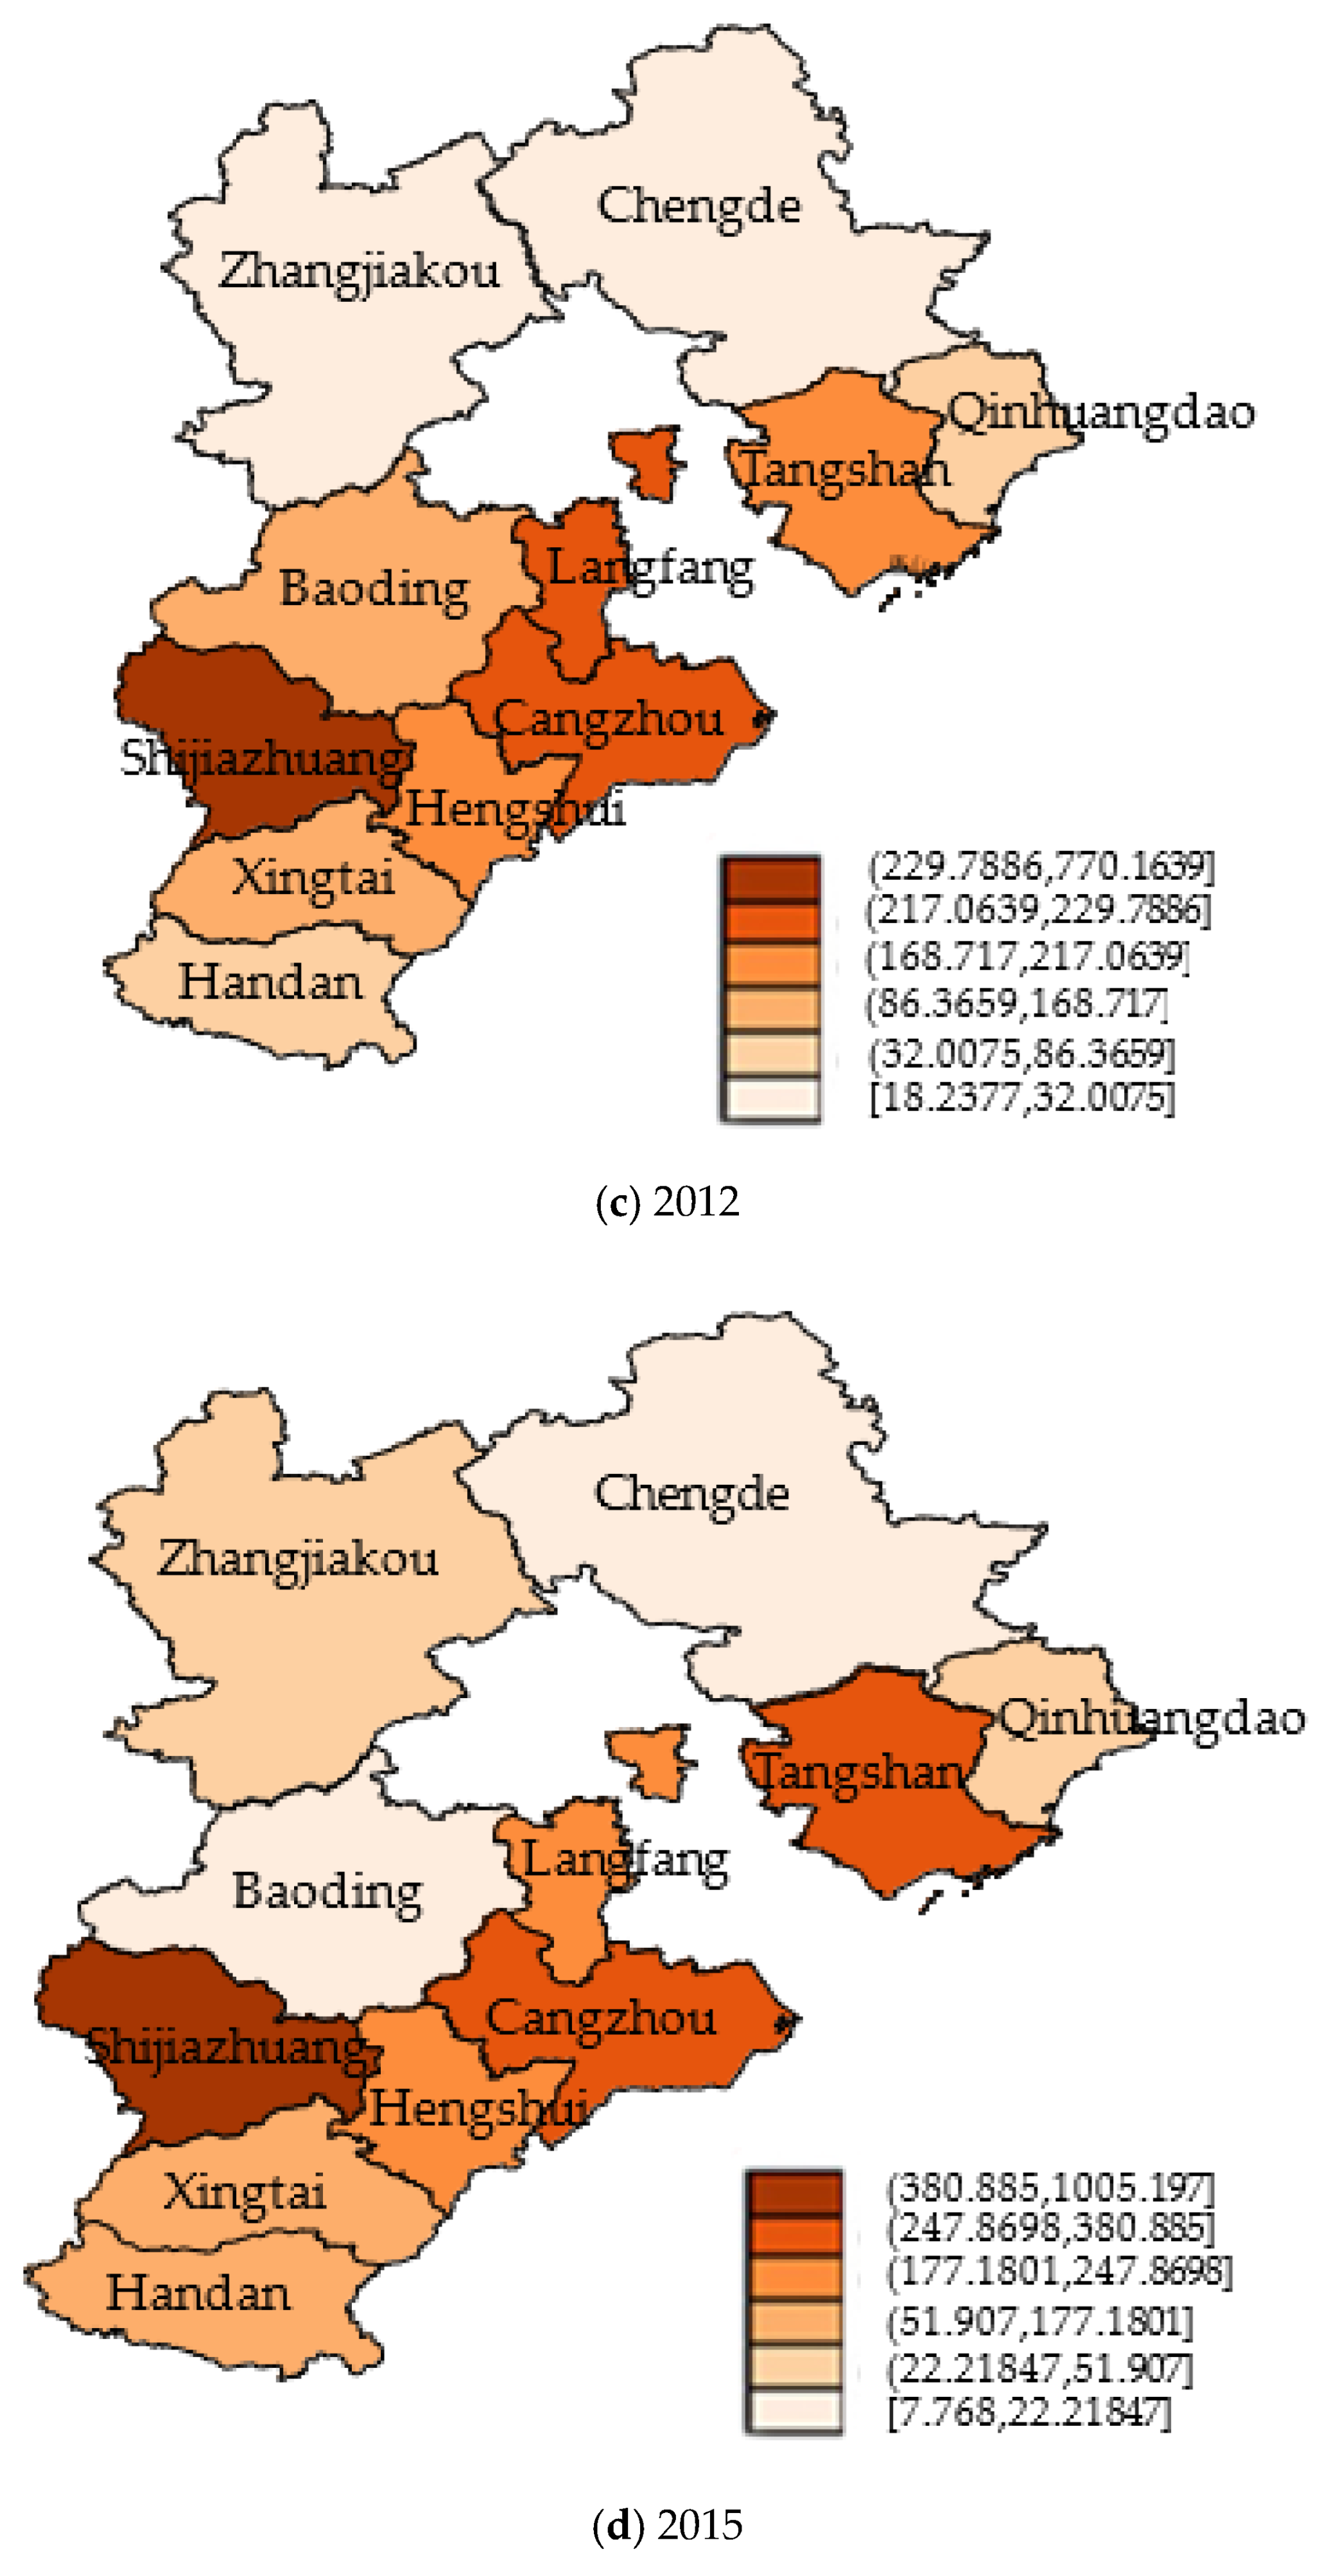
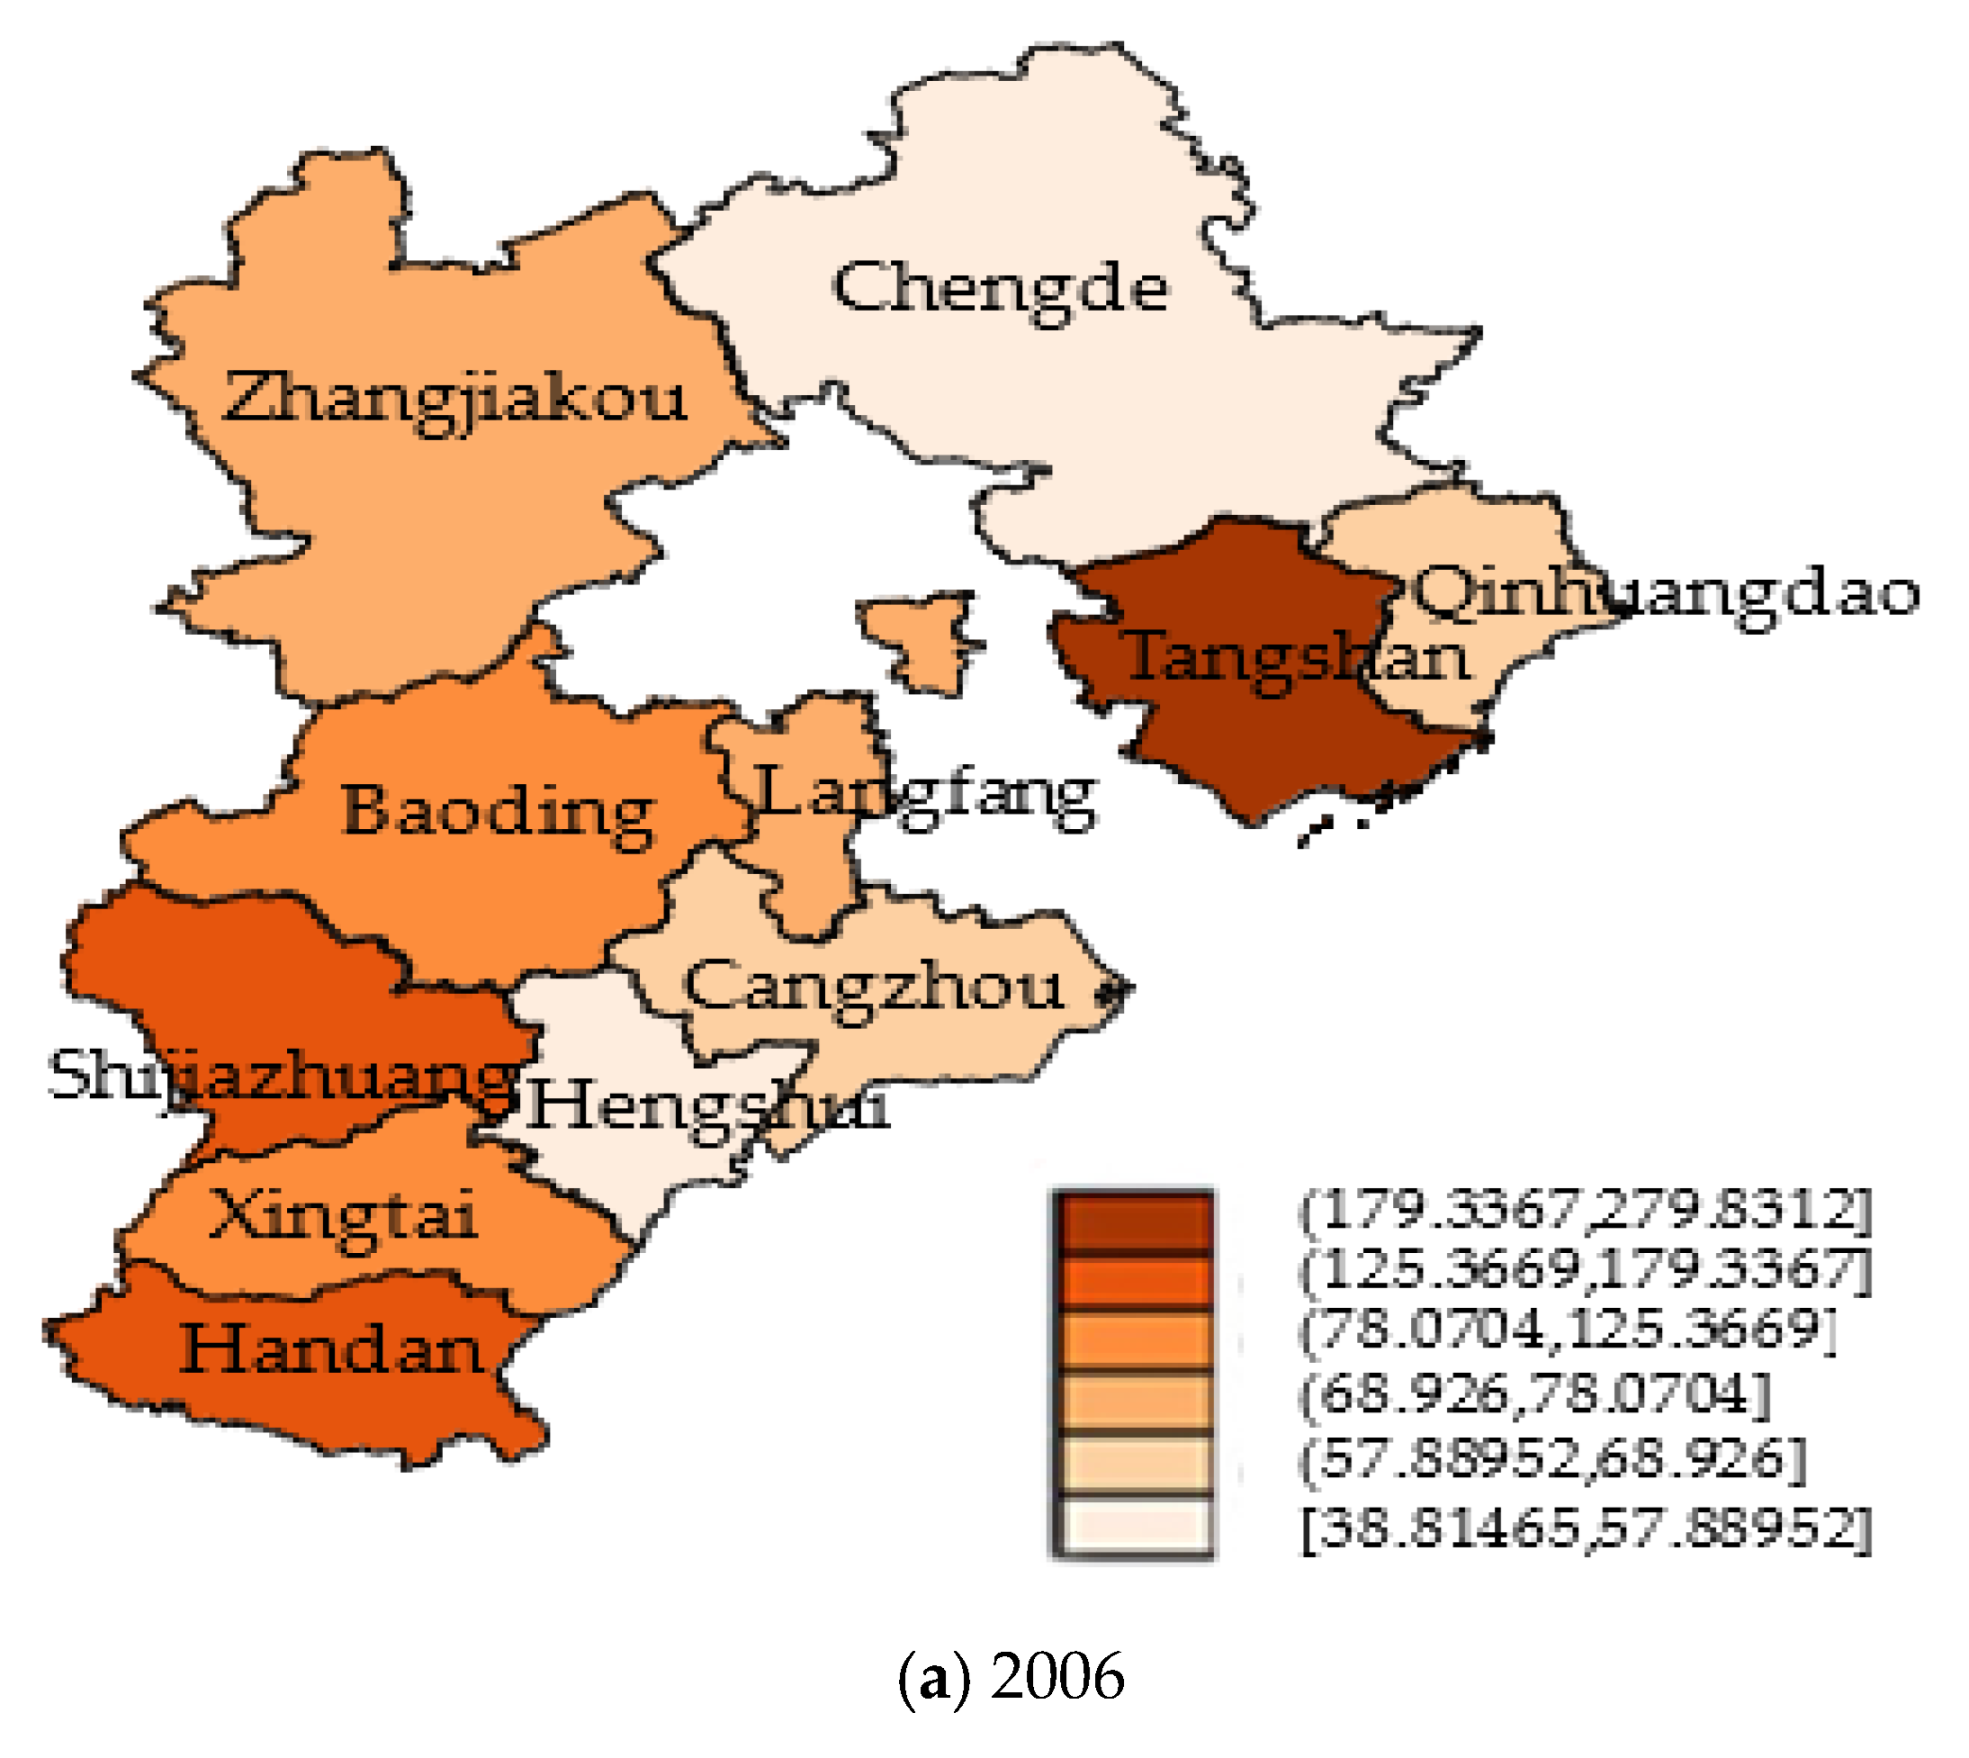
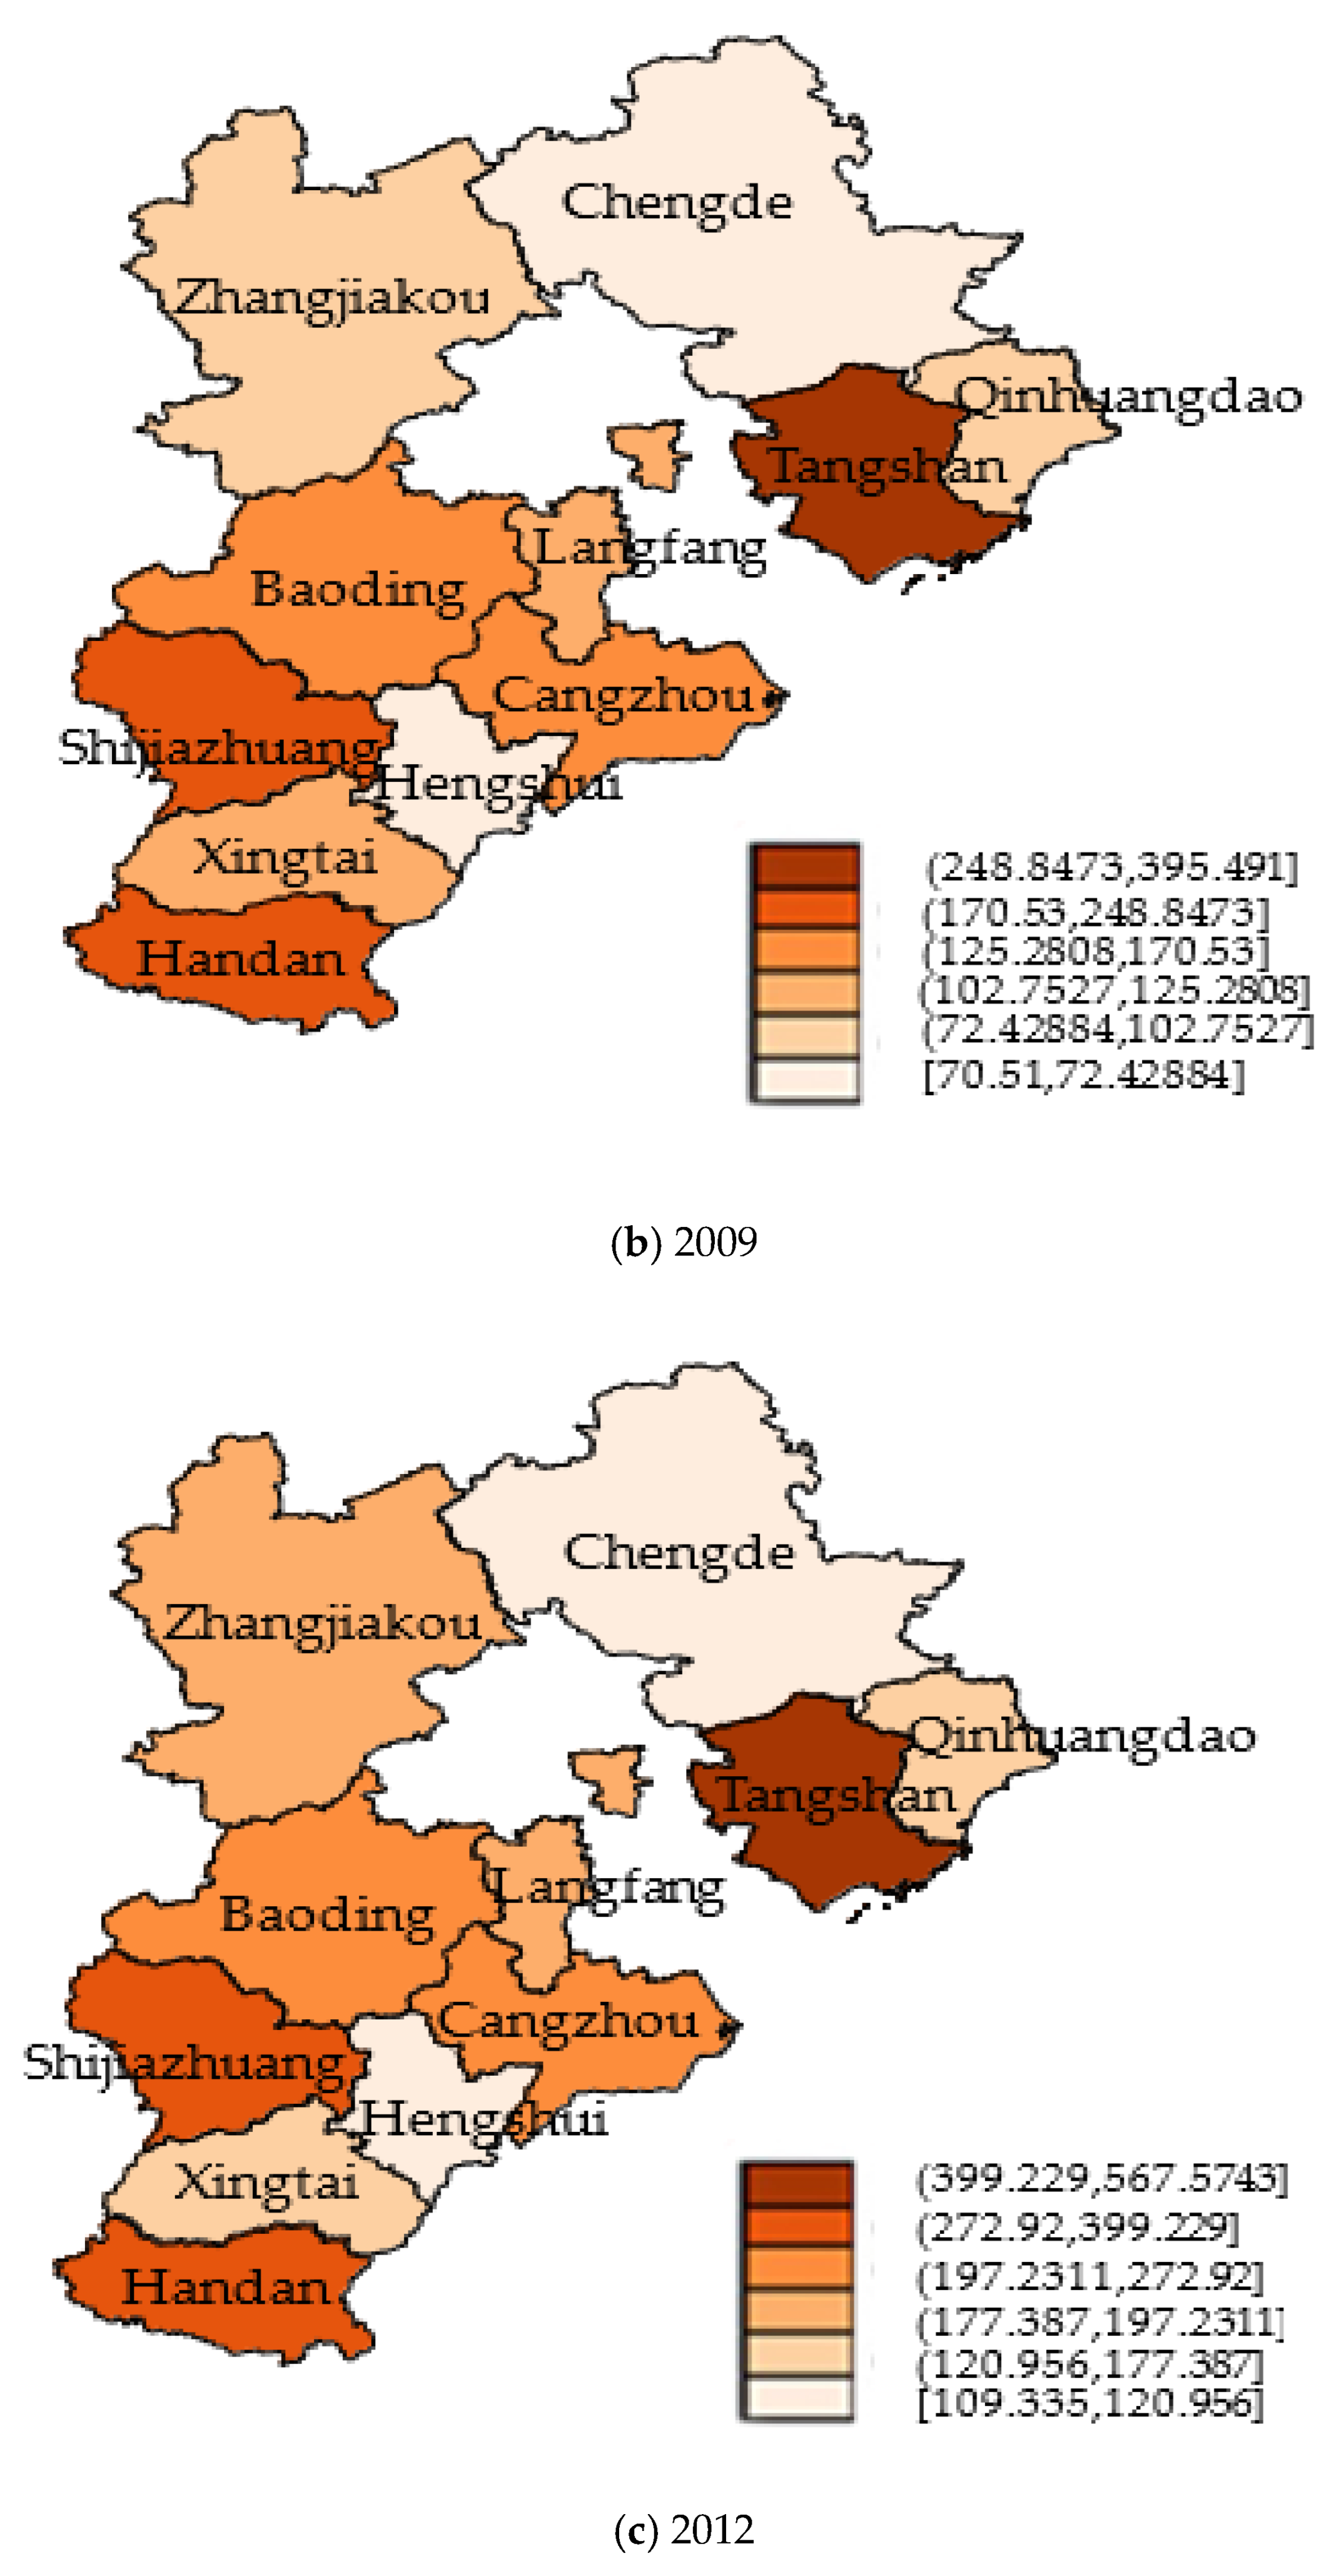
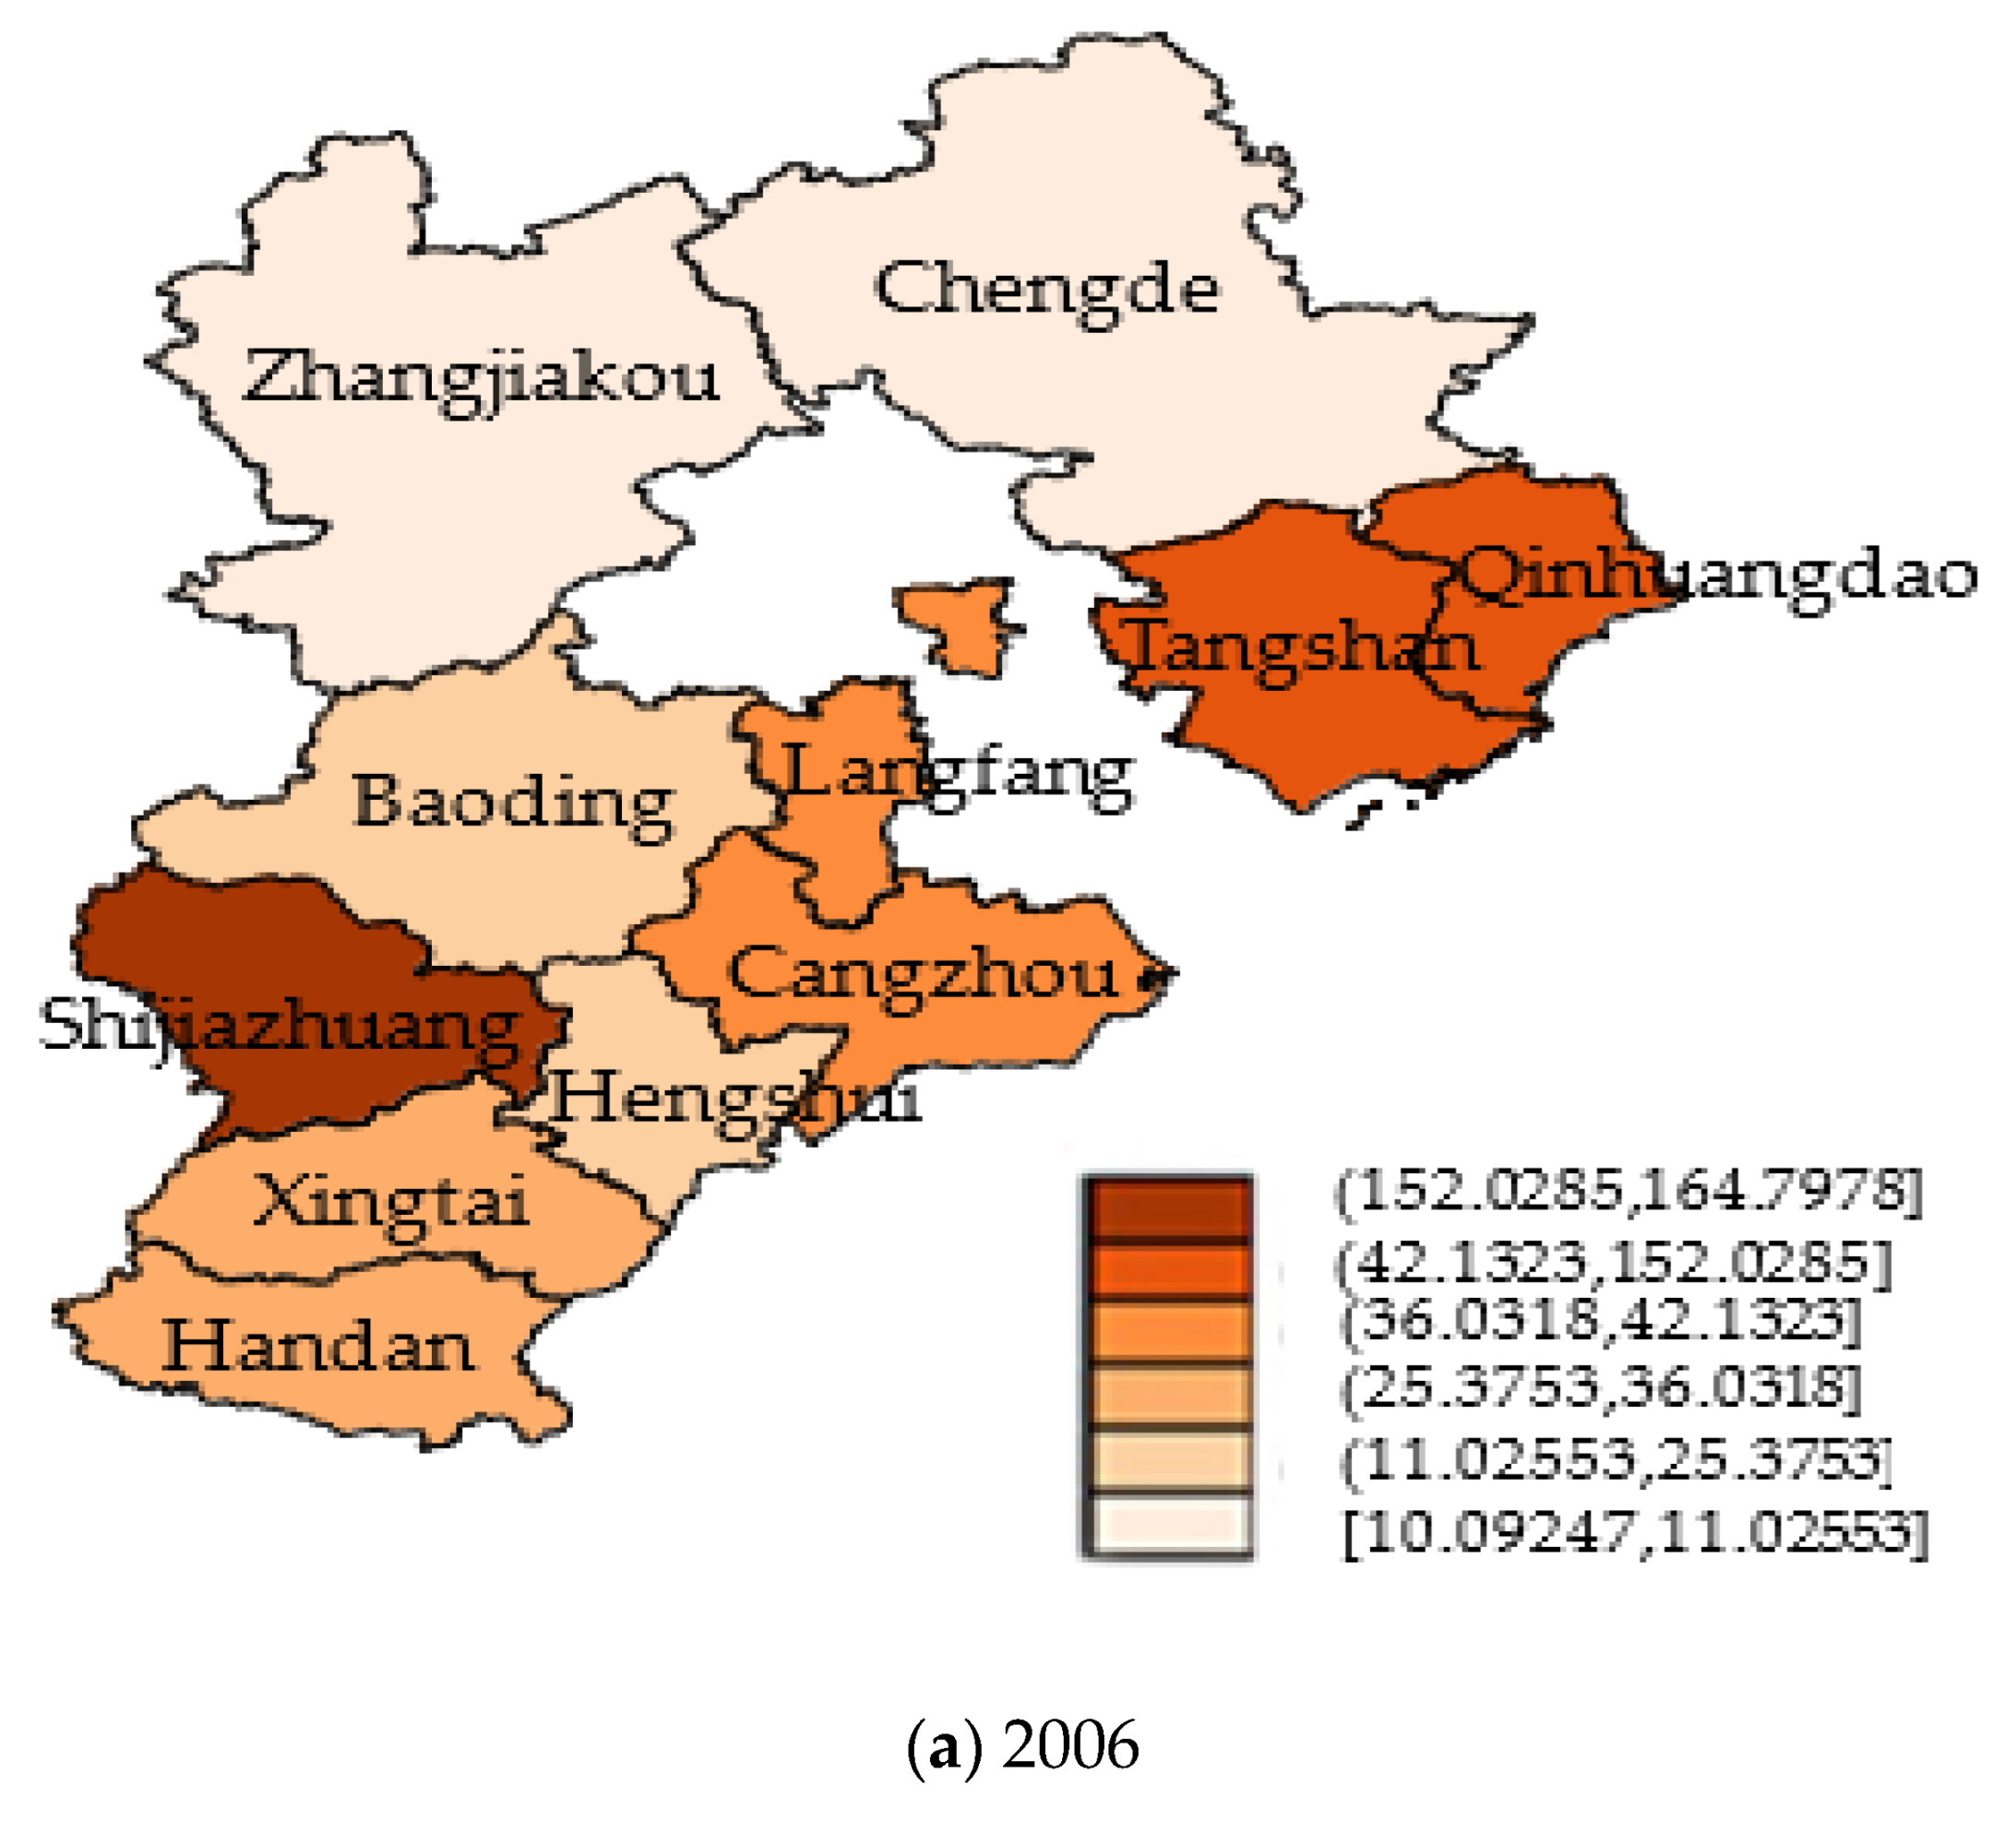
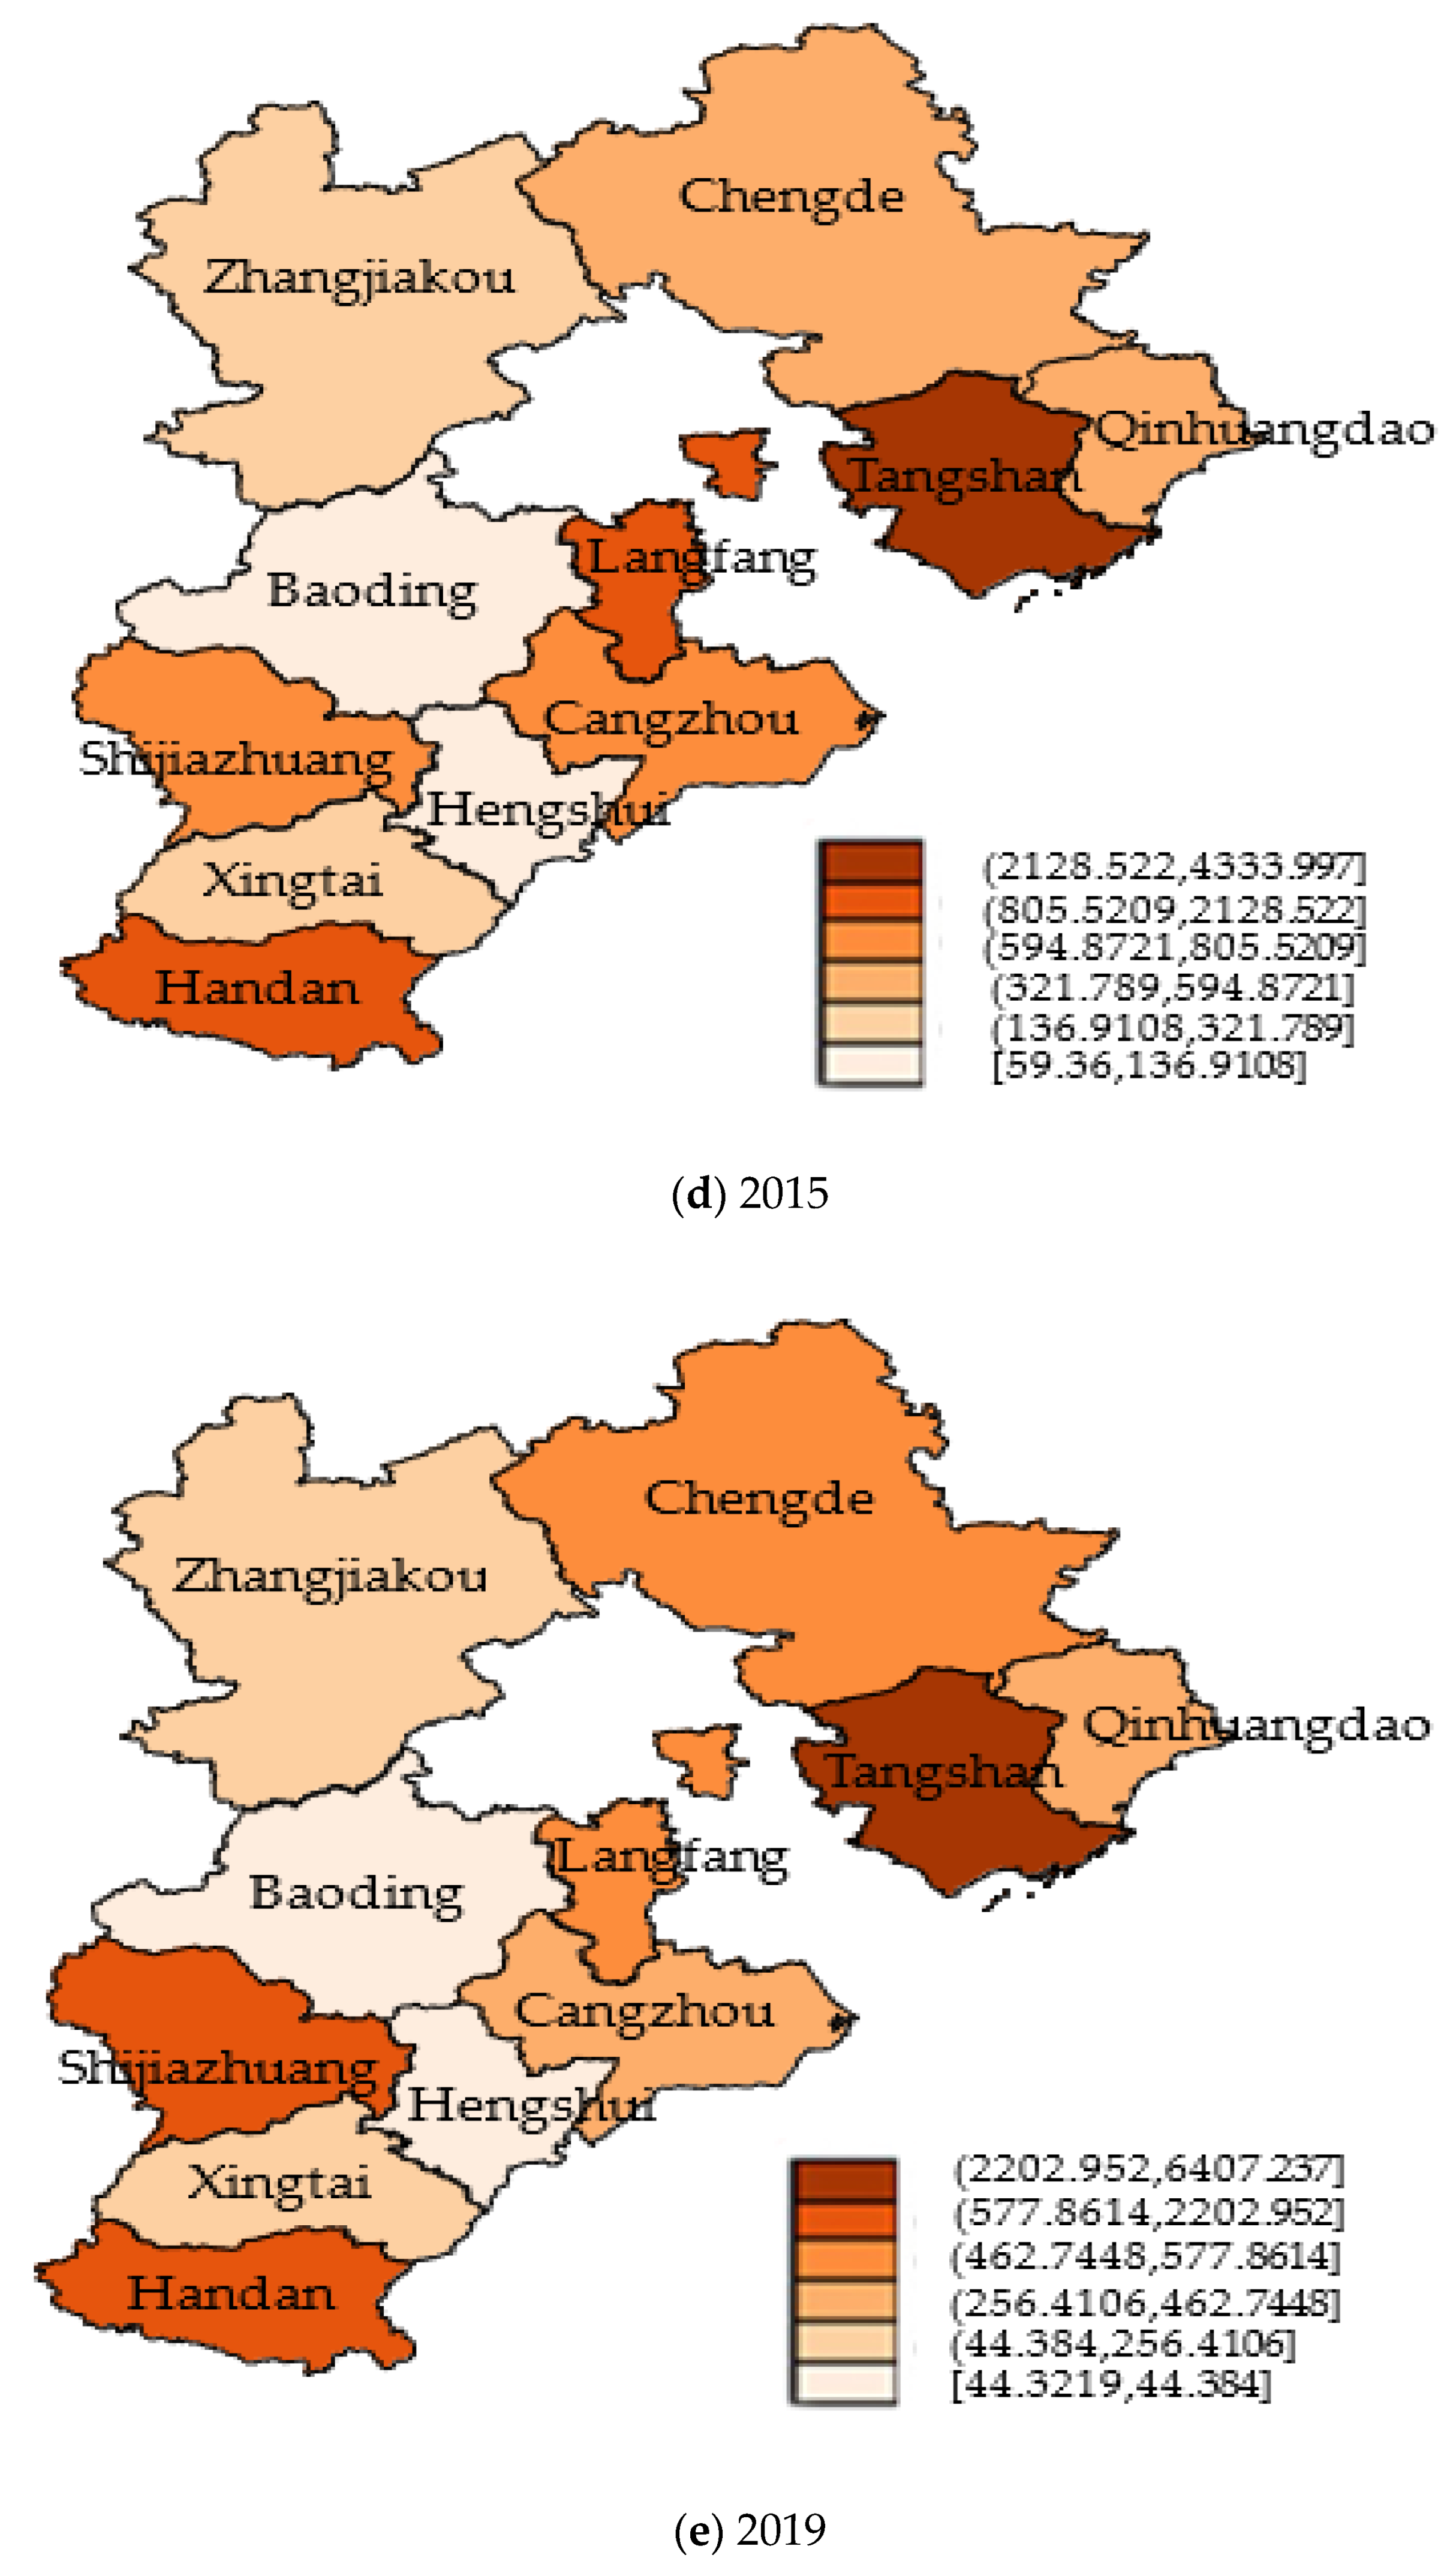
As 2021’s Ecological Environment Status Bulletin of Hebei Province discloses, the average number of days with excellent air quality in Hebei Province reaches 269 days. This paper categorizes cities with less than 250 days into Type I (including Handan, Shijiazhuang, Xingtai and Baoding), cities with more than 250 days yet less than 269 days into Type II (including Cangzhou, Langfang, Hengshui and Tangshan), cities with more than 269 days yet less than 300 days into Type III (including Qinhuangdao), and cities with more than 300 into Types IV (including Chengde and Zhangjiakou). From 2006 to 2019, the distribution characteristics of APIISTPI in Hebei Province were observed every three years. In combination with the characteristics of spatial distribution and balance analysis of APIISTPI in Hebei province, this paper draws the following conclusion.

4.1. APIISTPI in Type-I Cities

Type-I cities mainly include Handan, Shijiazhuang, Xingtai and Baoding, with the highest level of the agglomeration of atmospheric pollution-intensive industries such as the thermal power industry and the most serious atmospheric pollution. The economies of these four cities hinge on steel and iron, thermal power, chemical raw material and chemical product manufacturing and petroleum processing. In Handan, the steel and iron industry develops fast. With an unreasonable industrial layout, atmospheric pollution-intensive enterprises stand upwind. In Shijiazhuang, thermal power plants and steel mills flourish. Take the Jingye Group in Pingshan County, Shijiazhuang, as an example. Pingshan County lies in the northwest of Shijiazhuang and faces the wind. This directly pollutes the atmospheric environment in Shijiazhuang. In Xingtai, the coking industry develops quickly, with the sheet material industry in the east, the coking industry in the north, the steel and iron enterprises in the west, and power plants, cement plants and glass plants in the south. Coupled with the lack of airflow, these industries exacerbate atmospheric pollution in Xingtai. In Baoding, the power production industry thrives. In addition, the printing, dyeing and paper-making industries in Baoding account for 70% of coal consumption. As a consequence, in the non-heating period of summer and autumn, large-scale fog-haze weather often appears. To sum up, Type-I cities mainly depend on the petroleum, coal and other fuel processing industry, and the mean value reaches higher than 0.6 and approaches 1, which embody the most imbalanced development compared with other industries. In Type-I cities, in addition to the above-mentioned industries, weak atmospheric self-purification capacity that arises from less rainfall and wind occasions serious, atmospheric pollution and attenuates the bearing capacity of these cities.

4.2. APIISTPI in Type-II Cities

Type-II cities mainly include Cangzhou, Langfang, Hengshui and Tangshan, with a high level of agglomeration of atmospheric pollution-intensive industries such as the thermal power industry and serious atmospheric pollution. These cities develop the steel and iron, and oil industries, which emit massive atmospheric pollutants and cause serious, atmospheric pollution. For instance, in Cangzhou, APIISTPI covers the petroleum processing industry, which produces motor vehicle exhaust and dust and coal combustion, forming the sources of atmospheric pollution. In Hengshui, pillar industries are chemical pharmaceuticals, metal products and food. For instance, Hengshui Laobaigan Factory emits lots of atmospheric pollutants in production. Tangshan developed the steel and iron, and thermal power industries represented by Tangshan Steel Group. The steel and iron industry constitutes a source of sulfur dioxide, which poses great harm to the environment. Noteworthily, the thermal power industry has a significant impact on atmospheric pollution. To sum up, the Type-II cities mainly rely on the ferrous metal smelting and calendering industry. The mean value reaches higher than 0.5 and approaches 1, with imbalanced development. To mitigate environmental pollution, the industry can be transferred.

4.3. APIISTPI in Type-III Cities

Type-III cities only include Qinhuangdao, with the average level of the agglomeration of atmospheric pollution-intensive industries such as the thermal power industry and less serious atmospheric pollution. In Qinhuangdao, low-value-added industries have been eliminated in recent years. Qinhuangdao mainly develops the non-ferrous metal smelting and calendering industry and chemical raw materials and chemical products manufacturing industries. The mean value reaches 0.4, with relatively balanced development. In addition, Qinhuangdao is a coastal area with a certain environmental self-purification capability. Therefore, Qinhuangdao can realize industrial gradient transfer by adjusting the industrial structure.

4.4. APIISTPI in Type-IV Cities

Type-IV cities mainly include Chengde and Zhangjiakou. In these cities, the level of economic development plays a minor role because Zhangjiakou and Chengde are important water sources and ecological protection areas for Beijing and Tianjin, with the lowest level of atmospheric pollution. The industrial agglomeration of APIISTPI in Type-IV cities proves the lowest level. Hebei province attaches importance to the eco-environmental construction in Chengde and Zhangjiakou and mainly develops the energy industry and the electric and thermal power production and supply industry. The mean value reaches 0.3, with an overall trend of balanced development. The construction of an ecological environment also strengthens environmental self-purification capacity in Type-IV cities, where industrial transfer focuses on heavy industry.
Through analyzing the spatial distribution characteristics of Hebei APIISTPI, the paper finds that the main reason for atmospheric pollution in Hebei is that the concentration of APIISTPI exceeds the capacity of environmental self-purification. The higher the degree of excess, atmospheric pollution is more serious. In addition, there are reasons, such as the low self-cleaning capacity of the Hebei atmosphere and the unreasonable distribution of APIISTPI.

5. Recommendations

After the goals of carbon peaking and carbon neutrality are proposed, industrial gradient transfer plays an important role in promoting regionally balanced development and optimizing the spatial distribution of productivity [25]. Huang and Xiao et al. [26] hold that industrial gradient transfer narrows the regional economic gap, with different effects of different dimensions on the regional economic gap. As evinced, the regions with a high degree of industrial transfer play a positive role in reducing the regional economic gap. Accordingly, the following recommendations are made.

5.1. Recommendations for Optimizing Type-I Cities

Practical recommendations are made to optimize APIISTPI in Type-I cities. Firstly, the transfer-in regions of APIISTPI should have strong capacities for atmospheric self-purification and green technology innovations. For example, APIISTPI can be transferred to coastal areas, which fully utilizes strong atmospheric self-purification capacity in coastal areas and augments the self-purification of pollutants emitted by polluting industries. Secondly, Type-I cities can transfer APIISTPI to open and downwind terrains and consider the wind direction to avoid the effect of pollution spillover and the pollution of the neighboring environment. Thirdly, Type-I cities can strengthen industrial transformation and upgrading, enhance green-technology innovation, and quicken the desulfurization and denitrification in industries to reduce the emission of atmospheric pollution and eliminate the production equipment of enterprises that have difficulties in completing the technological transformation.

5.2. Recommendations for Optimizing Type-II Cities

Firstly, Type-II cities are advised to reduce atmospheric pollution by industrial transfer. Tangshan and Cangzhou, two cities with densely distributed APIISTPI, should conduct further market research and choose better cities for the transfer of APIISTPI. For example, Tangshan can transfer the steel and iron industry to the coastal areas of Guangxi, which have strong atmospheric self-purification capacity with abundant rainfall and strong wind. This effectively hedges against the impact of pollutants in APIISTPI. In Cangzhou, the petroleum processing industry produces pollutants in the atmospheric environment. However, Cangzhou possesses a unique geographical advantage. Cangzhou can reduce the pollution generated by the petroleum processing industry by accelerating the high-quality economic development of the coastal city, fostering the port transformation and upgrading (from a coal export port to a modern comprehensive service port) and building a new business form of modern port transportation. Langfang adjoins Beijing. With less APIISTPI, Langfang can easily achieve industrial transformation. Hengshui mainly relies on the manufacturing of alcoholic beverages. By controlling production processes and crafts, Hengshui reduces environmental pollution and pollutant emission. Moreover, in industrial transfer, various cities are advised to clarify specific divisions of labor and task, reasonably optimize industrial layout, and realize coordinated development, according to resource endowments, economic conditions and atmospheric self-purification capacity. Various cities can scientifically choose the transfer-in regions with strong capacities in environmental self-purification and green-technology innovation, e.g., the coastal areas of Guangxi or other southern areas, to ensure smooth industrial transfer and lessen the impact of APIISTPI on the environment. Notably, green production technologies can tremendously reduce pollutant emissions, save energy consumption and protect the environment. Therefore, transforming the production model and improving green-technological innovation also reduces pollutant emissions.

5.3. Recommendations for Optimizing Type-III Cities

Control measures can be taken for APIISTPI in Qinhuangdao, and industrial transfer can be carried out if necessary. The main reasons lie in that Qinhuangdao shifted from a ‘light industry-preferred’ development model to a ‘heavy industry-driven development model and that atmospheric self-purification capacity reduces atmospheric pollution caused by coal transportation. In addition, large wetlands, abundant rainfall and strong wind effectively alleviate the accumulation and deposition of pollutants. From 2016 to 2020, in urban planning, Qinhuangdao implemented a municipal gasification project, Qinhuangdao Port coal dust treatment project, Qinhuangdao Port ship fuel-pollution treatment project, Beidaihe atmospheric environment monitoring, warning and big data decision and support system project, urban heavy-polluting-enterprise relocation and renovation project, as well as the desulfurization, denitrification and dust-removal project in key industries such as power, steel and iron, cement and glass. In this way, Qinhuangdao improves atmospheric pollution.

5.4. Recommendations for Optimizing Type-IV Cities

The roles of Zhangjiakou and Chengde in environmental protection are strictly controlled. Geographically, Zhangjiakou and Chengde surround Beijing and Tianjin, and the development level of high-pollution industries remains low. Since the ‘10th Five-Year Plan’, spurred by national policies on environmental protection, the Zhangjiakou government has actively eliminated outdated production capacity and formulated energy-consumption standards for high-pollution industries to regulate their emissions. Chengde vigorously develops agriculture and tourism. Surrounded by mountains, Chengdu has a high green coverage rate and good air quality. In addition, in order to protect the ecological environment of Beijing and Tianjin, China takes administrative measures on environmental regulation in Zhangjiakou and Chengde, such as returning farmland to forests, restricting the pollution emissions of local enterprises, and shutting down some enterprises on chemical manufacturing and pesticide production. To sum up, catalyzed by national and municipal administrative policies on environmental regulation, Zhangjiakou and Chengde effectively control the deterioration of the ecological environment and achieve satisfactory ecological effects (for example, good air quality).

Author Contributions

J.Z. and J.T. conceived and completed the writing of the manuscript. X.W. made key modifications to important knowledge parts. X.B. assisted with the code design and experimental analysis. All authors have read and agreed to the published version of the manuscript.

Funding

This research was funded by the Hebei Social Science Foundation for Spatial distribution and gradient transfer of air pollution-intensive industries in Hebei Province, China (HB19GL002).

Data Availability Statement

The data presented in this study are available upon request from the corresponding author. The data are not publicly available because the supporting project has a confidentiality agreement.

Acknowledgments

The authors would like to thank the editor and reviewers for their valuable comments and suggestions, which helped them improve the manuscript.

Conflicts of Interest

The authors declare no conflict of interest.

References

  1. Tian, Y.Y. Regional industrial transfer in the Jingjinji urban agglomeration, China; An analysis based on a new transferring area-undertaking area-dynamic process model. J. Clean. Prod. 2019, 235, 751–766. [Google Scholar] [CrossRef]
  2. He, Z.X.; Cao, C.S.; Wang, J.M. Spatial Impact of Industrial Agglomeration and Environmental Regulation on Environmental Pollution-Evidence from Pollution-Intensive Industries in China. Appl. Spat. Anal. Policy 2022, 15, 1525–1555. [Google Scholar] [CrossRef]
  3. Chen, Z.Y.; Ding, X.S.; Han, C.; Yu, H. The Correlation Mechanism of Manufacturing Agglomeration and Pollution, and the Practical Path of Green Development: A Study Based on Spatial Spillover Model. Stat. Res. 2022, 39, 46–61. [Google Scholar]
  4. Chen, L.Q.; Huang, P. The Analysis of Industrial Cluster and Urbanization: From the Perspective of Externality. J. Xihua Univ. Sci. 2007, 2, 16–20. [Google Scholar]
  5. Chen, Y.Y. The Impact of Industrial Agglomeration on Industrial Clean Production and End-of-Pipe Treatment. South China J. Econ. 2011, 5, 17–27. [Google Scholar]
  6. Gai, W.Q.; Zhu, H.S. Flexible Industrial Agglomeration and Regional Competitiveness. Econ. Theory Bus. Manag. 2001, 10, 25–30. [Google Scholar]
  7. Qiu, Z.Y. The Impact of International Vertical Industrial Agglomeration on China’s Environment. Acad. Forum 2012, 3, 121–124+178. [Google Scholar]
  8. Tang, C.H.; Dou, J.M. The Impact of Heterogeneous Environmental Regulations on Location Choices of Pollution-Intensive Firms in China. Front. Environ. Sci. 2021, 9, 626. [Google Scholar] [CrossRef]
  9. Wen, X.Q.; Su, R.X. The Impact of Environmental Regulation on the Spatial Distribution of Polluting Industries in the Beijing-Tianjin-Hebei Region. J. Tianjin Norm. Univ. Sci. 2015, 6, 58–62. [Google Scholar]
  10. He, X.L.; Wu, H. Technological Spillover, Environmental Pollution and Industrial Spatial Distribution: A New Extension of Krugman’s Core and Periphery Theory. West Forum 2021, 31, 34–51. [Google Scholar]
  11. Wang, Y.Z.; Duan, X.J.; Liang, T.; Wang, L.; Wang, L.Q. Analysis of spatio-temporal distribution characteristics and socioeconomic drivers of urban air quality in China. Chemosphere 2022, 291, 132799. [Google Scholar] [CrossRef]
  12. Kaname, A. The Synthetic Principles of the Economic Development of our country. J. Econ. 1932, 6, 179–220. [Google Scholar]
  13. Ma, H.X. Comparative Analysis of Two Spatial Models of Regional Transmission: On the Selection Trend of Spatial Model of Regional Transmission in China. Gansu Soc. Sci. 2001, 2, 30–32. [Google Scholar]
  14. Chen, J.J.; Ye, W.Y. The Research on Industrial Transfer to Developing Regions in Zhejiang Province. J. Bus. Econ. 2002, 4, 28–31. [Google Scholar]
  15. Jiang, W.J.; Sun, H.G. Coordinating Industrial Transfer: An Important Measure for the Rapid Development of Small and Medium Enterprises in Developing Regions. Manag. J. 2001, 7, 15–16. [Google Scholar]
  16. Fu, Z.P.; Zeng, S.Y. Transfer Models and Action Characteristics in the Transfer of Clustered Industries: An Analysis from the Perspective of Corporate Social Network. Manag. World 2008, 12, 83–92. [Google Scholar]
  17. Xiang, G.E.; Hu, P. The Mechanisms and Characteristics of Regional Industrial Transfer from the Perspective of Global Value Chain: A Case Study of the Pan Yangtze River Delta. East China Econ. Manag. 2011, 2, 45–49. [Google Scholar]
  18. Huang, Z.Y. Industrial Transfer: Trends in the East and Choices in the West: Taking Chongqing as an Example. Econ. Issues 2009, 7, 117–120. [Google Scholar]
  19. Ma, Z.H.; Hu, H.B. An Exploration of the Major Models of Inter-regional Industrial Transfer in China. Product. Res. 2009, 13, 141–143. [Google Scholar]
  20. Li, Y.Y.; Li, H. China’s inter-regional embodied carbon emissions: An industrial transfer perspective. Environ. Sci. Pollut. Res. 2022, 29, 4062–4075. [Google Scholar] [CrossRef]
  21. Zhou, J.K.; Li, Y.T. Research on Spatial Distribution Characteristics of High Haze Pollution Industries Such as Thermal Power Industry in the Beijing-Tianjin-Hebei Region. Energies 2022, 15, 6610. [Google Scholar] [CrossRef]
  22. Wei, H.K. China’s Industrial Cluster and Cluster Development Strategy; Economic Management Publishing House: Beijing, China, 2008. [Google Scholar]
  23. Zhang, J.Y. Spatial Difference and Convergence of Innovative Development in Yangtze River Delta: Based on Dagum Gini Coefficient and Decomposition. Resour. Environ. Yangtze Basin 2023, 32, 235–249. [Google Scholar]
  24. Zhou, J.K.; Tian, J.; Zhang, D.D. Pollution Effect of the Agglomeration of Thermal Power and Other Air Pollution-Intensive Industries in China. Int. J. Environ. Res. Public Health 2023, 20, 1111. [Google Scholar] [CrossRef] [PubMed]
  25. Zhang, Z.Q. Problems and Countermeasures for China’s Industrial Gradient Transfer Under Carbon Peak and Carbon Neutrality Target. Environ. Prot. 2023, 51, 47–50. [Google Scholar]
  26. Huang, H.; Xiao, Y.L. Three Dimensional Economic Openness Industrial Gradient Transfer and Regional Economic Disparity. J. Tech. Econ. Manag. 2023, 4, 111–117. [Google Scholar]
Figure 1. The Spatial Quantile–Quantile (Q-Q) Plot of the Gross Industrial Output Value of APIISTPI in Hebei Province.
Energies 16 05114 g001aEnergies 16 05114 g001bEnergies 16 05114 g001c
Figure 2. The Spatial Quantile-Quantile (Q-Q) Plot of the Gross Industrial Output Value of the Chemical Raw Material and Chemical Product Manufacturing Industry in Hebei Province.
Energies 16 05114 g002aEnergies 16 05114 g002bEnergies 16 05114 g002c
Figure 3. The Spatial Quantile-Quantile (Q-Q) Plot of the Gross Industrial Output Value of the Non-Ferrous Metal Smelting and Calendering Processing Industry in Hebei Province.
Energies 16 05114 g003aEnergies 16 05114 g003bEnergies 16 05114 g003c
Figure 4. The Spatial Quantile-Quantile (Q-Q) Plot of the Gross Industrial Output Value of the Electric and Thermal Power Production and Supply Industry in Hebei Province.
Energies 16 05114 g004aEnergies 16 05114 g004bEnergies 16 05114 g004c
Figure 5. The Spatial Quantile-Quantile (Q-Q) Plot of the Gross Industrial Output Value of the Petroleum Processing and Coking Industry in Hebei Province.
Energies 16 05114 g005aEnergies 16 05114 g005bEnergies 16 05114 g005c
Figure 6. The Spatial Quantile–Quantile (Q-Q) Plot of the Gross Industrial Output Value of the Non-Metallic Mineral Product Industry in Hebei Province.
Energies 16 05114 g006aEnergies 16 05114 g006bEnergies 16 05114 g006c
Figure 7. The Spatial Quantile–Quantile (Q-Q) Plot of the Gross Industrial Output Value of the Ferrous Metal Smelting and Calendering Processing Industry in Hebei Province.
Energies 16 05114 g007aEnergies 16 05114 g007bEnergies 16 05114 g007c
Table 1. The Balance Degree of Pollutants in APIISTPI in Hebei Province.
The Total Emission of Industrial Sulfur Dioxide (Ton)The Total Emission of Industrial Particulate Matter (PM) (Ton)PM
2.5
g/m3)
PM
10 (μg/m3)
Atmospheric Pollution Comprehensive Index
Gini_ya1Gini_ya2Gini_ya3Gini_ya4Gini_y
20060.3660.3890.2300.1100.198
20070.3630.4430.2210.1050.205
20080.3680.4350.2170.0980.235
20090.3640.4190.2100.0960.237
20100.3690.3840.2160.0850.228
20110.3750.5210.2270.0850.174
20120.3640.5210.2340.1950.189
20130.3540.5300.2020.2070.199
20140.3330.5020.1830.1680.199
20150.3360.5260.1700.1370.190
20160.3820.5950.1660.1340.201
20170.4900.5500.1650.1420.313
20180.4660.5590.1370.1170.209
20190.5060.5970.1110.1040.235
Table 2. The Balance Degree of APIISTPI in Hebei Province.
The Gross Industrial Output Value of APIISTPIThe Petroleum, Coal and Other Fuel Processing IndustryThe Chemical Raw Material & Chemical Product Manufacturing IndustryThe Non-Metallic Mineral Product IndustryThe Ferrous Metal Smelting and Calendering Processing IndustryThe Non-Ferrous Metal Smelting and Calendering Processing IndustryThe Electric and Thermal Power Production & Supply Industry
Gini_xGini_xa1Gini_xa2Gini_xa3Gini_xa4Gini_xa5Gini_xa6
20060.4430.6390.4390.4560.5920.3170.315
20070.4200.6250.4450.4770.5650.5640.297
20080.4550.6290.4750.4760.5890.4950.298
20090.4540.6070.4750.4860.6010.5300.299
20100.4190.6250.4510.4290.5800.5110.293
20110.434 0.6290.4780.4760.5660.5820.282
20120.432 0.6250.4790.4520.5580.5880.280
20130.409 0.6720.4990.4150.5360.5440.259
20140.430 0.6720.5070.4170.5720.4580.262
20150.424 0.6570.5380.4080.5640.4960.256
20160.439 0.6460.5440.4120.5950.4950.250
20170.483 0.6580.5790.4210.6560.4860.267
20180.490 0.6420.4350.3310.6500.4950.310
20190.502 0.6410.4360.3520.6590.4730.316
Disclaimer/Publisher’s Note: The statements, opinions and data contained in all publications are solely those of the individual author(s) and contributor(s) and not of MDPI and/or the editor(s). MDPI and/or the editor(s) disclaim responsibility for any injury to people or property resulting from any ideas, methods, instructions or products referred to in the content.

