Article

Development of an In-House Code for Dry Tower of Heat Transfer Analysis in Hydrogen Purification System

1
School of Mechanical Engineering, Pusan National University, Busandaehak-ro 63beon-gil 2, Busan 46241, Geumjeong-gu, Republic of Korea
2
School of Electronical Engineering, Pusan National University, Busandaehak-ro 63beon-gil 2, Busan 46241, Geumjeong-gu, Republic of Korea
3
Sunbo Unitech R&D Center, 97, Centum jungang-ro, Busan 48058, Haeundae-gu, Republic of Korea
4
Research Institute of Mechanical Technology, Pusan National University, Busandaehak-ro 63beon-gil 2, Busan 46241, Geumjeong-gu, Republic of Korea
*
Authors to whom correspondence should be addressed.
Energies 2023, 16(13), 5090; https://doi.org/10.3390/en16135090
Submission received: 8 April 2023 / Revised: 21 June 2023 / Accepted: 27 June 2023 / Published: 30 June 2023
(This article belongs to the Topic Hydrogen Production Processes)

Abstract

:
The purity of hydrogen finally purified in the hydrogen purification process system is greatly influenced by the uniformity of the purification temperature of the dry tower. An in-house code that can be easily used by field designers has been developed to predict the capacity of the appropriate heat source and the time to reach the temperature of the dry tower. A code was developed to predict unsteady heat transfer using VBA. To verify the developed code, a grid independence test was performed, and finally, calculations were performed for two cases. The factor that influences the temperature history over time is the precise determination of values for the density, specific heat, and thermal conductivity of the heterogeneous materials composing the dryer tower. It was confirmed that the developed code well describes the actual test trend data of the regeneration process of adsorption and desorption, and it is judged that the code developed in the design process of various capacity systems will be effectively applied to the heat capacity calculation in the future.

1. Introduction

Various industrial policies are currently being reviewed in response to a range of pressing environmental issues, energy crises, and sluggish economic growth. Among these policies, low carbon green growth has emerged as a particularly promising solution that has generated significant attention and interest across multiple industries and sectors. The concept of low carbon green growth is predicated on the idea that economic and environmental goals need not be mutually exclusive, and that by pursuing sustainable, low carbon strategies, it is possible to achieve both simultaneously. Hydrogen has recently attracted attention as a potential clean energy source, with governments and industries around the world investing in research and development to explore its potential as a low carbon fuel. As such, this policy alternative, along with the potential of hydrogen as a clean energy source, has become a focus of intense interest and debate within the industrial community, as decision makers and stakeholders seek to identify the most effective and efficient means of addressing the pressing challenges facing society today [1,2].
Hydrogen can be used in its natural state or synthesized from other energy sources. Most hydrogen has been manufactured through steam reforming reactions or from other fossil fuels such as natural gas and propane. Specifically, hydrogen is generated through a process that involves water vapor and fossil fuels at high temperatures, or through the use of metal based catalysts (typically nickel), although these methods have been found to have disadvantages such as low purity and reliance on fossil fuels. To address these shortcomings, the water based hydrogen production method, which produces hydrogen and oxygen, has recently been attracting attention. While hydrogen production technology using water electrolysis have not received much attention due to its high power consumption, the outlook for hydrogen production is changing rapidly with increased energy capacity based on renewable energy sources such as solar cell and wind power generation. As such, the future of hydrogen production is rapidly evolving, with new and innovative approaches being explored in order to meet the growing demand for clean, sustainable energy [3].
As the global interest in water electrolysis technology continues to escalate, significant research and development endeavors are actively underway. However, despite its immense potential, the technology is currently insufficient in fully replacing conventional carbon based energy sources due to the intermittent power generation characteristics of new and renewable energy sources, alongside the various stability and long-term operation challenges posed by water electrolysis systems that rely on these sources [4,5,6]. Resolving these challenges is crucial for enabling the commercialization of green hydrogen production. Achieving this goal necessitates securing the stability and performance of the water electrolysis system through extensive research and technology development, aimed at augmenting the hydrogen purity rate. During the process of separating water into hydrogen within the electrolysis system, impurities such as hydrogen, oxygen, and water coexist, necessitating their elimination to increase the hydrogen purity. To remove water from the impurities, a commonly used adsorption method employing pressure swing adsorption (PSA), or thermal swing adsorption (TSA) can be utilized [7].
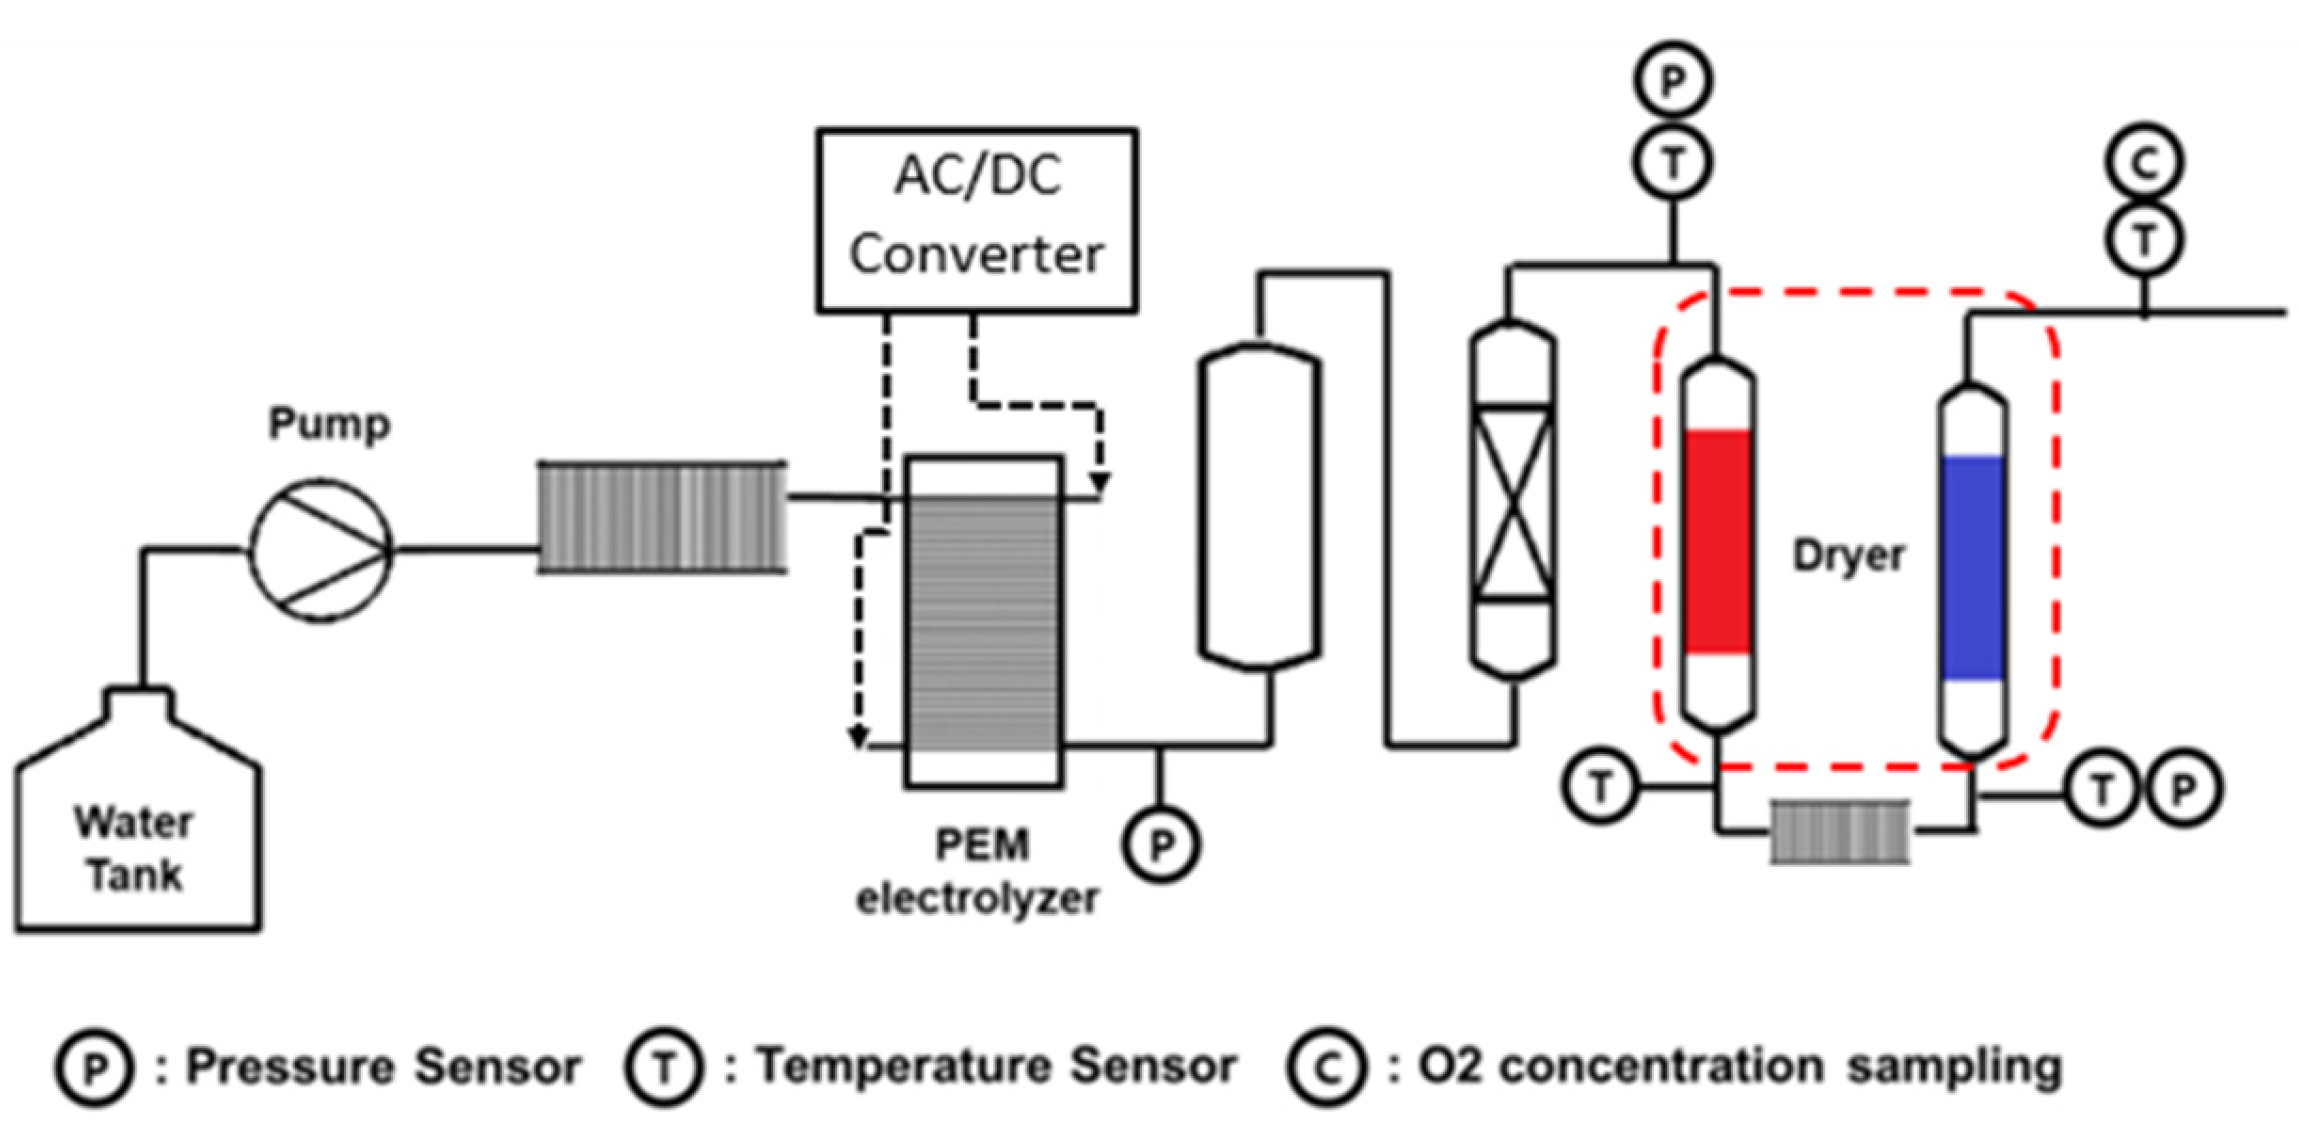
In this study, we employed a dryer method using TSA to enhance the hydrogen purity rate in water electrolysis systems. Unlike pressure regeneration adsorption processes, which rely on periodic pressure changes, thermal regenerative adsorption processes maintain constant pressure and use temperature differences to control adsorption and detachment [8,9]. The thermal regenerative adsorption process typically comprises three stages: adsorption, removal, and cooling. During the adsorption stage, the adsorbent in the tower selectively separates the mixture into its constituents, with fewer desirable ones being concentrated and discharged from the tower. The desorption process raises the temperature in the tower, allowing for the removal of the adsorbate (water), after which the adsorbent is cooled to prepare for the next cycle. Efficient operation of the thermal regenerative adsorption process depends on the cost of thermal energy, and lower operating temperatures during adsorption can enhance adsorption performance and selectivity. However, overloading the adsorbent requires a substantial amount of thermal energy for effective removal. The adsorbent is typically removed using a flow of hot steam or gas, and effective removal can be achieved through a large dehumidification flow rate at a relatively low temperature or by utilizing a low detachment flow rate at a relatively high temperature.
Tjarks et al. [10] investigate the energy demand of power-to-gas plants that produce hydrogen through electrolysis, gas drying, and compression. The study considers temperature swing adsorption (TSA) for gas drying, which is shown to be more efficient for low adsorbate concentrations in the feed stream. The study then determines the optimal electrolysis pressure levels for an efficient operation of the power-to-gas plant by modeling each process step to calculate the specific energy demand and combining the steps to determine the specific energy demand of the complete process chain. Bensmann et al. [11] evaluate the energy demand of power-to-gas plants and finds that the optimal configuration and pressure levels depend on hydrogen delivery pressure and humidity requirements. The energy demand for drying is the dominant factor at low delivery pressure, and higher electrolysis pressures increase losses due to hydrogen crossover. Mechanical compression before drying can reduce energy demand, and keeping electrolysis pressure below 20 bar can decrease hydrogen crossover and enable efficient drying at high pressures. Lively et al. [12] discuss a thermodynamic analysis of adsorption units for gas separation systems, comparing the efficiency of TSA and PSA for dilute gas separations and bulk gas separations, respectively. It is found that TSA is more efficient at low feed concentrations, while PSA is more efficient for bulk gas separations. The analysis did not consider practical process realities or energy recovery options. Tao et al. [13] conducted to purify hydrogen from a multi-component mixture (N2/CO/CO2/CH4/H2) using a one column VPSA process with AC5-KS. A heat and mass transfer model with porous media adsorption was used to predict the performance of the VPSA process, and the simulation results closely matched experimental data. The model was utilized to analyze the effects of the P/F ratio and adsorption time in the VPSA unit. The model assessed the effects of the P/F ratio and adsorption time, revealing that increasing the P/F ratio and decreasing the feeding time led to higher hydrogen purity but lower recovery. Ye et al. [14] investigated that a PSA cycle model was implemented on the Aspen Adsorption platform to simulate the PSA process for a ternary component gas mixture (H2/CO2/CO) using a Cu-BTC adsorbent bed. Increasing adsorption pressure improved hydrogen purity but reduced recovery while extending adsorption time and lowering product flow rate increased recovery but decreased purity. Sakas et al. [15] developed a simulation model for optimizing cost and energy efficiency in an alkaline water electrolysis plant. They used MATLAB functions and Simulink to solve the energy and mass balances of the 3 MW, 16 bar plant. A TSA type dryer was used for moisture adsorption, achieving a minimum threshold moisture content through condensation drying at an ambient temperature of 25–30 °C. The thermal model accurately predicted the real-world scenario with 98.7% accuracy.
The TSA process is employed for gas purification across various systems, and a plethora of studies are being conducted in this field. Aleghafouri et al. [16] focused on developing a comprehensive mathematical model to predict the performance of gas dehydration in natural gas and conducted a parametric study to examine the effects of various operational parameters. The study investigated the influential parameters through a parametric analysis of process efficiency. To achieve energy savings, the researchers proposed some suggestions for improving the design conditions without causing a significant impact on the purification performance. Ambrożek et al. [17] conducted an analysis of adsorption drying for specific water-aliphatic alcohol solutions using mathematical modeling and experimental techniques. The developed isothermal model in this study incorporated various factors, such as liquid film mass transport, diffusion coefficients, variable axial diffusion, and experimentally derived Langmuir-Freundlich isotherms. The model’s calculated results demonstrated good agreement with the experimental data, and the simulations provided insights into the moisture content profile within the adsorbent bed. In previous studies, numerous models and analysis studies have been conducted to predict the performance of TSA adsorption in various systems. However, there is a lack of research on TSA dryers specifically designed for water electrolysis systems. Therefore, it is crucial to conduct research on models for TSA based dryers used in hydrogen purification processes with PEM electrolysis cells to optimize their performance. There is a scarcity of research focusing on heat transfer characteristics, whereas many studies have investigated the impact of operating conditions such as supply flow rate, duration, and pressure on adsorption characteristics. It is essential to understand these characteristics to predict the optimal temperature and arrival time of the drying tower.
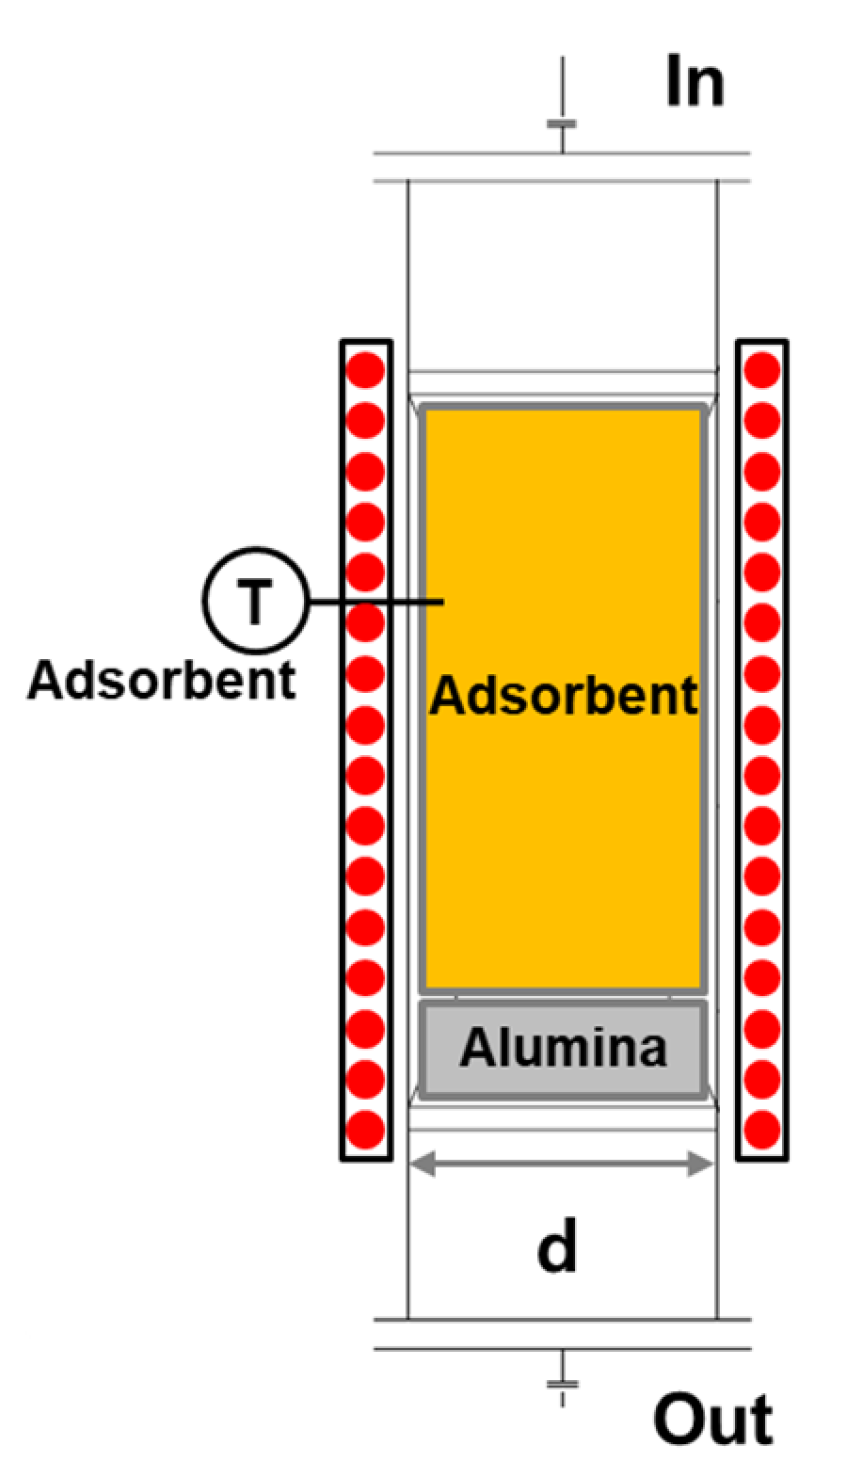
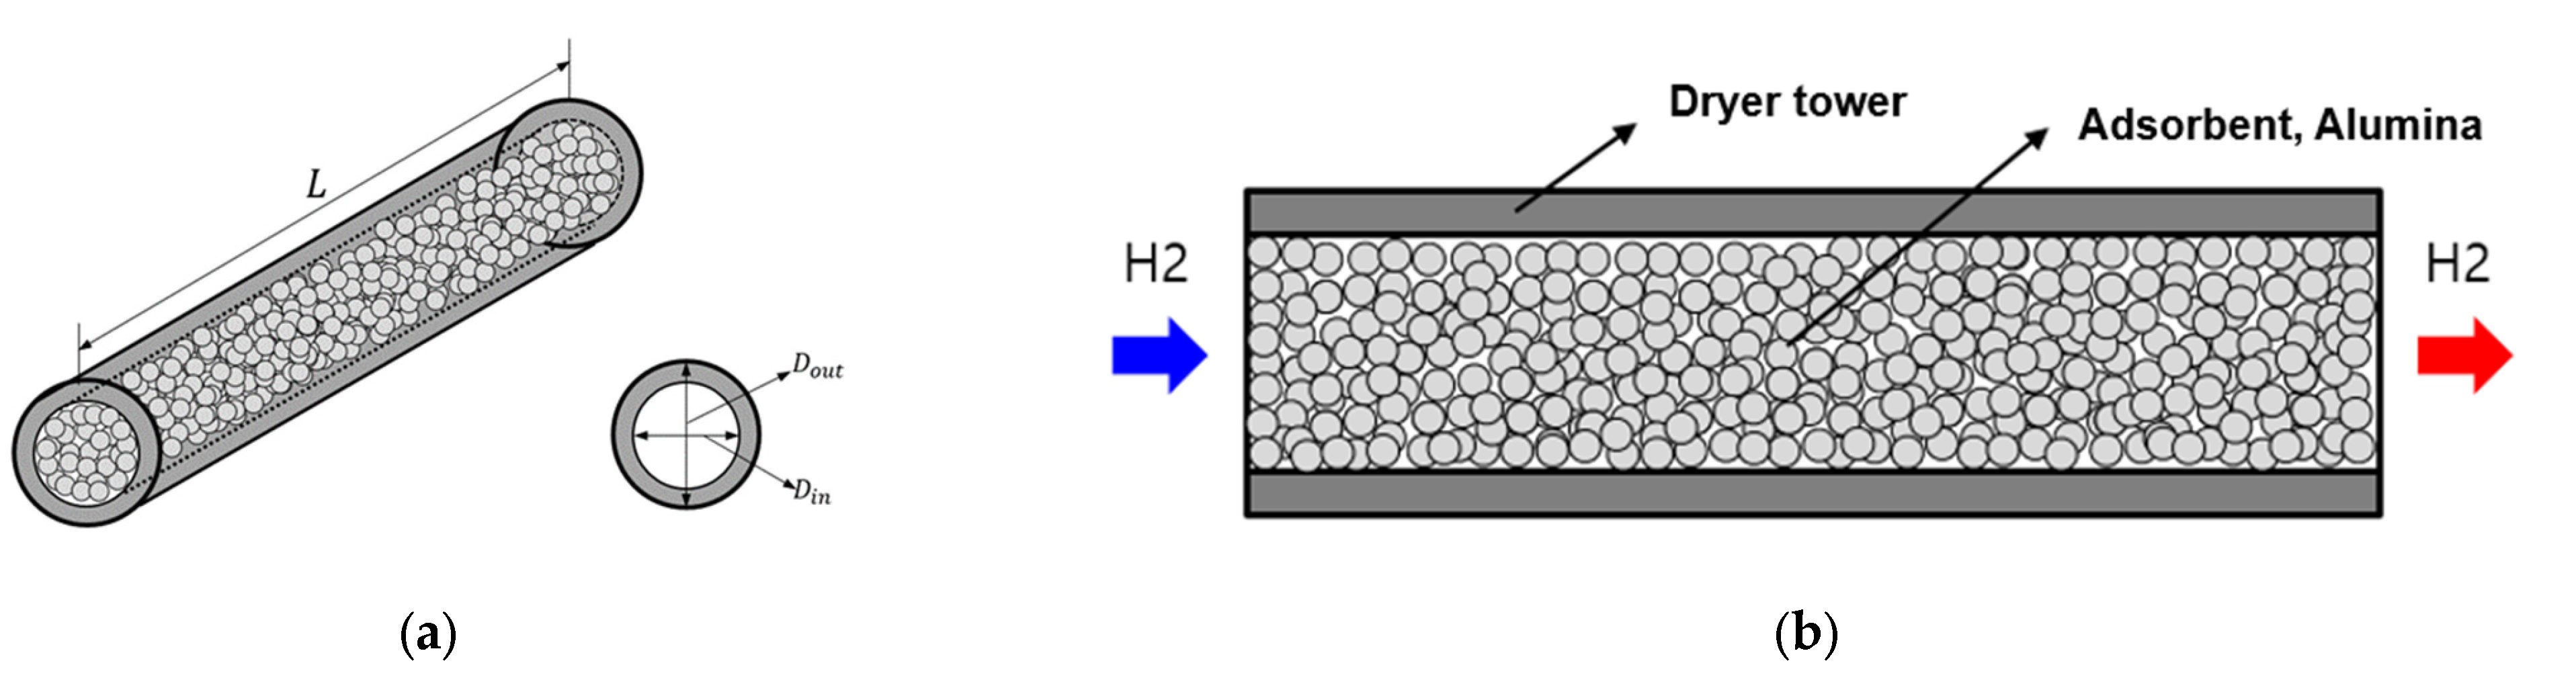
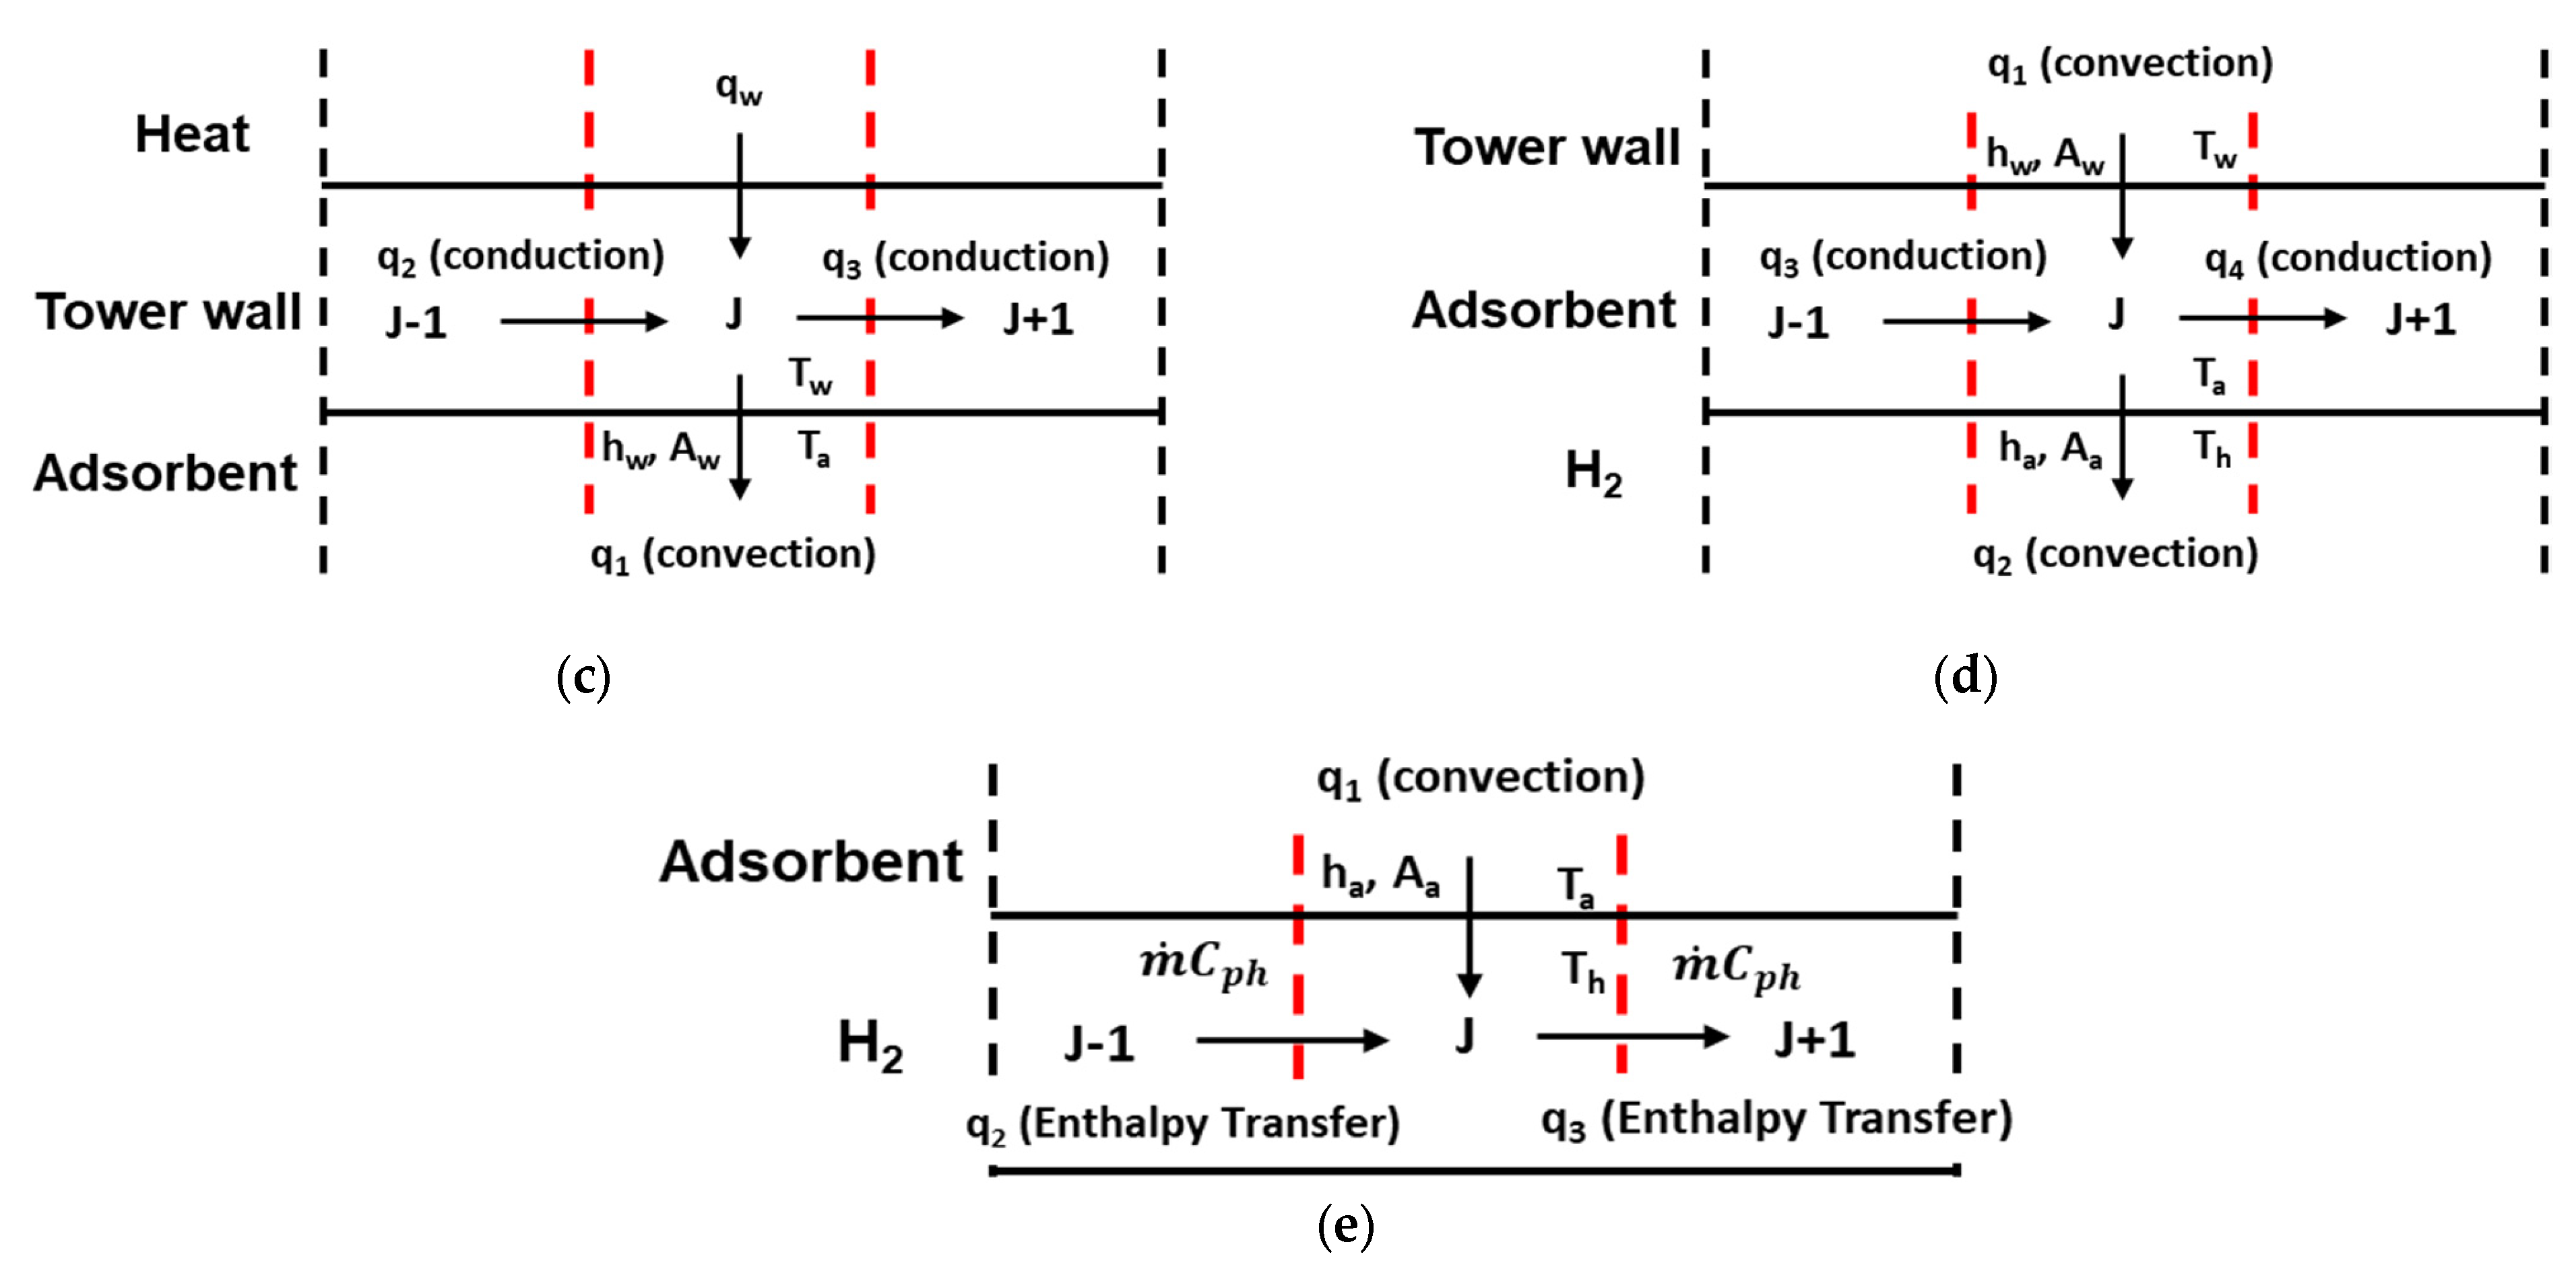
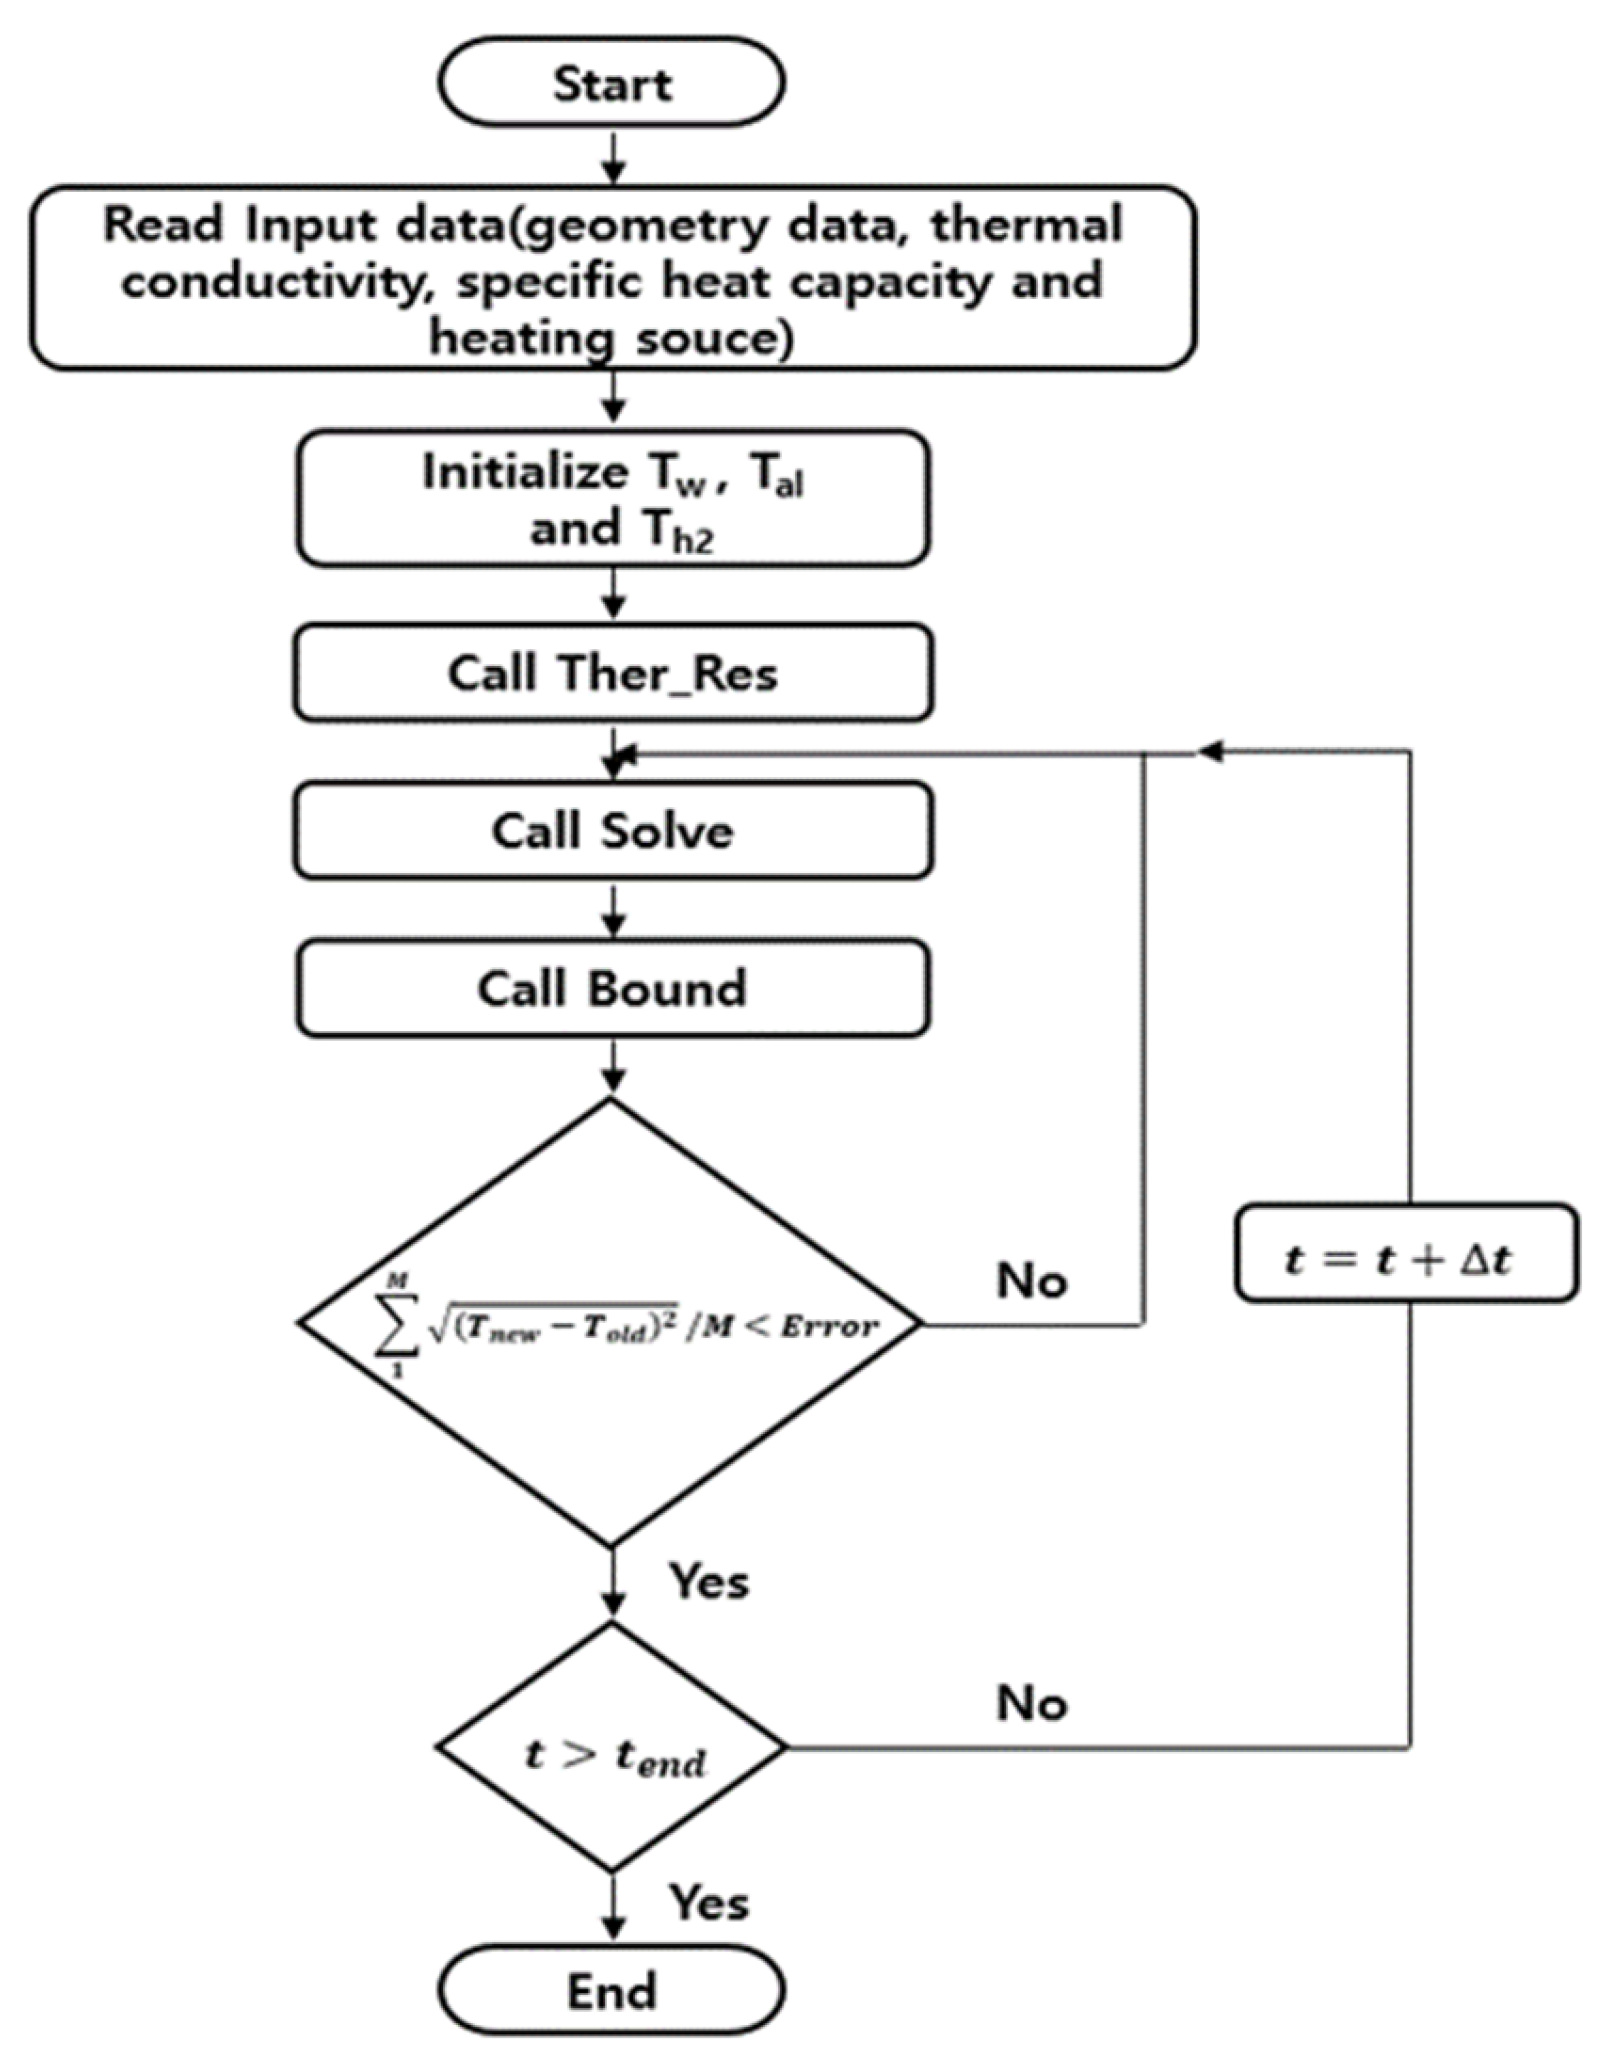
This paper focuses on investigating the heat source capacity and the necessary duration to achieve and sustain the optimal temperature within the drying tower in a hydrogen purification process system. The purity of hydrogen is significantly influenced by the purification temperature and the uniformity of temperature within the drying tower. Therefore, understanding the heat source capacity and determining the duration required to reach and maintain the optimal temperature is crucial for ensuring the highest possible hydrogen purity. A numerical analysis of the heat transfer characteristics has been conducted for the dryer tower, utilizing Zeolite as an adsorbent. Based on the analysis results, a code capable of predicting transient heat transfer was meticulously developed using Visual Basic for Applications (VBA). Performing heat transfer analysis of a dryer using a commercial program can be time consuming and challenging for beginners to optimize the design of the drying tower. However, employing an in-house code enables a more efficient design process, specifically tailored to the capacity of the water electrolysis system. This approach significantly reduces the design time for the drying tower while ensuring simplicity and ease of operation.

2. PEM System and Development of Program Code

2.1. Understanding of the PEM System

Initially, the development of a heat transfer prediction program necessitates a fundamental understanding of the system under investigation. Figure 1 illustrates the comprehensive process schematic of the proton exchange membrane system. The hydrogen generated within the system is introduced through the oxygen removal tower and subsequently directed into the thermal regenerative adsorption drying tower. Upon the removal of the appropriate level of moisture, the hydrogen is either sequestered in a storage tank or directly supplied. The thermal regenerative adsorption process encompasses two towers designated for adsorption and one for desorption, which ensures a continuous flow. Equilibrium between the durations of adsorption and desorption, inclusive of heating and cooling processes, should be maintained. This configuration is the most prevalent device form employed in solvent recovery, although it may also result in a reduction of process efficiency due to the consumption of adsorbent [18].
To optimize the purity of hydrogen generated within the system, a dedicated adsorbent is employed to facilitate the removal of moisture from the drying tower. Figure 2 offers a comprehensive illustration of the precise positioning and proportion of the adsorbent materials inside the drying tower. To achieve efficient moisture elimination, two distinct types of adsorbents are implemented, with a specific usage ratio of 1:7. The system encompasses three primary components: the drying tower body, the adsorbent material, and hydrogen as the internal fluid. The tower body is meticulously fabricated from high quality stainless steel, ensuring durability and resistance to corrosion. The representative diameters for each adsorbent material are carefully chosen, measuring 6.25 mm for alumina and 3.7 mm for the molecular sieve. This configuration allows for effective hydrogen permeation between the adsorbent materials, thus optimizing moisture removal. To maintain the optimal temperature for efficient drying, an external heater jacket is affixed around the perimeter of the tower body. This heater jacket provides a controlled, uniform heating environment, ensuring consistent and effective moisture removal within the drying tower. By addressing these critical design aspects, the system can deliver enhanced performance in terms of hydrogen purity and moisture elimination, ultimately contributing to advancements in hydrogen production technologies.

2.2. Development of Program Code (In-House Code)

Figure 3a,b shows a schematic diagram for the heat transfer analysis of the drying tower. As previously mentioned, to facilitate the smooth analysis and design of the adsorption separation process in the drying tower by field designers, it is essential to develop an in-house code capable of predicting transient temperatures. To achieve this, the governing equation for each component, such as the body, adsorbent, and hydrogen, is derived by applying the energy balance equation to each element. The following assumptions are made for deriving the governing equations:
  • Hydrogen is considered an ideal gas;
  • The temperature gradient in the radial direction is disregarded;
  • The fluid flow within the drying tower exhibits axial dispersion flow characteristics;
  • Structural factors in the drying tower, including diameter, cross-sectional area, and porosity, are assumed to be uniform;
  • The axial heat transfer of the body occurs exclusively through conduction;
  • The axial heat transfer of the adsorbent occurs exclusively through conduction;
  • Heat transfer between the body and the adsorbent occurs exclusively through convection;
  • Heat transfer between the adsorbent and hydrogen occurs exclusively through convection.
By considering these assumptions, a comprehensive and reliable analysis of the heat transfer within the drying tower can be conducted, providing valuable insights for the development of more efficient adsorption separation processes. The temperature of each component was predicted by using the energy equilibrium shown in Figure 3c–e to determine the abnormal state temperature for the dryer tower, adsorbent, and H2, respectively. The temperature of each component was calculated using Equations (1)–(3).
ρ w V w C p , w T w j t = q w h w A w T w , j T a , j + T w , j 1 T w , j R w , j T w , j T w , j + 1 R w , j + 1
ρ a V a C p , a T a , j t = h w A w T w , j T a , j h a A a T a , j T h , j + T a , j 1 T a , j R a , j T a , j T a , j + 1 R a , j + 1
ρ h V h C p , h T h , j t = h a A a T a , j T h , j + m ˙ C p , h T h , j 1 T h , j m ˙ C p , h T h , j T h , j + 1
where ρ is the density of the material, V represents the volume of the material, and Cp is the specific heat capacity of the material. Rw and Ra are thermal conduction resistances of dryer tower wall and adsorbent, and calculated using
R w = Δ x k w · A
R a = Δ x k a · A
where Δx is the distance or gap between the components, kw, and ka are the thermal conductivity of the material, and A is the cross-sectional area of heat transfer through the interface.
Figure 4 illustrates a flow chart depicting the in-house code devised for predicting transient temperature within the drying tower. The study focuses on the development of a VBA based in-house code, designed to be utilized in the hydrogen process of water electrolysis systems. Initially, the code imports data pertaining to the body, adsorbent specifications, and initial conditions, followed by the initialization of each specification. The calculation requires input parameters as follows: The supplied H2 pressure should be provided as the gauge pressure in units of the bar, and the H2 flow rate should be specified as the mass flow rate in units of kg/h. For the dimensions of the drying tower, please enter the inlet and outlet diameter, and length, as well as the density, specific heat, and thermal conductivity of the tower material. Regarding alumina and the adsorbent, please provide the diameter, filled length, specific heat, thermal conductivity, porosity, and initial temperature.
The thermal resistance of the body and adsorbent is subsequently calculated using the Ther_Res function. For each grid point, the tri-diagonal matrix operation computes the temperatures of the body, adsorbent, and hydrogen at the current time step. The inlet and outlet boundary temperatures at each grid point are then ascertained using the Bound function. The root mean square difference between the temperatures of each component at the current and previous time steps is calculated for the grid points. This iterative process continues until convergence is achieved within the established error range. Upon convergence, the time step is incremented and compared to the end time of the calculation. If the incremented time step exceeds the end time, the computation terminates; otherwise, the previous steps are reiterated. This methodical approach ensures the accurate prediction of transient temperatures within the drying tower.
Information regarding hydrogen density ( ρ ), specific heat (Cp), and convective heat transfer coefficient (h) is crucial for the energy balance equation of hydrogen. In this study, these parameters were derived using REFPROP 9.0, provided by the National Institute of Standards and Technology (NIST), with the final function formulas presented in Equations (6)–(9) [19].
C p = 2.132 · 10 14 · T 6 + 1.0894 · 10 10 · T 5 2.2724 · 10 4 · T 4 + 0.00247 · T 3 0.14566 · T 2 + 44.16 · T + 9112.409  
P r = 7.923 · 10 8 · T 2 2.649 · 10 4 · T + 0.7656  
V i s = 3.515 · 10 12 · T 2 2.609 · 10 8 · T + 3.16 · 10 6  
k = 2.997 · 10 8 · T 2 + 4.439 · 10 4 · T + 0.0513  
The convective heat transfer coefficient in the energy balance equation for H2 was analyzed at velocities of 2 m/s, 8 m/s, and 16 m/s using the commercially available computer analysis code ANSYS FLUENT. A mathematical relationship between the convective heat transfer coefficient (h) and velocity (V) was derived and implemented as a subroutine in the in-house code. Equations (10) and (11) represent the functional formulas for the convective heat transfer coefficients of alumina and adsorbent, respectively.
h a l u m i n a = 1.2611 · V 2 + 94.052 · V + 20.306  
h a d s o r b e n t = 0.9805 · V 2 + 98.643 · V + 12.069  
Moreover, the convective heat transfer coefficient was determined via computational fluid dynamics (CFD) analysis and integrated into the in-house code as a function of the Nusselt number with respect to the Reynolds number. Considering that heat transfer between the tower body and adsorbent occurs through convection, it is defined in relation to the Nusselt number for a flat plate subjected to fully developed turbulent flow, as delineated in Equation (12). Upon functionalizing the Nusselt number, the velocity can be ascertained, given the mass flow rate of hydrogen, allowing for the computation of the Reynolds number and the determination of the Nusselt number. Subsequently, the convective heat transfer coefficient (h) can be derived.
N u f l a t = h · L k = 0.0359 · R e L 0.8 · R e L 0.6  
In the grid independence test, the actual lengths of alumina and absorbent in Figure 2 were 176 mm and 1214 mm, respectively. To accommodate computational constraints, eight cases were considered with a grid spacing of 12 mm, 10 mm, 7.5 mm, and 5 mm to evaluate temperature calculations under transient conditions.
Figure 5 illustrates the outcomes of the grid independence test. As demonstrated in the figure, the final convergence temperature exhibited an increase with decreasing grid spacing. Based on these results, it is advised to maintain a grid spacing of 7.5 mm or below to ensure accurate convergence of temperature calculations. The analysis of case 1 and case 2 presented in Results and Discussion was conducted using a grid size of 5 mm.

3. Results and Discussion

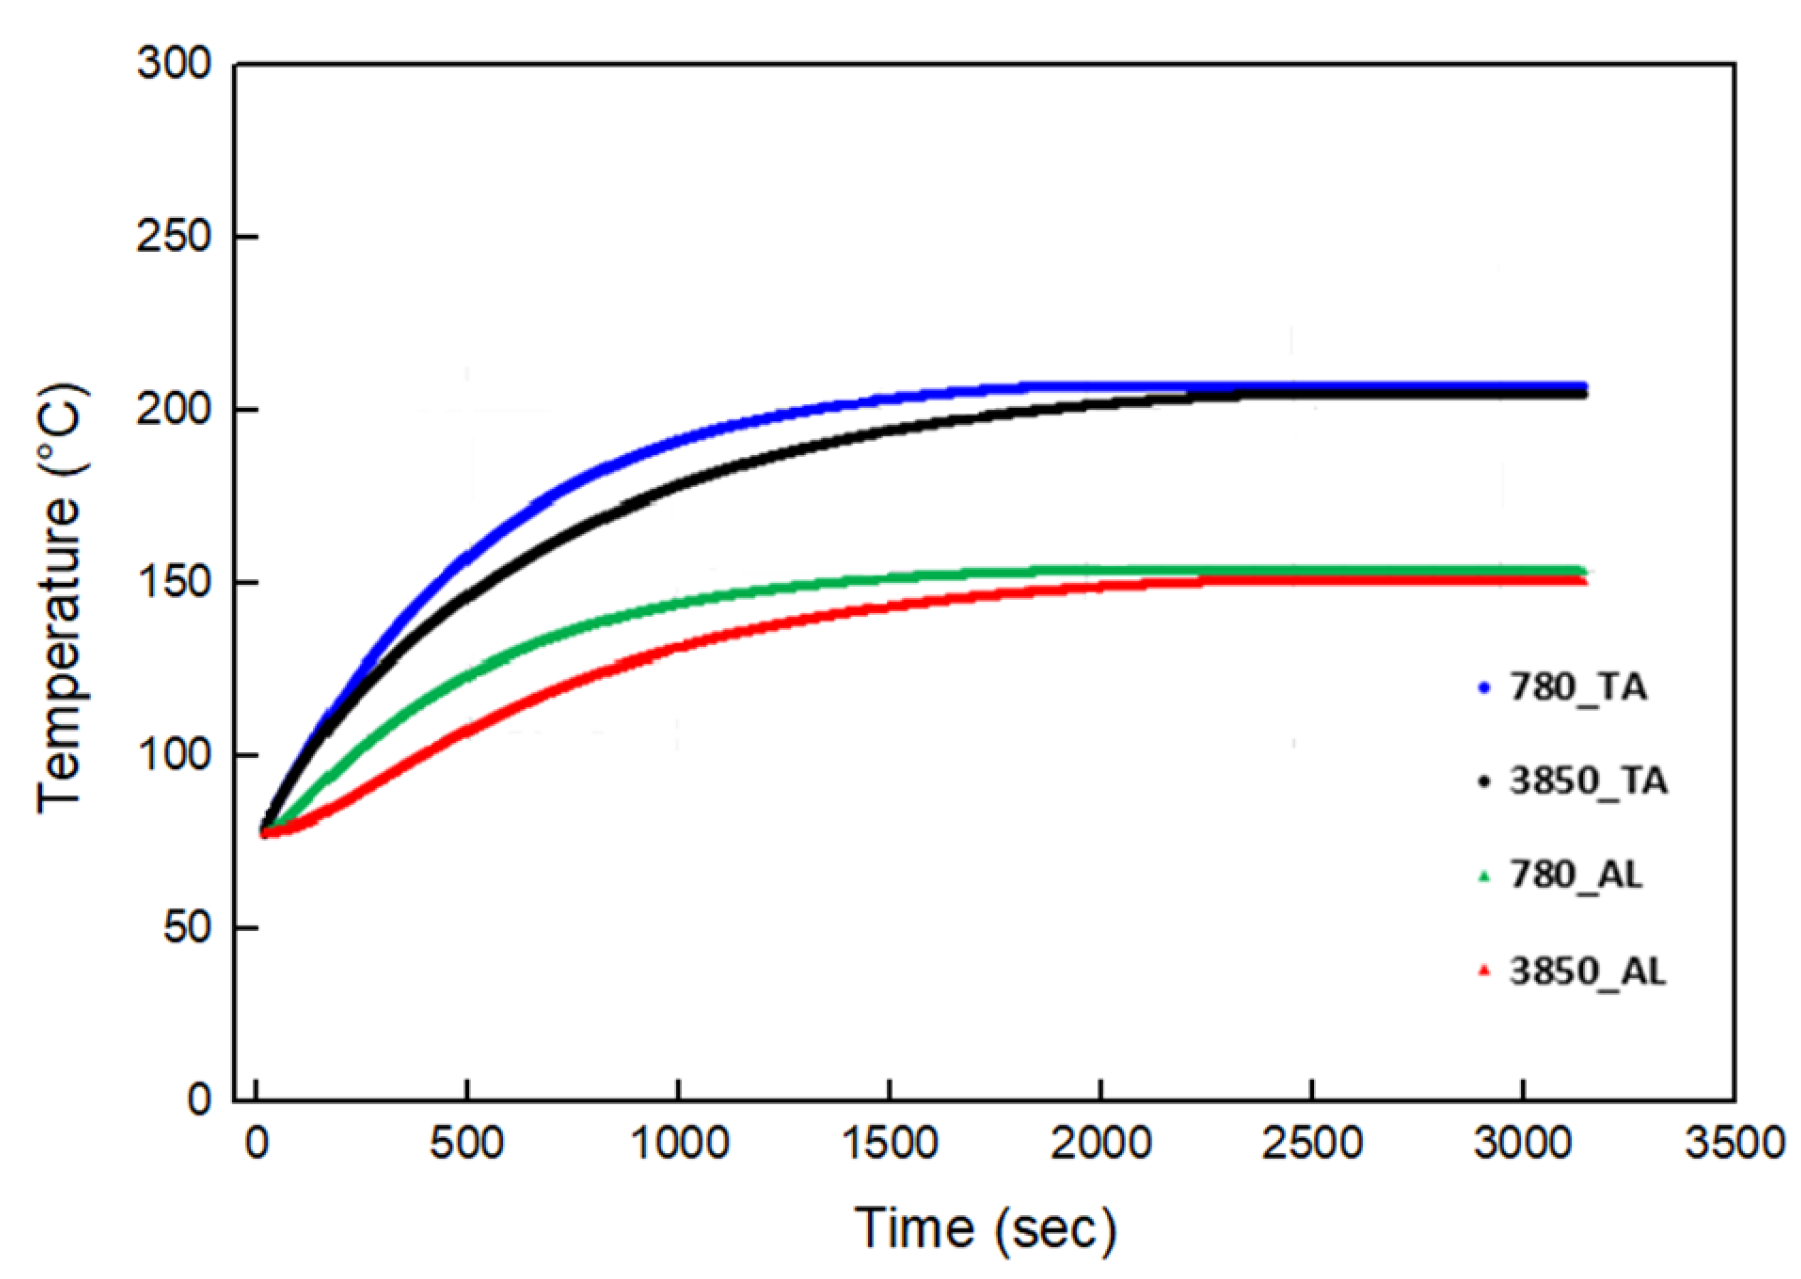
Figure 6 presents the temperature history over time as the density value of Alumina changes from 780 kg/m3 to 3850 kg/m3. In the figure, 780_TA and 3850_TA represent the temperature histories of densities of 780 kg/m3 and 3850 kg/m3, respectively, over time, while 780_AL and 3850_AL signify the temperature histories of Alumina with densities of 780 kg/m3 and 3850 kg/m3, respectively. As observed in Figure 6, the slope of the temperature history concerning time change increases steeply with decreasing density.
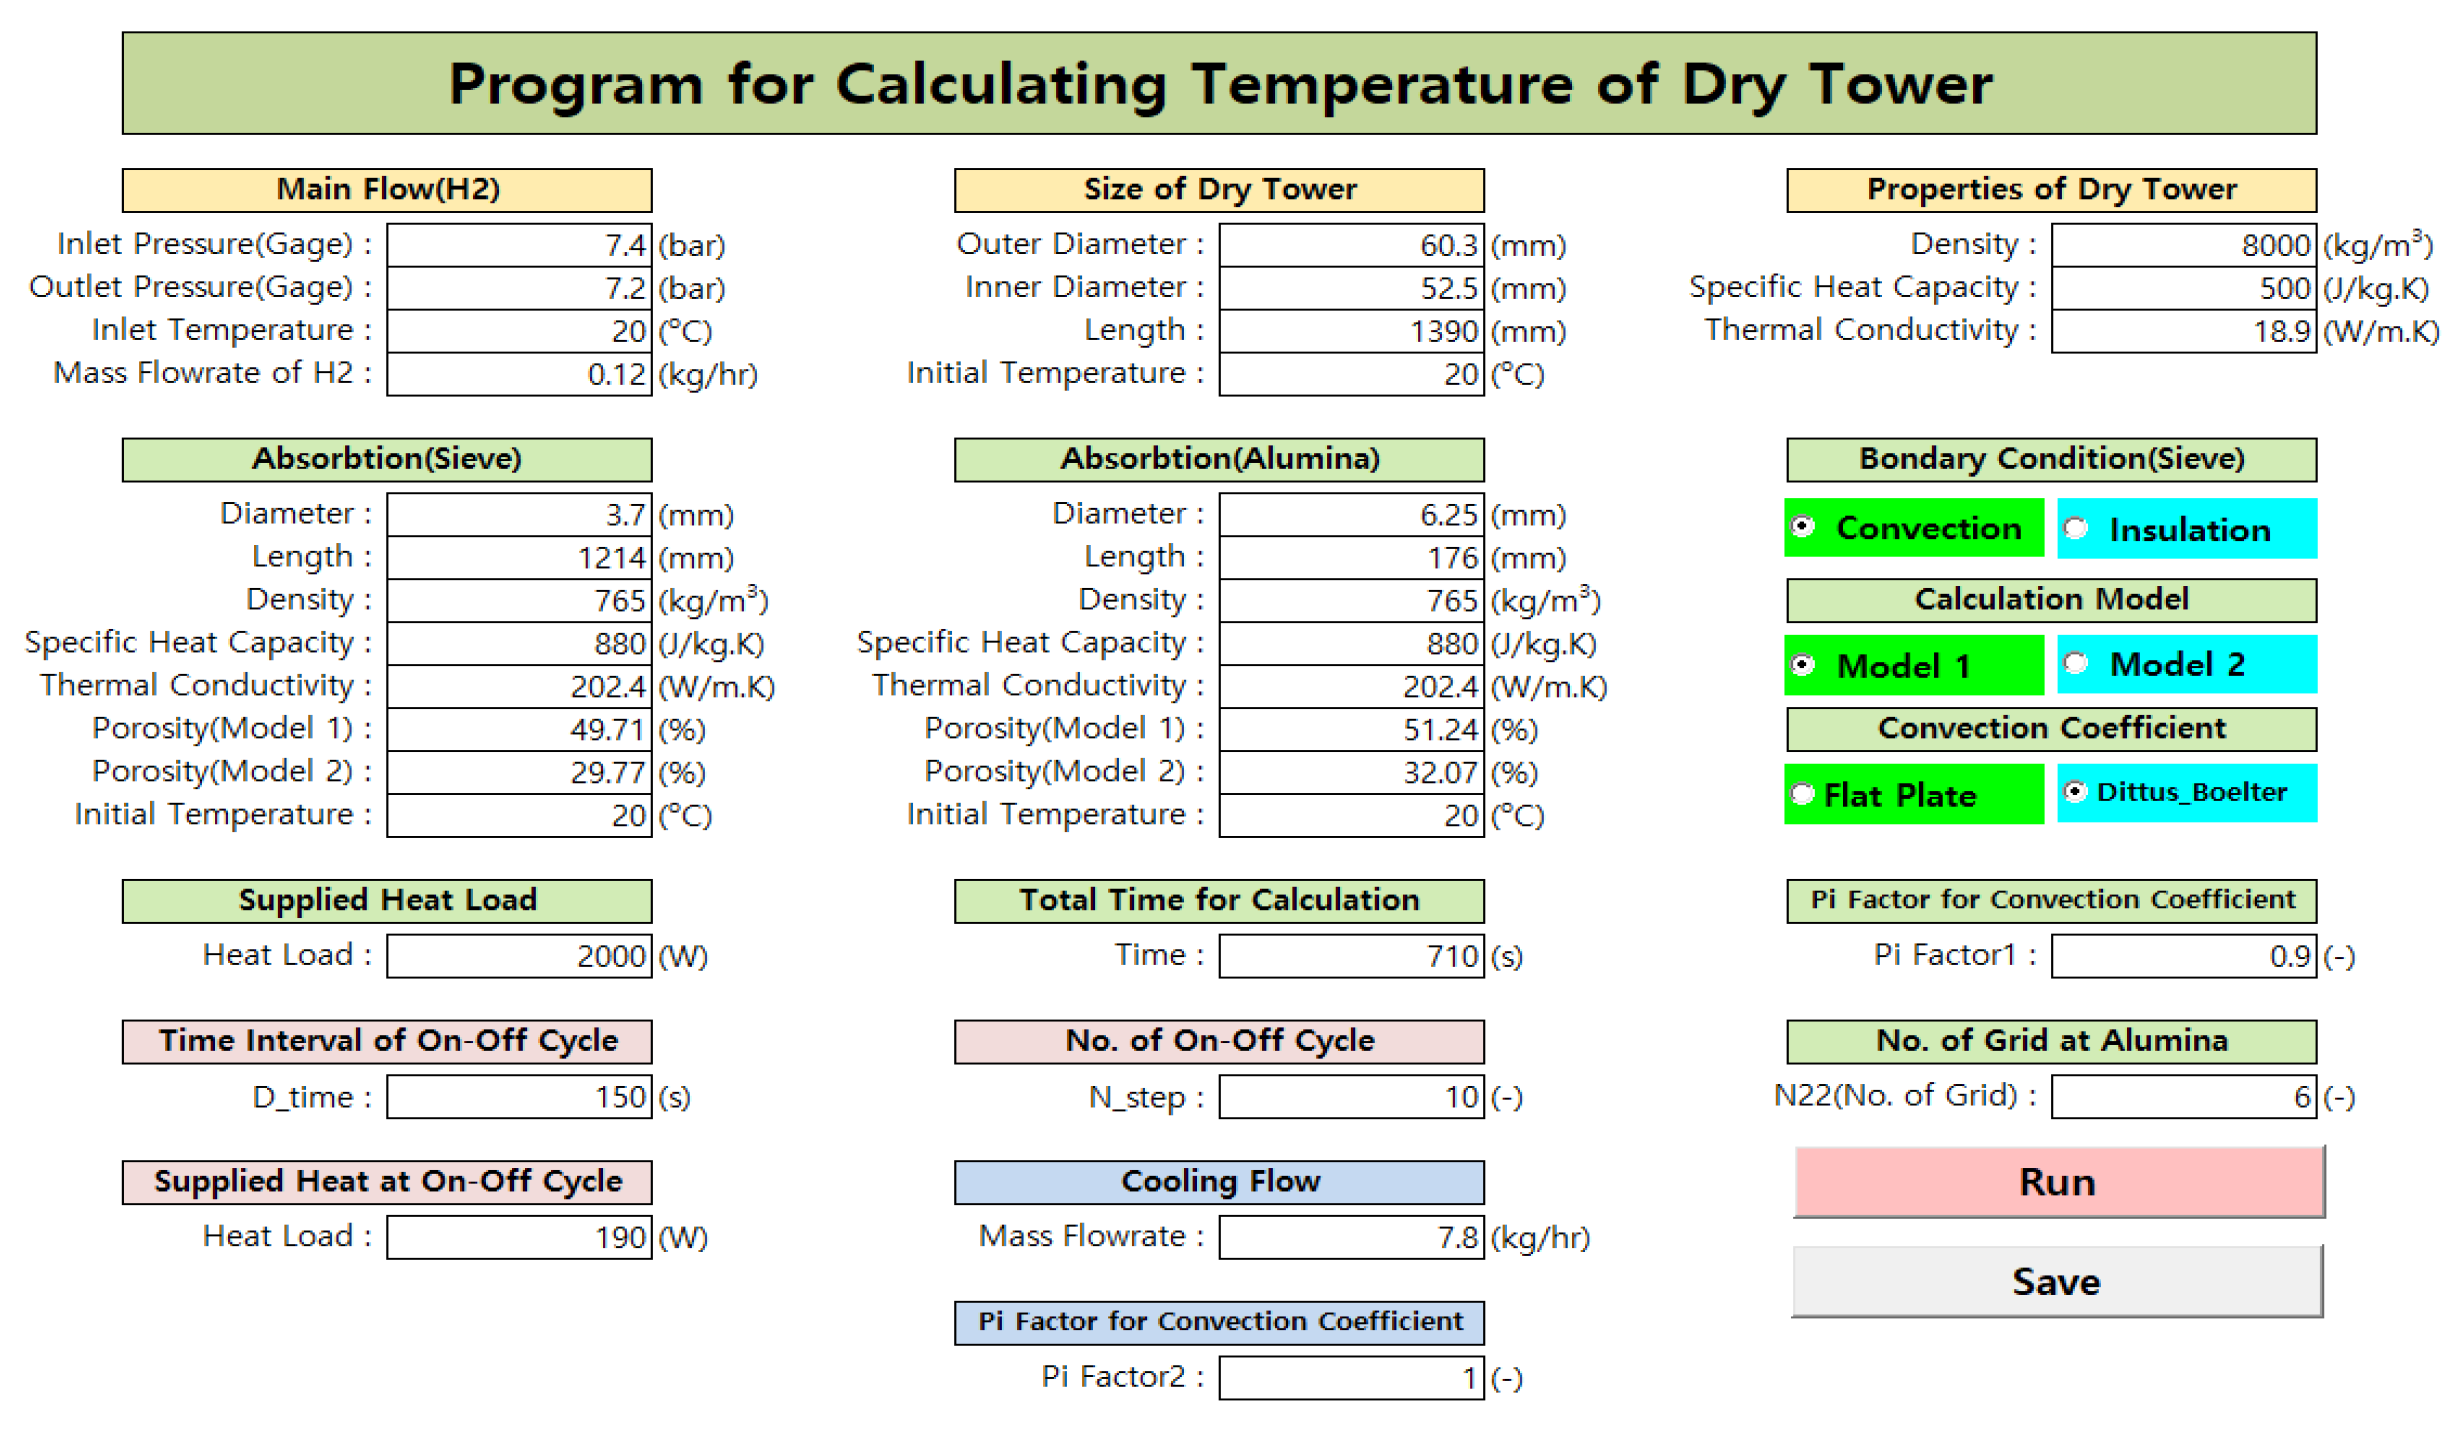
Figure 7 displays the overall layout of the in-house code alongside the input window. Upon scrutinizing the main input window, the “Time Interval of On-Off Cycle” represents the duration of On and Off cycles, following a specified heat load supplied by the heater jacket. The “Number of On-Off Cycles” specifies the repetition count of On-Off cycles, with the in-house code operating at N = 6 and N = 10 exclusively. N = 6 and N = 10 imply that the cumulative number of Off and On cycles is either 6 or 10, respectively. Furthermore, “Supplied Heat at On-Off Cycle” denotes the heat quantity provided by the heater jacket during the On-Cycle, while “Cooling Flow” is an input field for the cooling flow rate, which cools the drying tower upon completion of the On-Off Cycle. Lastly, the “Pi Factor for Convection Coefficient” serves as an input field for adjusting the convective heat transfer coefficient of the cooling flow, by inputting a coefficient value.
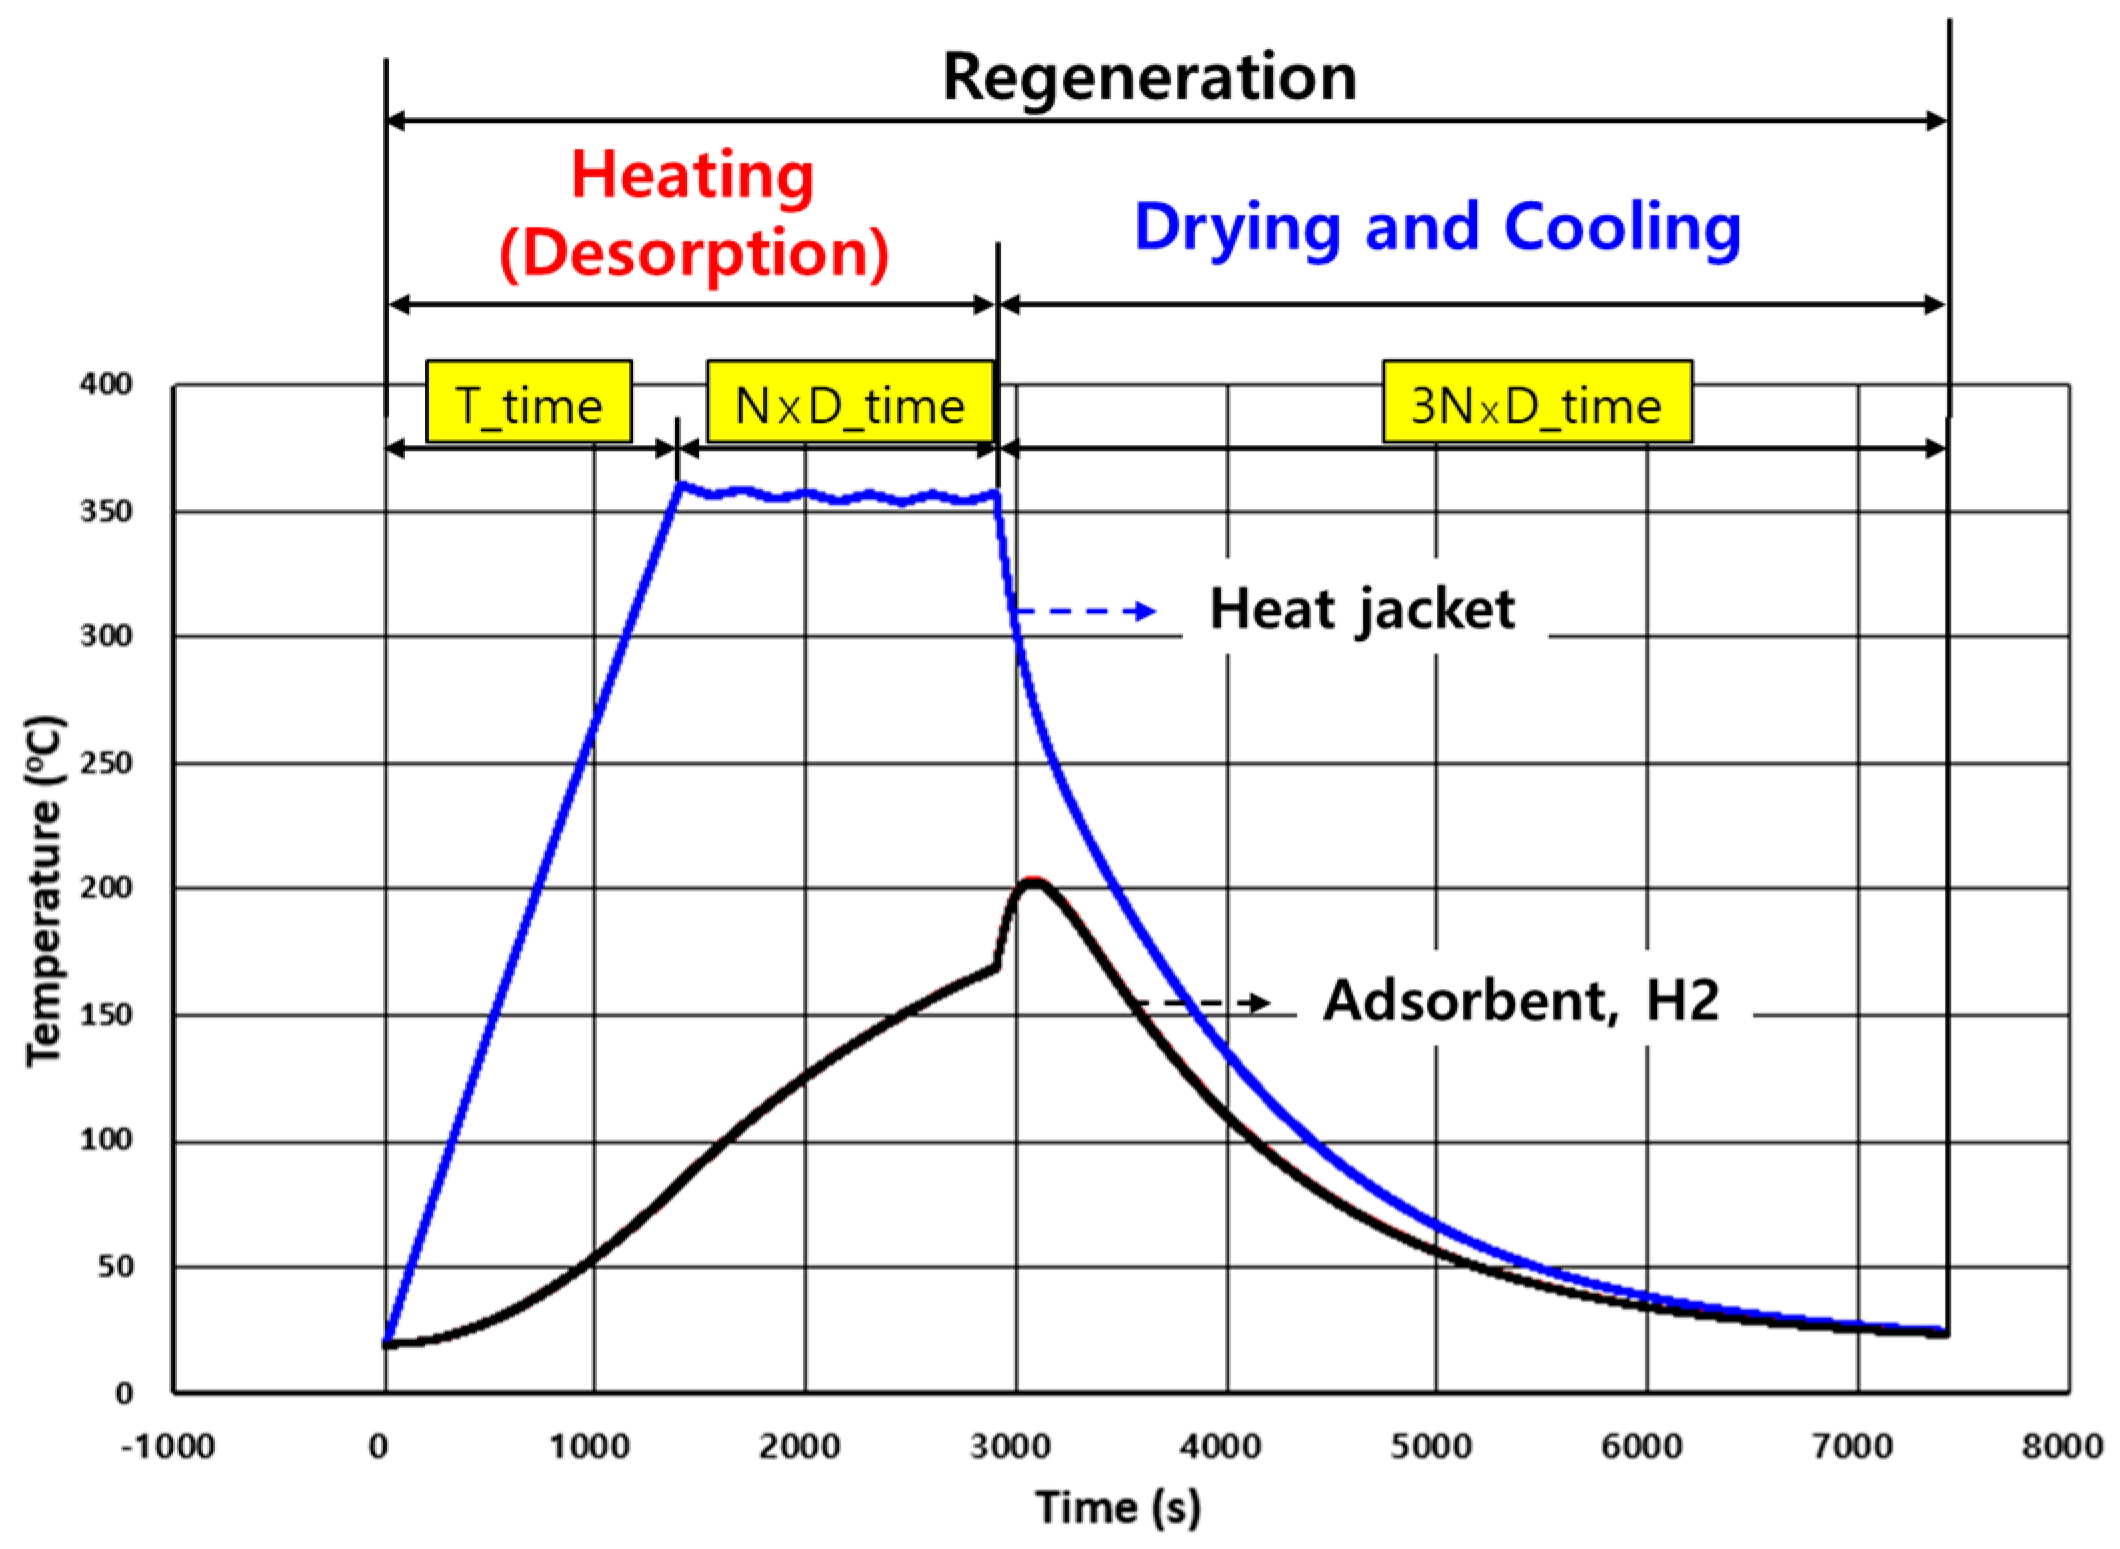
Figure 8 presents the regeneration process, which encompasses desorption, drying, and cooling stages. T_time denotes the total duration for which the heater jacket supplies 2000 W, whereas N×D_time signifies the cumulative time during which the heater jacket operates within an On-Off Cycle. Additionally, 3N×D_time, a period when the heat supply from the heater jacket is ‘0’, corresponds to the time allocated for drying and cooling. Thus, the comprehensive operation time applied to this program is the sum of T_time and N×D_time, and 3N×D_time, as demonstrated in the figure.
To validate the final in-house code, calculations were performed for two distinct cases. Table 1 displays the respective input values for Case 1 and Case 2.
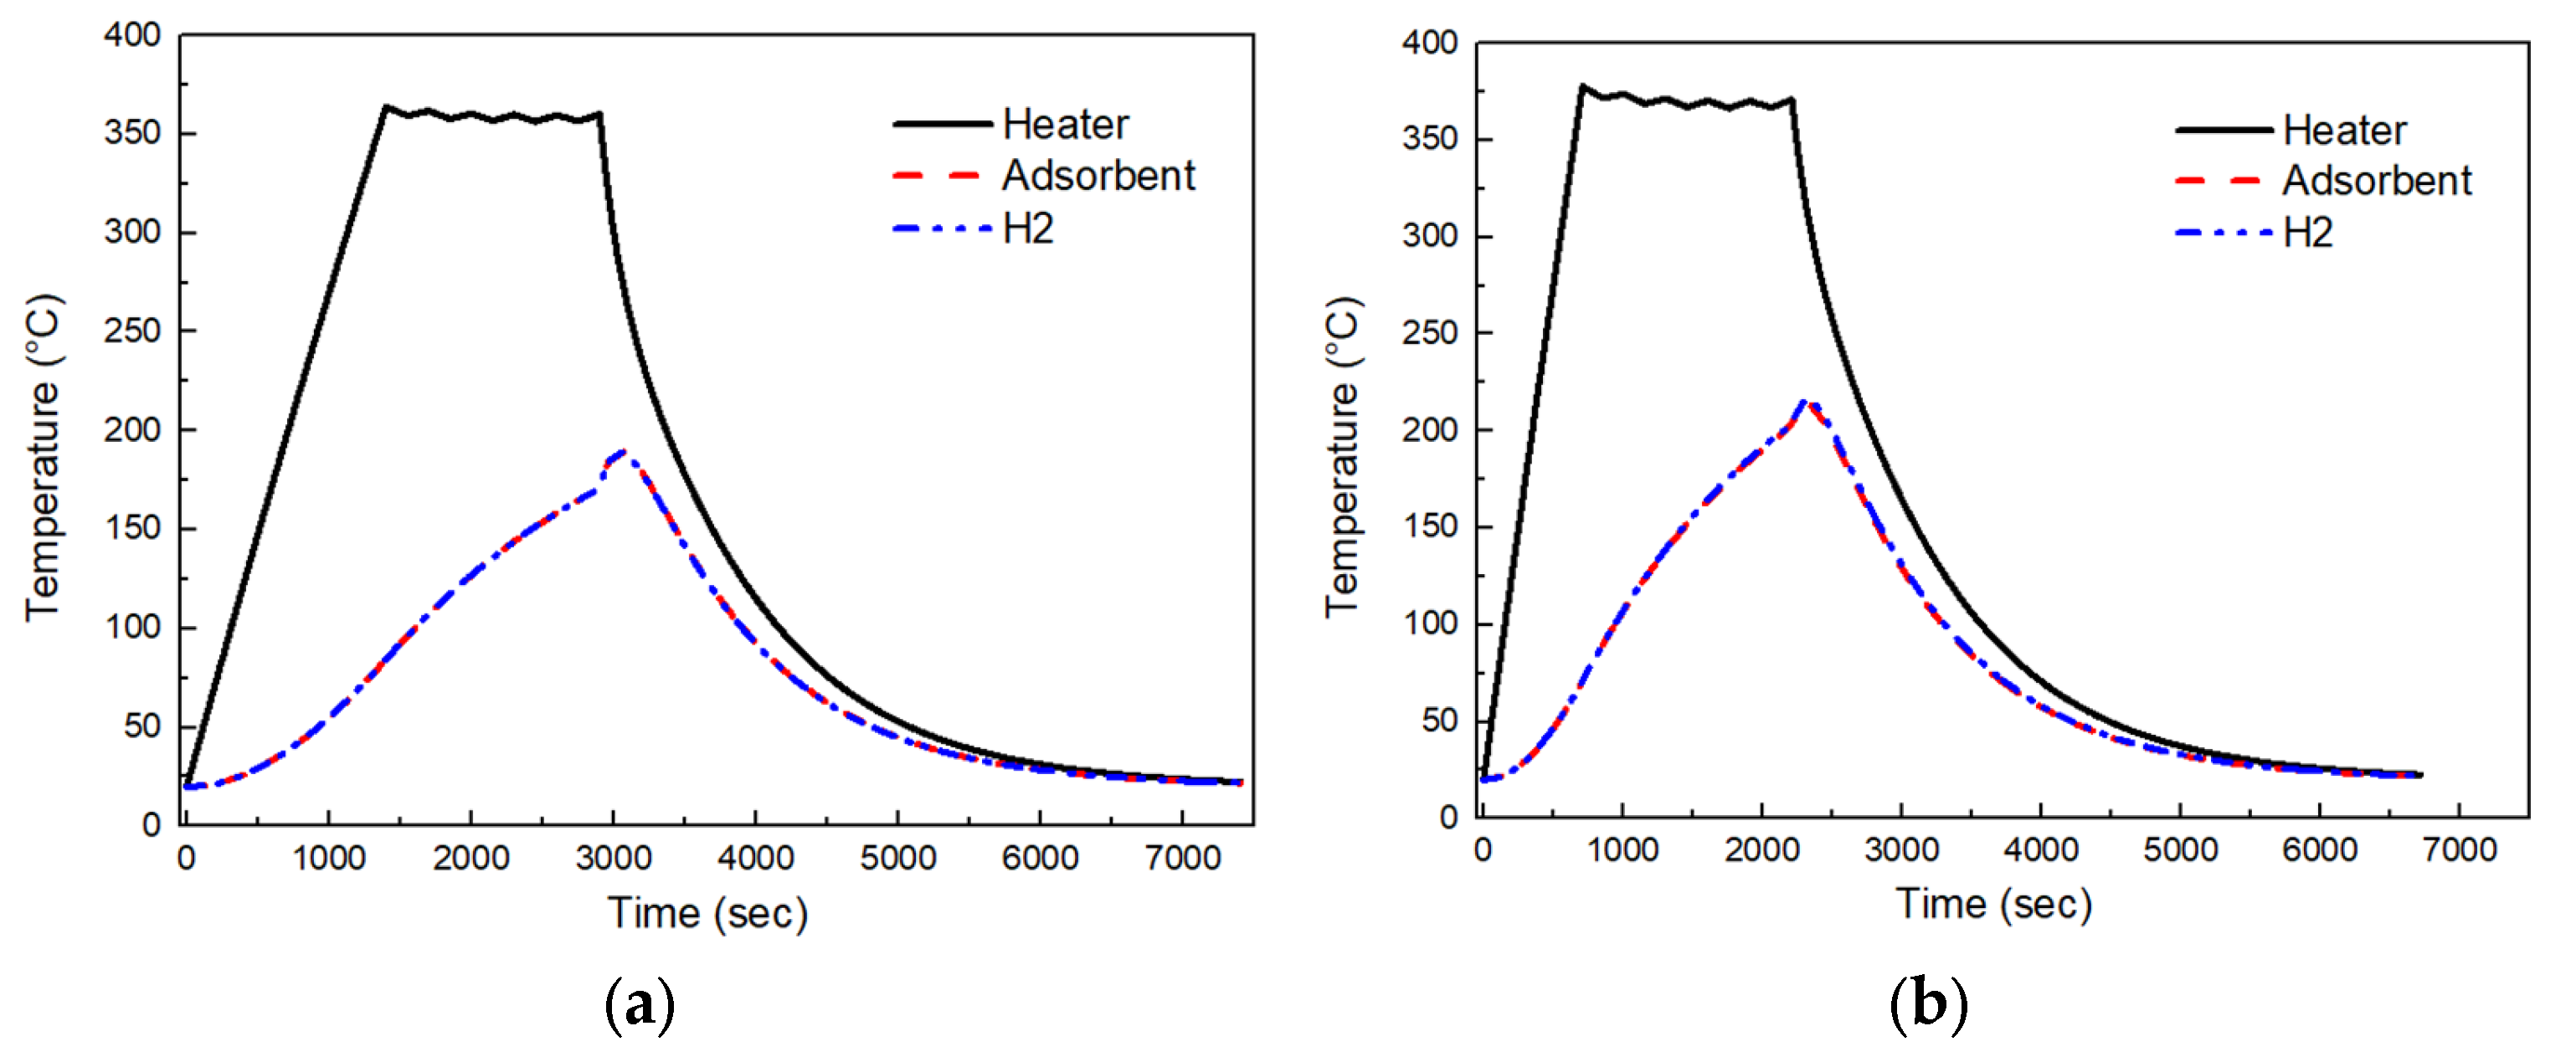
The objective of our in-house code was to predict the test data we gathered, as demonstrated in Figure 9a,b. These figures present an analysis of the system’s performance in Case 1 and Case 2, respectively. In Figure 9a, the heater jacket’s supply heat source was 1000 W, leading to a time of approximately 1400 s to reach 360 °C. Conversely, in Figure 10b, the supplied heat source to the heater jacket was increased to 2000 W, resulting in a time of around 710 s to reach 360 °C. After the system underwent an On-Off cycle for a designated duration, the temperature of the adsorbent and H2 increased in both Case 1 (Figure 9a) and Case 2 (Figure 9b). After supplying the cooling fluid, we observed a temperature jump in both the adsorbent and H2 phases. As a result, when the cooling fluid is supplied to the dryer, the convective heat transfer coefficient rises in accordance with an increase in flow rate. The adsorbent and H2 absorb more heat from the body than during the On-Off Cycle process, leading to a temperature increase. After that, the adsorbent and H2 are immediately cooled. The convective heat transfer coefficient has a significant effect on the internal temperature during the dryer’s regeneration process.
Verification of In-house code was accomplished using an analogous industrial plant of the same power having the same operating systems design. The dryer’s thermal behavior of the numerical results and the water electrolysis plant were compared to ascertain the accuracy of the model. 
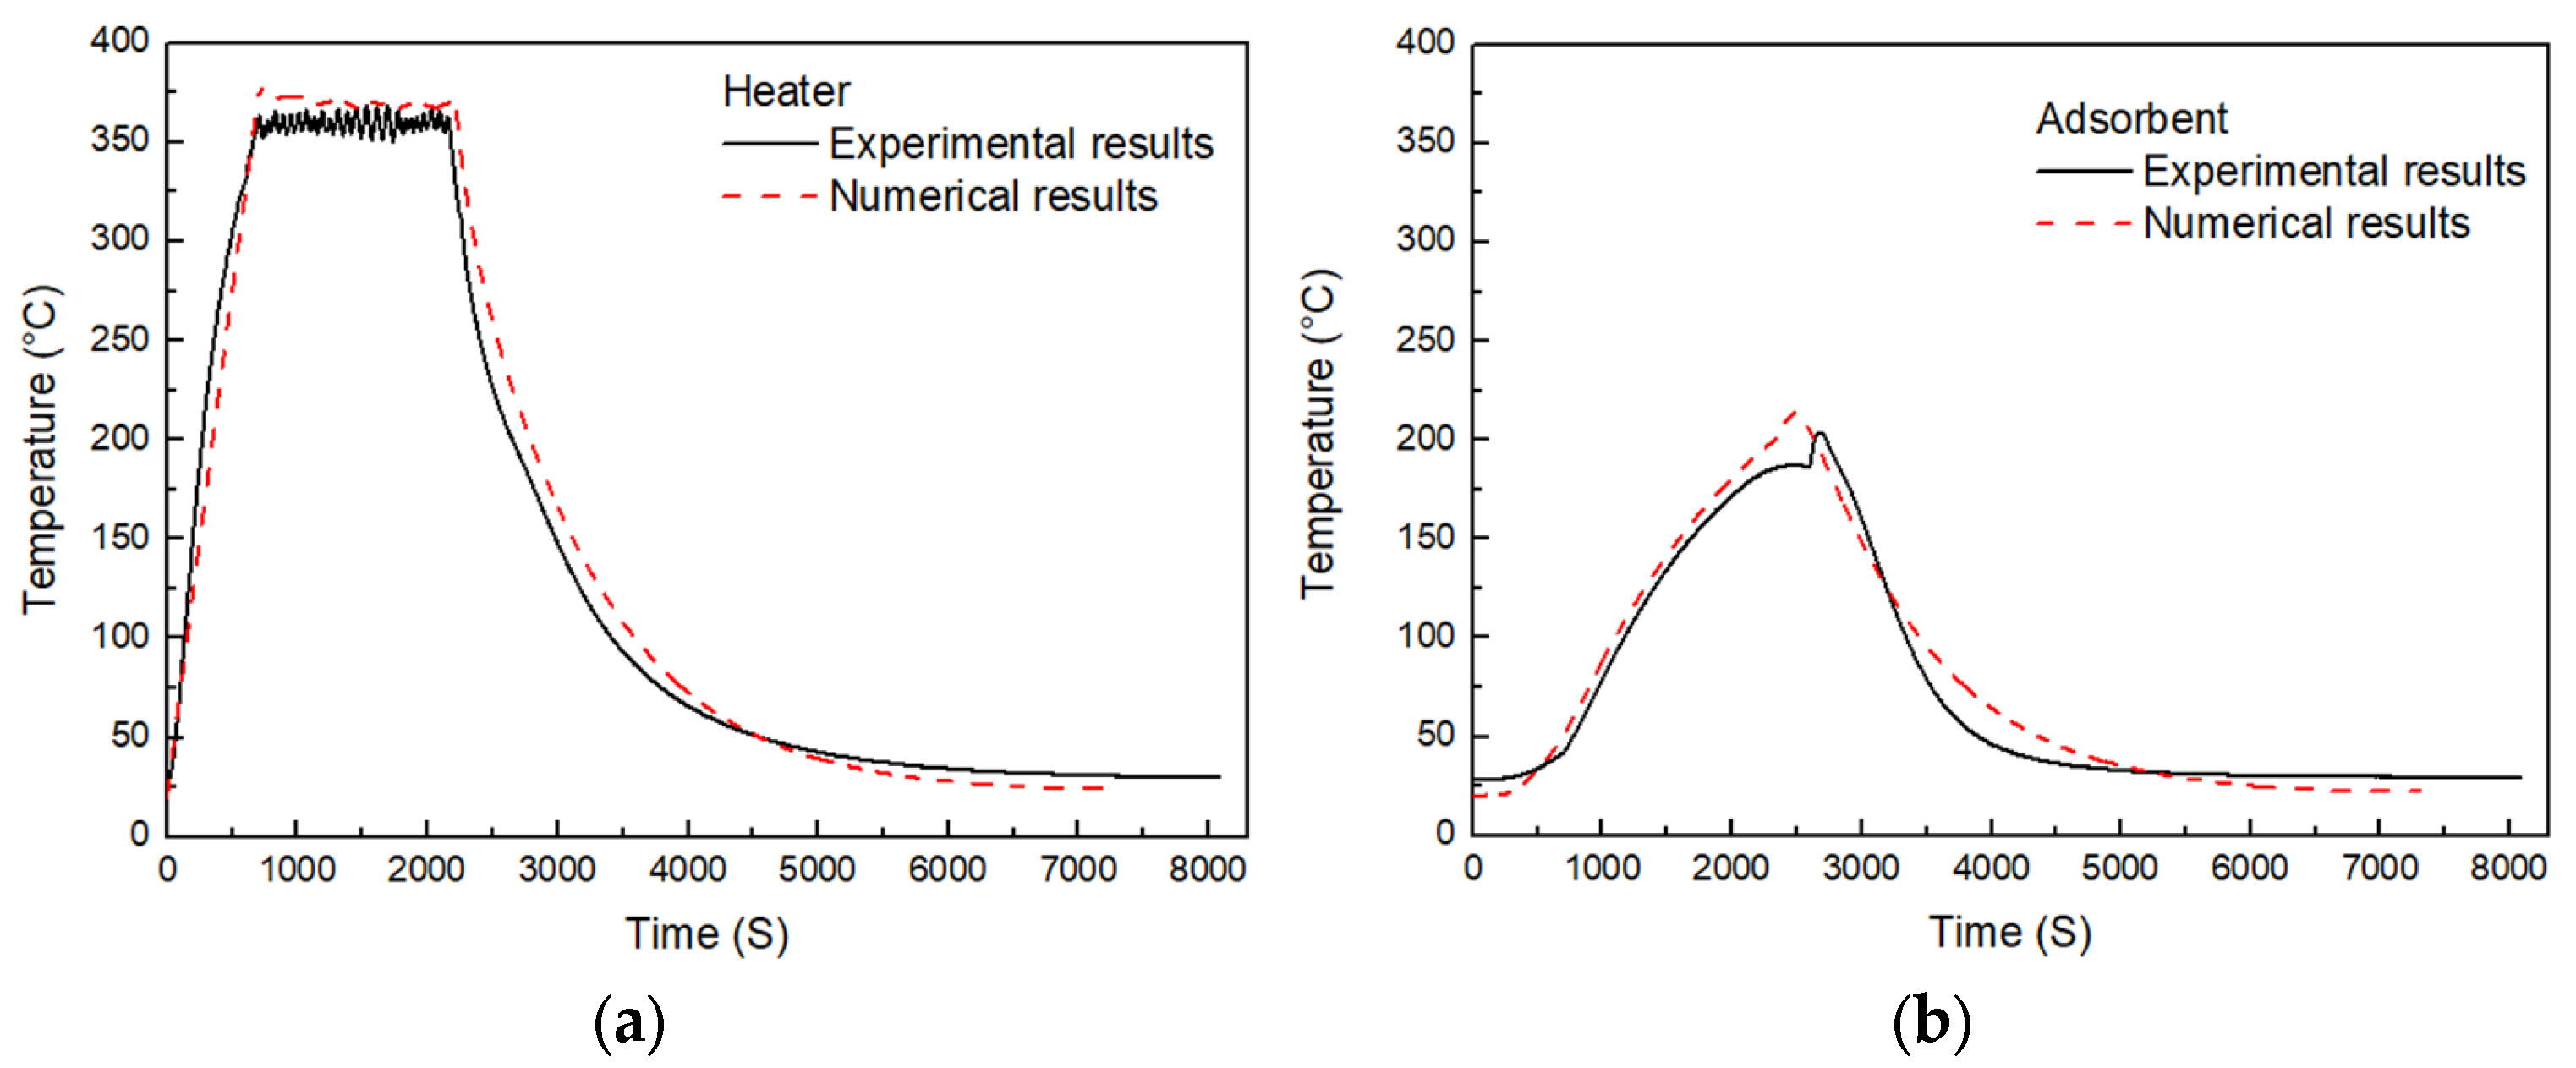
Figure 10a,b show the experimental results acquired from the water electrolysis system test, which is illustrated in Figure 1. As demonstrated in Figure 10a, the temperature of the heater rises to around 360 °C. As depicted in Figure 10a, over a heating process of 701 s, the temperature of the drying tower heater rises to approximately 360 °C. When the heater reaches this temperature, it begins an on-off cycle during the regeneration process. After this cycle, the heater is switched off, while the supply of cooling fluid to the dryer continues. From the measured adsorbent temperature in Figure 10b, the temperature discontinuity caused by the inflow of the cooling fluid, as demonstrated in the calculations in Figure 9, also appears within the actual dryer. The actual heating time (T_time) recorded was 701 s, which deviated by approximately 9 s (1.28%) from the 710 s of Case 2. Following the heating process, the temperature measured in the dryer heater was 366.5 °C, while the analysis conducted using the in-house code yielded a result of 372.1 °C, indicating an error of approximately 6 °C (1.64%). In addition, comparing the temperatures at the upper position inside the dryer, it was observed that the actual temperatures of the adsorbent and H2 increased rapidly from 187.1 °C to 203.7 °C when the cooling flow was introduced. In contrast, the analysis result showed a temperature range of 196.4 °C (4.97%) to 212.7 °C (4.42%), resulting in a difference of approximately 10 °C from the experimental results. During the heating process, it was observed that the temperature values measured in the experiment were consistently 6 °C to 10 °C lower than the values obtained through analysis. This discrepancy can be attributed to heat loss occurring during the transfer of heat from the actual heat jacket (heat source) to the dryer tower. Upon completion of the regeneration heating, the actual cooling time of the dryer tower was approximately 5300 s, whereas the calculated result showed approximately 4600 s. This discrepancy arises from differences between the cooling flow input values considered in the analysis and the fluctuations in temperature and flow rate of the gas supplied for cooling in the actual system.

4. Conclusions

In this comprehensive and methodical study, a sophisticated proprietary code was meticulously devised utilizing Visual Basic for Applications (VBA) with the express purpose of ascertaining the fundamental heat capacity of the drying tower. This heat capacity plays an indispensable role in determining the final purity of hydrogen generated within the water electrolysis system. The physical properties of the dryer tower materials are important parameters that determine its temperature history over time. Values for density, specific heat, and thermal conductivity were determined using REFPROP 9.0 provided by NIST and computational fluid dynamics analysis. When analyzing heat transfer within a dryer, the calculation time increases as the grid interval decreases. Therefore, the grid is determined by verifying the convergence of the calculated temperature through a grid independence test. Through comparison with the experimental results of the dryer tower, it was confirmed that the internal temperature analysis result of the dryer was calculated within a 5% error. These calculation results can be used as a basis for optimizing the dryer tower according to the capacity and load changes of the water electrolysis system.

Author Contributions

Conceptualization, S.K. and J.-S.Y.; methodology, J.-S.Y.; software, S.K. and J.-S.Y.; validation, S.K., S.E. and G.C.; formal analysis, S.K. and J.-S.Y.; investigation, S.K., S.E., J.-S.Y. and G.C.; resources, S.K.; data curation, S.K., J.-S.Y. and G.C.; writing—original draft preparation, S.K. and S.E.; writing—review and editing, S.K. and S.E.; visualization, S.K. and S.E.; supervision, G.C.; project administration, S.K. and J.-S.Y.; funding acquisition, S.K. All authors have read and agreed to the published version of the manuscript.

Funding

This research was funded by the Korea Government(MOTIE) grant number 20223030040050.

Data Availability Statement

The data presented in this study are available in insert article.

Conflicts of Interest

The authors declare no conflict of interest.

References

  1. Oh, N. R&D Trends for Green Catalytic Technology Developments. J. Korea Acad.-Ind. Coop. Soc. 2014, 15, 6518–6526. [Google Scholar] [CrossRef]
  2. Lee, J.; Lee, S.; Moon, J.; Choi, D.; Lee, C. Design of adsorption bed for Compact H2 PSA process. J. Korean Soc. New Renew. Energy 2006, 2, 60–68. [Google Scholar]
  3. Lee, C.; Lee, S.; Lee, J. Development Trend of PEM Water Electrolysis Cathode Supported Catalyst for Green Hydrogen Production. Electr. Electron. Mater. 2021, 34, 32–41. [Google Scholar]
  4. Carmo, M.; Fritz, D.L.; Mergel, J.; Stolt, D. A comprehensive review on PEM water electrolysis. Int. J. Hydrogen Energy 2013, 38, 4901–4934. [Google Scholar] [CrossRef]
  5. Chi, J.; Yu, H. Water electrolysis based on renewable energy for hydrogen production. Chin. J. Catal. 2018, 39, 390–394. [Google Scholar] [CrossRef]
  6. Brauns, J.; Turek, T. Alkaline water electrolysis powered by renewable energy: A review. Processes 2020, 8, 248. [Google Scholar] [CrossRef] [Green Version]
  7. Oh, O. The Adsorption-Desorption Characteristics of VOC on Activated Carbon by Thermal Swing Adsorption(TSA) Process. Master’s Thesis, Yonsei University, Seoul, Republic of Korea, 2000; pp. 1–2. Available online: http://www.riss.kr/link?id=T7911974&outLink=K (accessed on 1 February 2001).
  8. Reijers, H.T.J.; Valster-Schiermeier, S.E.A.; Cobden, P.D.; Brink, R.W. Hydrotalcite as CO2 sorbent for sorption enhanced steam reforming of methane. Ind. Eng. Chem. Res. 2006, 45, 2522–2530. [Google Scholar] [CrossRef]
  9. Sircar, S. Basic research needs for design of adsorptive gas searation processes. Ind. Eng. Chem. Res. 2006, 45, 5435–5448. [Google Scholar] [CrossRef]
  10. Tjarks, G.; Gibelhaus, A.; Lanzerath, F.; Müller, M.; Bardow, A.; Stolten, D. Energetically-optimal PEM electrolyzer pressure in power-to-gas plants. Appl. Energy 2018, 218, 192–198. [Google Scholar] [CrossRef]
  11. Bensmann, B.; Hanke-Rauschenbach, R.; Müller-Syring, G.; Henel, M.; Sundmacher, K. Optimal configuration and pressure levels of electrolyzer plants in context of power-to-gas applications. Appl. Energy 2016, 167, 107–124. [Google Scholar] [CrossRef]
  12. Lively, R.P.; Realff, M.J. On thermodynamic separation efficiency: Adsorption processes. AIChE J. 2016, 62, 3699–3705. [Google Scholar] [CrossRef]
  13. Tao, W.; Ma, S.; Xiao, J.; Bénard, P.; Chahine, R. Simulation and optimization for hydrogen purification performance of vacuum pressure swing adsorption. Energy Procedia 2019, 158, 1917–1923. [Google Scholar] [CrossRef]
  14. Ye, F.; Ma, S.; Tong, L.; Xiao, J.; Bénard, P.; Chahine, R. Artificial neural network based optimization for hydrogen purification performance of pressure swing adsorption. Int. J. Hydrogen Energy 2019, 44, 5334–5344. [Google Scholar] [CrossRef]
  15. Sakas, G.; Ibáñez-Rioja, A.; Ruuskanen, V.; Kosonen, A.; Ahola, J.; Bergmann, O. Dynamic energy and mass balance model for an industrial alkaline water electrolyzer plant process. Int. J. Hydrogen Energy 2022, 47, 4328–4345. [Google Scholar] [CrossRef]
  16. Aleghafouri, A.; Davoudi, M. Modeling and simulation of a pressure–temperature swing adsorption process for dehydration of natural gas. Adsorption 2018, 24, 121–133. [Google Scholar] [CrossRef]
  17. Ambrożek, B.; Nastaj, J.; Gabruś, E. Modeling and experimental studies of adsorptive dewatering of selected aliphatic alcohols in temperature swing adsorption system. Dry. Technol. 2013, 31, 1780–1789. [Google Scholar] [CrossRef]
  18. Park, H. Bio-Isobutanol Catalyzed Conversion Using γ-Alumina and Isobutylene Separate Purification Technology through TSA Process. Master’s Thesis, Hanyang University, Seoul, Republic of Korea, 2017; pp. 1–9. Available online: http://www.riss.kr/link?id=T14384649&outLink=K (accessed on 1 February 2017).
  19. NIST Standard Reference Database Number 69. Available online: https://data.nist.gov/od/id/EBC9DB05EDEE5B0EE043065706812DF85 (accessed on 31 July 2009).
Figure 1. Schematic diagram of water electrolysis system process.
Energies 16 05090 g001
Figure 2. Dryer tower geometry and internal adsorbent ratio.
Energies 16 05090 g002
Figure 3. Layout for dry tower composition and heat transfer analysis (a,b) and scheme of heat transfer of dryer tower, adsorbent, and H2 (ce).
Energies 16 05090 g003aEnergies 16 05090 g003b
Figure 4. Flow chart for in-house code.
Energies 16 05090 g004
Figure 5. Grid independence analysis results according to the grid interval.
Energies 16 05090 g005
Figure 6. Temperature calculation results over time when Alumina and adsorbent densities are 780 kg/m3 and 3850 kg/m3.
Energies 16 05090 g006
Figure 7. In-house code input window.
Energies 16 05090 g007
Figure 8. Regeneration cycle for desorption.
Energies 16 05090 g008
Figure 9. Numerical results of the regeneration process of (a) case 1 (1000 W) and (b) case 2 (2000 W).
Energies 16 05090 g009
Figure 10. Regeneration process of experimental and numerical results (case 2) for the (a) heater and (b) adsorbent.
Energies 16 05090 g010
Table 1. Parameter for the case study of in-house code program.
DivisionCase 1Case 2
Total Time for Calculation1400 s710 s
Time Interval of On-Off Cycle150 s150 s
No. of On-Off Cycle1010
Supplied Heat at On-Off Cycle170 W190 W
Cooling Flow7.8 kg/h7.8 kg/h
Pi Factor2 for Convection Coeff.11
Disclaimer/Publisher’s Note: The statements, opinions and data contained in all publications are solely those of the individual author(s) and contributor(s) and not of MDPI and/or the editor(s). MDPI and/or the editor(s) disclaim responsibility for any injury to people or property resulting from any ideas, methods, instructions or products referred to in the content.

