1. Introduction
According to the Energy Union strategy (2015), one of the goals of the EU’s energy policy is to focus on improving energy efficiency, reducing dependence on energy imports, and primarily reducing CO
2 emissions. In accordance with the Paris Agreement, another goal is to decarbonize the economy and transition to a low-carbon economy. However, these goals cannot be achieved without supporting research in the field of low-carbon and clean energy technologies. At the same time, research and innovation should be prioritized to stimulate energy transformation [
1].
The current energy situation necessitates considering the utilization of all available energy sources. As part of the decarbonization and low-carbon technology strategy, EU countries have committed to phasing out the use of solid and liquid fossil fuels and replacing them with low-carbon fuels. Recently, attention has been focused on the production and utilization of hydrogen in various technologies as a means of reducing CO2 emissions.
Returning to the idea of transforming solid and liquid fuels into low-carbon gaseous fuels is one alternative for promoting energy independence while simultaneously supporting more environmentally friendly technologies through further research into existing technologies. One of the discussed technologies is the gasification of solid fuels such as coal, biomass, and organic waste from municipal and industrial sectors. Tosti et al. [
2] discussed the idea of producing alternative gaseous fuels as a substitute for natural gas using coal hydrogasification technology. In this publication, they correctly pointed out the issue of the availability of hydrogen produced from renewable sources. Nevertheless, hydrogasification of coal can be considered one of the ways to reduce the import of natural gas into the EU.
Gasification of coal directly in underground deposits is an innovative idea that enables the use of fossil fuel resources that are not economically feasible to extract using traditional methods. Researchers [
3] have extensively studied this area, developing a physical model to investigate various factors that affect the gasification process. In their work [
4], the authors explore the use of hydrogasification in underground deposits by conducting experiments that simulate the conditions of underground gasification. However, research in the field of underground gasification has highlighted the formation of tar as the primary challenge in obtaining clean synthesis gas. Nevertheless, research results indicate possible solutions to mitigate tar formation. Wiatowski [
5] conducted experimental studies on the underground coal gasification (UCG) process to analyze the formation of tar quantitatively and qualitatively. Tar formation is a notable issue in biomass gasification. The findings of a previous study by the authors [
6] indicated that this is primarily a concern with countercurrent gasifiers and that the solution lies in transitioning to a co-flow gasifier to mitigate tar formation.
Mlonka-Medrala et al. [
7] focused on improving the quality of synthesis gas from agricultural waste biomass; the results of experimental measurements and numerical simulations confirmed the influence of temperature on the purity of synthesis gas in this case as well. In his work, Slowak [
8] emphasized that modern methods of theoretical description of the process will not allow the prediction of good results if they are not based on experimental data that take into account the specific conditions of the gasification process. By comparing the methods of mathematical modeling, he divided gasification processes into five types. These include methods based on the principle of basic kinetic laws, methods of thermodynamic equilibrium, thermodynamics, empirical simulation methods, and combined models.
Saraceno et al. [
9] conducted a comprehensive review of various coal and biomass gasification methods, with a particular emphasis on hydrogasification. The review focused on examining the impact of different factors, including catalytic gasification, on the intensity of the hydrogasification process. Catalytic gasification has been extensively studied in several publications to determine the effects of catalysts on hydrogasification [
10]. The primary objective of this research was to identify the optimal catalyst for achieving a high methane yield.
The hydrogasification process shows the possibility of generating natural gas substitutes from coal and is therefore a topic for deep investigation [
11,
12,
13,
14,
15]. Two stages are involved in the hydrogasification of coal: in the first, coal pyrolysis occurs at an extremely fast rate under high pressure in an atmosphere of hydrogen, and the second is a comparatively slow phase with the hydrogasification of the char that is still present. In an inactive atmosphere, more quantities of liquid and gaseous hydrocarbons are obtained by hydropyrolysis than by pyrolysis [
12,
13,
16].
Reactive activities of coal chars with hydrogen have undergone extensive research [
17,
18,
19,
20,
21,
22] in an effort to determine char features and gasification conditions that affect the rate of the reaction.
The outcomes of Tomita et al.’s [
21] thermogravimetric analysis (TGA) hydrogasification studies on several chars showed that the more carbon conversion takes place, the more reactive most of the chars become, until the process attains a constant value at about 30% to 50% conversion; however, if there is only one char, the reactivity will decrease as carbon conversion proceeds. Nevertheless, Mühlen [
20] and Mühlen et al. [
23] observed that this decrease in reactivity as carbon conversion proceeds is specific to char hydrogasification. A previous study by Johnson [
24] validated this assertion. Johnson discovered that the rate of hydrogasification is at its maximum shortly after coal devolatilization and declines as gasification increases.
According to Tomajian et al. [
25], the hydrogasification rate rapidly declines as coal and other char are converted. Additionally, Gonzales et al. [
15] observed a sharp decline in the hydrogasification rate, with a conversion of only about 40% at temperatures higher than 1023 K.
Hydrogen plays a crucial role in the first stage of coal gasification (hydropyrolysis) because of its impact on primary tar and the solid carbon skeleton. Even at comparatively low pressures, coal pyrolysis with hydrogen significantly enhances carbon conversion to gaseous hydrocarbons [
26,
27].
Studies have shown that catalyst-related advantages are specifically significant for these types of gasification processes, where the potency of the reaction cannot be increased by the traditional method of increasing temperature, such as direct coal gasification into methane or allothermal gasification using an external, diaphragm heat source [
10,
28,
29,
30].
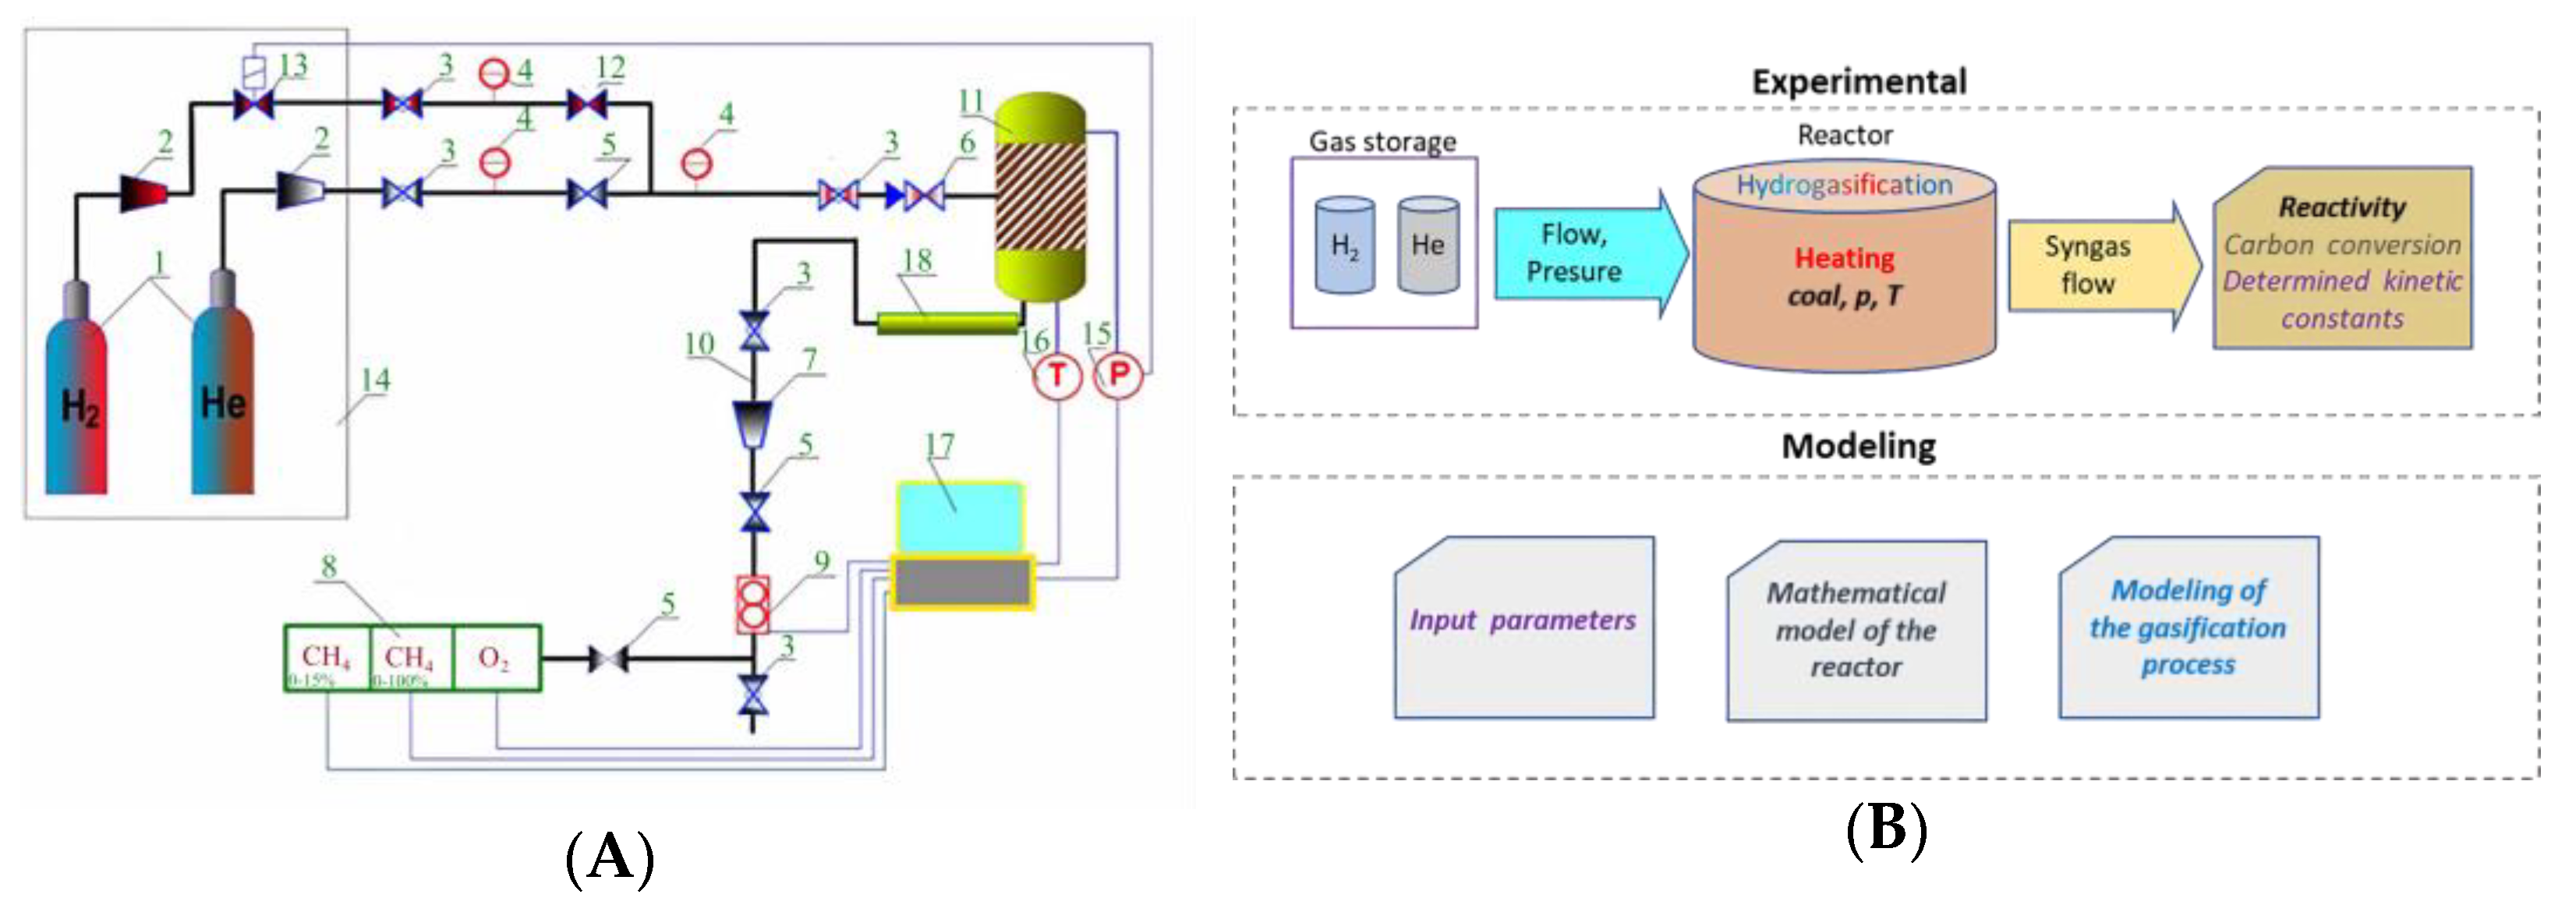
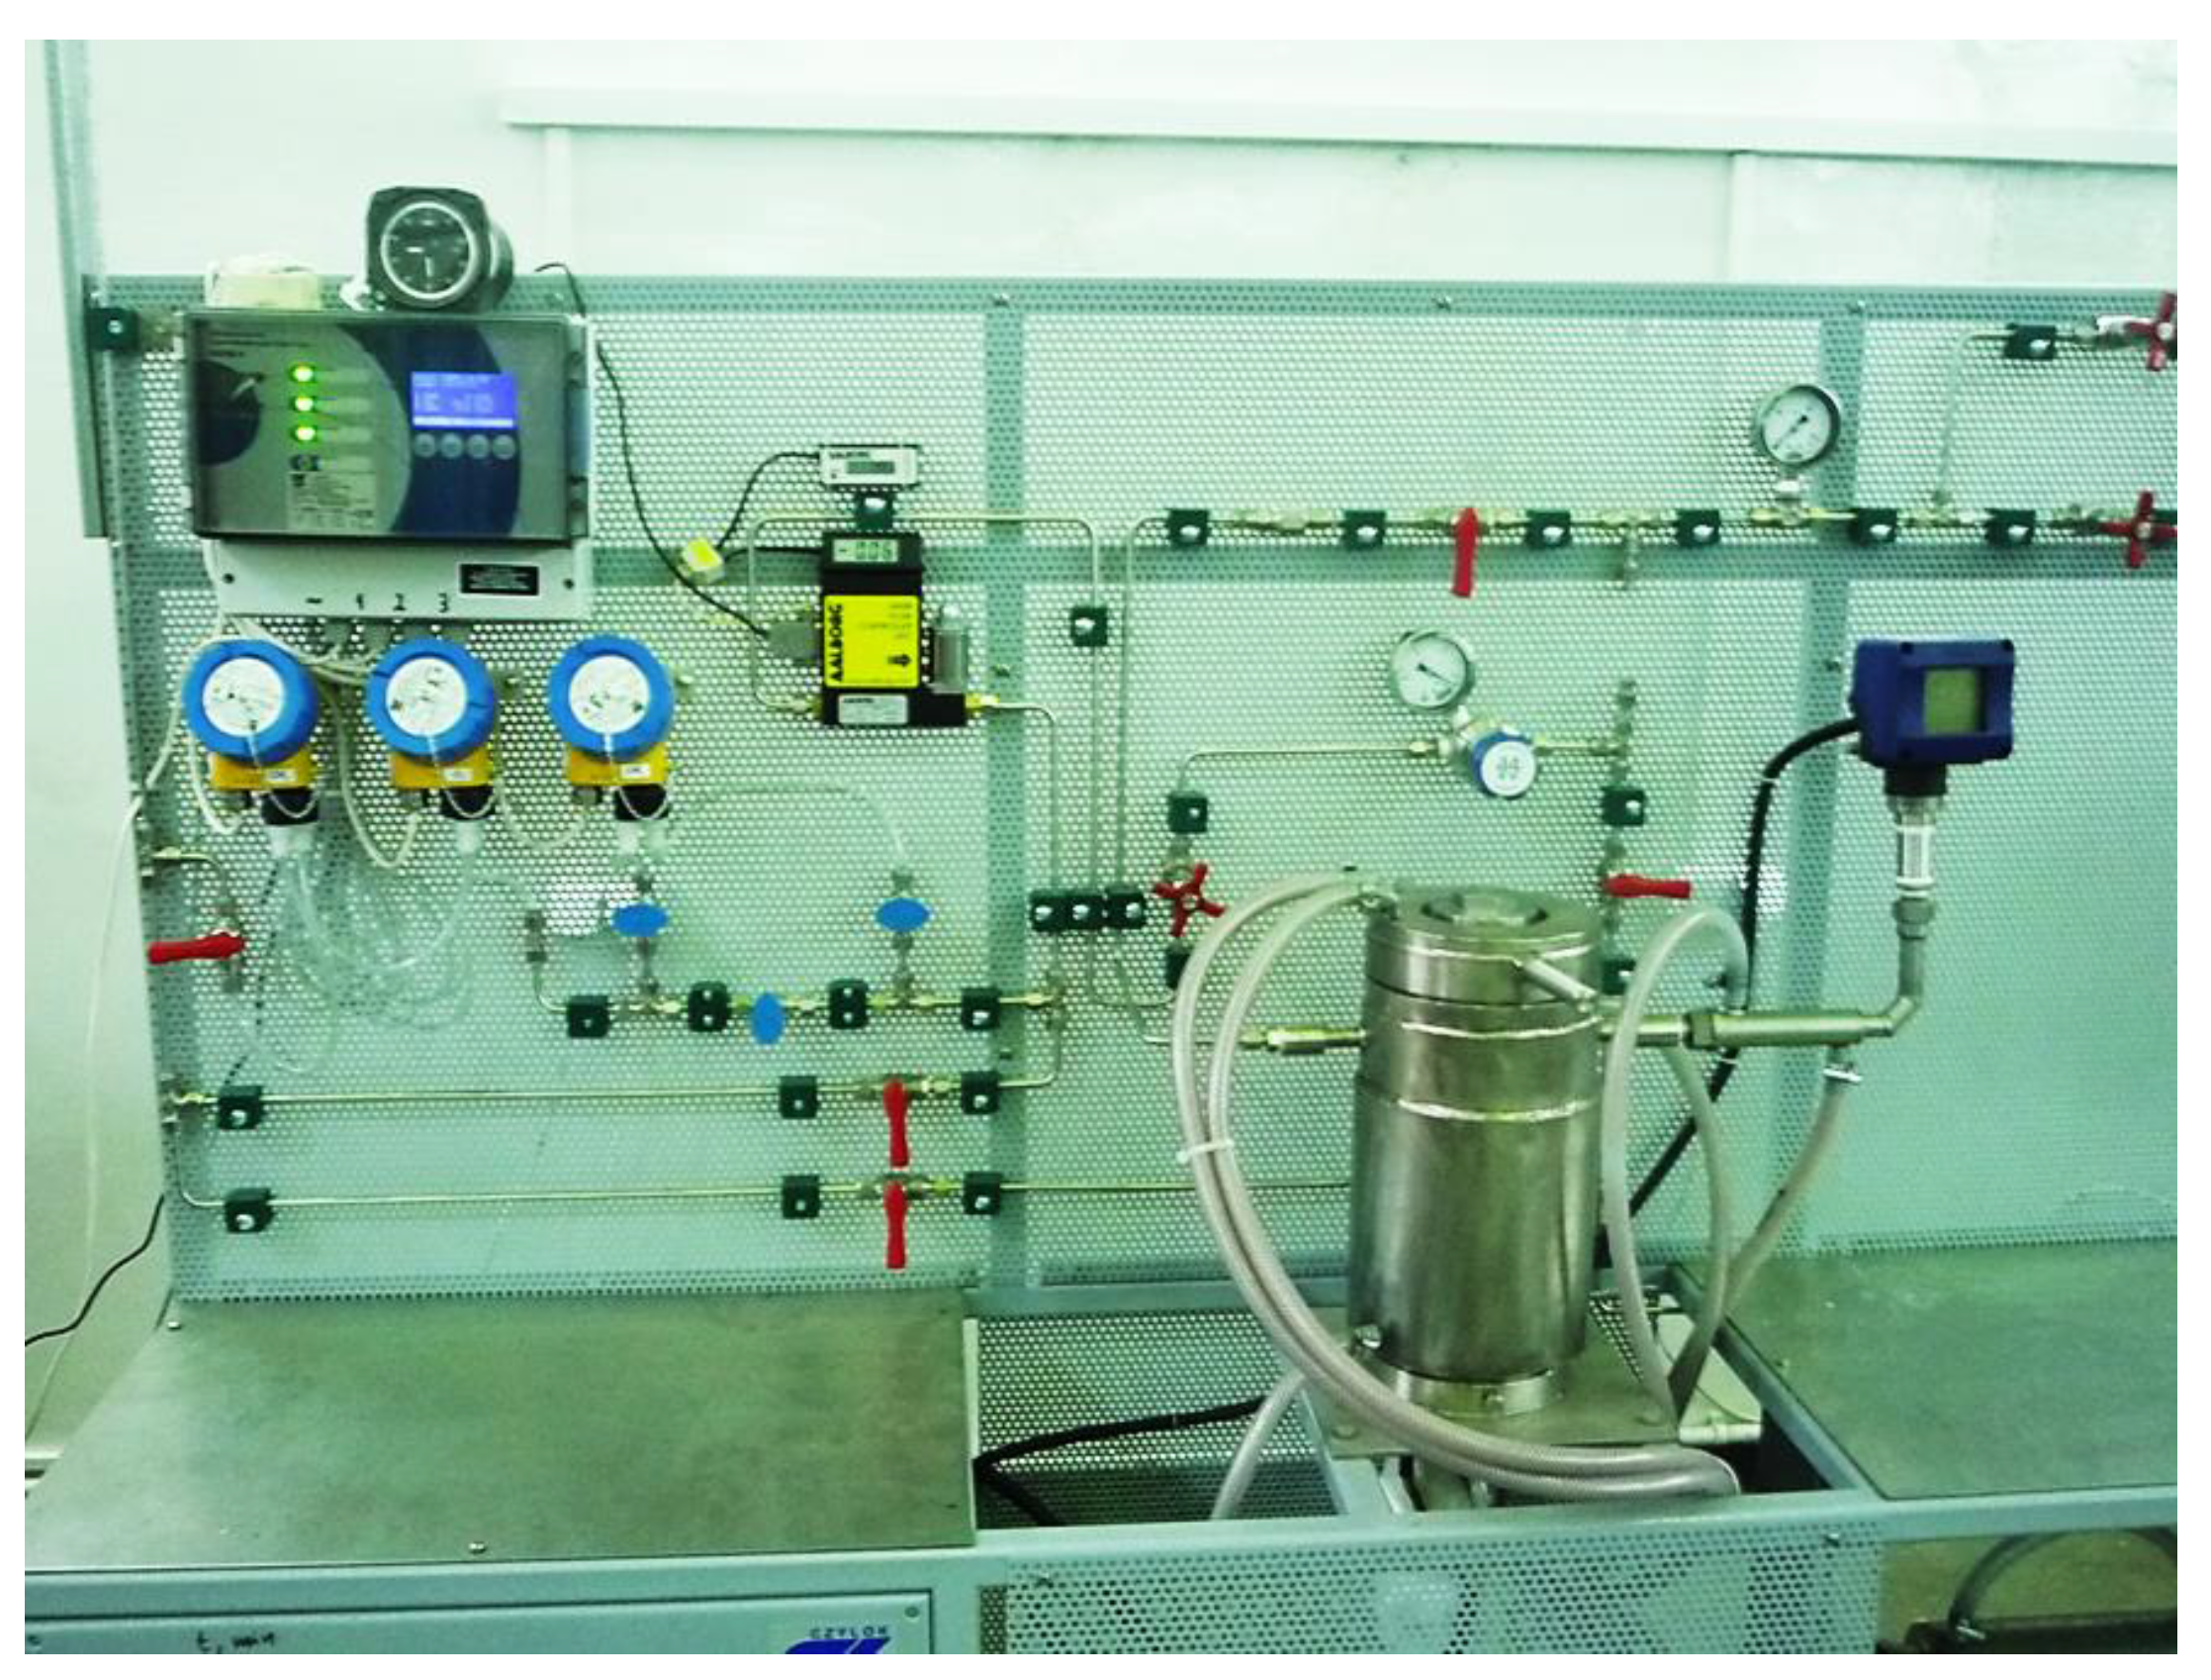
The purpose of this research is to investigate the hydrogasification reactivity of chars formed from Polish subbituminous coal, which is promising for gasification to produce methane due to its significant deposits in southern Poland. The dynamics of the procedure were investigated to determine the kinetic constants at the maximal rate of formation of methane by the heterogeneous reaction of solid carbon with hydrogen. In light of this research, we suggest a model for the hydrogasification rate’s speed that accounts for the variations in the porosity of the char and its inner surface, as well as its active centers. The experimental study focuses solely on the ongoing process and kinetics of hydrogasification. To achieve a more comprehensive understanding of the underlying processes, a CFD model was developed. The objective of the CFD model is to present the internal processes through temperature distribution and a vector representation of gas flow under specific operating temperature and pressure conditions. This highlights the significance of the reactor’s internal construction, which also influences the hydrogasification processes.
3. Experimental
The char was formed within 30 min of pyrolysis in helium at 2 MPa and 1373 K (heating rate: 100 K s
−1). The char samples were separated into a category of 0.6–1.0 mm-sized particles by sieving. Janina, a subbituminous coal obtained from Silesia, was used for the experiments; see
Table 4.
The initial properties of the Janina char (i.e., solid particle porosity, ε
0; internal specific surface area, A
0; real density, ρ
0; initial total active centers, C
f0; carbon content in the analytical state, C
a0 ) used for testing the mechanism and the kinetic constants are presented in
Table 5.
The experiments were conducted in accordance with the Janina coal hydrogasification schedule of 10 g of samples being subjected to 973 and 1073 K at a pressure of 8 MPa and at a hydrogen flow rate of 0.5 dmn3 min−1.
‘Janina’ coal samples weighing 10 g were used in the char hydrogasification assessments. The hydrogasification schedule involved trials for pressures of 6, 7, and 8 MPa with hydrogen flow rates of 0.5, 2, and 5 dmn3 min−1 at 973, 1073, and 1173 K.
The rate of the hydrogasification reaction was determined using the measured molar methane (CH
4) content. Given that H
2 was delivered into the reactor and that both H
2 and CH
4 are present in the observed molar gas stream
leaving the reactor, the rate of hydrogasification—which is equal to the rate of CH
4 production—was estimated as follows:
The quantity of carbon moles present in the reactor’s solid char at time
t equals:
where
is the initial quantity of carbon moles in the sample of char, and
nCH4(
t) is the quantity of moles of generated methane at time
t.
Carbon conversion
is defined as follows:
Considering the degree of carbon conversion, the particle porosity
ε(
t), internal specific surface area
A(
t), and total active centers
U(
t) can be determined. Based on Stanmore [
33], it was assumed that:
and
In the paper by Gil et al. [
32], other relationships were proposed and verified based on the experimental data reported in [
34]:
where
a is the matching constant for coals,
a = 1 ± 0.05. For active carbons, coals, and coal chars with high microporosity and anthracites, the suggested matching constant values are lower by approximately 40%.
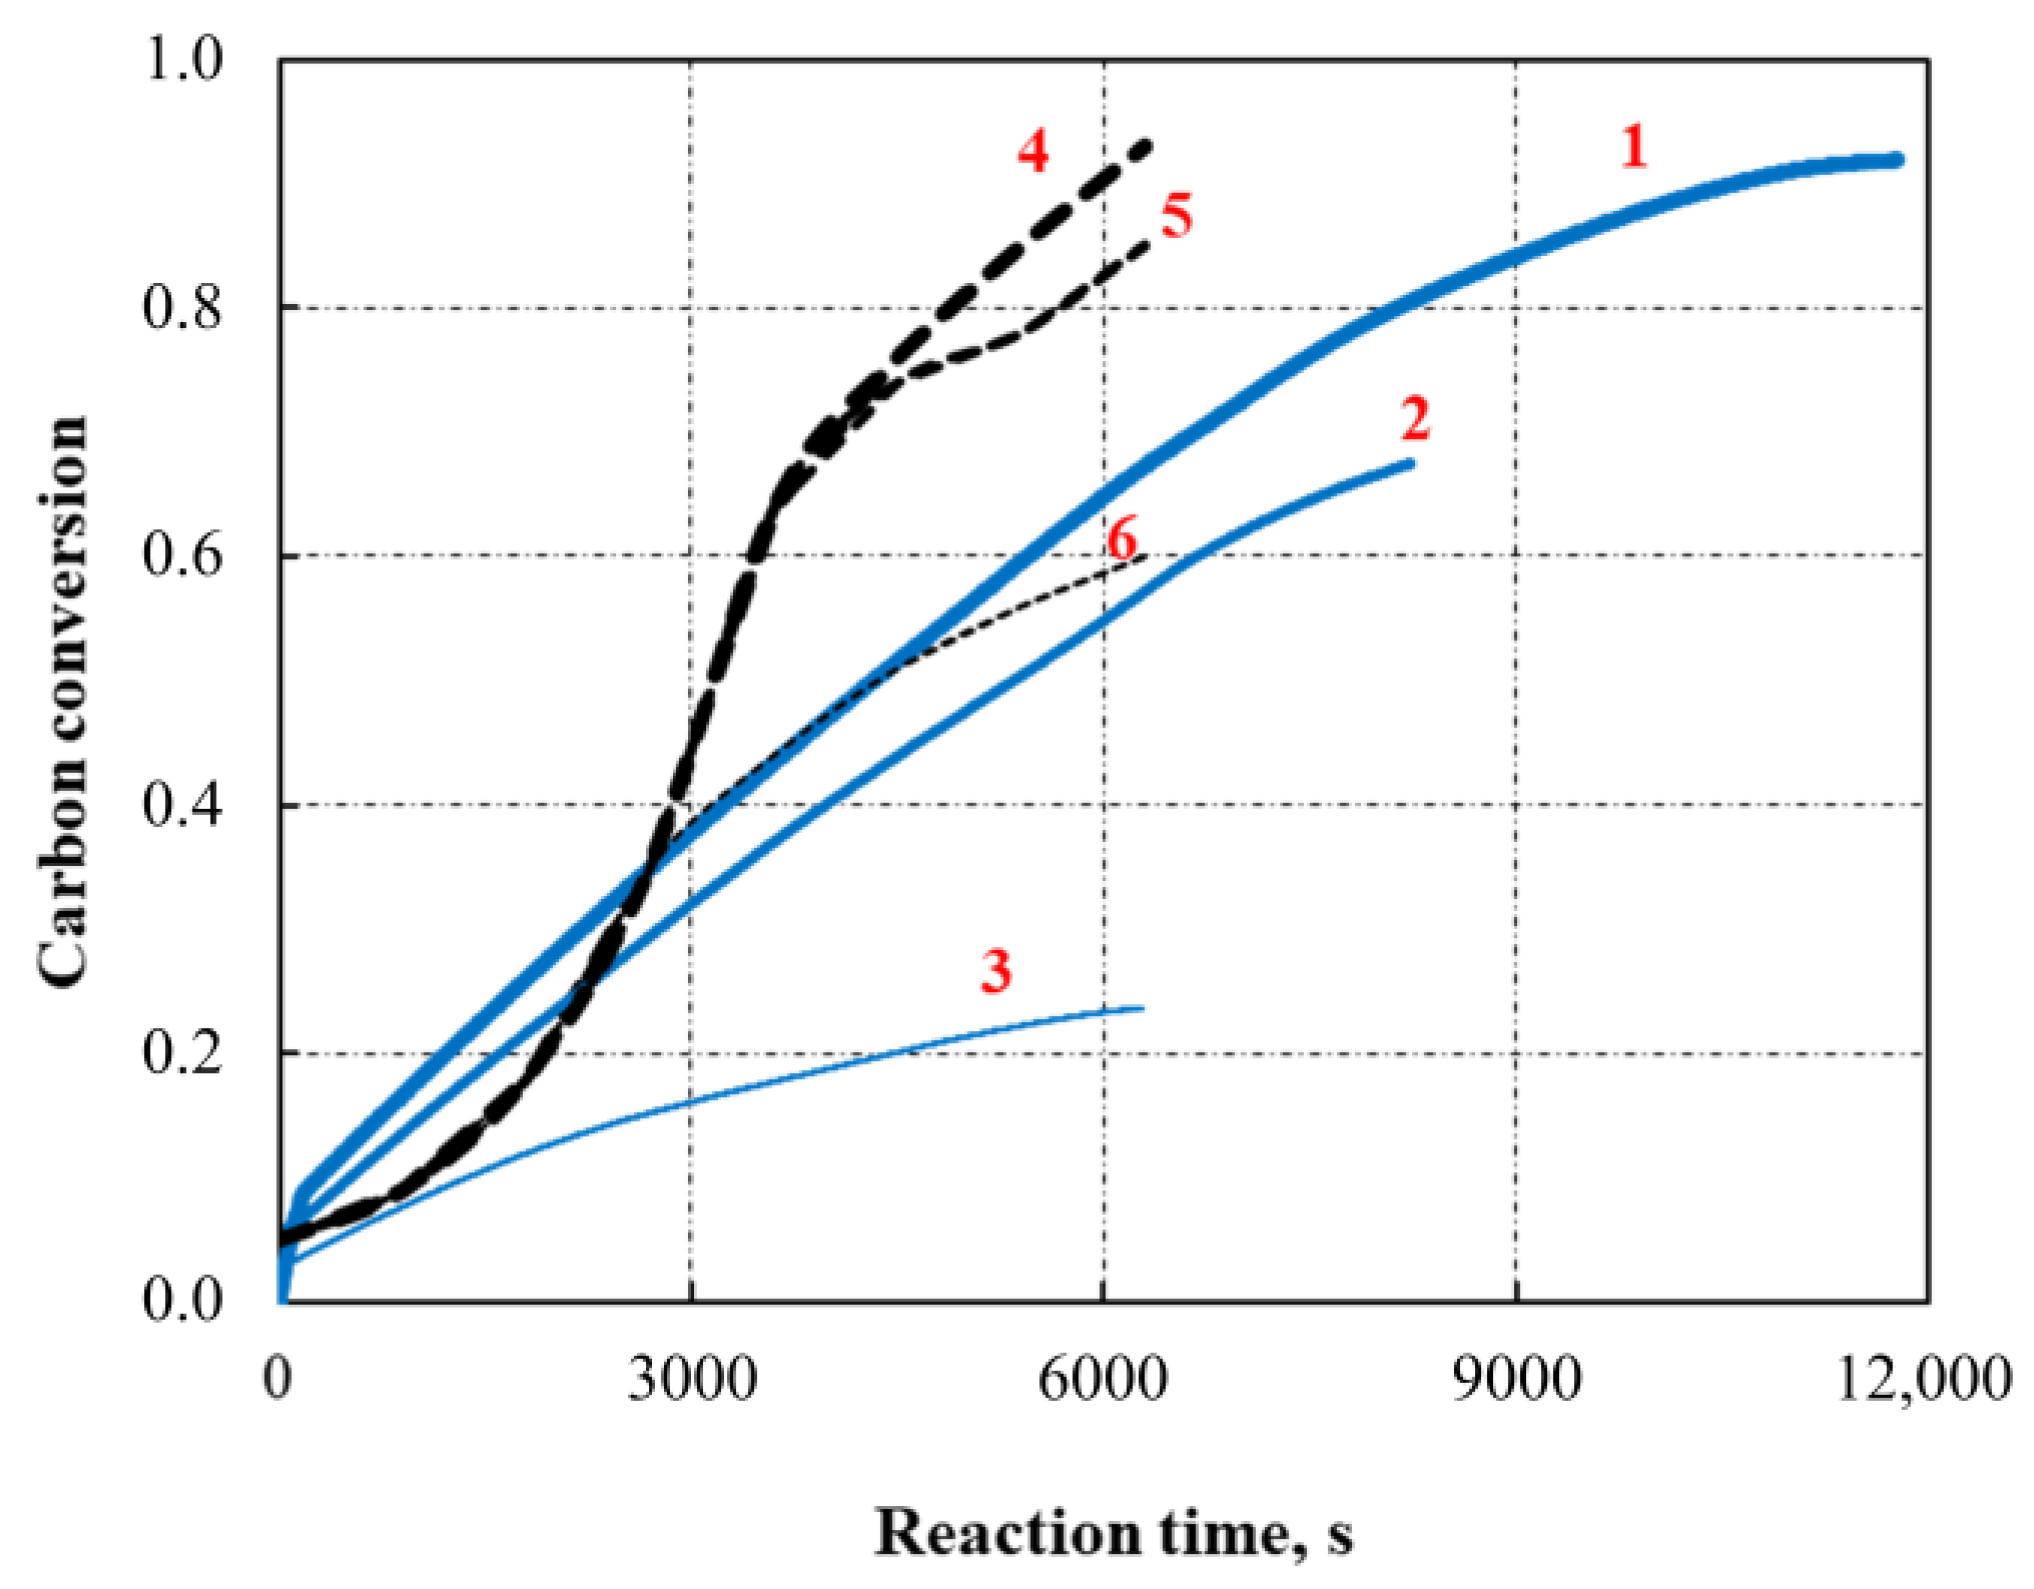
Figure 8 shows how the hydrogasification isothermal stage temperatures (973, 1073, and 1173 K) at 6 MPa affect the rate of conversion of char for the Janina char.
The results were contrasted with those reported by Ding et al. [
35] for the ‘Inner Mongolia Semicoke’ under the same conditions and at 5 MPa. The highest conversion rate for the Janina char was similar to that reported by Ding et al., while it was lower by 18% at 1173 K.
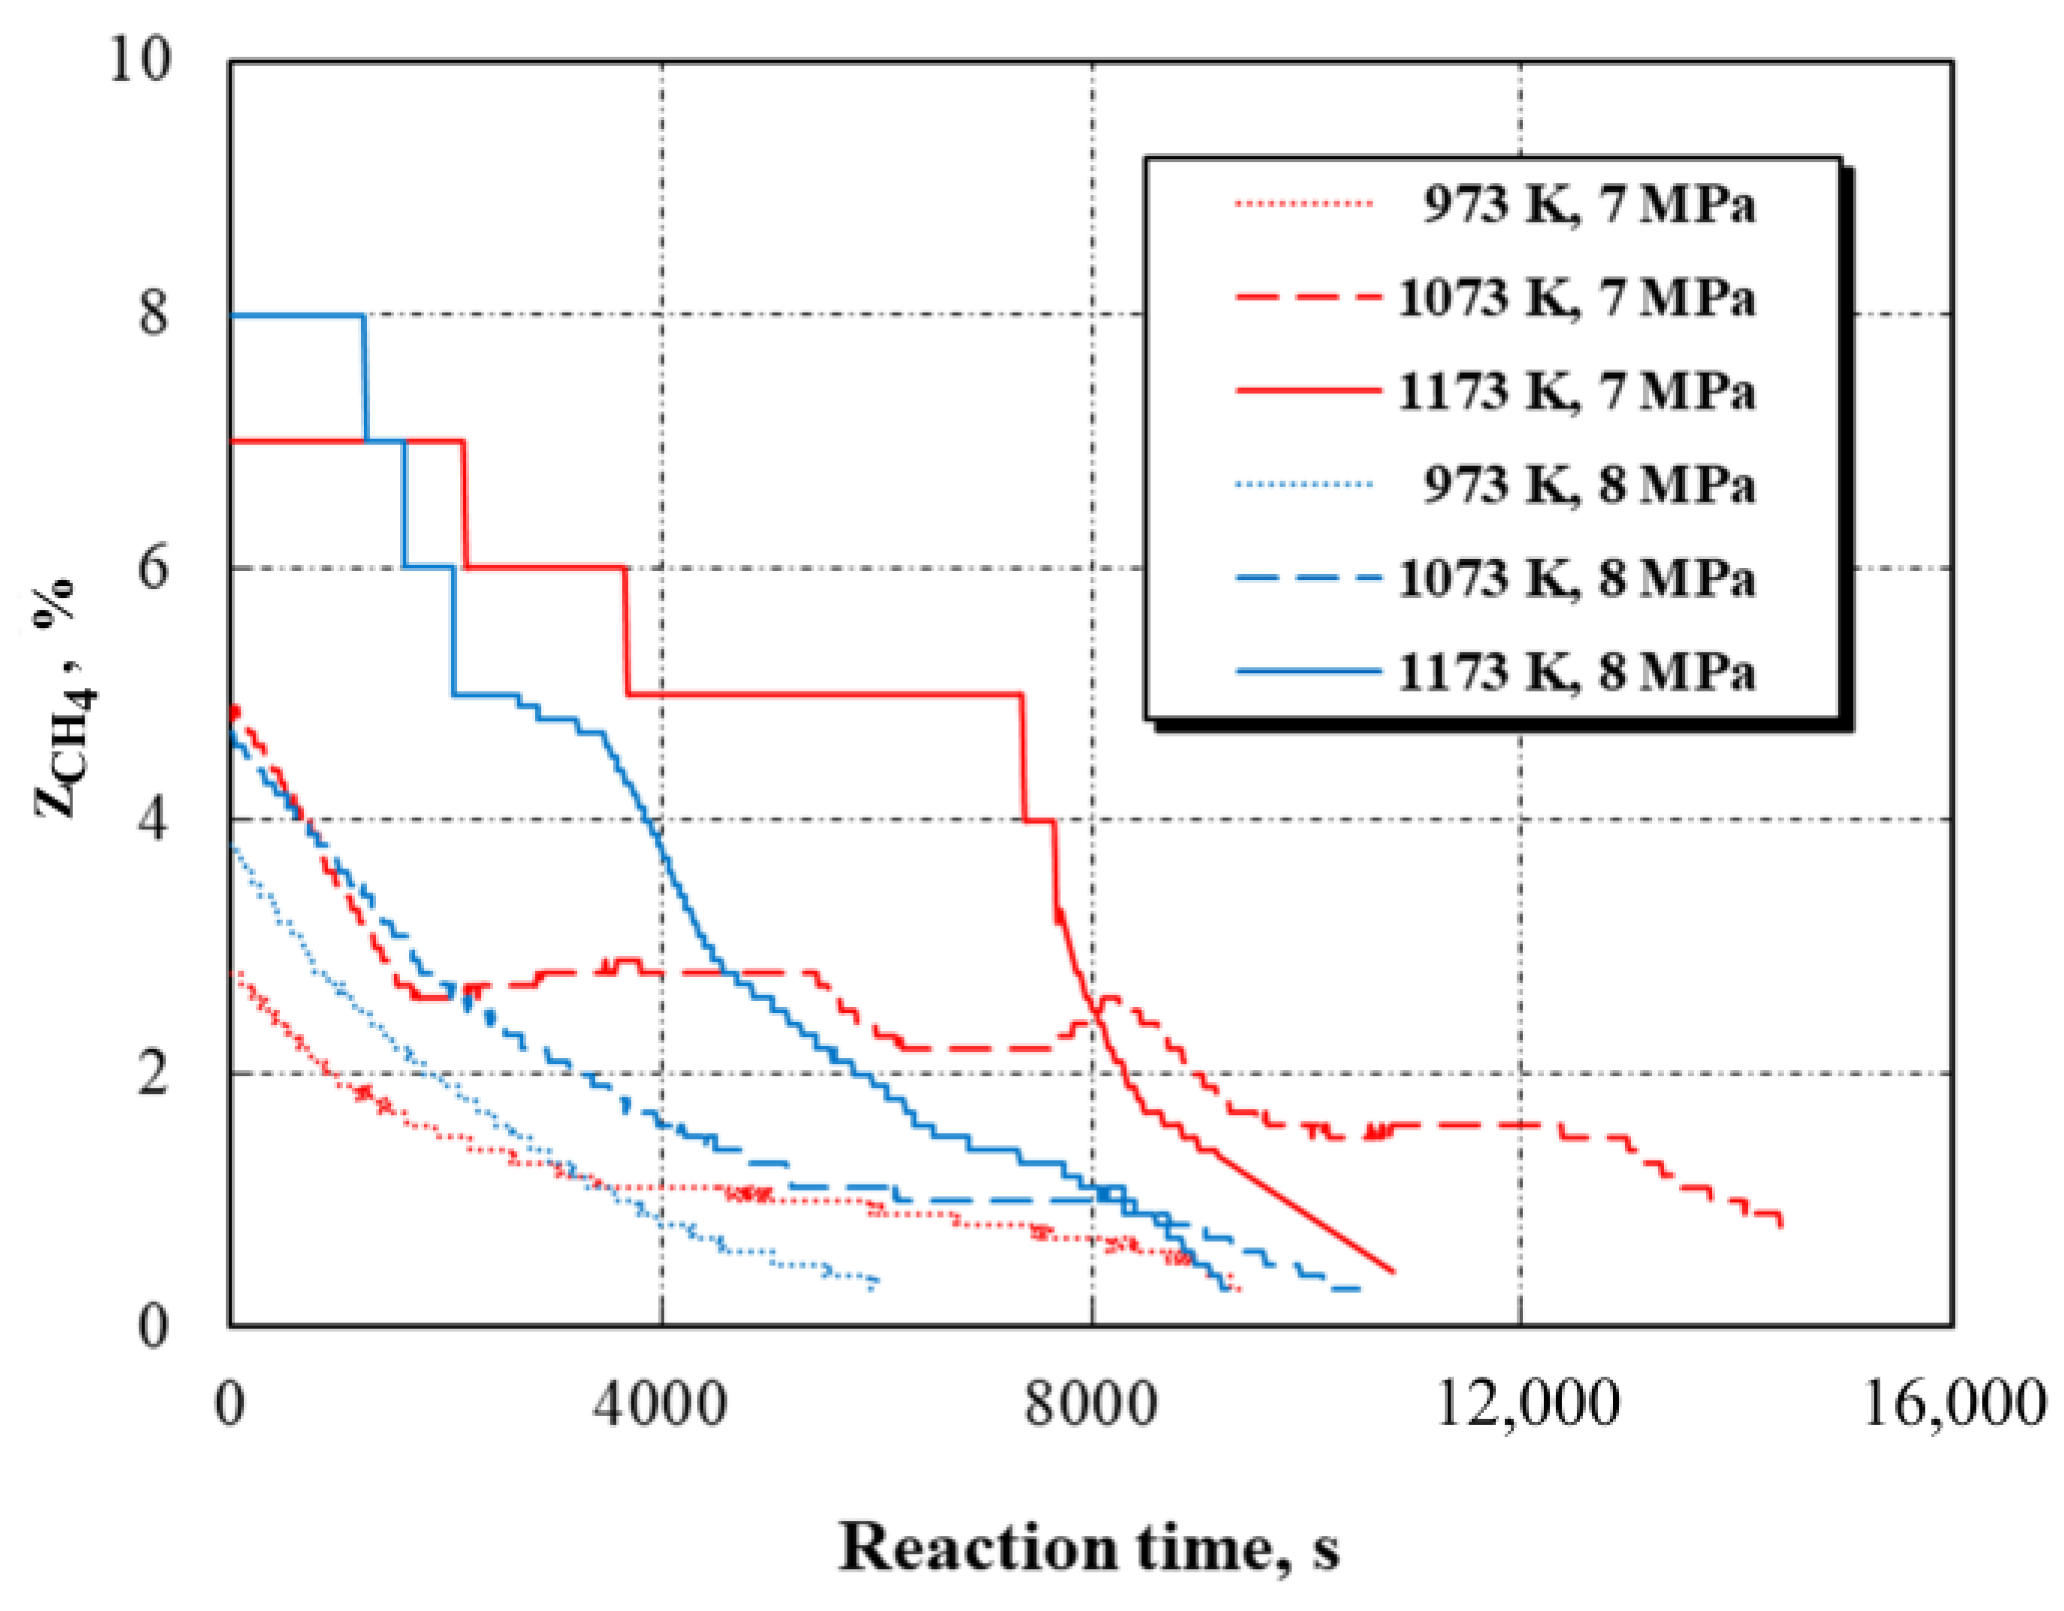
Figure 9 shows the measured CH
4 molar concentration at the reactor outflow for three different hydrogasification temperatures: 973, 1073, and 1173 K, as well as two different reaction pressure values: 7 and 8 MPa.
All three of the cases were equal in terms of the original char sample mass. The amount of methane in the resultant gas exiting the reactor is higher because a greater reaction pressure increases the production of methane.
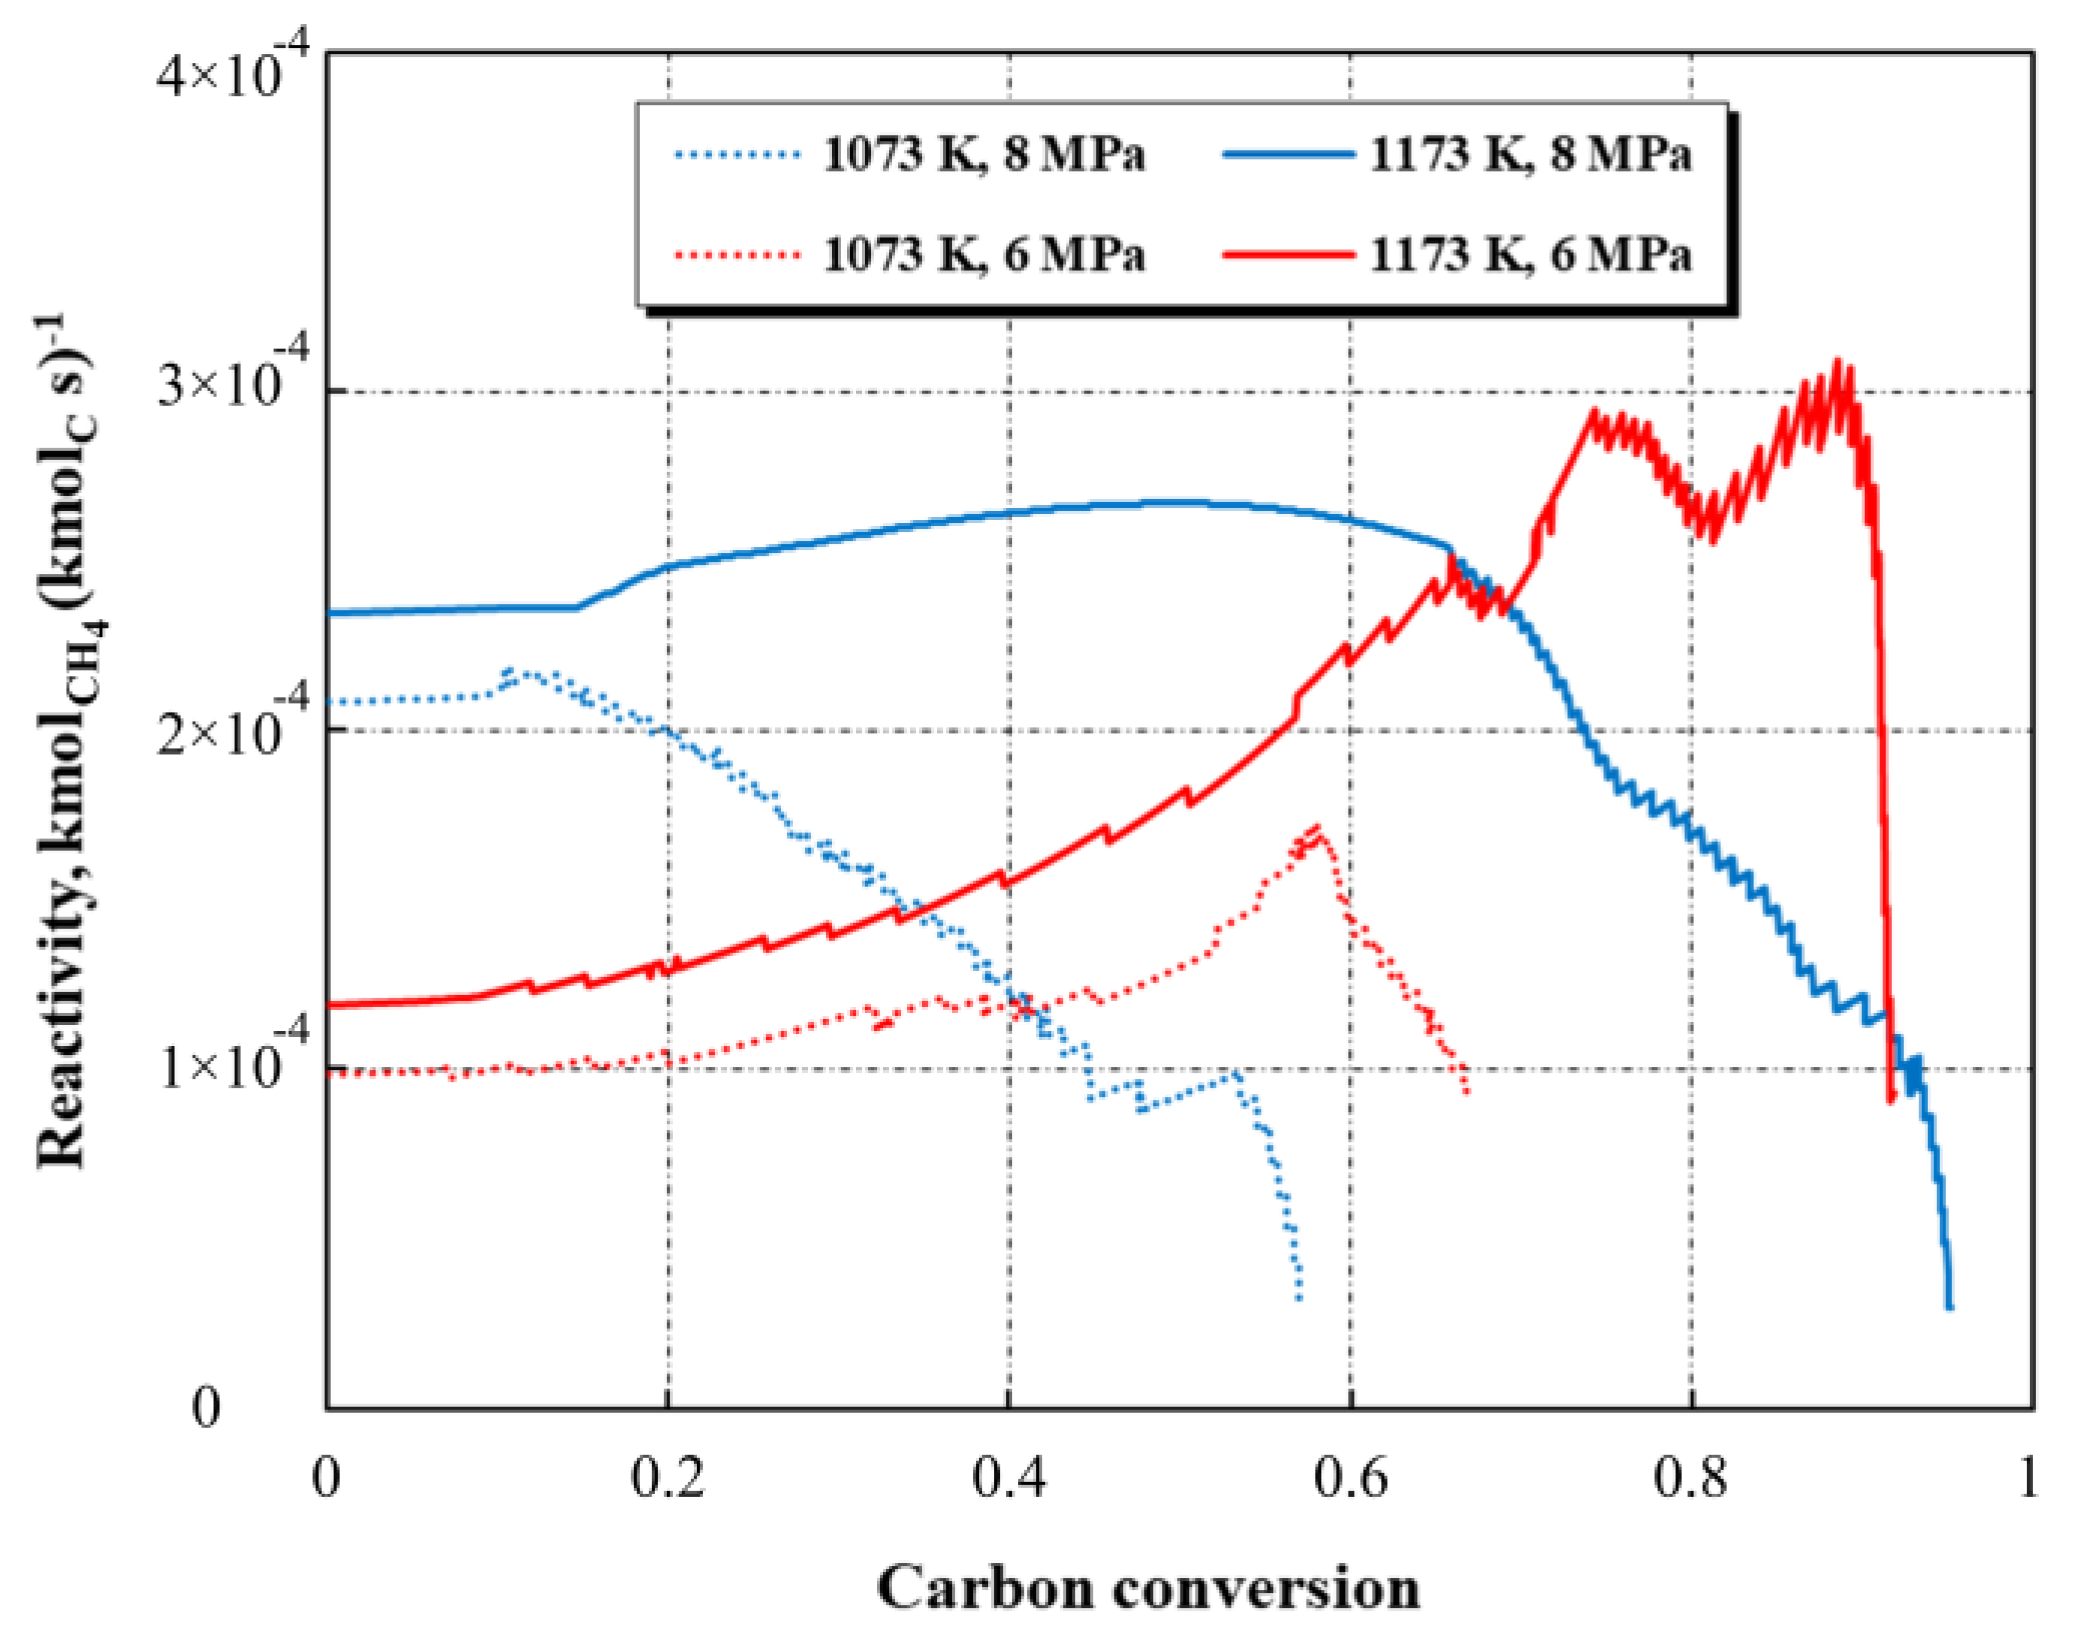
Figure 10 shows the computed char reactivity for two temperature values, 1073 K and 1173 K, which is defined as the ratio
, and the hydrogasification pressure of 7 MPa and 8 MPa as a function of carbon conversion determined by the ratio
U(
t). When the C conversion exceeds 60% or 80%, respectively, for 1073 K and especially for 1173 K, the reactivity rapidly decreases. This implies that a temperature of roughly 1200 K needs to be maintained in order to achieve a significant amount of C conversion during char hydrogasification.
4. Kinetics of Char Hydrogasification
For chars, the role of the active center may be attributed to the marginal carbon atoms in the coal structure, dislocations, infinite inclusions, or oxygen or hydrogen groups.
The development of the kinetic relationships in the char particle-gas reaction requires the analysis of elementary phenomena on the solid-gas surface, which is possible based on the theory of active centers. Porous char particles react with gas on the external surface and inside the pore structure. Active centers formed by irregularities in the particle surface trigger gas-solid bonding or adsorption. Reactant adsorption, intermediate migration, and product desorption may occur in any active center. As a result of the reactant
X adsorption, the free active centers become the occupied centers
C(
X). In his later paper on the hydrogasification process within the range of 923 K to 1143 K, Blackwood [
17] discusses the mechanism, which is expanded by two further reactions:
when this mechanism is simplified and only involves reactions (3) and (4), simple relationships determining the gasification rate expressed in moles of solid carbon proceeding to the solid phase as methane can be obtained. The presence of the reactions (20) and (21) is justified by the fact that the reaction between the carbonate and atomic hydrogen also leads to methane production. The rate of solid methane formation is described by Equations (5) and (6). Assuming that reaction (4) controls the hydrogasification mechanism and reaction (3) is in an equilibrium state, Equation (5) may be presented as follows:
when
C(H
2) in Equation (6) is expressed by [
Cf] from Equation (22), the hydrogasification rate is described as:
Equation (23) describes the rate of
C gasification (mol
C s
−1) as equal to the rate of methane production (mol
CH4 s
−1). For a constant number of free active centers [
Cf] per unit of
C mass in the char particle, the final kinetic equation may be defined as follows:
where
A(
T) = [
Cf]
k6f(
k3fk3b−1) and
B(
T) = [
Cf]
k6b are experimentally determined kinetic constants. However, it is highly possible that the total number of active centers [
Ct] = [
Cf] + [
C(H
2)] per unit of
C mass is constant. Using the total number of active centers in Equation (22) and substituting [
Ct] for [
Cf] and [
C(H
2)], the rate of hydrogasification can be presented as:
and its final form:
The coefficients of hydrogasification rate
C(
T) = [
Ct]
k4f(
k3f k3b−1)
−1,
D(
T) = [
Ct]
k4b, and
E(
T) =
k3f k3b−1 were determined based on experiments conducted at various hydrogen pressures and process temperatures. The number of generated methane moles was determined based on the equation:
while the number of carbon moles in the sample at time
t is determined by the Equation (13).
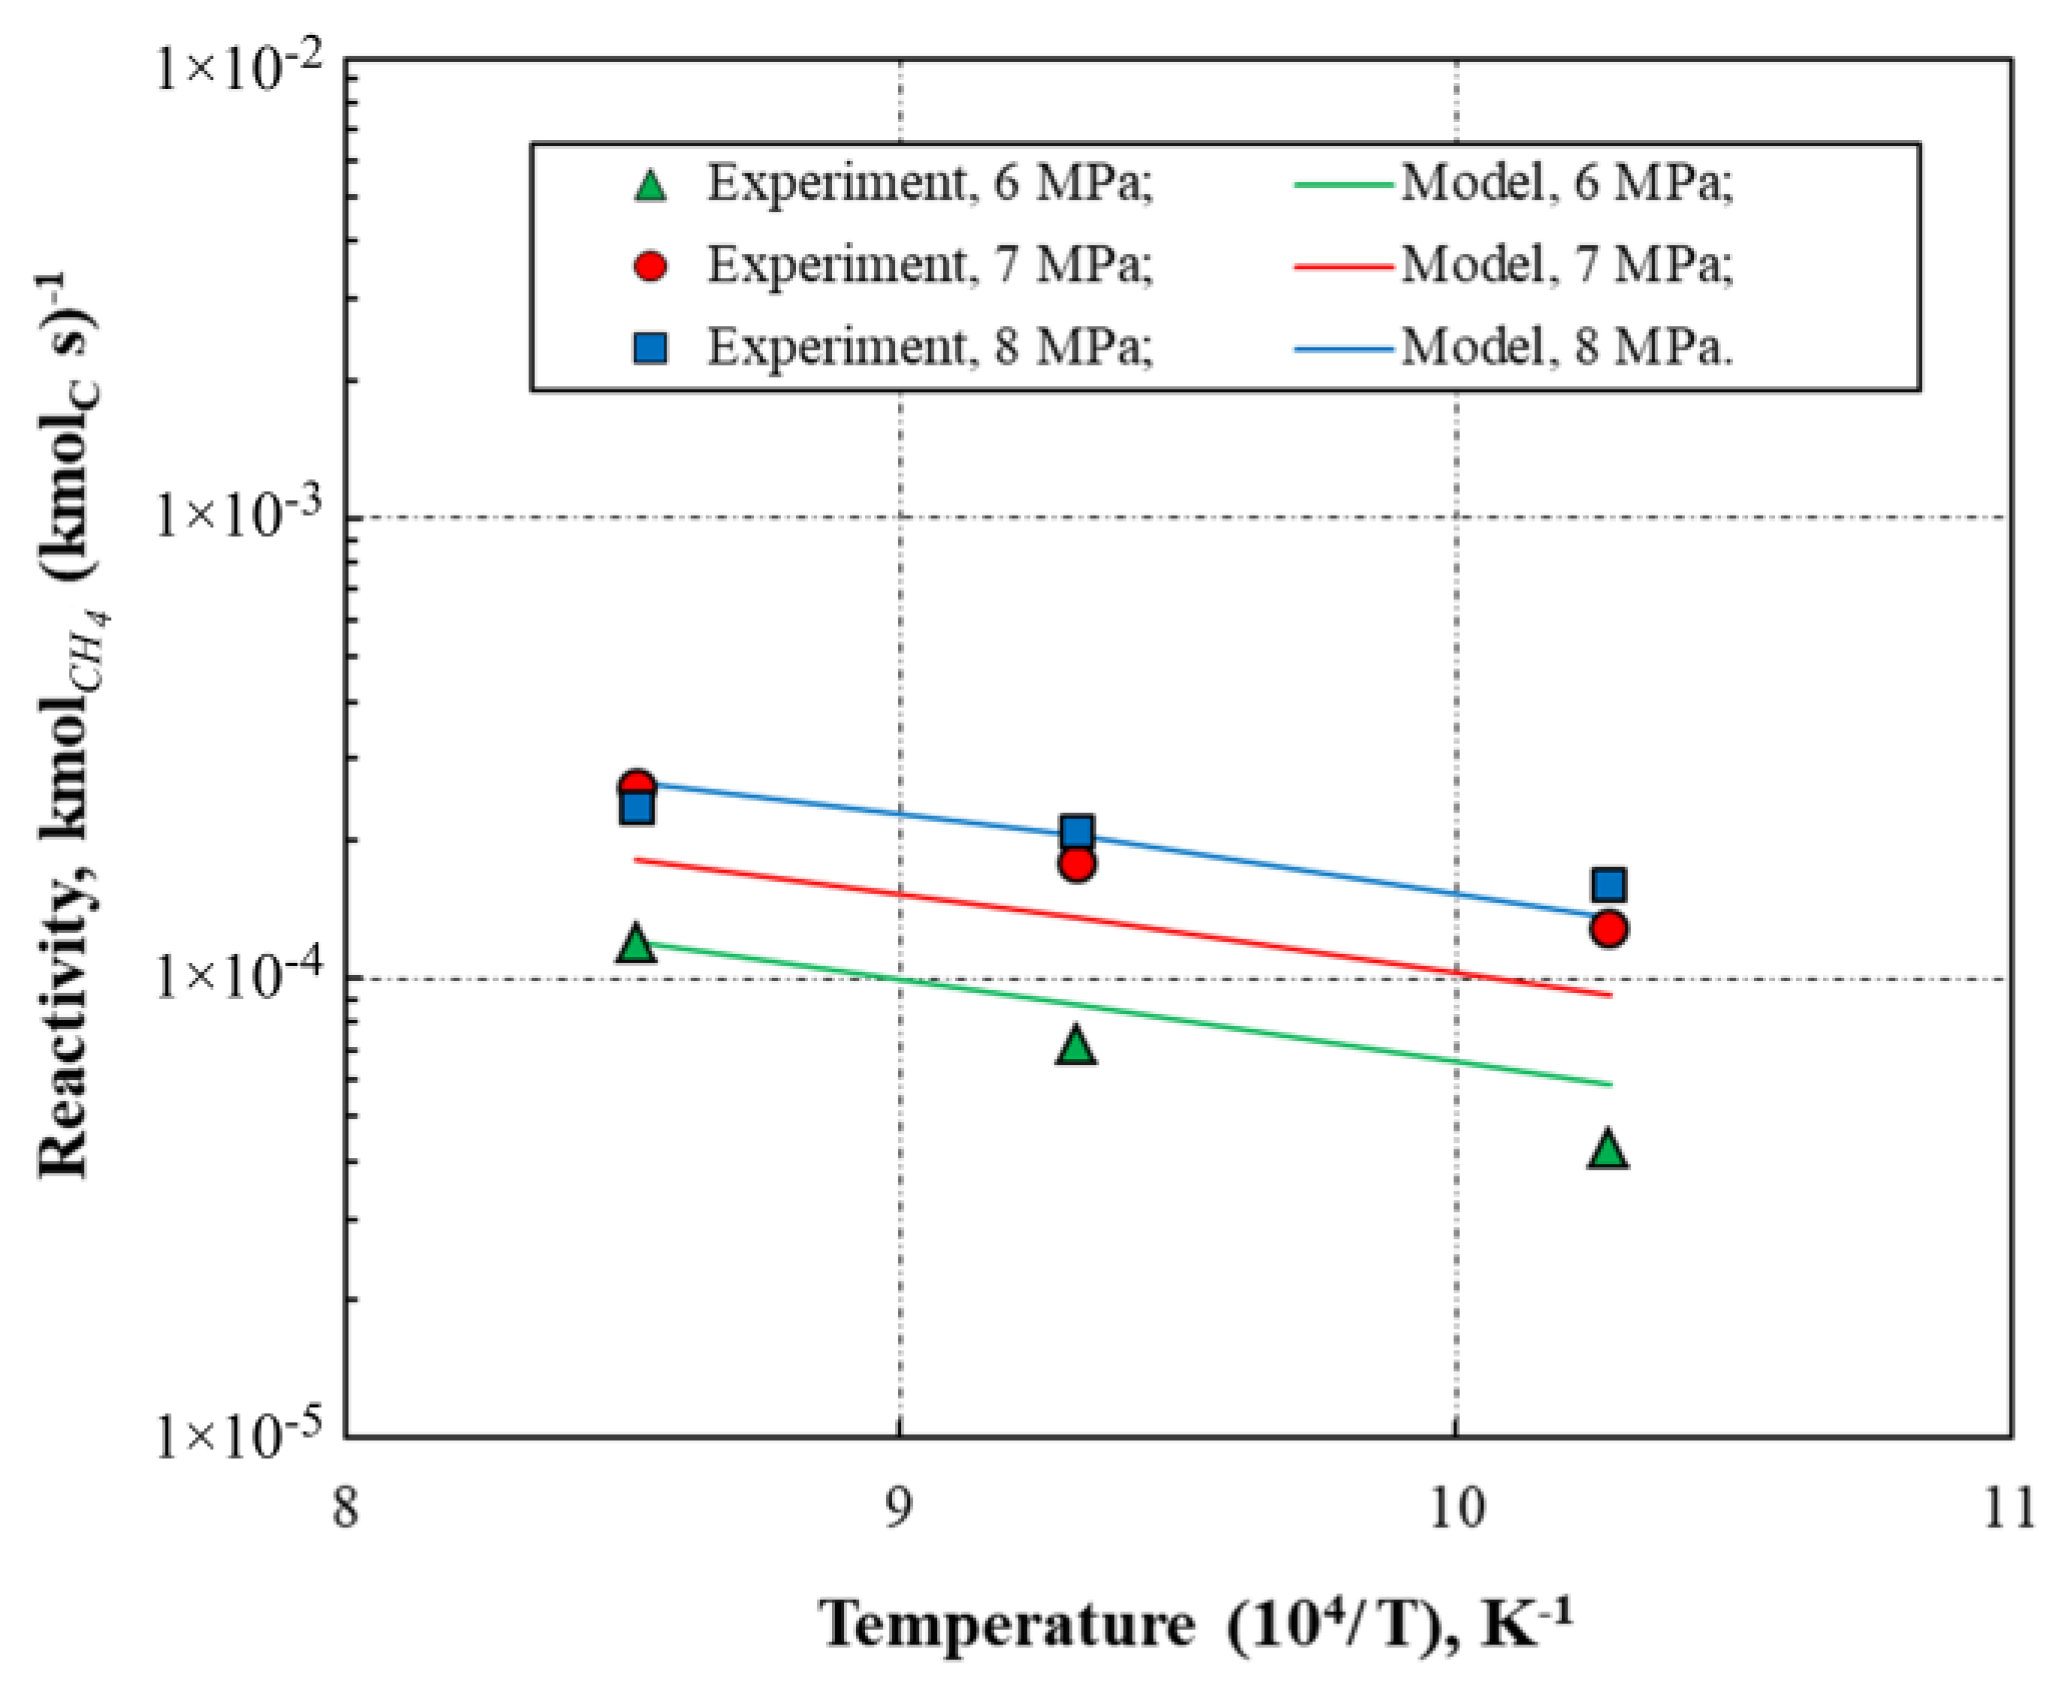
For the above model, an algorithm for computer calculation was developed to enable the determination of the kinetic constants. Based on the results of a series of experiments, the kinetic constants of gaseous hydrogasification product formation were determined using the values at the points of maximum process reactivity. The kinetic constants for Janina coal char from the paper by Tomeczek and Gil [
31] (see
Table 6) were used to determine correlations for the Equation (26) presented in
Figure 11.
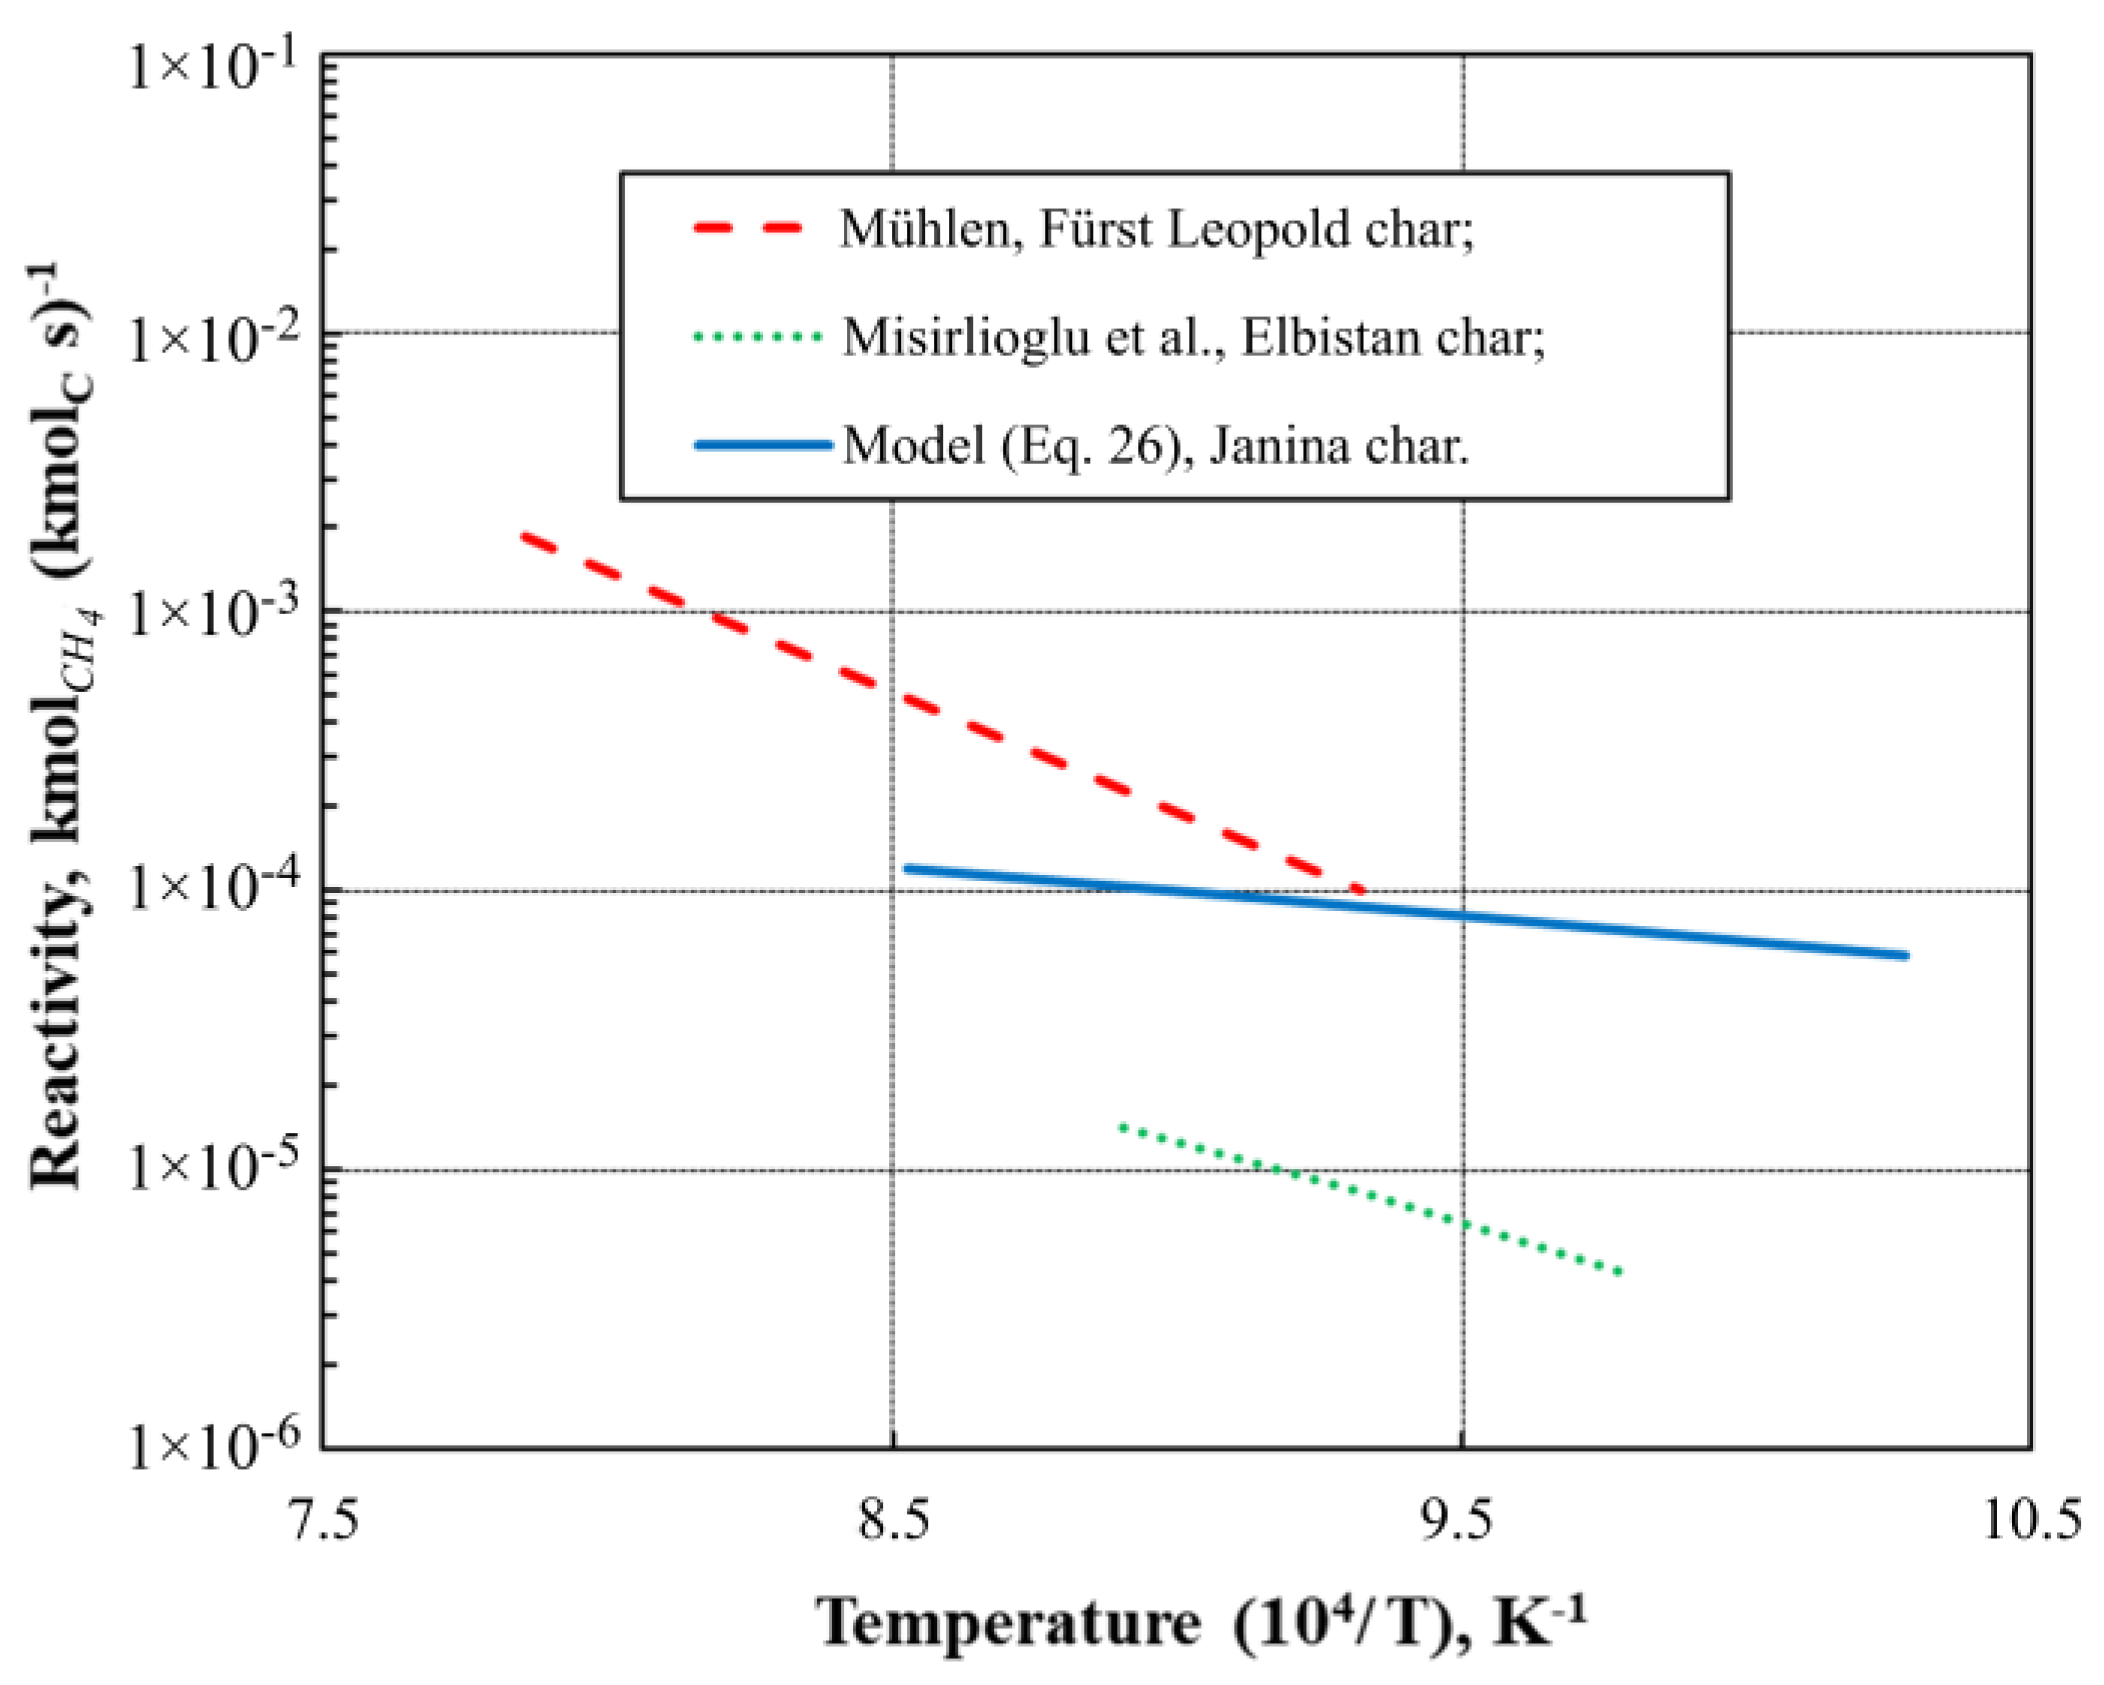
A contrast of the kinetic Equation (26) is shown in
Figure 12 formulated for the Janina char (
pH2 = 6 MPa,
pCH4 = 0 MPa) with data from two sources in the literature: Mühlen [
20], Fürst Leopold char,
pH2 = 6 MPa,
pCH4 = 0 MPa, and Misirlioglu et al. [
4], Elbistan char,
pH2 = 2.5 MPa,
pCH4 = 0 MPa. The reactivity values for the investigated Janina char are similar to those computed by Mühlen [
20] for the ‘Fürst Leopold’ char, also for conversion
U=O, and they surpass the values reported for the “Elbistan” char [
14] by more than one order of magnitude. In comparison to the other shown chars, the ‘Fürst Leopold’ char exhibits a significantly higher activation energy for the overall process C + 2H
2 ⇄ CH
4.
5. Discussion of the Results
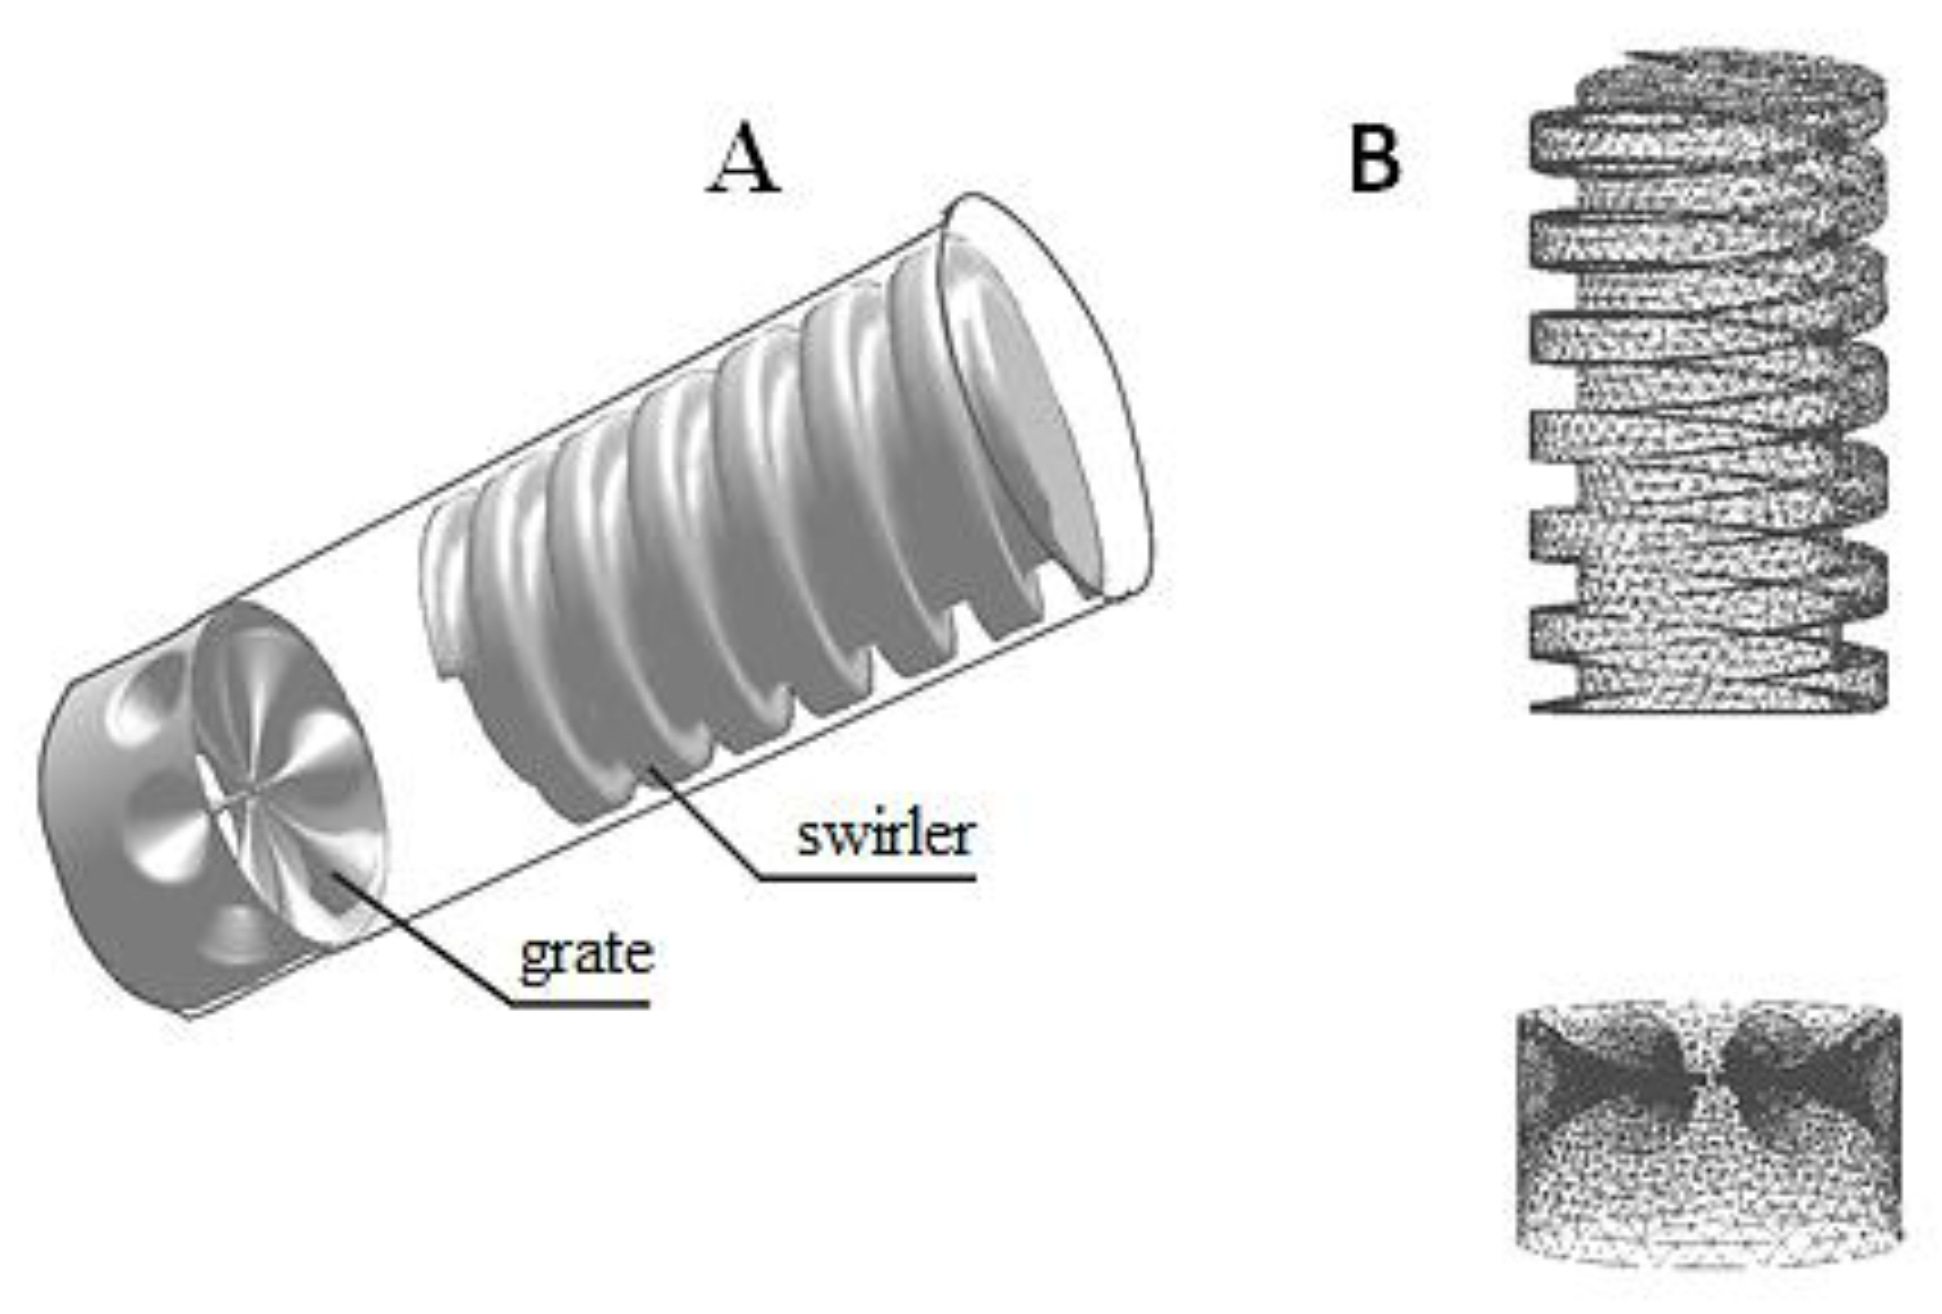
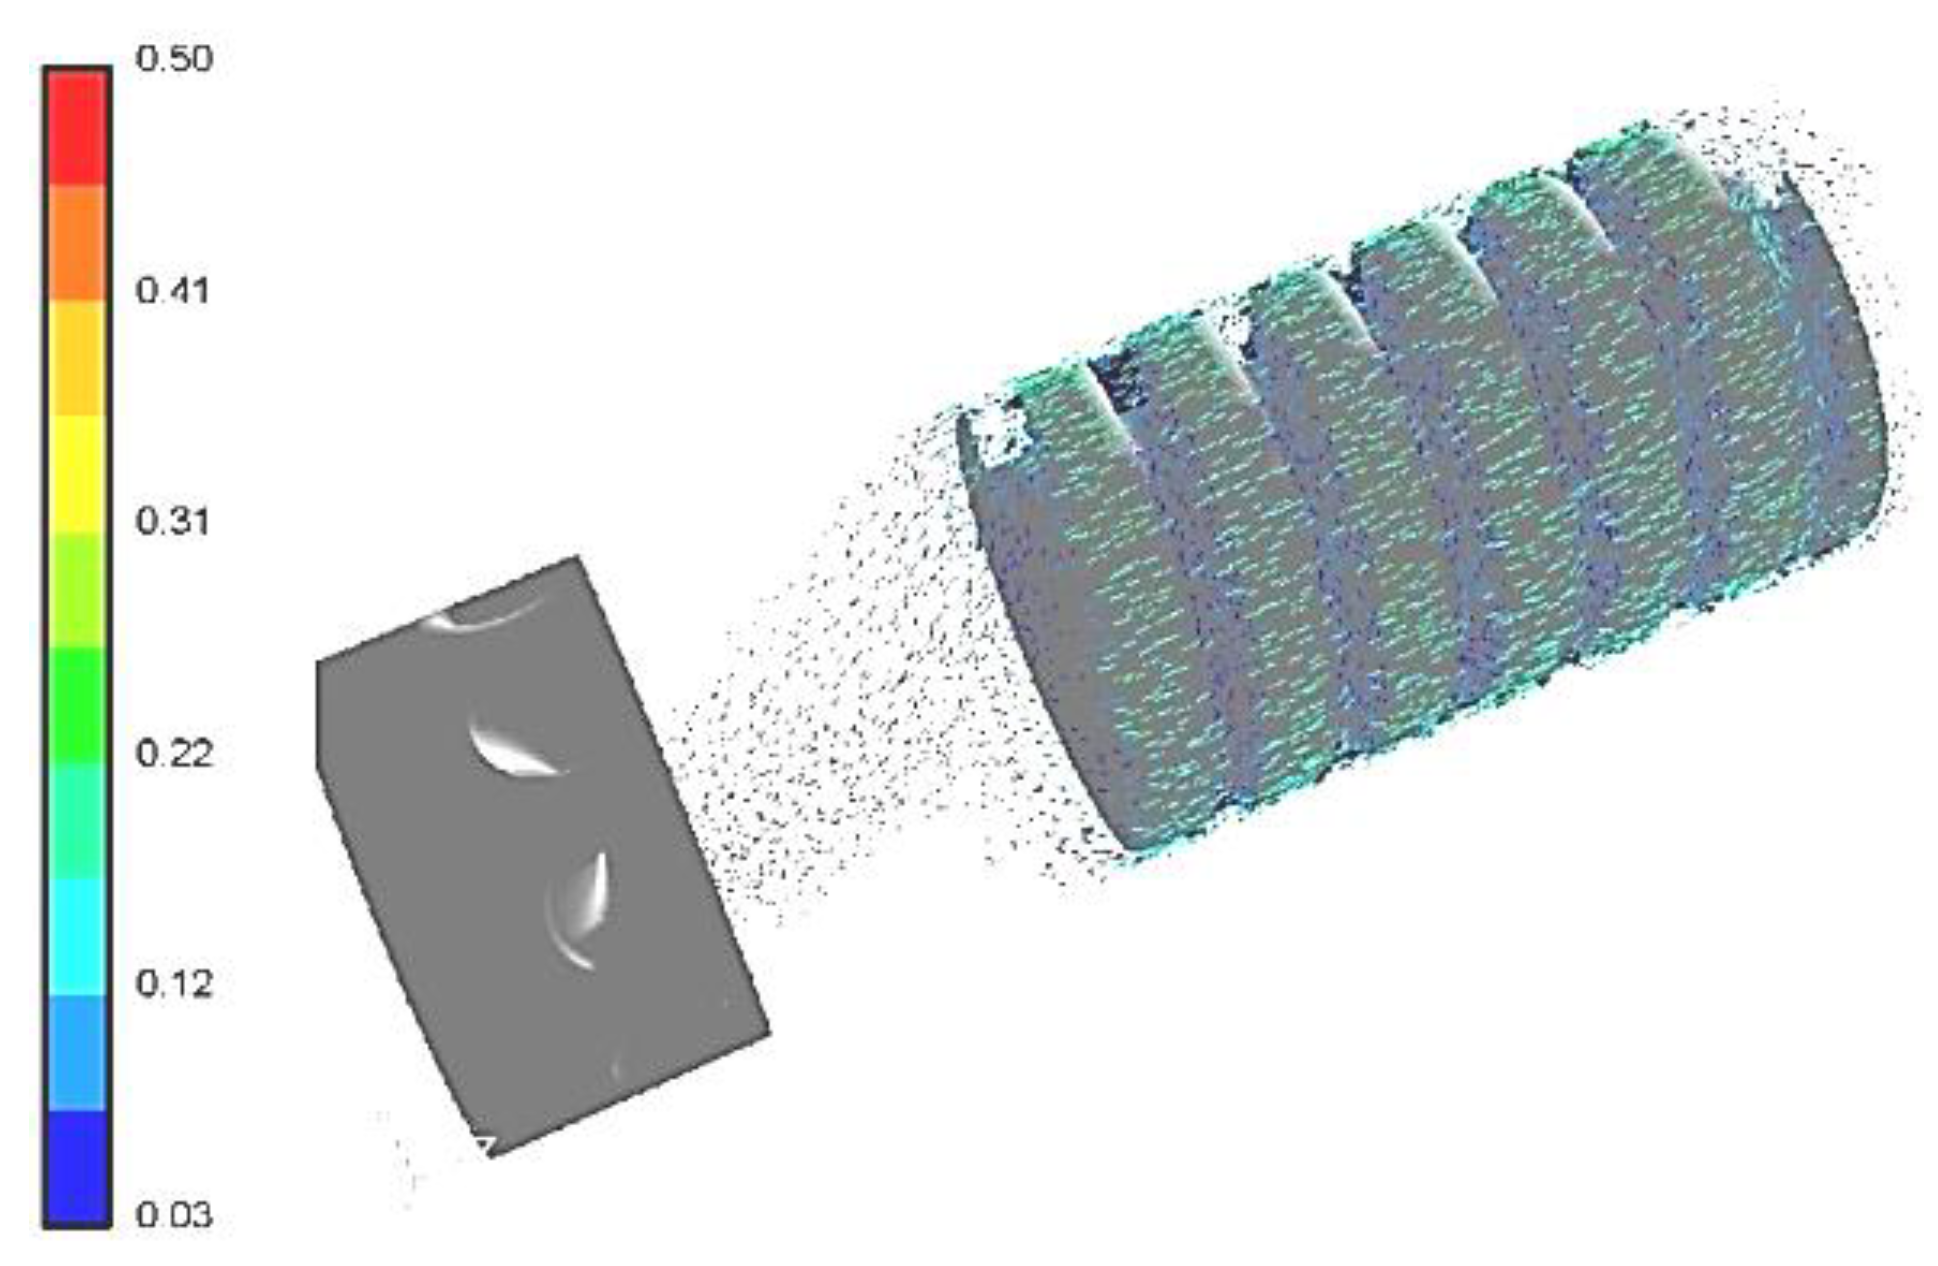
Figure 5 shows the velocity vectors of the hydrogen stream flowing through the swirl system (operating temperature
T = 973 K and operating pressure
p = 6 MPa). The obtained speeds ranged from 0.1 to 0.3 m s
−1. Values in the upper range occur most often between the swirl insert and the reactor wall.
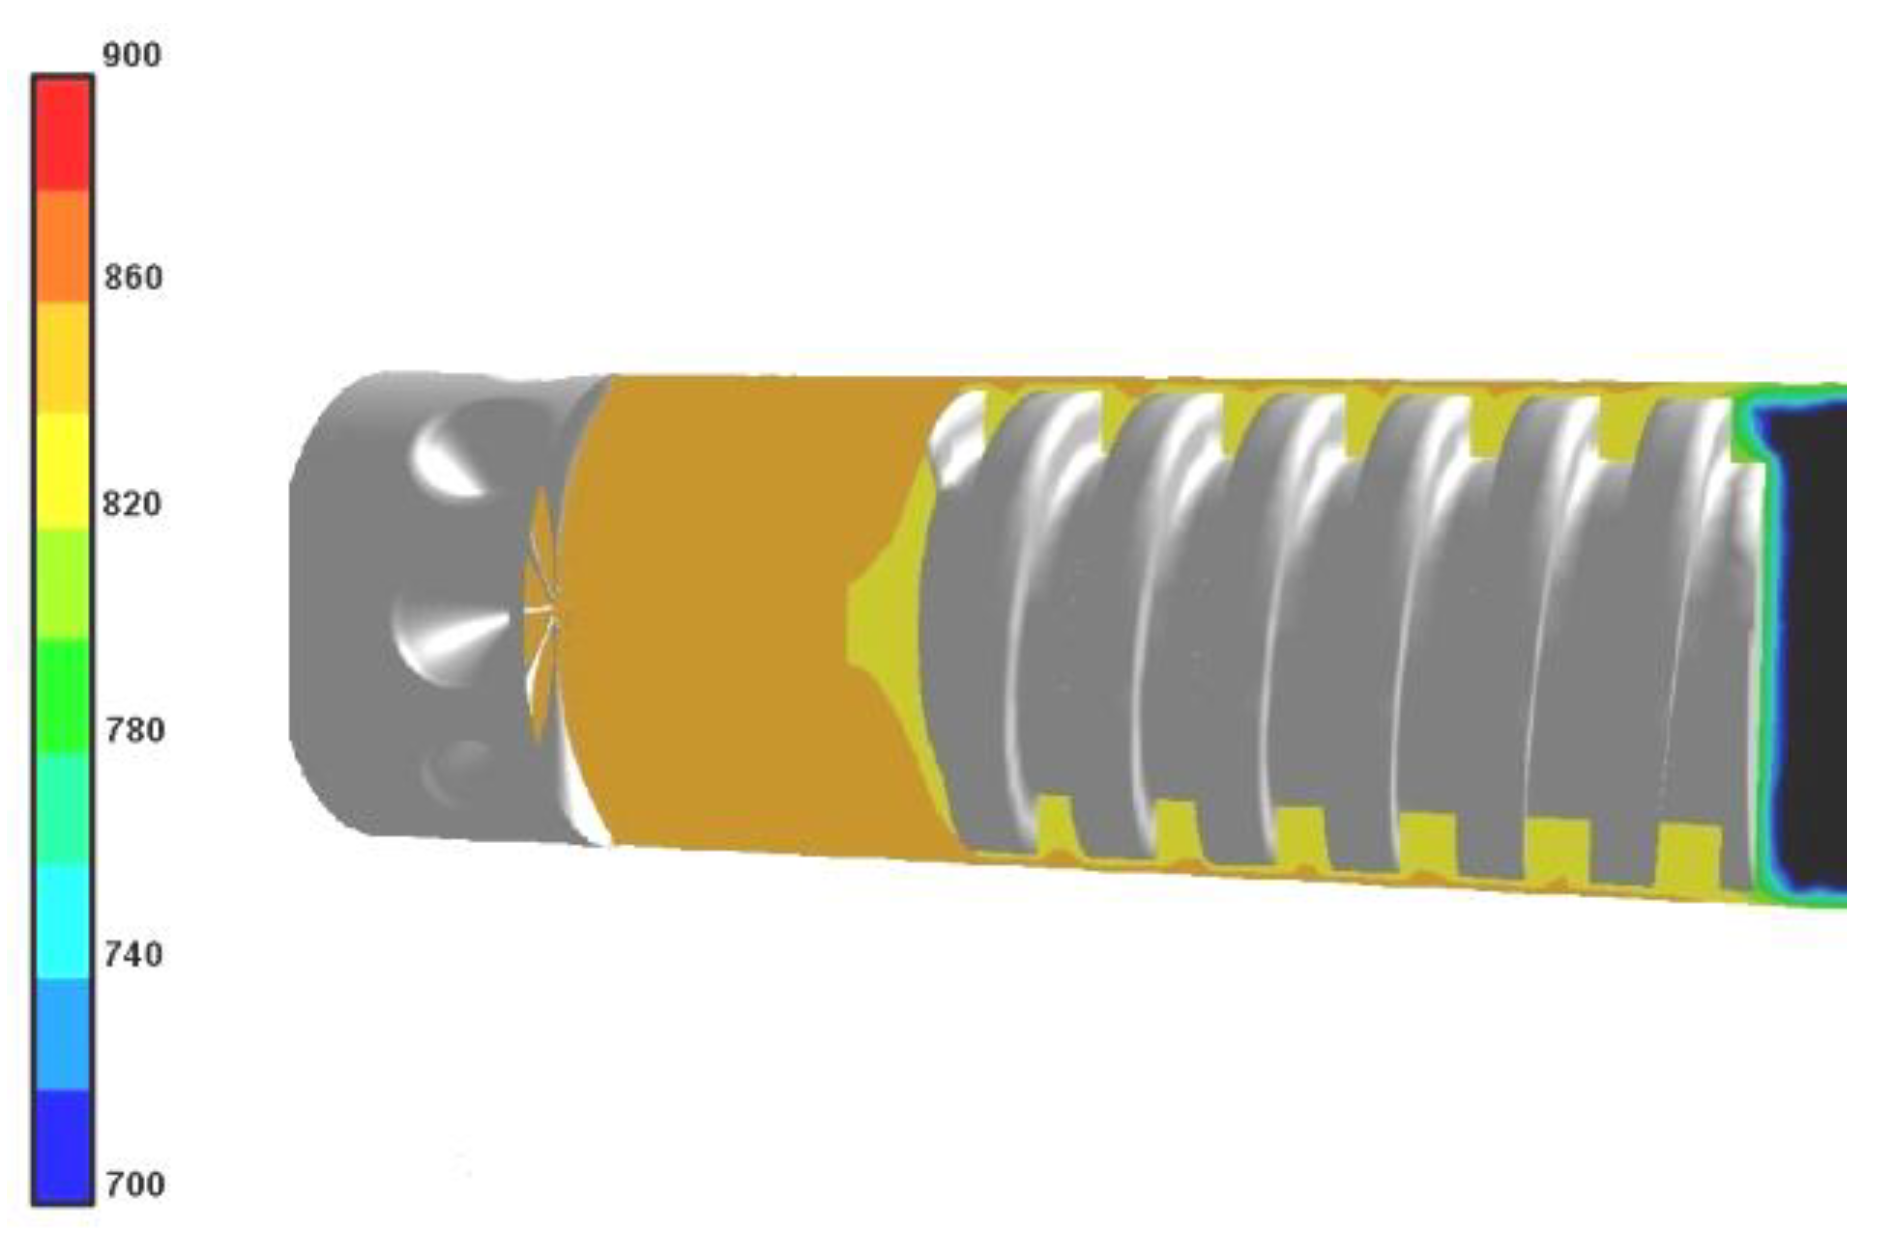
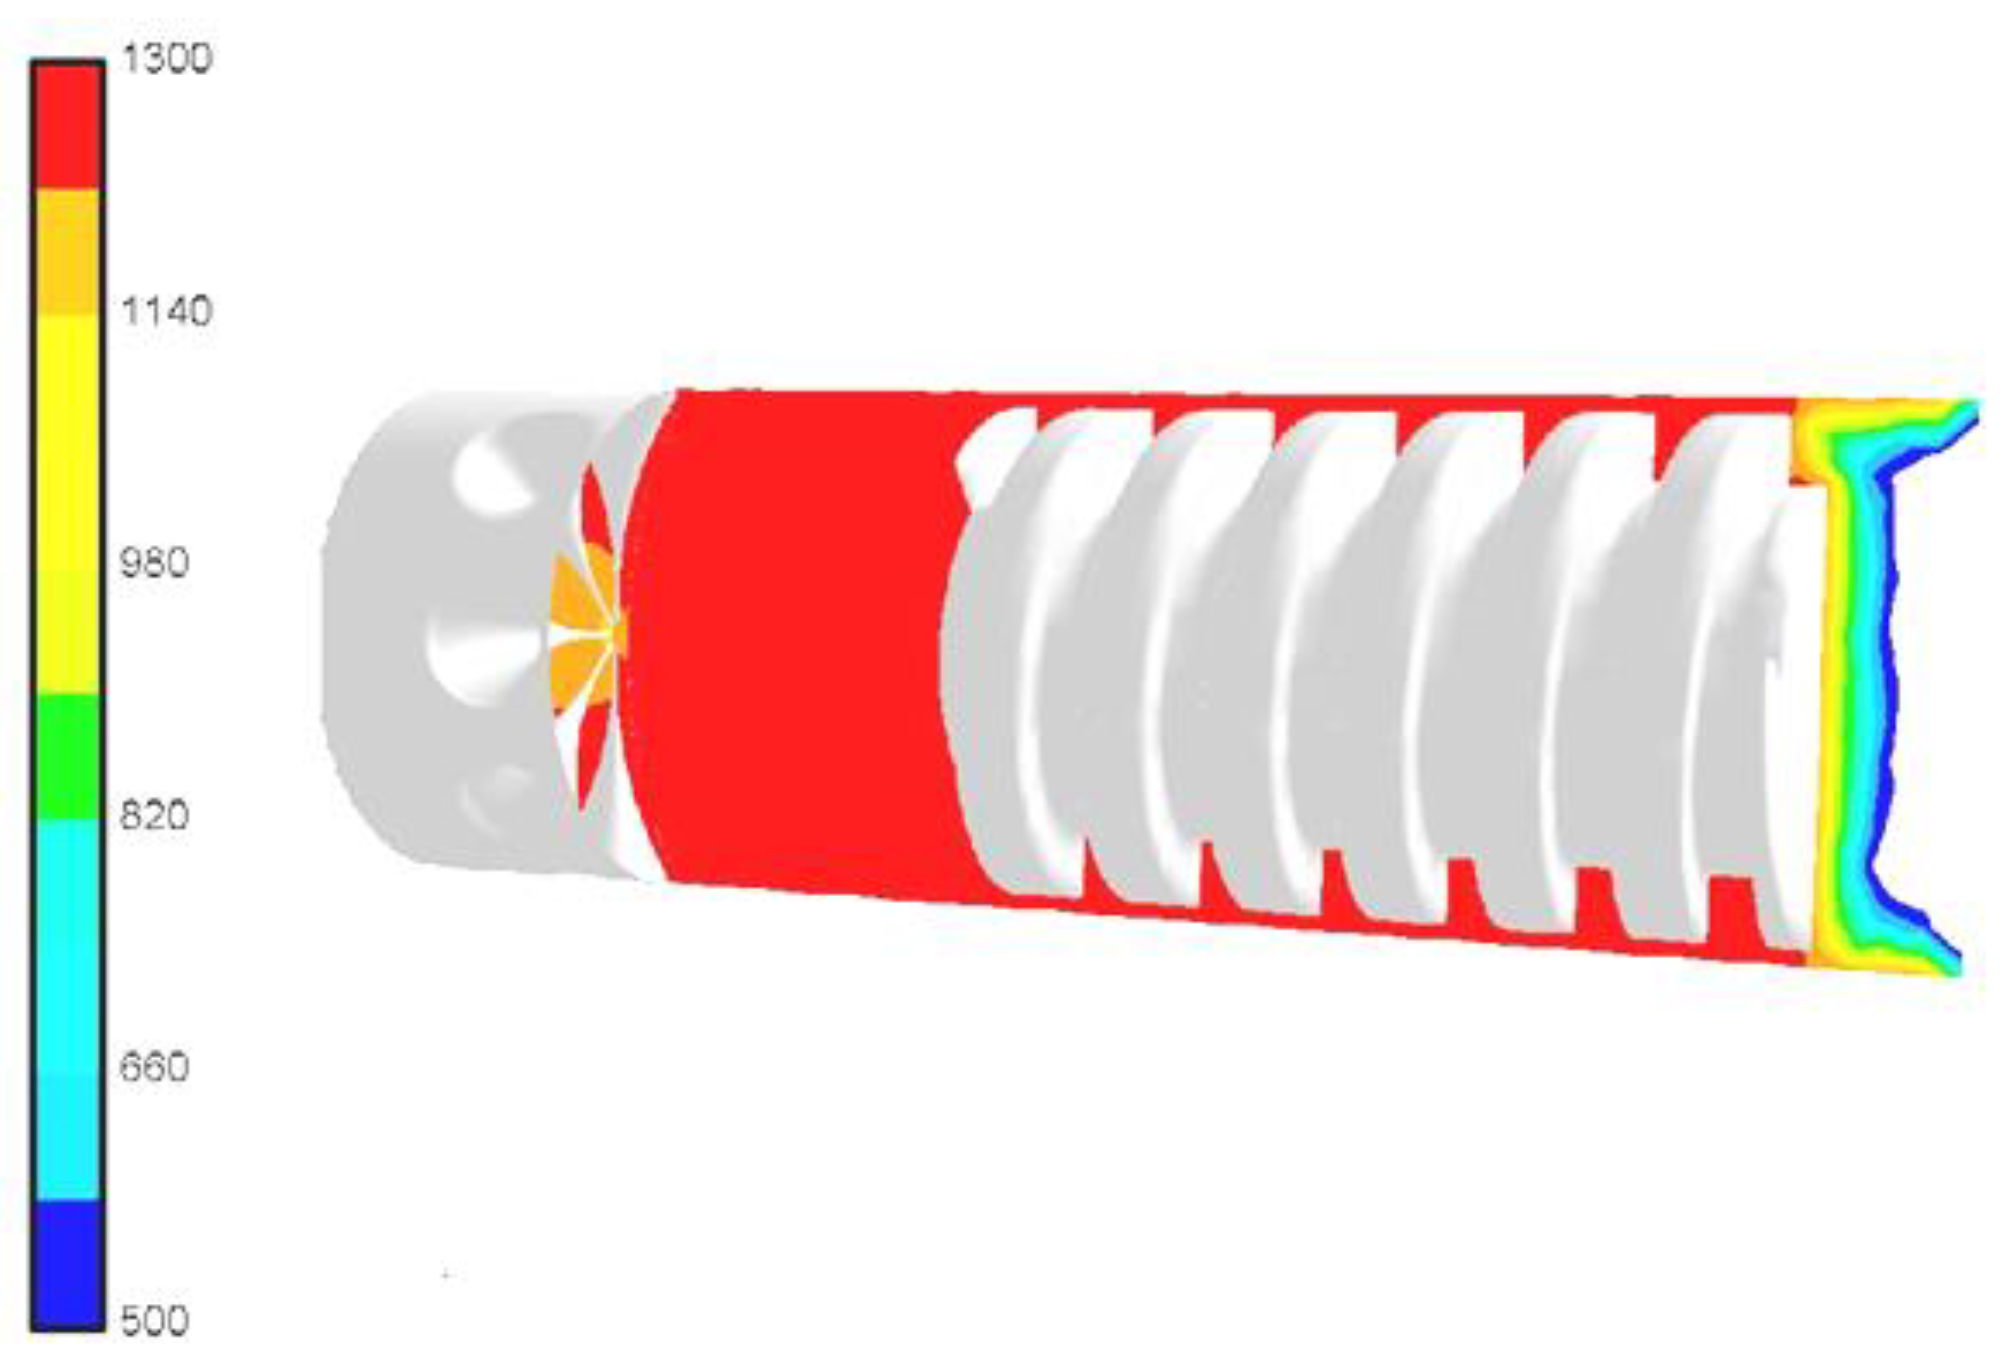
The obtained temperature field indicates that hydrogen is heated to the desired temperature in the short initial section of the reactor, but only in the outer layer. This is due to the higher velocities of the gas flowing at the wall (
Figure 7), while the core of the flowing gas block has a slightly lower temperature of approx. 1150 K.
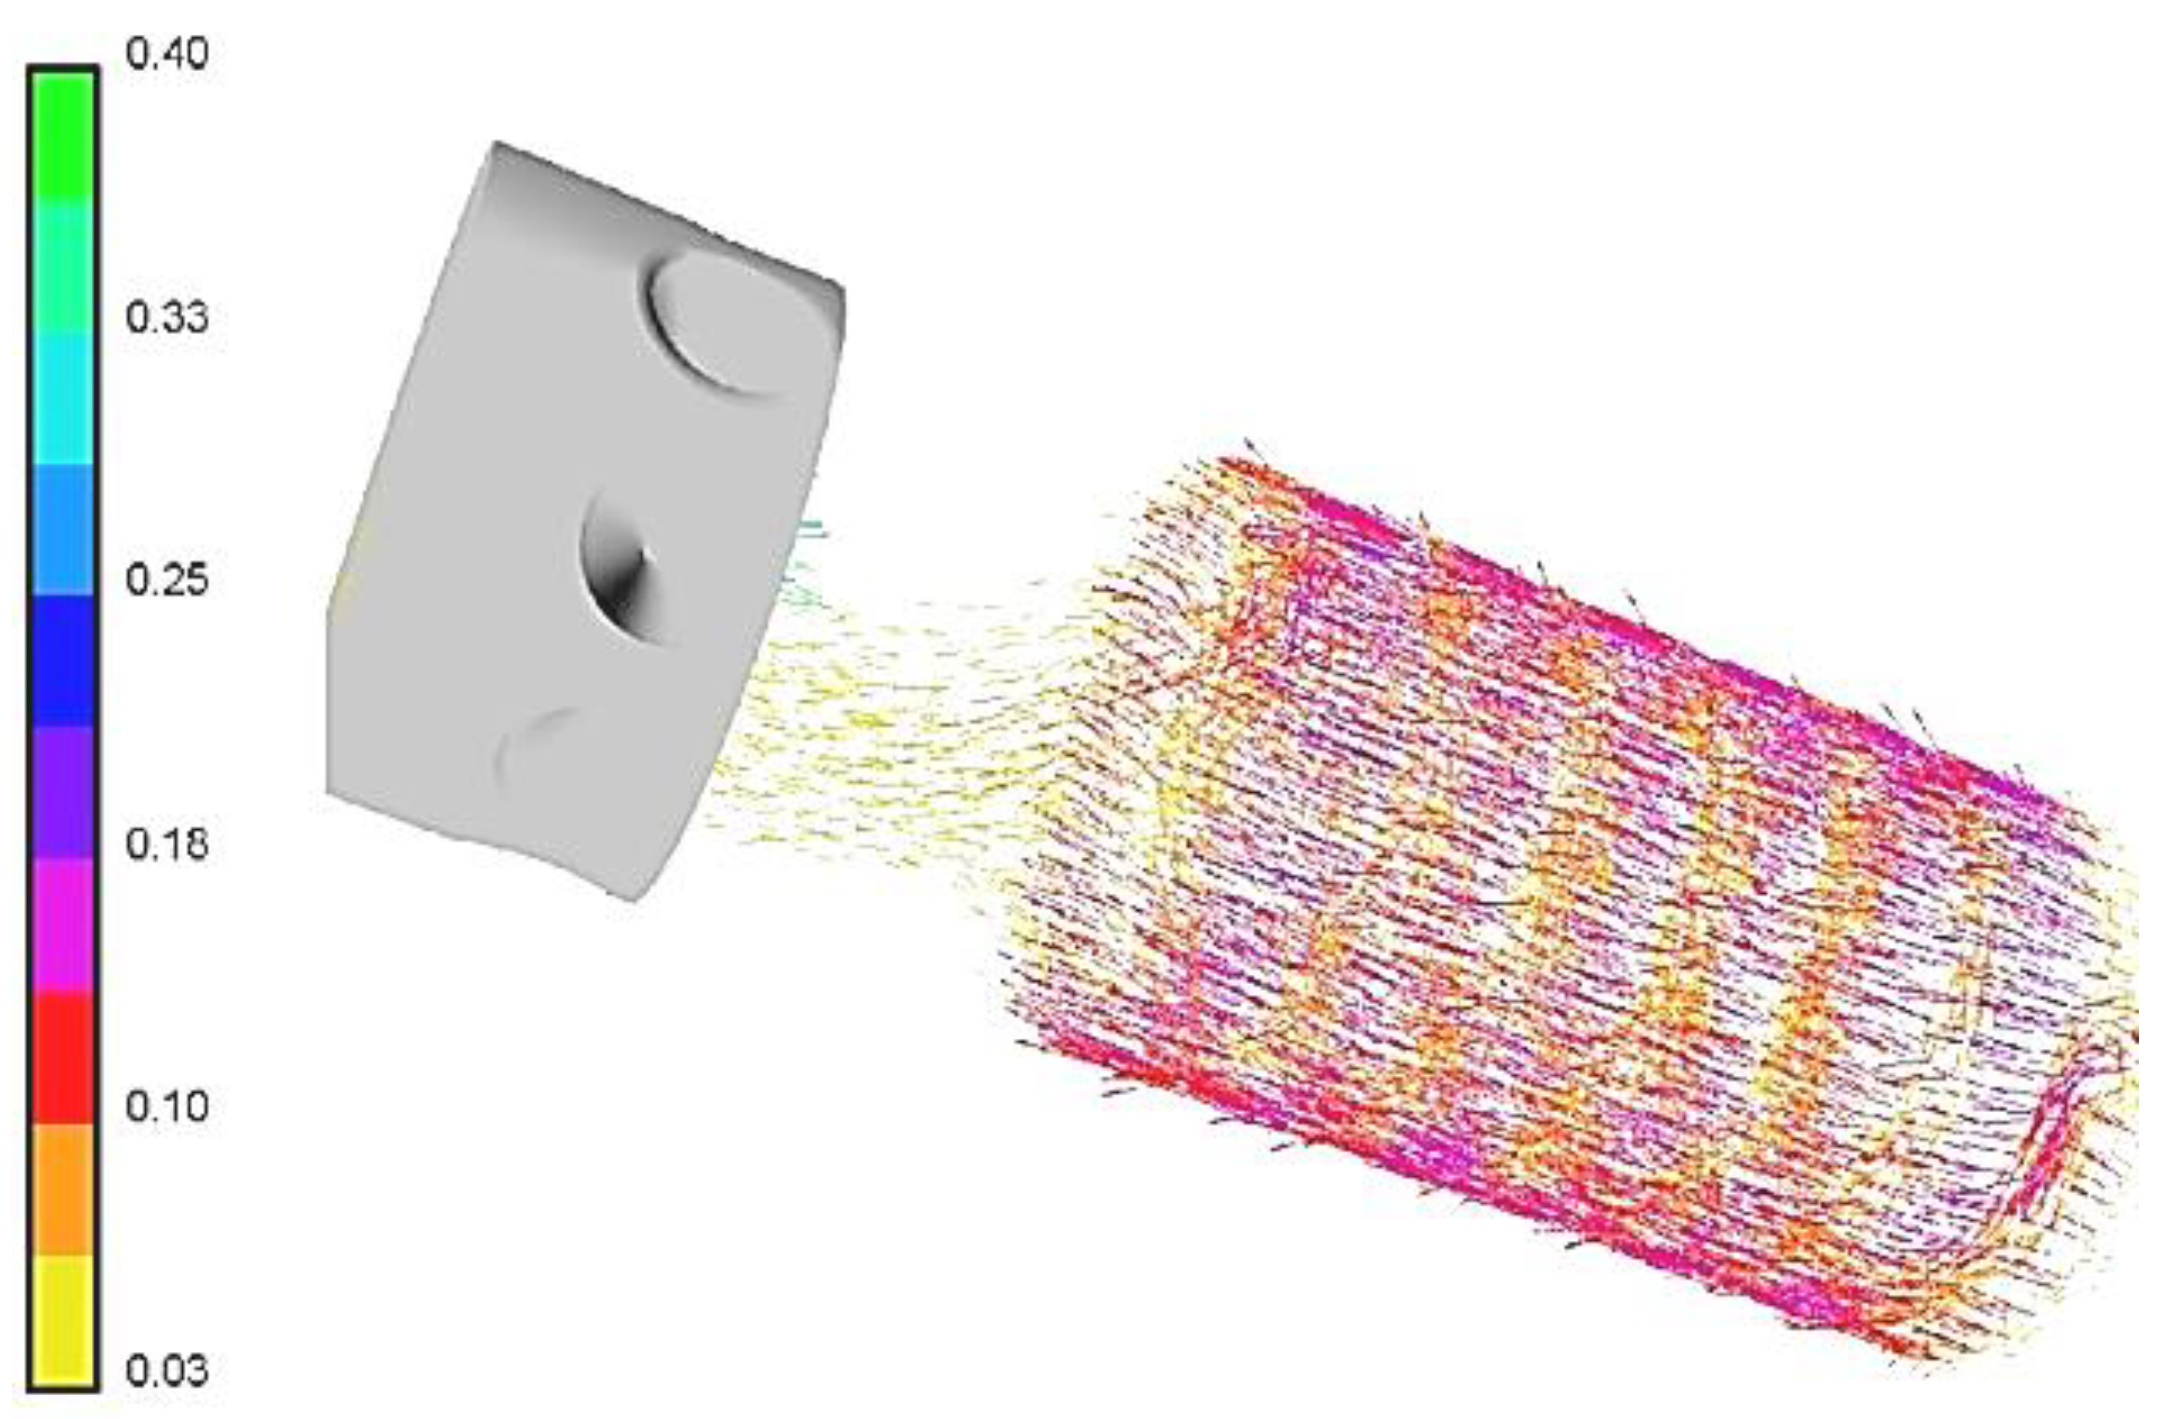
Figure 7 shows the velocity vectors of the hydrogen stream for higher values of pressure and temperature (operating temperature
T = 1273 K and operating pressure
p = 10 MPa) than in
Figure 5. Due to the higher density of the flowing gas under the pressure of 10 MPa with the same mass streams, the obtained velocities were lower and ranged from 0.03 to 0.2 m s
−1.
The results of temperature influence on the carbon conversion rate were contrasted with those reported by Ding et al. [
35] for the ‘Inner Mongolia Semicoke’ under the same conditions and at 5 MPa (
Figure 8). The highest conversion rate for the Janina char was similar to that reported by Ding et al., while it was lower by 18% at 1173 K.
Figure 10 shows the computed char reactivity for two temperature values, 1073 and 1173 K, and the hydrogasification pressure of 7 and 8 MPa as a function of carbon conversion. When the carbon conversion exceeds 60% or 80%, respectively, for 1073 K and especially for 1173 K, the reactivity rapidly decreases. This implies that a temperature of roughly 1200 K needs to be maintained in order to achieve a significant amount of carbon conversion during char hydrogasification; however, the upper temperature range for the reactor used did not allow for such experiments.
For the presented hydrogasification model, an algorithm for computer calculation was developed to enable the determination of the kinetic constants. The presented hydrogasification algorithm uses mechanisms of structural change such as particle porosity, internal specific surface area, total active centers, and degree of carbon conversion. Based on the results of a series of experiments, the kinetic constants of gaseous hydrogasification product formation were determined using the values at the points of maximum process reactivity. The kinetic constants for Janina coal char from the paper by Tomeczek and Gil [
31] (see
Table 6) were used to determine correlations for the Equation (26) presented in
Figure 11. The developed kinetic equations based on these dependencies can be used to model the process on a technical scale.
A contrast of the kinetic Equation (26) is shown in
Figure 12, formulated for the Janina char, with data from two sources in the literature: Mühlen [
20], Fürst Leopold char, and Misirlioglu et al. [
4], Elbistan char. The reactivity values for the investigated Janina char are similar to those computed by Mühlen [
20] for the ‘Fürst Leopold’ char, also for conversion equal to 0, and they surpass the values reported for the “Elbistan” char [
14] by more than one order of magnitude. In comparison to the other shown chars, the ‘Fürst Leopold’ char exhibits a significantly higher activation energy for the overall process of hydrogasification.
6. Conclusions
Since hydrogen is heated only by convection (H2 is transparent to radiation), it is important to properly design the heater in the gas supply line to the hydrogasification process and to control its temperature.
The char becomes less reactive with prolonged contact with hydrogen. Probably, hydrogasification requires temperatures higher than 1200 K to achieve a high degree of coal conversion; however, the upper temperature range for the reactor used did not allow for such experiments.
At 973 K, the hydrogasification process is more than two times less than at 1173 K; thus, hydropyrolysis produces more methane at higher temperatures than hydrogasification does at lower temperatures; the situation is inverted during char hydrogasification, which produces a lot more methane.
The influence of temperature on the carbon conversion rate was contrasted with those reported by Ding et al. [
35] for the ‘Inner Mongolia Semicoke’ under the same conditions and at 5 MPa. The highest conversion rate for the Janina char was similar to that reported by Ding et al., while it was lower by 18% at 1173 K.
Equations for both the first- and second-order reactions toward hydrogen may accurately represent the maximal hydrogasification reactivity of chars. This is likely due to the use of a limited pressure range in the experiments, whereas, due to the partial pressure of hydrogen, it is more likely to fit the first-order equation.
The presented hydrogasification algorithm uses mechanisms of structural change such as particle porosity, internal specific surface area, total active centers, and degree of carbon conversion. The developed kinetic equations based on these dependencies can be used to model the process on a technical scale.
To further improve the efficiency of the hydrogasification process, the next step should be tests involving catalysts.

 ,
, 


