Article

Disperse Partial Shading Effect of Photovoltaic Array by Means of the Modified Complementary SuDoKu Puzzle Topology

1
Department of Electrical Engineering, National Cheng Kung University, 1 University Road, Tainan 70101, Taiwan
2
Department of Electrical Engineering, National Quemoy University, Kinmen County 892009, Taiwan
*
Author to whom correspondence should be addressed.
Energies 2023, 16(13), 4910; https://doi.org/10.3390/en16134910
Submission received: 12 May 2023 / Revised: 16 June 2023 / Accepted: 21 June 2023 / Published: 24 June 2023
(This article belongs to the Special Issue Energy Performance of Photovoltaic Systems)

Abstract

:
This paper presents a novel modified Complementary SuDoKu puzzle (MC-SDKP) topology for the static reconfiguration of photovoltaic (PV) arrays. It was developed with the aim of enhancing the power output of a PV array which is exposed to partially shaded conditions (PSCs). To disperse patterns of both center shading and corner shading, the MC-SDKP technique modified and combined the Optimal SDKP and the Complementary SDKP (C-SDKP) topologies. An 8 × 8 PV array configured with the MC-SDKP topology was exposed to nine different shading patterns, and its performance was compared with that of the other four topologies. The results of the performance evaluation confirmed that, when configured according to the MC-SDKP, the PV array produced the highest average power output among all five topologies, with a 15.07% higher output on average than the total-cross tied. The PV array with the MC-SDKP topology also exhibited the lowest average power loss (1.34%). This study clearly established the effectiveness of the MC-SDKP topology at mitigating the effects of both center and corner shading. The advantages of the MC-SDKP reconfiguration technique are: an increase in extracted power, a reduction in current mismatch losses, an improvement in shade dispersion under conditions of center shading, and good scalability.

1. Introduction

Although photovoltaic (PV) arrays and concentrated PV arrays are widely used to generate electricity from sunlight, variations in solar irradiance directly impact their power output [1,2,3]. For instance, the partial shading of one or more modules in a PV array causes a significant power loss and may even lead to the formation of hot spots and module damage [4,5,6]. To prevent such adverse outcomes, a bypass diode is used to divert part of the current around the shaded modules, thus avoiding the formation of hot spots. However, this may cause multiple peaks in the power-voltage (P-V) curve under partially shaded conditions (PSCs) [7,8,9,10,11]. Various maximum power point tracking (MPPT) algorithms have been developed as intelligent solutions to deal with issues caused by PSCs and to maximize the system output. These algorithms include the short circuit technique, grey wolf optimization, the artificial bee colony, and the hybrid Taguchi genetic algorithm [12,13,14,15]. However, these methods usually require performing complex computations and do not ensure that MPPT is successfully performed over the entire PV array under PSCs. In addition, they are incapable of improving the power losses caused by a current mismatch between the modules in different rows of the PV array.
To decrease the current mismatch losses and mitigate the effects of PSCs on a PV array, much work is currently being done to identify the technique that achieves the best static reconfiguration of the array [16,17,18,19]. Proponents of this approach design various topologies of the interconnection scheme of the PV array in order to improve the power output and reduce the power loss. The reconfiguration of the electrical connections between the modules modifies the equivalent circuit of the PV array, whereas the physical location of the modules remains unchanged. Under PSCs, this leads to a significant dispersion of shading patterns, which improves the total power output of the array. Another benefit of static reconfiguration methods is that neither switching matrices nor complex control algorithms are required. Consequently, they are cost-effective ways of dispersing the harmful effects of shading [20,21,22].
Examples of topologies developed for the static reconfiguration of PV arrays are Odd-Even, Twisted Two-Step, Lo Shu, the Futoshiki arrangement, and Dominance square (DS). Unfortunately, all of them suffer from limitations. For instance, the Odd-Even and Odd-Even-Prime topologies are suitable for arrays of various sizes. The Odd-Even arrangement requires that the modules be positioned according to the odd-odd, even-even, odd-even, and even-odd permutations of the number of rows and columns (M11, M22, M12, and M21). On the other hand, the module arrangements of the Odd-Even-Prime topology could be classified to nine permutations. However, they are not very effective at mitigating the effects of center shading and corner shading [23,24,25]. In the case of the twisted two-step topology, the advantages include that it is equipped with simple rules and its implementation requires a relatively small number of reconfiguration steps. However, its arrangement is not suitable for column shading conditions [26]. The Lo Shu topology, based on an ancient Chinese 3 × 3 mathematical matrix, is also of limited applicability because it can only be applied to 3 × 3 and 9 × 9 arrays [27,28]. Regarding the Futoshiki arrangement, it is ideal for a 4 × 4 array, but can only be applied to square arrays [29]. Finally, although the DS arrangement, based on diagonal rules, is capable of dispersing shading in small areas of a PV array, it requires the use of longer wires [30,31,32].
The SDKP topology shows more potential than these other arrangement techniques. It is derived from the popular logic-based, combinatorial number-placement puzzle of the same name. The puzzle requires that a 9 × 9 grid be filled with the digits 1–9, with each number present only once in each row, each column, and each 3 × 3 subarray of the puzzle. The SDKP topology disperses the solar irradiation over all modules of a PV array in an equivalent circuit by changing the electrical connections. This method is applicable to PV arrays of various sizes [32,33,34,35,36]. However, there are too many possible permutations of the original SDKP configuration. This potential problem has led to the development of the Ken-Ken Square puzzled (KKSP), TomTom puzzle, the Complementary SDKP (C-SDKP) and Optimal SDKP topologies which are equipped with constraints imposed on the selection of the appropriate permutation [37,38]. The KKSP and TomTom puzzle rules, which are designed based on mathematical operations, have been proven could effectively improve power output under PSC. However, they are not applicable for large PV arrays due to complex permutations [32,39,40]. The C-SDKP topology was specially designed to disperse corner shading in a PV array based on the diagonal complementary rule. Although the C-SDKP performs well with corner shading, it is considerably less effective at mitigating the effects of center shading. Another version of the SDKP topology is called the Optimal SDKP reconfiguration technique. It improves on the original topology by incorporating the rules for performing shift operations and by replacing the middle digit of subarray. Thus, the Optimal SDKP is capable of simplifying the wiring configuration of the PV array, which improves the shade dispersion over the entire array. However, the Optimal SDKP exhibits only average-level performance at dispersing the effects of center shading.
In an effort to optimize the dispersion of both center and corner shading, the current study was undertaken to develop a modified C-SDKP (MC-SDKP) static reconfiguration technique. This method incorporates the arrangement rules and the shift operation and digit replacement procedures which feature in the Optimal SDKP technique together with the modified diagonal complementarity rule of the C-SDKP technique. The MC-SDKP is capable of producing significant improvements in the dispersion of both center shading and corner shading. It is also capable of reducing the difference in current between the rows of a PV array, thereby simplifying the P-V curves and the maximum power point tracking (MPPT) method.
The remaining sections of this paper are organized as follows. Section 2 introduces the circuit model of the PV array which was used to calculate the output current of any given row. The layout of the interconnection scheme in the MC-SDKP topology as well as its arrangement rules are also presented in this section. In Section 3, the experimental set-up of the PV array based on various topologies and the estimations they produce of the power output of the array are discussed. In addition, the P-V curve, power output, and power enhancement achieved by reconfiguring the topology of the PV array by means of the MC-SDKP technique are compared to the same performance indicators for four other topologies under nine distinct PSCs. Finally, Section 4 presents the discussion and conclusion of this study.

2. Methodology

2.1. Circuit Model of the PV Array and Calculation of Row Current

When solar cells are connected in series and in parallel to form a PV module, the relationship between the current (I) and voltage (V) of each solar module can be expressed as [41]:
I = N p I L I 0 e x p V + I R S α N s 1 V + I R S R P
where Ns and Np denote the number of cells connected in series and in parallel, respectively; IL and I0 denote the light-generated current and the reverse saturation current in the diode, respectively; and RS and RP denote the series resistance and the shunt resistance of the cell, respectively. Furthermore, the variable α is defined as nKT/q, where n, K, T, and q denote the ideality constant of the diode, the Boltzmann constant, the temperature of the p-n junction diode, and the electron charge, respectively.
The setup with which this equation was modelled is presented in Figure 1a, showing the equivalent circuit of an 8 × 8 PV array connected based a total-cross tied (TCT) configuration.
In order to estimate the power output of the PV array arranged based on different static reconfiguration topologies, the current of each row (Irow_i) in the array was calculated and used as a diagnostic tool [42]. The Irow_i was calculated based on:
I r o w _ i = j = 1 8 k i j × I m
where i and j represent the number of rows and columns in an individual module, respectively. The term kij represents the irradiance factor of the module (Mij). It is calculated as kij = Gij/GSTC, which is the ratio between the measured irradiance (Gij) and the irradiance under standard test conditions (GSTC). Finally, Im represents the maximum current of the module under standard test conditions (STC).
As can be seen in Figure 1b, under conditions of uniform irradiation, no group of modules is bypassed, and the voltage of the array is calculated using the formula Varray = 8 × Vm. The variable Vm represents voltage of the module at the maximum power, and small variations in voltage between rows is ignored. On the other hand, the operating voltage of a PV array exposed to PSCs depends on the selected operating current (IRi) and on how many groups of modules are bypassed. For instance, when a single row of the array is bypassed, the operating voltage is calculated using the formula Varray = 7 Vm + Vd, where Vd represents the voltage across the bypass diode. As Vd is significantly smaller than Varray, it can be disregarded, resulting in the simplified equation Varray = 7 Vm. Consequently, the operating voltage of an array under PSCs depends on the number of rows that are not bypassed (nw/o) and can be expressed as:
V a r r a y = n w / o V m
This line of reasoning leads to the conclusion that the total power output of the PV array (Parray) can be estimated based on its operating voltage (Varray) and current (Iarray) and can be expressed as:
P a r r a y = I a r r a y V a r r a y = I r o w _ i V a r r a y
where Iarray depends on the selection of the operating row current Irow_i.
Equation (4) could be used to calculate the power output of each local maximum power point (LMPP), thereby providing an estimate of the global maximum power point (GMPP) of the PV array. As a result, the calculation of the row current is a potential diagnostic tool which could help in the analysis of the adverse impact of PSCs on the performance of the PV array.

2.2. Static Reconfiguration of PV Array Based on the MC-SDKP Topology

In this paper, we present a novel MC-SDKP topology for the static reconfiguration of a PV array which is exposed to PSCs. This method incorporates the C-SDKP and Optimal SDKP techniques. That is, it combines a slightly modified version of the diagonal complementary rule of the C-SDKP, which is effective at dispersing corner shading, with the shift operation rule of the Optimal SDKP, which is effective at dispersing center shading.
The following rules determine the layout of the modules in an 8 × 8 PV array based on the MC-SDKP static reconfiguration technique.
Rule #1: The 8 × 8 array is divided into eight 4 × 2 subarrays. The row number for each subarray, row and column must be unique (the Conventional SDKP rule).
Rule #2: The module column numbers are numbered in order and fixed (the Conventional SDKP rule).
Rule #3: The module row numbers within Column #1 must be sequentially numbered (the C-SDKP rule).
Rule #4: The circular shift operation pair is defined as the numbers in the previous column are shifted by four (maximum size of subarray: 4 × 2) for the modules of the next column (the Optimal SDKP rule).
Rule #5: The row numbers of the four modules in each column of each subarray must be assigned and packaged with number combinations, such as £1–4, or £5–8 (the Optimal SDKP rule).
Rule #6: Each pair of complementary modules must be located in the same row. A complementary pair of modules (as illustrated by the red dashed lines in Figure 2) is defined as any pair for which the sum of their row numbers is equal to the size of the matrix of the entire PV array + 1 (the C-SDKP rule).
The following practical optimization procedure was applied while implementing the rules outlined above for an 8 × 8 PV array reconfigured based on the MC-SDKP topology.
Step #1: Follow Rules #1–3 in order to generate and assign the row numbers for the modules in Column #1 of the array (see Figure 2b).
Step #2: Based on Rule #4, generate the row numbers for all the modules in Column #2 and the 1st modules in Columns #5 and #6 (M25 and M66), respectively.
Step #3: Base on Rule #5, arrange the row numbers for the remaining modules in Columns #5 and #6 in order of descending power (see Figure 2b).
Step #4: Based on Rule #6, arrange the row numbers for the modules in Columns #3, #4, #7, and #8.
Figure 2b shows the complete configuration of the numbers assigned to each row and column in the 8 × 8 array after the implementation of the MC-SDKP topology.

3. Results

3.1. Experimental Setup for the Performance Evaluation

Anytime a new static reconfiguration technique is proposed in an attempt to improve the capacities of PV arrays, it is crucial to rigorously evaluate its performance. To this end, the MC-SDKP topology developed in this study was applied to an 8 × 8 PV array. Its performance, along with that of a number of other topologies (the conventional TCT, the Odd-Even, the Optimal SDKP, and the C-SDKP) were experimentally validated and compared. The MATLAB (version 9.11, R2021b) software package with the Simulink toolbox were used to run all simulations (as illustrated in Appendix A). The specifications for the module which was evaluated under the standard test conditions (STCs) are listed in Table 1 [37]. In addition, to assess the reliability of the proposed topology, all simulations were performed five times under various PSCs, and averages and standard deviations were calculated. Moreover, the temperature of the modules was increased in a controlled manner from 5 °C to 45 °C in increments of 10 °C.
Figure 3 shows the various arrangements of the modules in the PV array based on the different reconfiguration techniques taken into consideration. Typically, the circuit connections of these topologies are based on the TCT configuration, which makes it the logical choice for the benchmark in this study. To compare and validate the performance of the five topologies, the PV array was evaluated with patterns of shading representing nine different PSCs. The types of patterns that were examined include corner shading, short-narrow shading (SN), center shading, short-wide shading (SW), long-wide shading (LW), and long-narrow shading (LN) [33,38]. They were combined to form the Patterns #1–9 shown in Figure 4. Patterns #1–#4 are examples of corner shading, while Patterns #5 and #6 are examples of center shading. These shading patterns are frequently used when designing the configuration of a PV array.

3.2. Results of the Performance Evaluations of the Topologies

3.2.1. Estimated Results for the Topologies

Figure 5 shows the shading patterns to which was exposed the PV array that was reconfigured with the MC-SDKP topology. It is clear that this reconfiguration technique induced a significant dispersion of the partial shading patterns impinging on the array. Thus, mismatch losses caused by the uneven distribution of irradiation over the array was reduced.
Preliminary estimations of the power output of the 8 × 8 PV array reconfigured with the different topologies were obtained using the method for calculating the row current discussed in Section 2.1. Table 2 compares the performance of the five reconfiguration techniques in response to the nine PSC-patterns in terms of the following parameters: the maximum difference in row current (ΔIR), the output voltage (Varray), and the power (Parray) at the GMPP. The variable Im represents the maximum current of a module under STC, and the variables Vm and Pm represent the voltage and power of the module at the maximum power point (MPP), respectively.
The maximum difference in row current (ΔIR) could be used to preliminarily analyze the adverse impact of PSCs on the performance of the PV array [37,43]. In addition, when the bypass diodes are activated under PSCs, the current flows through the bypass diodes, which conducts a bias voltage across the shaded modules. When the difference in current between the rows of a PV array is large, the activation of the bypass diodes may lead to issues related to the system reliability. Therefore, the index for calculating the maximum difference in row current (ΔIR) could be also used to evaluate the reliability of the PV array [34,44].
The MC-SDKP was found to have produced the highest estimated power output when exposed to all shading patterns except Pattern #7. The estimated power output of the C-SDKP was slightly larger than the MC-SDKP under this pattern due to the slight difference of their complementary rules. It also produced the smallest ΔIR for all patterns except Patterns #7 and #9. On average, the MC-SDKP reconfiguration technique generated the highest power output and the smallest difference in current. These findings suggest that the implementation of the proposed method would result in a decrease in the ΔIR and an increase in the reliability of system. Finally, it was observed that the GMPPs shifted to the highest voltage under Patterns #7 and #8 after each of the four static reconfiguration techniques were applied to the PV array. The work carried out by the MPPT algorithms could be simplified with the help of this knowledge.

3.2.2. Results of the Simulations of the Performance of the Topologies

The five topologies were further put to the test, with their performance simulated with MATLAB software. All the simulations were performed five times under the same test conditions. Table 3 presents the maximum power output (Pmp) and the power loss (Ploss) of the PV array in relation to both the topology used to reconfigure it and the PSC it was exposed to. The parameter Ploss was defined as [(PidealPmp)/(Pideal)] × 100 (%), where Pideal represents the ideal power output of the array. Table 4 shows the percentage improvement in power output brought about by the four static reconfiguration techniques when compared to the typically employed TCT configuration.
The results of the simulations indicated that the static reconfiguration techniques produced power outputs which were between 216 W and 850 W higher than that produced with the TCT, an improvement of 5.41–25.7%. In terms of individual performance, the MC-SDKP topology extracted the highest power output among all topologies for Patterns #1, #3, #6, and #8, with improvements over the benchmark TCT topology of approximately 389 W, 635 W, 272 W, and 556 W (i.e., 9.47%, 17.65%, 7.15%, and 17.46%), respectively.
Regarding the performance of the other static reconfiguration techniques, the Optimal SDKP significantly improved the power output compared to the TCT under Patterns #1, #4, and #5 by approximately 389 W, 689 W, and 707 W (i.e., 9.47%, 20.01%, and 20.82%), respectively. These results were similar to those of the MC-SDKP. On the other hand, the C-SDKP improved the power output under Patterns #2 (592 W, 15.76%), #7 (871 W, 26.35%) and #9 (254 W, 6.36%). Finally, the Odd-Even topology produced the smallest boost in power output, with improvements of 1.23–19.70% under Pattern #1, #2, #5, #7, and #9.
Table 4 summarizes the averaged results of this performance evaluation. It can be seen that the MC-SDKP topology produced the highest average power output, the largest average improvement over the TCT, and the lowest average power loss. In addition, it yielded the lowest standard deviation for the data on the average power, power loss, and power improvement.
The evaluation of the effect of the temperature was conducted with the same settings as those described in Section 3.1. The temperature of the modules was increased in a controlled manner from 5 °C to 45 °C in increments of 10 °C. Table 5 summarizes the average values resulting from the assessment for the five topologies at different temperatures. It can be seen that the MC-SDKP topology produced the highest average power output, the highest average power improvement, and the lowest average power loss at all five temperatures.
The average values and standard deviations for the data on the performance of the five topologies under the nine PSCs and five temperatures are presented in Table 6. It can be seen that the MC-SDKP topology produced the largest average power output, the largest improvement, and the smallest average power loss. In addition, the proposed method yielded the smallest standard deviation for the data on the average power, power loss, and power improvement.
Figure 6 shows the box plots for the comparisons of the power loss and the power improvement made among the five configurations under the nine PSCs and the five temperatures. As can be seen in Figure 6a, the MC-SDKP was characterized by the smallest average power loss, the smallest distribution range and the fewest outliers among the five topologies. In addition, as shown in Figure 6b, the MC-SDKP also produced the largest average power improvement and the smallest distribution range when the interquartile range was extended 1.5 times.

3.2.3. Comparison of the P-V Curves for the Five Topologies

Figure 7 shows the P-V curves for the PV array in relation to both the topology used to reconfigure it and the PSC it was exposed to. It can be seen that the MC-SDKP, C-SDKP, and Optimal SDKP topologies were effective at simplifying the P-V curve and improving the power output of the array. It is worth noting that, following the static reconfiguration of the PV array, all GMPPs were either located at the LMPPs with the highest voltage along the P-V curves (under Patterns #1–#6, and #9) or shifted to this location (under Patterns #7 and #8). Consequently, the complexity of the MPPT was significantly decreased using these static reconfiguration techniques.

4. Discussion and Conclusions

This study developed a modified Complementary SuDoKu puzzle (MC-SDKP) topology for the static reconfiguration of a PV array. The proposed method showed significant potential for dispersing the effects of partial shading on a PV array, thus enhancing its power output. The MC-SDKP incorporated the diagonal complementary rule of the C-SDKP topology, which is particularly well-suited to the dispersion of patterns of corner shading. To further enhance its ability to disperse center shading, the diagonal complementarity rule was modified and integrated with the Optimal SDKP topology. The resulting MC-SDKP reconfiguration technique exhibited the ability to significantly decrease the difference in current between the rows of a PV array, thereby simplifying the P-V curves and the work of the MPPT.
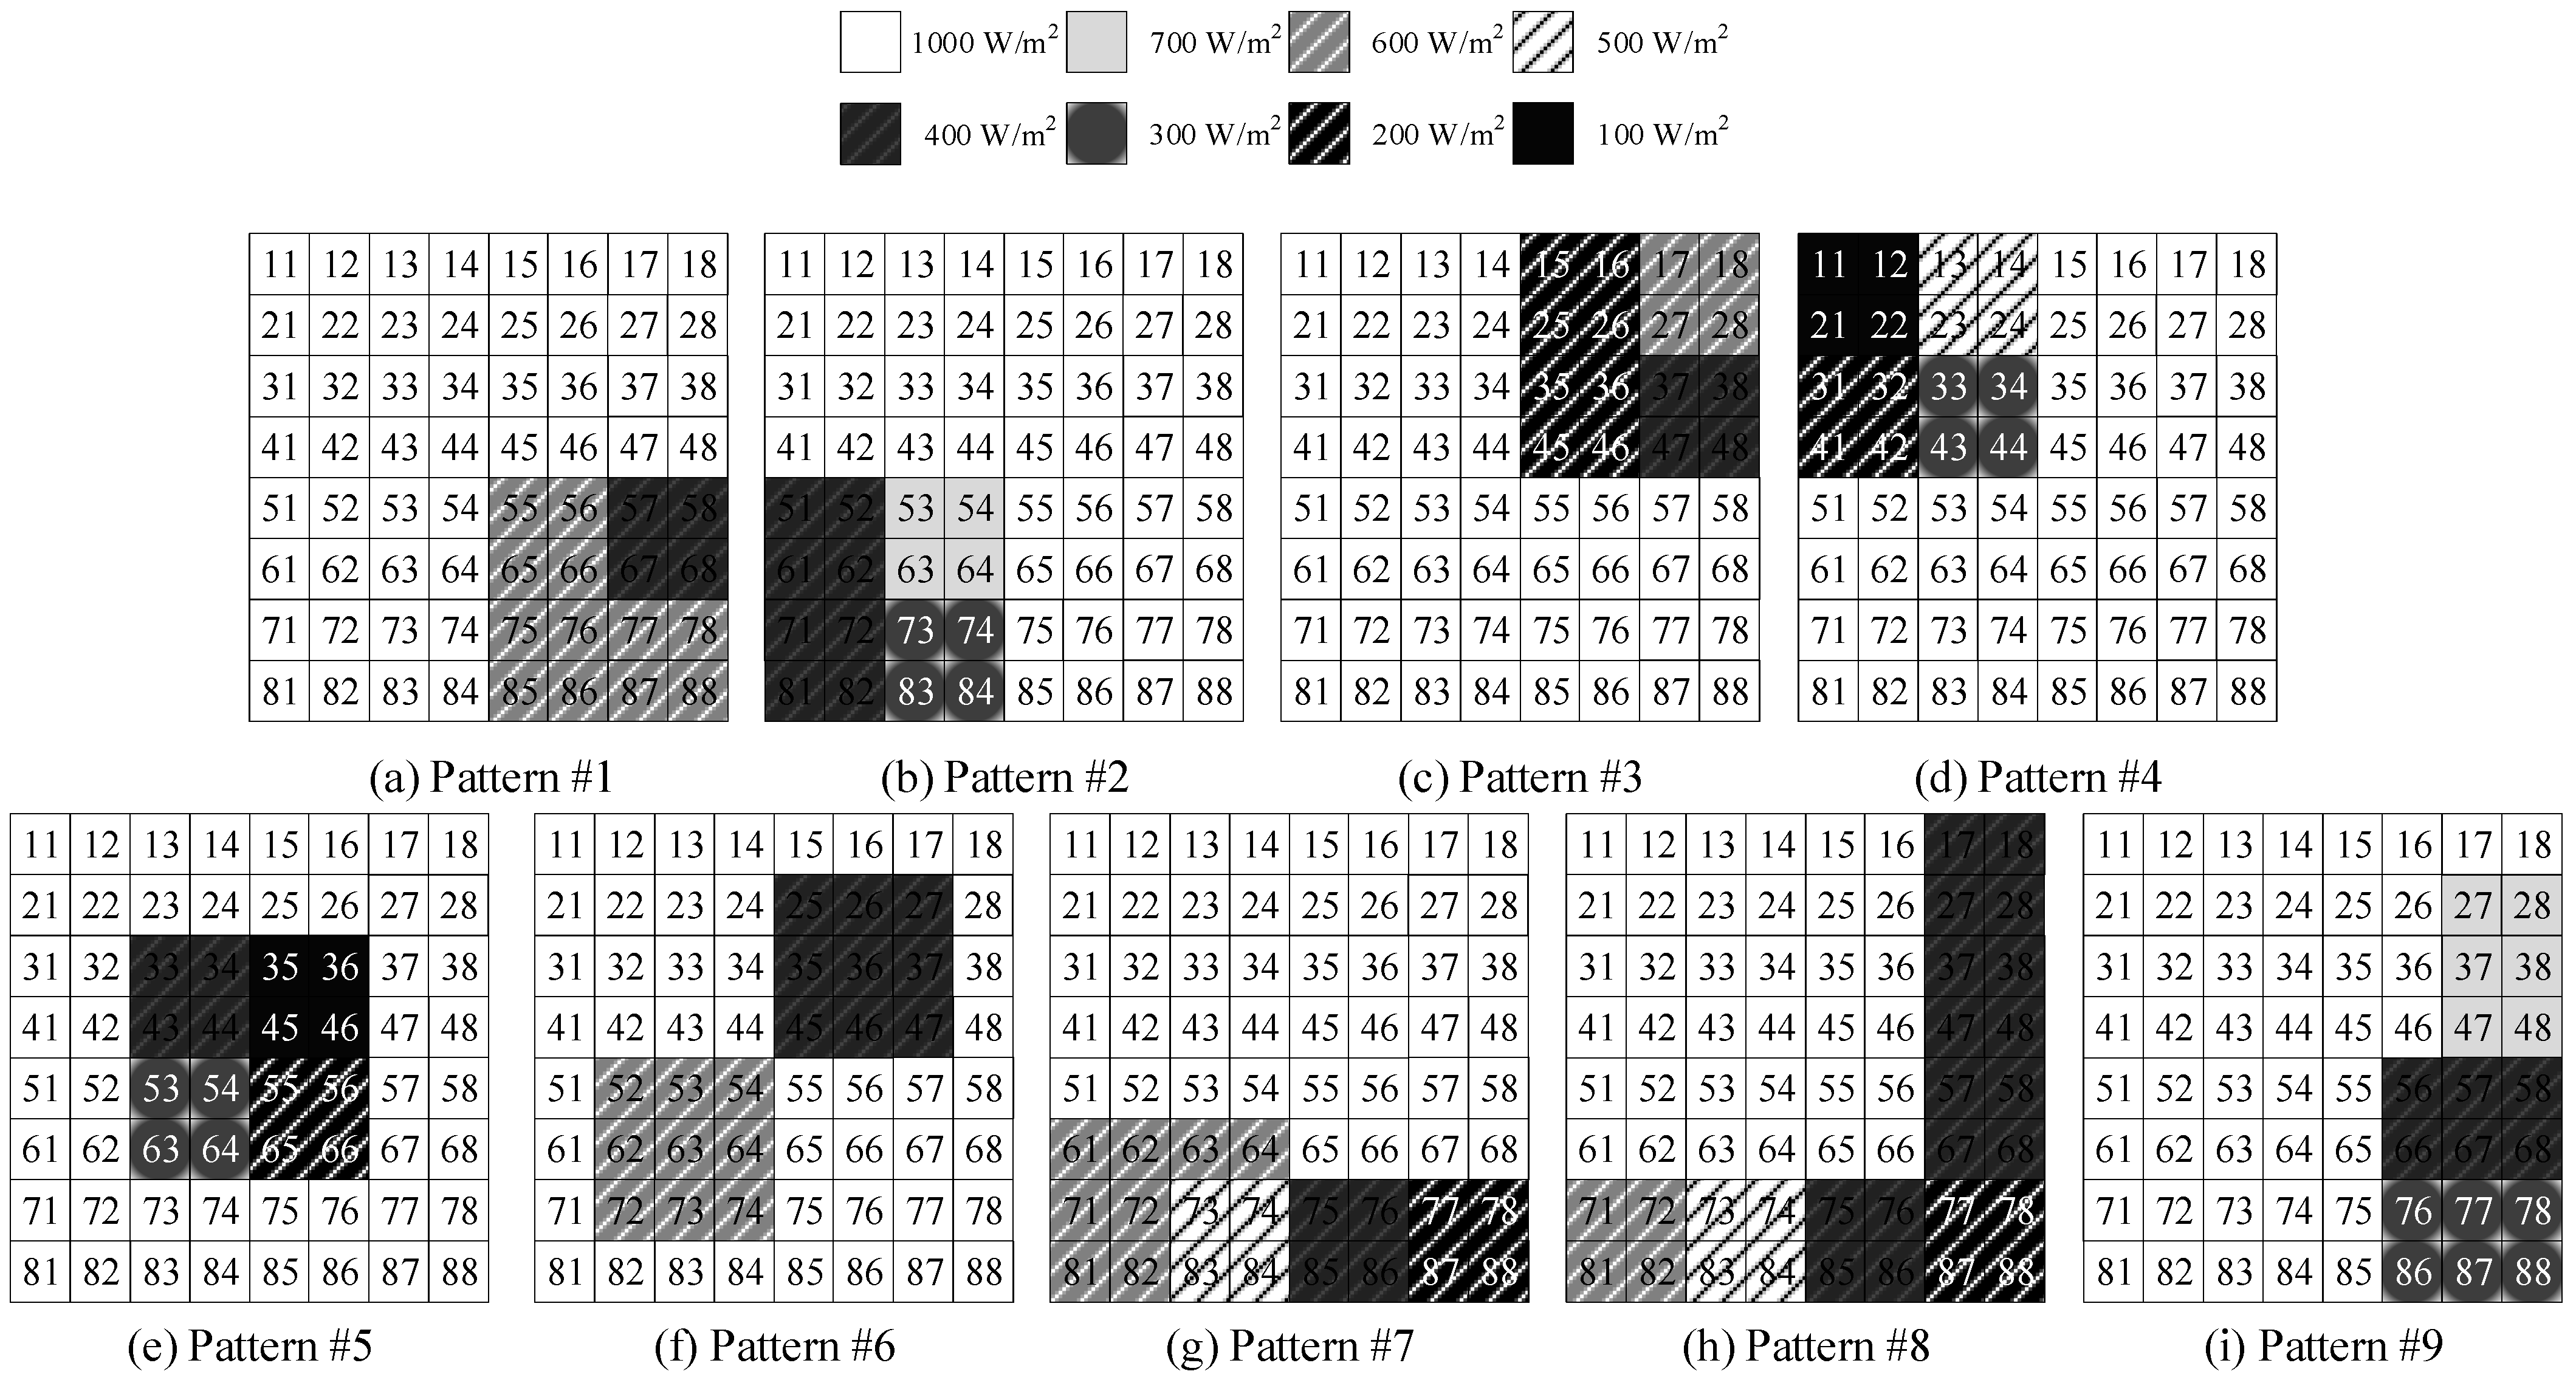
To assess the effectiveness of the MC-SDKP topology at mitigating the effects of shading and to compare its performance with that of four other topologies (TCT, Odd-Even, Optimal SDKP, and C-SDKP), an 8 × 8 PV array was tested under nine different patterns of partial shading and five different temperatures (increasing from 5 °C to 45 °C in increments of 10 °C). The estimation results showed that the PV array reconfigured with the MC-SDKP method generated the largest power output and the smallest difference in current on average. Thus, implementing the proposed method would lead to a decrease in the value of ΔIR and an increase in the reliability of the system. In addition, the results of the performance evaluation further confirmed that the MC-SDKP reconfiguration technique produced the largest average power output and power improvement (15.07%, and σ = 6.28%), and the smallest average power loss (1.34%, and σ = 0.99) of all five reconfiguration methods. Finally, the results of the box plot analysis of the power loss and improvement revealed that the MC-SDKP yielded the smallest distribution range and the fewest outliers among the five topologies, which confirmed its high degree of reliability under the test conditions.
Under Patterns #1, #3, #6, and #8, the MC-SDKP topology produced the highest power output among the five topologies which were examined. Moreover, under Patterns #3 through #5, the improvement in power output produced by the MC-SDKP was almost the same as that of the Optimal SDKP, which performed the best in response to these PSCs. In contrast to the performance of the TCT, the MC-SDKP boosted the output power by between 216 W and 850 W (i.e., 5.41–25.73%). It can be concluded that this study has succeeded in establishing the effectiveness of the MC-SDKP technique at mitigating the effects of both the center and corner shading of the PV array. Furthermore, using the MC-SDKP reconfiguration technique resulted in all the GMPPs being located or shifted to the LMPPs with the highest voltage in the case of all PSCs, which goes a long way towards simplifying the work of MPPT algorithms. The MC-SDKP topology was designed to be used for square sizes with an even number of both rows and columns, as it was in this study using an 8 × 8 PV array. Future research could be conducted to assess the performance of the MC-SDKP topology when it is used to reconfigure PV arrays of different sizes and implemented them in practice. The practical implementation of the proposed MC-SDKP topology to an 8 × 8 PV array is illustrated in Figure A2 (Appendix A).

Author Contributions

Conceptualization, C.-E.Y.; Methodology, C.-E.Y.; Software, C.-E.Y.; Data Curation, C.-E.Y. and Y.-P.H.; Writing—Original Draft, C.-E.Y.; Resources, C.-C.T. and Y.-P.H.; Supervision, C.-C.T.; Funding acquisition, Y.-P.H. and C.-C.T.; Investigation, Y.-P.H.; Visualization, Y.-P.H.; Writing—Review & Editing, Y.-P.H. All authors have read and agreed to the published version of the manuscript.

Funding

This research was funded by the National Science and Technology Council, Taiwan, grants number MOST 111-2221-E-507-005 and MOST 111-2221-E-006-213.

Data Availability Statement

The data presented in this study are available on request from the corresponding author.

Conflicts of Interest

The authors declare no conflict of interest.

Appendix A

Figure A1. 8 × 8 PV array for MATLAB simulation.
Energies 16 04910 g0a1
Figure A2. Wiring diagram when applying the MC-SDKP topology.
Energies 16 04910 g0a2

References

  1. Reatti, A.; Kazimierczuk, M.; Catelani, M.; Ciani, L. Monitoring and field data acquisition system for hybrid static concentrator plant. Measurement 2017, 98, 384–392. [Google Scholar] [CrossRef]
  2. Cappelletti, A.; Reatti, A.; Martelli, F. Numerical and Experimental Analysis of a CPV/T Receiver Suitable for Low Solar Concentration Factors. Energy Procedia 2015, 82, 724–729. [Google Scholar] [CrossRef] [Green Version]
  3. Al Abri, W.; Abri, R.A.; Yousef, H.; Al-Hinai, A. A Simple Method for Detecting Partial Shading in PV Systems. Energies 2021, 14, 4938. [Google Scholar] [CrossRef]
  4. Akram, N.; Khan, L.; Agha, S.; Hafeez, K. Global Maximum Power Point Tracking of Partially Shaded PV System Using Advanced Optimization Techniques. Energies 2022, 15, 4055. [Google Scholar] [CrossRef]
  5. Rezazadeh, S.; Moradzadeh, A.; Pourhossein, K.; Akrami, M.; Mohammadi-Ivatloo, B.; Anvari-Moghaddam, A. Photovoltaic array reconfiguration under partial shading conditions for maximum power extraction: A state-of-the-art review and new solution method. Energy Convers. Manag. 2022, 258, 115468. [Google Scholar] [CrossRef]
  6. Fathy, A. Recent meta-heuristic grasshopper optimization algorithm for optimal reconfiguration of partially shaded PV array. Sol. Energy 2018, 171, 638–651. [Google Scholar] [CrossRef]
  7. Huang, Y.-P.; Huang, M.-Y.; Ye, C.-E. A Fusion Firefly Algorithm With Simplified Propagation for Photovoltaic MPPT Under Partial Shading Conditions. IEEE Trans. Sustain. Energy 2020, 11, 2641–2652. [Google Scholar] [CrossRef]
  8. Vankadara, S.K.; Chatterjee, S.; Balachandran, P.K.; Mihet-Popa, L. Marine Predator Algorithm (MPA)-Based MPPT Technique for Solar PV Systems under Partial Shading Conditions. Energies 2022, 15, 6172. [Google Scholar] [CrossRef]
  9. Huang, Y.-P.; Ye, C.-E.; Chen, X. A Modified Firefly Algorithm with Rapid Response Maximum Power Point Tracking for Photovoltaic Systems under Partial Shading Conditions. Energies 2018, 11, 2284. [Google Scholar] [CrossRef] [Green Version]
  10. Cappelletti, A.; Catelani, M.; Ciani, L.; Kazimierczuk, M.K.; Reatti, A. Practical Issues and Characterization of a Photovoltaic/Thermal Linear Focus $20\times $ Solar Concentrator. IEEE Trans. Instrum. Meas. 2016, 65, 2464–2475. [Google Scholar] [CrossRef]
  11. Alves, T.; Torres, J.P.N.; Marques Lameirinhas, R.A.; Fernandes, C.A.F. Different Techniques to Mitigate Partial Shading in Photovoltaic Panels. Energies 2021, 14, 3863. [Google Scholar] [CrossRef]
  12. Corti, F.; Laudani, A.; Lozito, G.M.; Reatti, A. Computationally Efficient Modeling of DC-DC Converters for PV Applications. Energies 2020, 13, 5100. [Google Scholar] [CrossRef]
  13. Chalh, A.; El Hammoumi, A.; Motahhir, S.; El Ghzizal, A.; Derouich, A.; Masud, M.; AlZain, M.A. Investigation of Partial Shading Scenarios on a Photovoltaic Array’s Characteristics. Electronics 2022, 11, 96. [Google Scholar] [CrossRef]
  14. Nguyen-Duc, T.; Le-Viet, T.; Nguyen-Dang, D.; Dao-Quang, T.; Bui-Quang, M. Photovoltaic Array Reconfiguration under Partial Shading Conditions Based on Short-Circuit Current Estimated by Convolutional Neural Network. Energies 2022, 15, 6341. [Google Scholar] [CrossRef]
  15. Díaz, M.; Muñoz, J.; Rivera, M.; Rohten, J. A Comprehensive Control Strategy for a Push–Pull Microinverter Connected to the Grid. Energies 2023, 16, 3196. [Google Scholar] [CrossRef]
  16. Raj, R.D.A.; Naik, K.A. Optimal reconfiguration of PV array based on digital image encryption algorithm: A comprehensive simulation and experimental investigation. Energy Convers. Manag. 2022, 261, 115666. [Google Scholar] [CrossRef]
  17. Mehedi, I.; Salam, Z.; Ramli, M.; Chin, V.; Bassi, H.; Rawa, M.; Abdullah, M. Critical evaluation and review of partial shading mitigation methods for grid-connected PV system using hardware solutions: The module-level and array-level approaches. Renew. Sustain. Energy Rev. 2021, 146, 111138. [Google Scholar] [CrossRef]
  18. Belhachat, F.; Larbes, C. PV array reconfiguration techniques for maximum power optimization under partial shading conditions: A review. Sol. Energy 2021, 230, 558–582. [Google Scholar] [CrossRef]
  19. Kour, J.; Shukla, A. Comparative analysis of different reconfiguration schemes for power enhancement under various shading scenarios. Sol. Energy 2021, 230, 91–108. [Google Scholar] [CrossRef]
  20. Srinivasan, A.; Devakirubakaran, S.; Sundaram, B.M. Mitigation of mismatch losses in solar PV system–Two-step reconfiguration approach. Sol. Energy 2020, 206, 640–654. [Google Scholar] [CrossRef]
  21. Pillai, D.S.; Rajasekar, N.; Ram, J.P.; Chinnaiyan, V.K. Design and testing of two phase array reconfiguration procedure for maximizing power in solar PV systems under partial shade conditions (PSC). Energy Convers. Manag. 2018, 178, 92–110. [Google Scholar] [CrossRef]
  22. Huang, Y.-P.; Chen, X.; Ye, C.-E. Implementation of a modified circuit reconfiguration strategy in high concentration photovoltaic modules under partial shading conditions. Sol. Energy 2019, 194, 628–648. [Google Scholar] [CrossRef]
  23. Nasiruddin, I.; Khatoon, S.; Jalil, M.F.; Bansal, R. Shade diffusion of partial shaded PV array by using odd-even structure. Sol. Energy 2019, 181, 519–529. [Google Scholar] [CrossRef]
  24. Reddy, S.S.; Yammani, C. Odd-Even-Prime pattern for PV array to increase power output under partial shading conditions. Energy 2020, 213, 118780. [Google Scholar] [CrossRef]
  25. Rezazadeh, S.; Moradzadeh, A.; Hashemzadeh, S.M.; Pourhossein, K.; Mohammadi-Ivatloo, B.; Hosseini, S.H. A novel prime numbers-based PV array reconfiguration solution to produce maximum energy under partial shade conditions. Sustain. Energy Technol. Assess. 2021, 47, 101498. [Google Scholar] [CrossRef]
  26. Krishnan, V.R.; Blaabjerg, F.; Sangwongwanich, A.; Natarajan, R. Twisted Two-Step Arrangement for Maximum Power Extraction From a Partially Shaded PV Array. IEEE J. Photovolt. 2022, 12, 871–879. [Google Scholar] [CrossRef]
  27. Venkateswari, R.; Rajasekar, N. Power enhancement of PV system via physical array reconfiguration based Lo Shu technique. Energy Convers. Manag. 2020, 215, 112885. [Google Scholar] [CrossRef]
  28. Pachauri, R.K.; Thanikanti, S.B.; Bai, J.; Yadav, V.K.; Aljafari, B.; Ghosh, S.; Alhelou, H.H. Ancient Chinese magic square-based PV array reconfiguration methodology to reduce power loss under partial shading conditions. Energy Convers. Manag. 2022, 253, 115148. [Google Scholar] [CrossRef]
  29. Sahu, H.S.; Nayak, S.K.; Mishra, S. Maximizing the Power Generation of a Partially Shaded PV Array. IEEE J. Emerg. Sel. Top. Power Electron. 2016, 4, 626–637. [Google Scholar] [CrossRef]
  30. Dhanalakshmi, B.; Rajasekar, N. Dominance square based array reconfiguration scheme for power loss reduction in solar PhotoVoltaic (PV) systems. Energy Convers. Manag. 2018, 156, 84–102. [Google Scholar] [CrossRef]
  31. Dhanalakshmi, B.; Rajasekar, N. A novel Competence Square based PV array reconfiguration technique for solar PV maximum power extraction. Energy Convers. Manag. 2018, 174, 897–912. [Google Scholar] [CrossRef]
  32. Sharma, D.; Jalil, M.F.; Ansari, M.S.; Bansal, R. A review of PV array reconfiguration techniques for maximum power extraction under partial shading conditions. Optik 2023, 275, 170559. [Google Scholar] [CrossRef]
  33. Yousri, D.; Fathy, A.; El-Saadany, E.F. Four square sudoku approach for alleviating shading effect on total-cross-tied PV array. Energy Convers. Manag. 2022, 269, 116105. [Google Scholar] [CrossRef]
  34. Aljafari, B.; Satpathy, P.R.; Madeti, S.R.K.; Vishnuram, P.; Thanikanti, S.B. Reliability Enhancement of Photovoltaic Systems under Partial Shading through a Two-Step Module Placement Approach. Energies 2022, 15, 7766. [Google Scholar] [CrossRef]
  35. Chavan, V.C.; Mikkili, S.; Senjyu, T. Hardware Implementation of Novel Shade Dispersion PV Reconfiguration Technique to Enhance Maximum Power under Partial Shading Conditions. Energies 2022, 15, 3515. [Google Scholar] [CrossRef]
  36. Mikkili, S.; Kanjune, A.; Bonthagorla, P.K.; Senjyu, T. Non-Symmetrical (NS) Reconfiguration Techniques to Enhance Power Generation Capability of Solar PV System. Energies 2022, 15, 2124. [Google Scholar] [CrossRef]
  37. Ye, C.-E.; Tai, C.-C.; Huang, Y.-P.; Chen, J.-J. Dispersed partial shading effect and reduced power loss in a PV array using a complementary SuDoKu puzzle topology. Energy Convers. Manag. 2021, 246, 114675. [Google Scholar] [CrossRef]
  38. Krishna, S.G.; Moger, T. Optimal SuDoKu Reconfiguration Technique for Total-Cross-Tied PV Array to Increase Power Output Under Non-Uniform Irradiance. IEEE Trans. Energy Convers. 2019, 34, 1973–1984. [Google Scholar] [CrossRef]
  39. Yadav, A.S.; Mukherjee, V. Line losses reduction techniques in puzzled PV array configuration under different shading conditions. Sol. Energy 2018, 171, 774–783. [Google Scholar] [CrossRef]
  40. Tatabhatla, V.M.R.; Agarwal, A.; Kanumuri, T. Minimising the power loss of solar photo voltaic array through efficient reconfiguration of panels. Proc. Inst. Mech. Eng. Part J. Power Energy 2020, 234, 690–708. [Google Scholar] [CrossRef]
  41. Bingöl, O.; Özkaya, B. Analysis and comparison of different PV array configurations under partial shading conditions. Sol. Energy 2018, 160, 336–343. [Google Scholar] [CrossRef]
  42. Manjunath; Suresh, H.; Rajanna, S. Maximization of photo-voltaic array power output through Lo Sho Square shade dispersion technique based re-configuration scheme. Energy Convers. Manag. 2022, 260, 115588. [Google Scholar] [CrossRef]
  43. Krishna, G.S.; Moger, T. Reconfiguration strategies for reducing partial shading effects in photovoltaic arrays: State of the art. Sol. Energy 2019, 182, 429–452. [Google Scholar] [CrossRef]
  44. Yadav, V.K.; Yadav, A.; Yadav, R.; Mittal, A.; Wazir, N.H.; Gupta, S.; Pachauri, R.K.; Ghosh, S. A novel reconfiguration technique for improvement of PV reliability. Renew. Energy 2022, 182, 508–520. [Google Scholar] [CrossRef]
Figure 1. (a) an 8 × 8 PV array connected in TCT; (b) the equivalent circuit of the PV array.
Energies 16 04910 g001
Figure 2. (a) Original arrangement; (b) MC-SDKP topology.
Energies 16 04910 g002
Figure 3. The arrangements of the modules in the PV array based on the different reconfiguration topologies.
Energies 16 04910 g003
Figure 4. The patterns of shading representing the nine pre-determined PSCs with the TCT configuration.
Energies 16 04910 g004
Figure 5. The patterns of shading representing the nine pre-determined PSCs with the MC-SDKP topology.
Energies 16 04910 g005
Figure 6. Comparison of the box plots for the (a) power loss and (b) power improvement yielded by the five configurations used under nine PSCs and five different temperature conditions.
Energies 16 04910 g006
Figure 7. Comparison of the P-V curves of the five configurations used for the patterns of shading representing the nine pre-determined PSCs.
Energies 16 04910 g007
Table 1. Specifications for a single experimental PV module.
VariableSpec.
Open circuit voltage (Voc)22 V
Short circuit current (Isc)4.7 A
Voltage at the MPP (Vmp)18 V
Current at the MPP (Imp)4.4 A
Power at the MPP (Pmp)79.2 W
Parallel strings (NP)1
Series-connected modules per strings (Ns)1
Table 2. Comparison of the estimated differences in row currents and power output when the five topologies were applied.
TCTOdd-EvenOptimal SDKPC-SDKPMC-SDKP
PatternVarrayΔIRParrayVarrayΔIRParrayVarrayΔIRParrayVarrayΔIRParrayVarrayΔIRParray
#18 Vm2 Im48 Pm8 Vm0.4 Im54.4 Pm8 Vm0.2 Im56 Pm8 Vm0.2 Im56 Pm8 Vm0.2 Im56 Pm
#28 Vm2.6 Im43.2 Pm8 Vm0.8 Im52.8 Pm8 Vm0.4 Im53.6 Pm8 Vm0.4 Im53.6 Pm8 Vm0.4 Im53.6 Pm
#38 Vm2.8 Im41.6 Pm8 Vm2.8 Im41.6 Pm8 Vm0.2 Im52.8 Pm8 Vm0.6 Im51.2 Pm8 Vm0.2 Im52.8 Pm
#48 Vm3 Im40 Pm8 Vm3 Im40 Pm8 Vm0.3 Im51.2 Pm8 Vm0.5 Im50.4 Pm8 Vm0.3 Im51.2 Pm
#58 Vm3 Im40 Pm8 Vm0.6 Im49.6 Pm8 Vm0.2 Im51.2 Pm8 Vm1.6 Im45.6 Pm8 Vm0.2 Im51.2 Pm
#68 Vm2.4 Im44.8 Pm8 Vm3.2 Im38.4 Pm8 Vm2 Im44.8 Pm8 Vm2.4 Im44.8 Pm8 Vm1.2 Im48 Pm
#75 Vm4.6 Im40 Pm8 Vm2.2 Im43.2 Pm8 Vm0.9 Im49.6 Pm8 Vm0.5 Im51.2 Pm8 Vm0.7 Im50.4 Pm
#86 Vm3.4 Im40.8 Pm8 Vm3.8 Im33.6 Pm8 Vm0.5 Im45.6 Pm8 Vm0.5 Im45.6 Pm8 Vm0.3 Im46.4 Pm
#98 Vm2.1 Im47.2 Pm8 Vm2 Im48 Pm8 Vm1.1 Im50.4 Pm8 Vm0.7 Im51.2 Pm8 Vm1 Im51.2 Pm
Avg.-2.9 Im42.8 Pm-2.1 Im44.6 Pm-0.6 Im50.6 Pm-0.8 Im50.0 Pm-0.5 Im51.2 Pm
Table 3. Comparison of the simulated power output and power loss when the five topologies were applied.
TCTOdd-EvenOptimal SDKPC-SDKPMC-SDKP
Pattern #1Pmp (W)4100.24464.24488.84488.84488.8
Ploss (%)8.990.910.360.360.36
Pmp improvement (%)-8.889.489.489.48
Pattern #2Pmp (W)3752.74313.34336.34344.24336.4
Ploss (%)14.301.500.970.790.97
Pmp improvement (%)-14.9415.5515.7615.55
Pattern #3Pmp (W)3594.73594.84225.54196.24229.3
Ploss (%)15.4815.480.651.340.56
Pmp improvement (%)-017.5516.7317.65
Pattern #4Pmp (W)3441.33441.34130.04104.94121.6
Ploss (%)17.217.20.631.230.83
Pmp improvement (%)-020.0119.2819.77
Pattern #5Pmp (W)3396.54065.74103.53823.74100.3
Ploss (%)17.71.490.577.350.65
Pmp improvement (%)-19.720.8212.5820.72
Pattern #6Pmp (W)3800.93407.83886.83846.74072.5
Ploss (%)9.9719.297.948.893.54
Pmp improvement (%)-−10.342.261.217.15
Pattern #7Pmp (W)3303.83724.64112.34174.44153.8
Ploss (%)21.7511.782.61.131.62
Pmp improvement (%)12.7424.4726.3525.73
Pattern #8Pmp (W)3186.03004.43732.03712.43742.4
Ploss (%)15.7120.521.271.790.99
Pmp improvement (%)-−5.717.1416.5217.46
Pattern #9Pmp (W)3999.74049.04202.04254.24216.0
Ploss (%)7.316.162.621.412.30
Pmp improvement (%)-1.235.066.365.41
Table 4. Comparison of the averaged performances of the five topologies.
MethodAveraged Pmp (W)Standard DeviationAveraged Ploss (%)Standard DeviationAveraged Pmp Improvement (%)Standard Deviation
TCT3619.5315.414.274.67--
Odd-Even3785474.110.488.084.6110.02
Optimal SDKP4135.3224.71.962.4014.707.51
C-SDKP4105.1259.82.703.1213.817.43
MC-SDKP4162.3204.41.311.0215.446.77
Table 5. Comparison of the simulated power output, loss and improvement of the five topologies at different temperatures.
TCTOdd-EvenOptimal SDKPC-SDKPMC-SDKP
5 °CAveraged Pmp (W)3887.84016.44435.34389.64468.0
Averaged Ploss (%)13.4610.952.092.871.41
Averaged Pmp improvement (%)-3.0213.3912.4214.15
15 °CAveraged Pmp (W)3698.33885.54283.34239.64314.1
Averaged Ploss (%)14.7110.922.253.021.59
Averaged Pmp improvement (%)-4.6214.9714.0415.73
25 °CAveraged Pmp (W)3619.53785.04135.34105.14162.3
Averaged Ploss (%)14.2710.481.962.701.31
Averaged Pmp improvement (%)-4.6114.7013.8115.44
35 °CAveraged Pmp (W)3441.93614.43967.93930.13994.3
Averaged Ploss (%)13.9910.201.832.551.22
Averaged Pmp improvement (%)-4.5814.4713.6015.16
45 °CAveraged Pmp (W)3308.53472.83804.23768.53829.2
Averaged Ploss (%)13.739.961.782.491.17
Averaged Pmp improvement (%)-4.5414.1913.3314.87
Table 6. Comparison of the average performance of each of the five topologies at five different temperatures.
MethodAveraged Pmp (W)Standard DeviationAveraged Ploss (%)Standard DeviationAveraged Pmp Improvement (%)Standard Deviation
TCT3627.7359.714.034.38--
Odd-Even3781.2494.010.57.764.279.51
Optimal SDKP4131.8311.61.982.2814.347.05
C-SDKP4101.5333.72.732.9713.446.80
MC-SDKP4158.9300.21.340.9915.076.28
Disclaimer/Publisher’s Note: The statements, opinions and data contained in all publications are solely those of the individual author(s) and contributor(s) and not of MDPI and/or the editor(s). MDPI and/or the editor(s) disclaim responsibility for any injury to people or property resulting from any ideas, methods, instructions or products referred to in the content.

