Article

Design and Performance Analysis of a Novel Integrated Solar Combined Cycle (ISCC) with a Supercritical CO2 Bottom Cycle

1
Key Laboratory of Power Station Energy Transfer Conversion and System, Ministry of Education, National Thermal Power Engineering & Technology Research Center, School of Energy, Power and Mechanical Engineering, North China Electric Power University, Beijing 102206, China
2
China Academy of Building Research, Beijing 100013, China
*
Author to whom correspondence should be addressed.
Energies 2023, 16(12), 4833; https://doi.org/10.3390/en16124833
Submission received: 30 May 2023 / Revised: 17 June 2023 / Accepted: 18 June 2023 / Published: 20 June 2023
(This article belongs to the Topic Energy Saving and Energy Efficiency Technologies)

Abstract

:
The integrated solar combined cycle (ISCC) system is a proven solution for grid-connected power generation from solar energy. How to further improve the ISCC system efficiency and propose a more efficient system solution has become a research focus. A novel gas turbine combined cycle (GTCC) benchmark system is proposed by replacing the conventional steam Rankine bottom cycle with a supercritical CO2 Brayton cycle, whose output power and efficiency are increased by 9.07 MW and 1.3%, respectively, compared to those of the conventional GTCC system. Furthermore, the novel ISCC systems are established with the parabolic trough solar collector (PTC) and the solar tower (ST) collector coupled to the novel GTCC system. Thermal performance analysis, exergy performance analysis, and the sensitivity analysis of the ISCC systems have been performed, and the results show that the system efficiencies of both ISCC systems are lower than that of the GTCC system, at 57.1% and 57.5%, respectively, but the power generation of the ISCC system with PTC is greater than that of the benchmark system, while that of the ISCC system with ST is less than that of the benchmark system. The photoelectric efficiency of the ISCC system with PTC is 27.6%, which is 2.1% greater than that of ISCC system with ST. In the ISCC system with PTC, the components with the highest exergy destruction and the lowest exergy efficiency are the combustion chamber, and PTC, respectively. ST is the component with the highest exergy destruction and the lowest exergy efficiency in the ISCC system with ST. With the increase in direct normal irradiance (DNI), the total output power, solar energy output power, and photoelectric efficiency of the ISCC system with PTC increase, while the system efficiency decreases; the solar energy output power and photoelectric efficiency of the ISCC system with ST increase, while the total output power and system efficiency decrease. The photoelectric efficiency of the ISCC system with PTC is greater when the DNI is greater than 600 W/m2; conversely, the photoelectric efficiency of the ISCC system with ST is greater. After sensitivity analysis, the optimal intercooler pressure for the ISCC system is 11.3 MPa.

1. Introduction

In the context of the energy crisis and increasingly stringent carbon emissions policies, it is imperative to optimize the energy structure and increase the share of power generation from renewable energy sources, such as solar energy and wind energy. Among the numerous solutions, the integrated solar combined cycle (ISCC) system is one of the most effective solutions, which is based on the gas turbine combined cycle (GTCC) benchmark system coupled with solar energy. This system not only ensures a stable power supply but also is more efficient than the more costly solar electric generating system (SEGS) [1]. The concept was first developed through Luz International Corporation [2]. The solar energy could be coupled to the bottom cycle of the GTCC to improve the thermodynamic parameters and mass flowrate of the bottom Rankine cycle working medium, or to the topping Brayton cycle to heat the pressurized air at compressor outlet [3].
A great deal of research on the thermal performance and economics of ISCC systems have been carried out by many academics [4,5,6,7]. These studies have been carried out for ISCC systems in fixed form or even for ISCC systems that are already in operation and generating electricity. The issue of how to improve the performance of ISCC systems has been studied from several different perspectives by a variety of scholars. Some scholars have improved ISCC systems from the aspect of solar energy. Elmorsy et al. [8] conducted a comparative study of three solar concentration schemes: the parabolic trough solar collector (PTC), the Linear Fresnel collector, and the solar tower (ST) collector, and concluded that the ISCC system with Fresnel collectors had a maximum efficiency of 44.1%, while the ISCC system with ST collectors had a minimum efficiency of 33.2%. Rovira et al. [9] studied the effects of two solar heat exchange methods, direct steam generation (DSG) and heat transfer fluid (HTF), on the thermal performance of ISCC systems with PTC, and showed that the method of DSG not only had the greater photothermal efficiency, but also reduced the heat exchanger’s exergy destruction. Reyes-Belmonte et al. [10] proposed a novel ISCC system based on particle-in-tube fluidized-bed solar receiver technology, where the efficiency of the ISCC system reached 51.04% at the turbine inlet temperature (TIT) of 950 °C. Some researchers made improvements for the gas turbine Brayton topping cycle side of the ISCC system. In Shaaban’s study [11], the compressor of the gas turbine was designed with intercooling and an organic Rankine cycle (ORC) was integrated to recover the heat of the pressurized air, which not only increased the output power but also reduced the impact of ambient temperature fluctuations on system performance. Rovira et al. [12] proposed an ISCC system based on a partial recuperation gas turbine, and this novel system improved its efficiency by 0.8% and 1.1% compared to the most sophisticated ISCC system at Almeria and Las Vegas, while its levelized cost of energy (LCOE) values decreased by 0.9% and 1.1%, respectively. Based on the characteristics of the off-design operation of the gas turbine and the variable irradiation of the solar energy, some scholars have evaluated the thermal and economic characteristics of ISCC systems under different operating strategies [13,14]. There are also some scholars who have conducted comparative studies for the integration position of the solar energy in the ISCC system. Ameri et al. [15] compared the share of the exergy destruction of every component in ISCC systems with solar energy integrated in the evaporator and superheater of the steam Rankine cycle, and performed an energy life cycle assessment, which yielded a cumulative energy demand of 6.86 MJ/kWh for the ISCC plant. Li et al. [16] studied an ISCC system with the two-stage DSG heat exchangers and concluded that the net photoelectric efficiency reached 30%, which was much higher than that of the ISCC system with one-stage solar integration, while the system could reduce the approach point temperature difference and increase the mass flowrate of the steam in bottom cycle. Li et al. [17] investigated a two-stage integration ISCC system with two types of solar energy heat transfer modes, the DSG and evacuated tube, and concluded that the system could achieve higher photoelectric efficiency and lower expense of power generation over an ISCC system with one-stage integration. Duan et al. [18] compared the thermal performance of ISCC systems with solar energy integrated into the topping and bottom cycles, and concluded that the ISCC system with solar energy coupled in the topping cycle had a greater power generation efficiency at higher direct normal irradiance (DNI) and ambient temperature, and conversely, the ISCC system with solar energy coupled into the bottom cycle had a greater power generation efficiency. Furthermore, the annual fuel consumptions of the ISCC systems with solar energy integrated in the topping cycle and the bottom cycle were 4.412 × 10⁸ kg and 4.44 × 10⁸ kg, respectively, and their annual photoelectric efficiencies were 23.93% and 23.05%, respectively.
According to the previous optimization study [19], this study chose a more efficient power generation process to replace the existing steam Rankine cycle to achieve the higher ISCC power generation efficiency. A number of scholars have already performed a lot of research in this direction. Wang et al. [20] derived a novel ISCC system with low temperature waste heat utilization by superimposing the ORC on the bottom cycle, and the results showed that under the condition that the DNI was 800 W/m2, the minimum exhaust gas temperature of this system was 65.89 °C, the maximum thermal efficiency was 58.33%, the exergy efficiency was 48.09%, and the minimum production cost of this system was 19.3 $/GJ. Rovira et al. [21] proposed an ISCC system with the recently developed double recuperative double expansion (DRDE) cycle as the bottom cycle, and compared to the conventional ISCC system, the annual average heat consumption rate and LCOE of this novel system were lower. However, compared to the conventional steam Rankine cycle, the supercritical CO2 Brayton cycle is gradually proposed as an alternative to the GTCC bottom cycle due to its simple layout, compact equipment, and higher efficiency [22,23,24,25]. Cho et al. [22] analyzed the advantages and disadvantages of different types of supercritical CO2 Brayton cycles versus steam Rankine cycles in terms of thermal performance and concluded that for the choice of GTCC bottom cycle, the cascaded supercritical CO2 Brayton cycle was the best option. Thanganadar et al. [23] derived a novel GTCC system with multiple cascaded supercritical CO2 Brayton cycles as the bottom cycles via the Pareto solution obtained by a multi-objective optimization algorithm, and its efficiency was improved by 1.4% compared to the pre-optimized system. Kimzey et al. [24] compared supercritical CO2 Brayton bottom cycles integrated to two types of gas turbine units, LM6000 and H-class, concluding that supercritical CO2 Brayton bottom cycles were more appropriate for low temperature applications. Huck et al. [25] compared the thermal performance of the supercritical CO2 Brayton bottom cycle and a multi-pressure reheat Rankine bottom cycle integrated into the heavy-duty gas turbine and micro aeroderivative gas turbine, respectively, and concluded that the supercritical CO2 Brayton cycle was superior to the Rankine cycle at a very high component isentropic efficiency and operation pressure of the working medium.
The thermal performance and economics of thermodynamic systems with the gas turbine as the topping cycle and the supercritical CO2 Brayton cycle as the bottom cycle have been studied by many scholars [26,27,28,29,30,31,32,33,34]; however, all relevant studies are only for small scale distributed energy generation systems or multi-generation systems, and in order to supply heat or cool, sub-cycles such as the ORC cycle, the absorption refrigeration cycle, etc. have to be coupled into the system. Research on large scale GTCC power generation systems with supercritical CO2 Brayton cycles as the bottom cycle are relatively scarce, and research on ISCC power generation systems that integrate solar energy into this novel highly efficient GTCC system are lacking. In this paper, the GTCC with supercritical CO2 Brayton cycle as the bottom cycle is utilized as a benchmark system to integrate with solar energy by PTC and ST concentrating solar collector systems, respectively, and the differences in the components exergy destruction and exergy efficiencies between these two novel ISCC systems and the benchmark GTCC system are compared and analyzed. The differences in the solar efficiency, system efficiency, heat absorption, and power generation are derived with the variation of the DNI, and sensitivity analyses on the intercooling pressure of the supercritical CO2 Brayton bottom cycle are carried out.

2. System Description

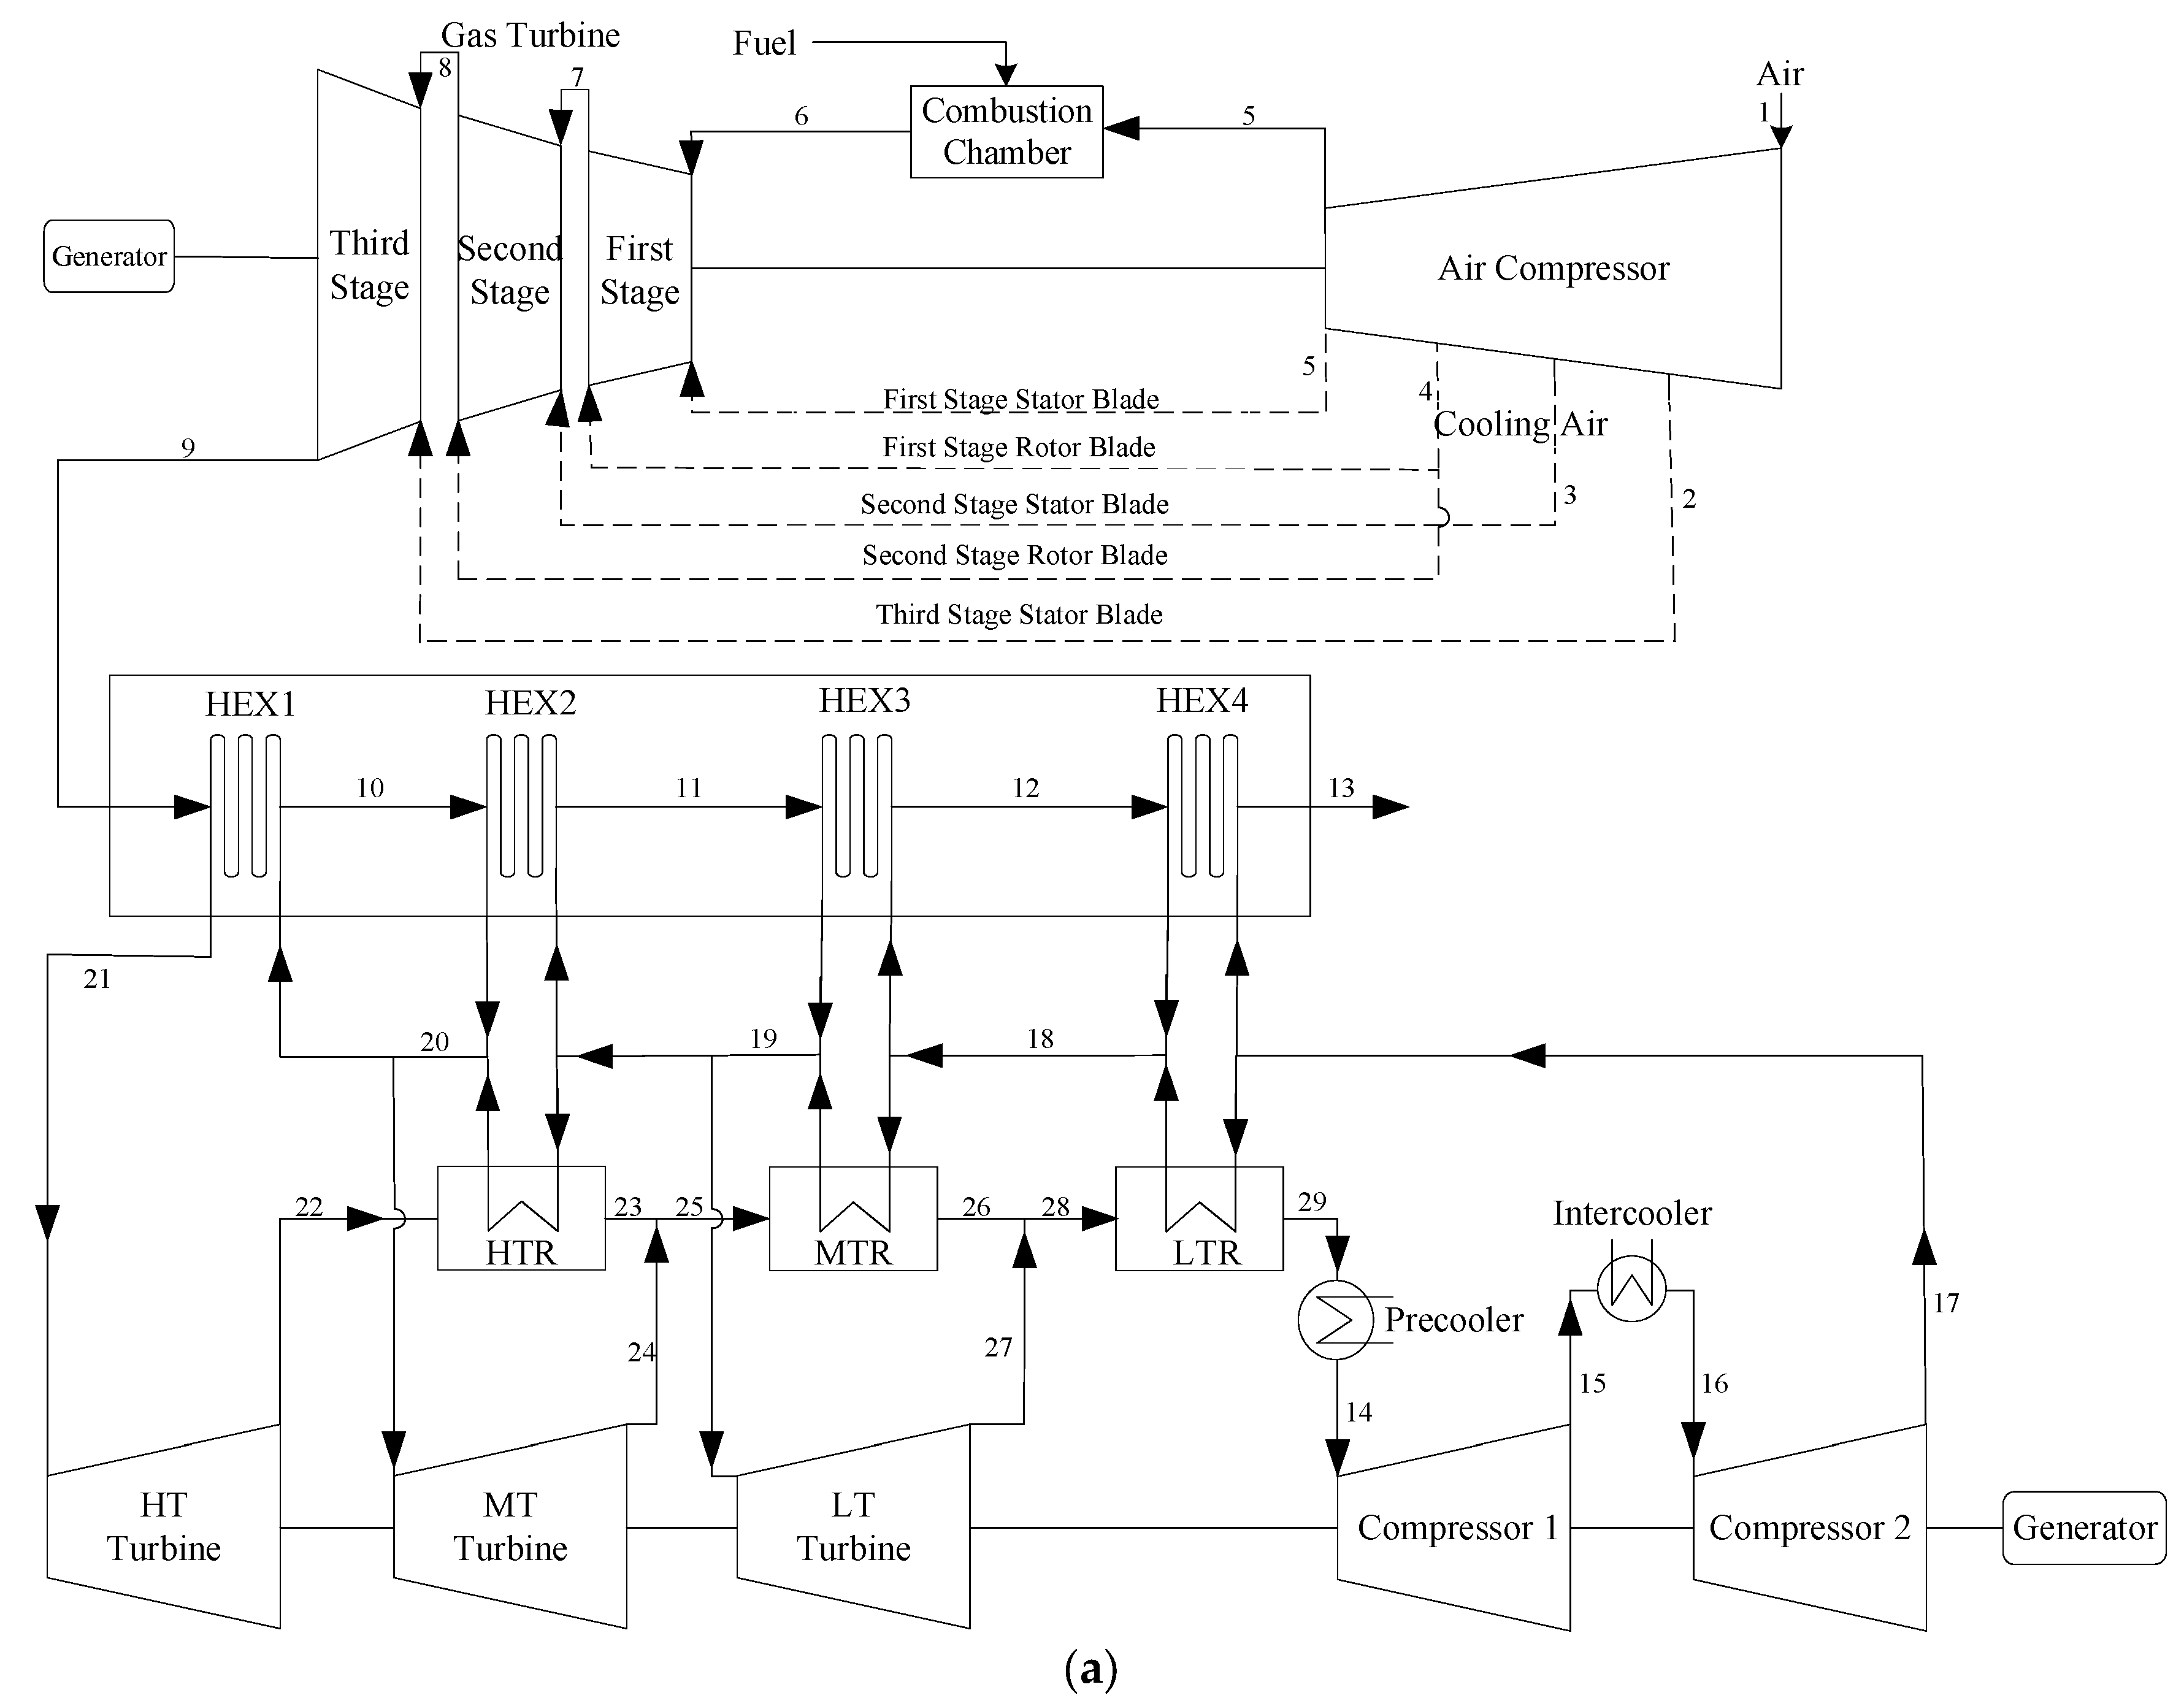
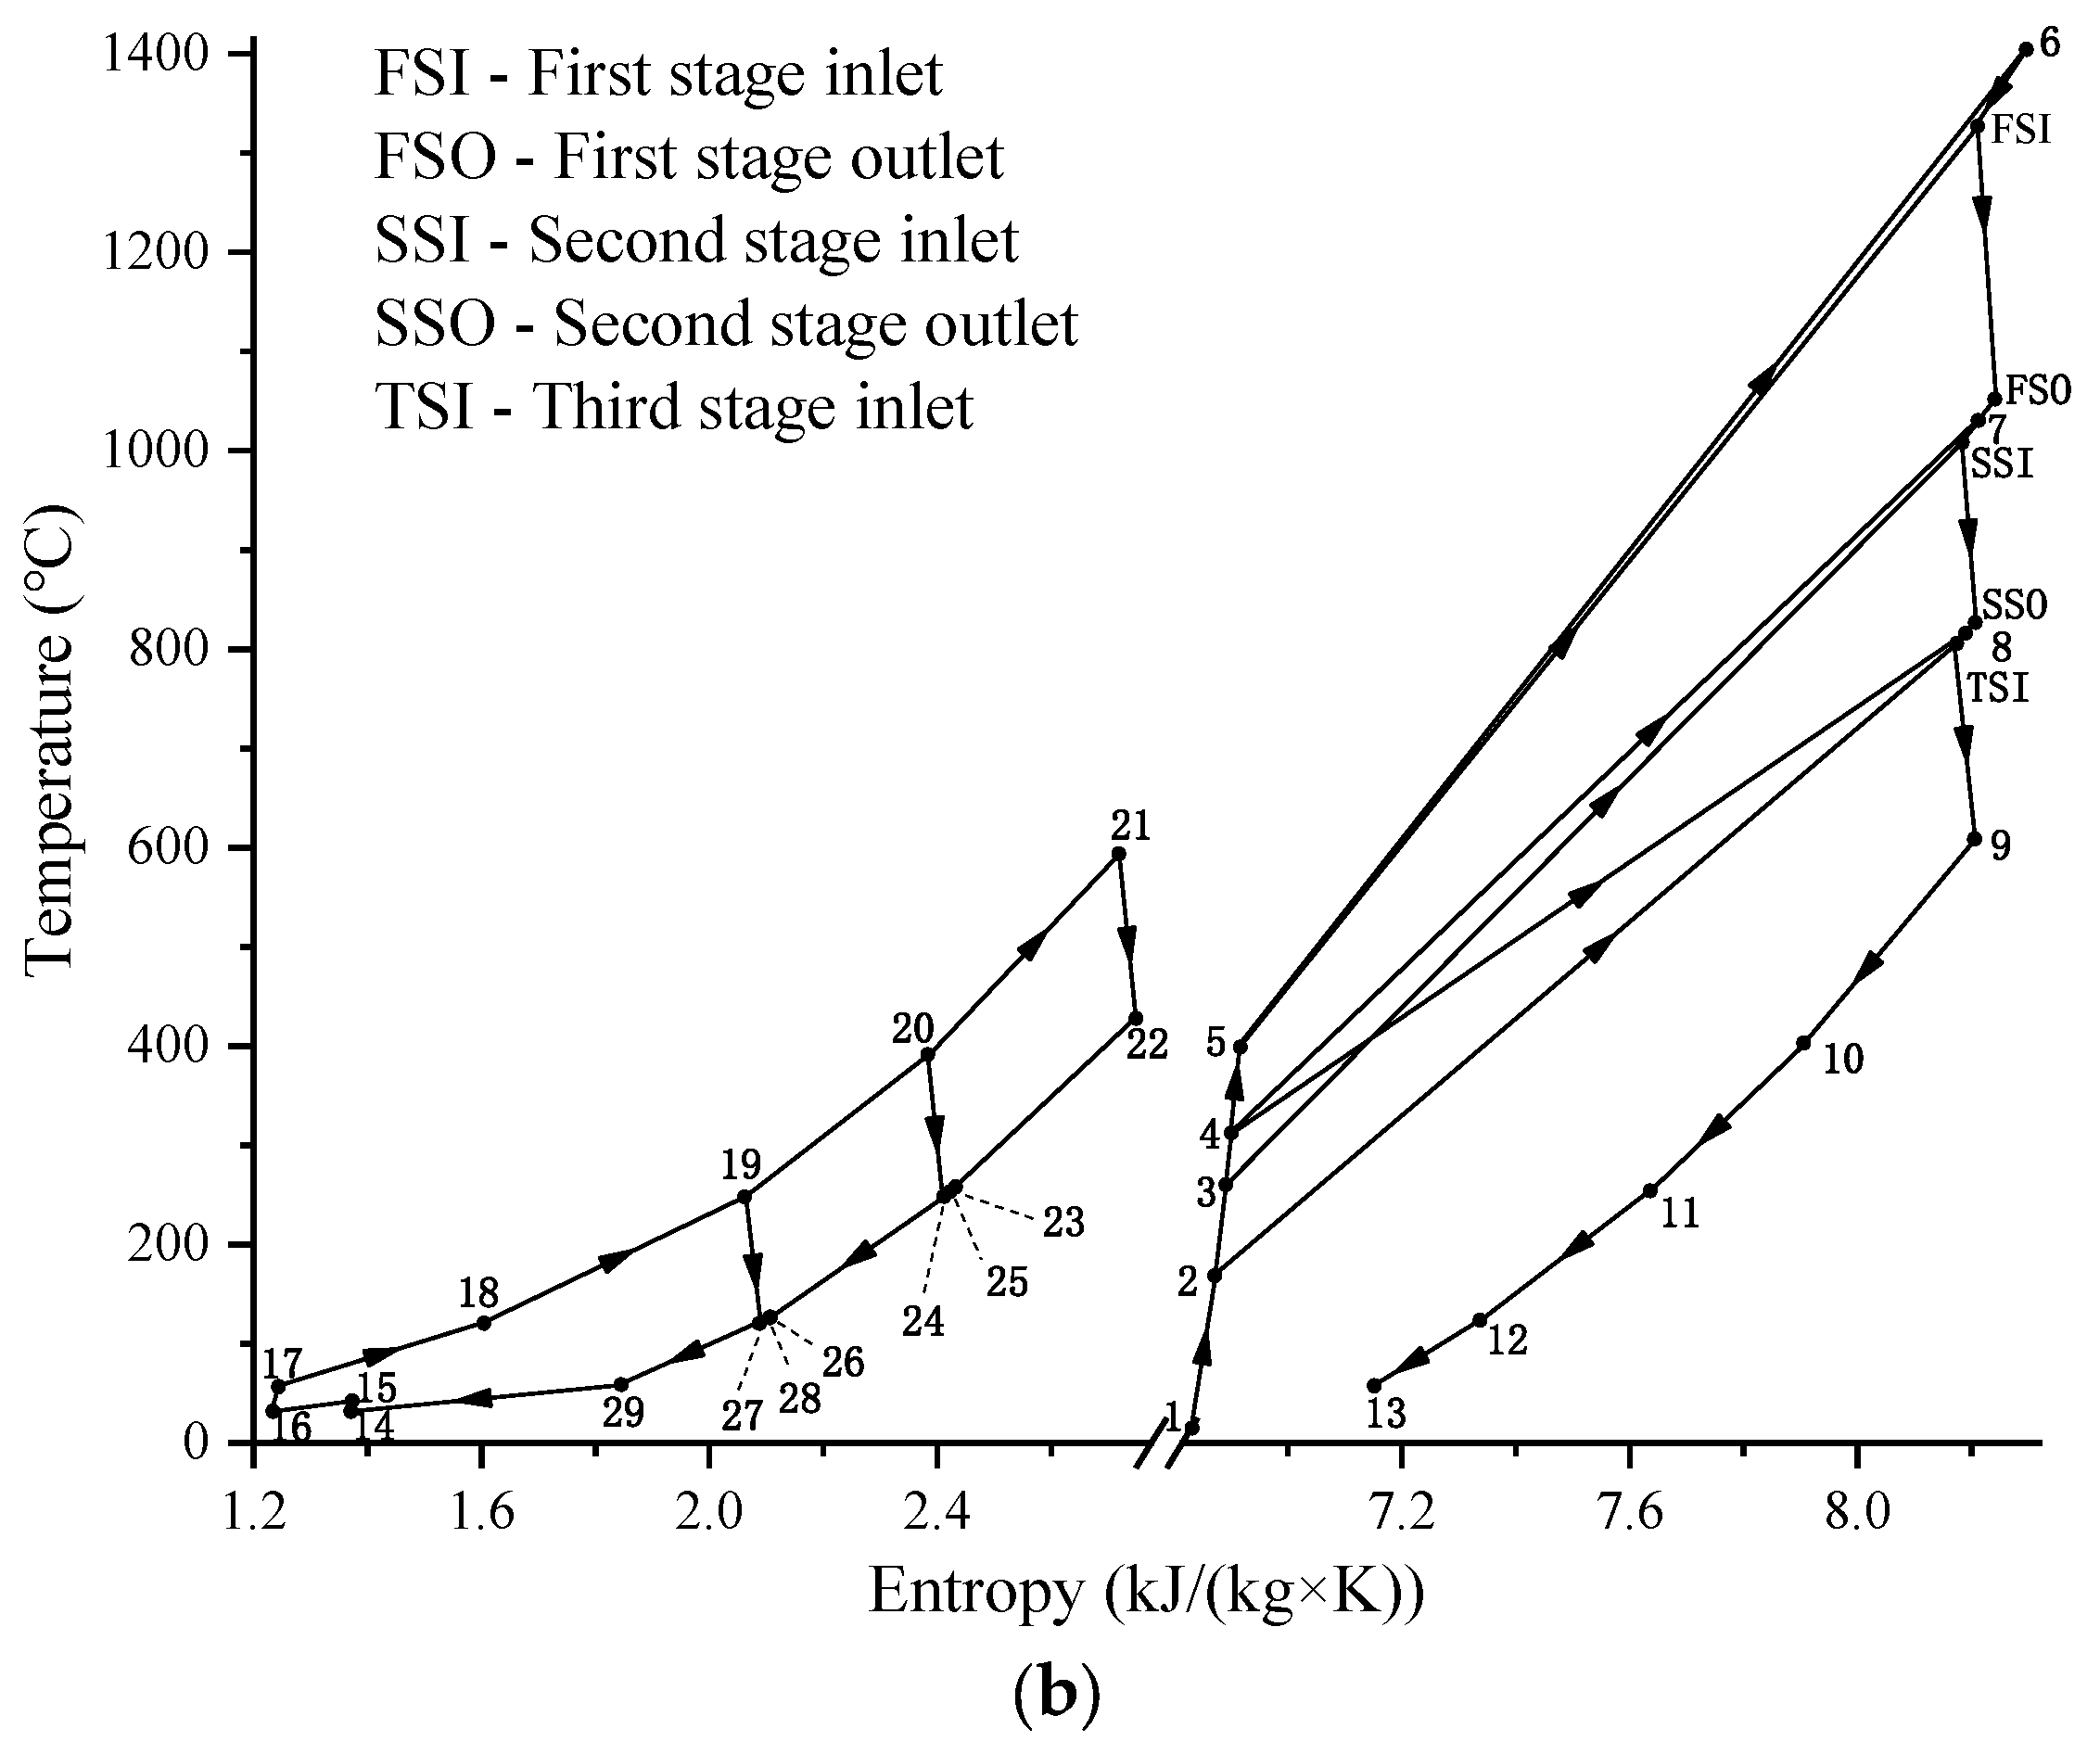
2.1. Benchmark System: GTCC System with a Supercritical CO2 Brayton Bottom Cycle

The system flowchart and T-s diagram for the GTCC system with a supercritical CO2 Brayton bottom cycle are shown in Figure 1. The topping cycle process has been described in detail in previous studies [19] and will not be reiterated here. Compared to the conventional GTCC system, the bottom cycle of this novel system is replaced by a supercritical CO2 Brayton cycle instead of a steam Rankine cycle. In the design of the bottom cycle, an intercooled, split, cascade layout is chosen, consisting of four heat exchangers in the heat recovery steam generator (HRSG), three recuperators, three turbines, one compressor with intercooling, and one precooler (PC). In the supercritical CO2 cycle, the low temperature CO2 at the outlet of the hot end of the low temperature recuperator (LTR) (state 29) first goes through the PC to cool down to approximately the critical state point (state 14), then is sent to the compressor. After the compression process to the intercooling pressure (state 15), the working medium will be sent to the intercooler (IC) for cooling. The cooled working medium (state 16) continues to be sent to the compressor for compression. After the whole compression process, the high-pressure working medium at the outlet of the compressor (state 17) is first diverted to heat exchanger 4 (HEX4) and LTR for heating and then mixing. The working medium after mixing (state 18) is then diverted for a second time to heat exchanger 3 (HEX3) and the medium temperature recuperator (MTR) for heating and then mixing. The working medium after mixing (state 19) is firstly diverted to the low temperature (LT) turbine for expansion, the other working medium is then diverted for a third time to heat exchanger 2 (HEX2) and the high temperature recuperator (HTR) for heating and then mixing. The working medium after mixing (state 20) is first diverted to the medium temperature (MT) turbine for expansion, the other working medium is heated by heat exchanger 1 (HEX1), and then the heated working medium (state 21) is sent to the high temperature (HT) turbine to expand. The working medium at the outlet of the HT turbine (state 22) first passes through the HTR to release the heat (state 23), and then mixes with the working medium at the outlet of the MT turbine (state 24). After mixing, the working medium (state 25) enters the MTR to release the heat (state 26), and then mixes with the working medium at the outlet of the LT turbine (state 27). After mixing, the working medium (state 28) enters the LTR to release the heat, after which it (state 29) returns to the PC to continue the next cycle process.

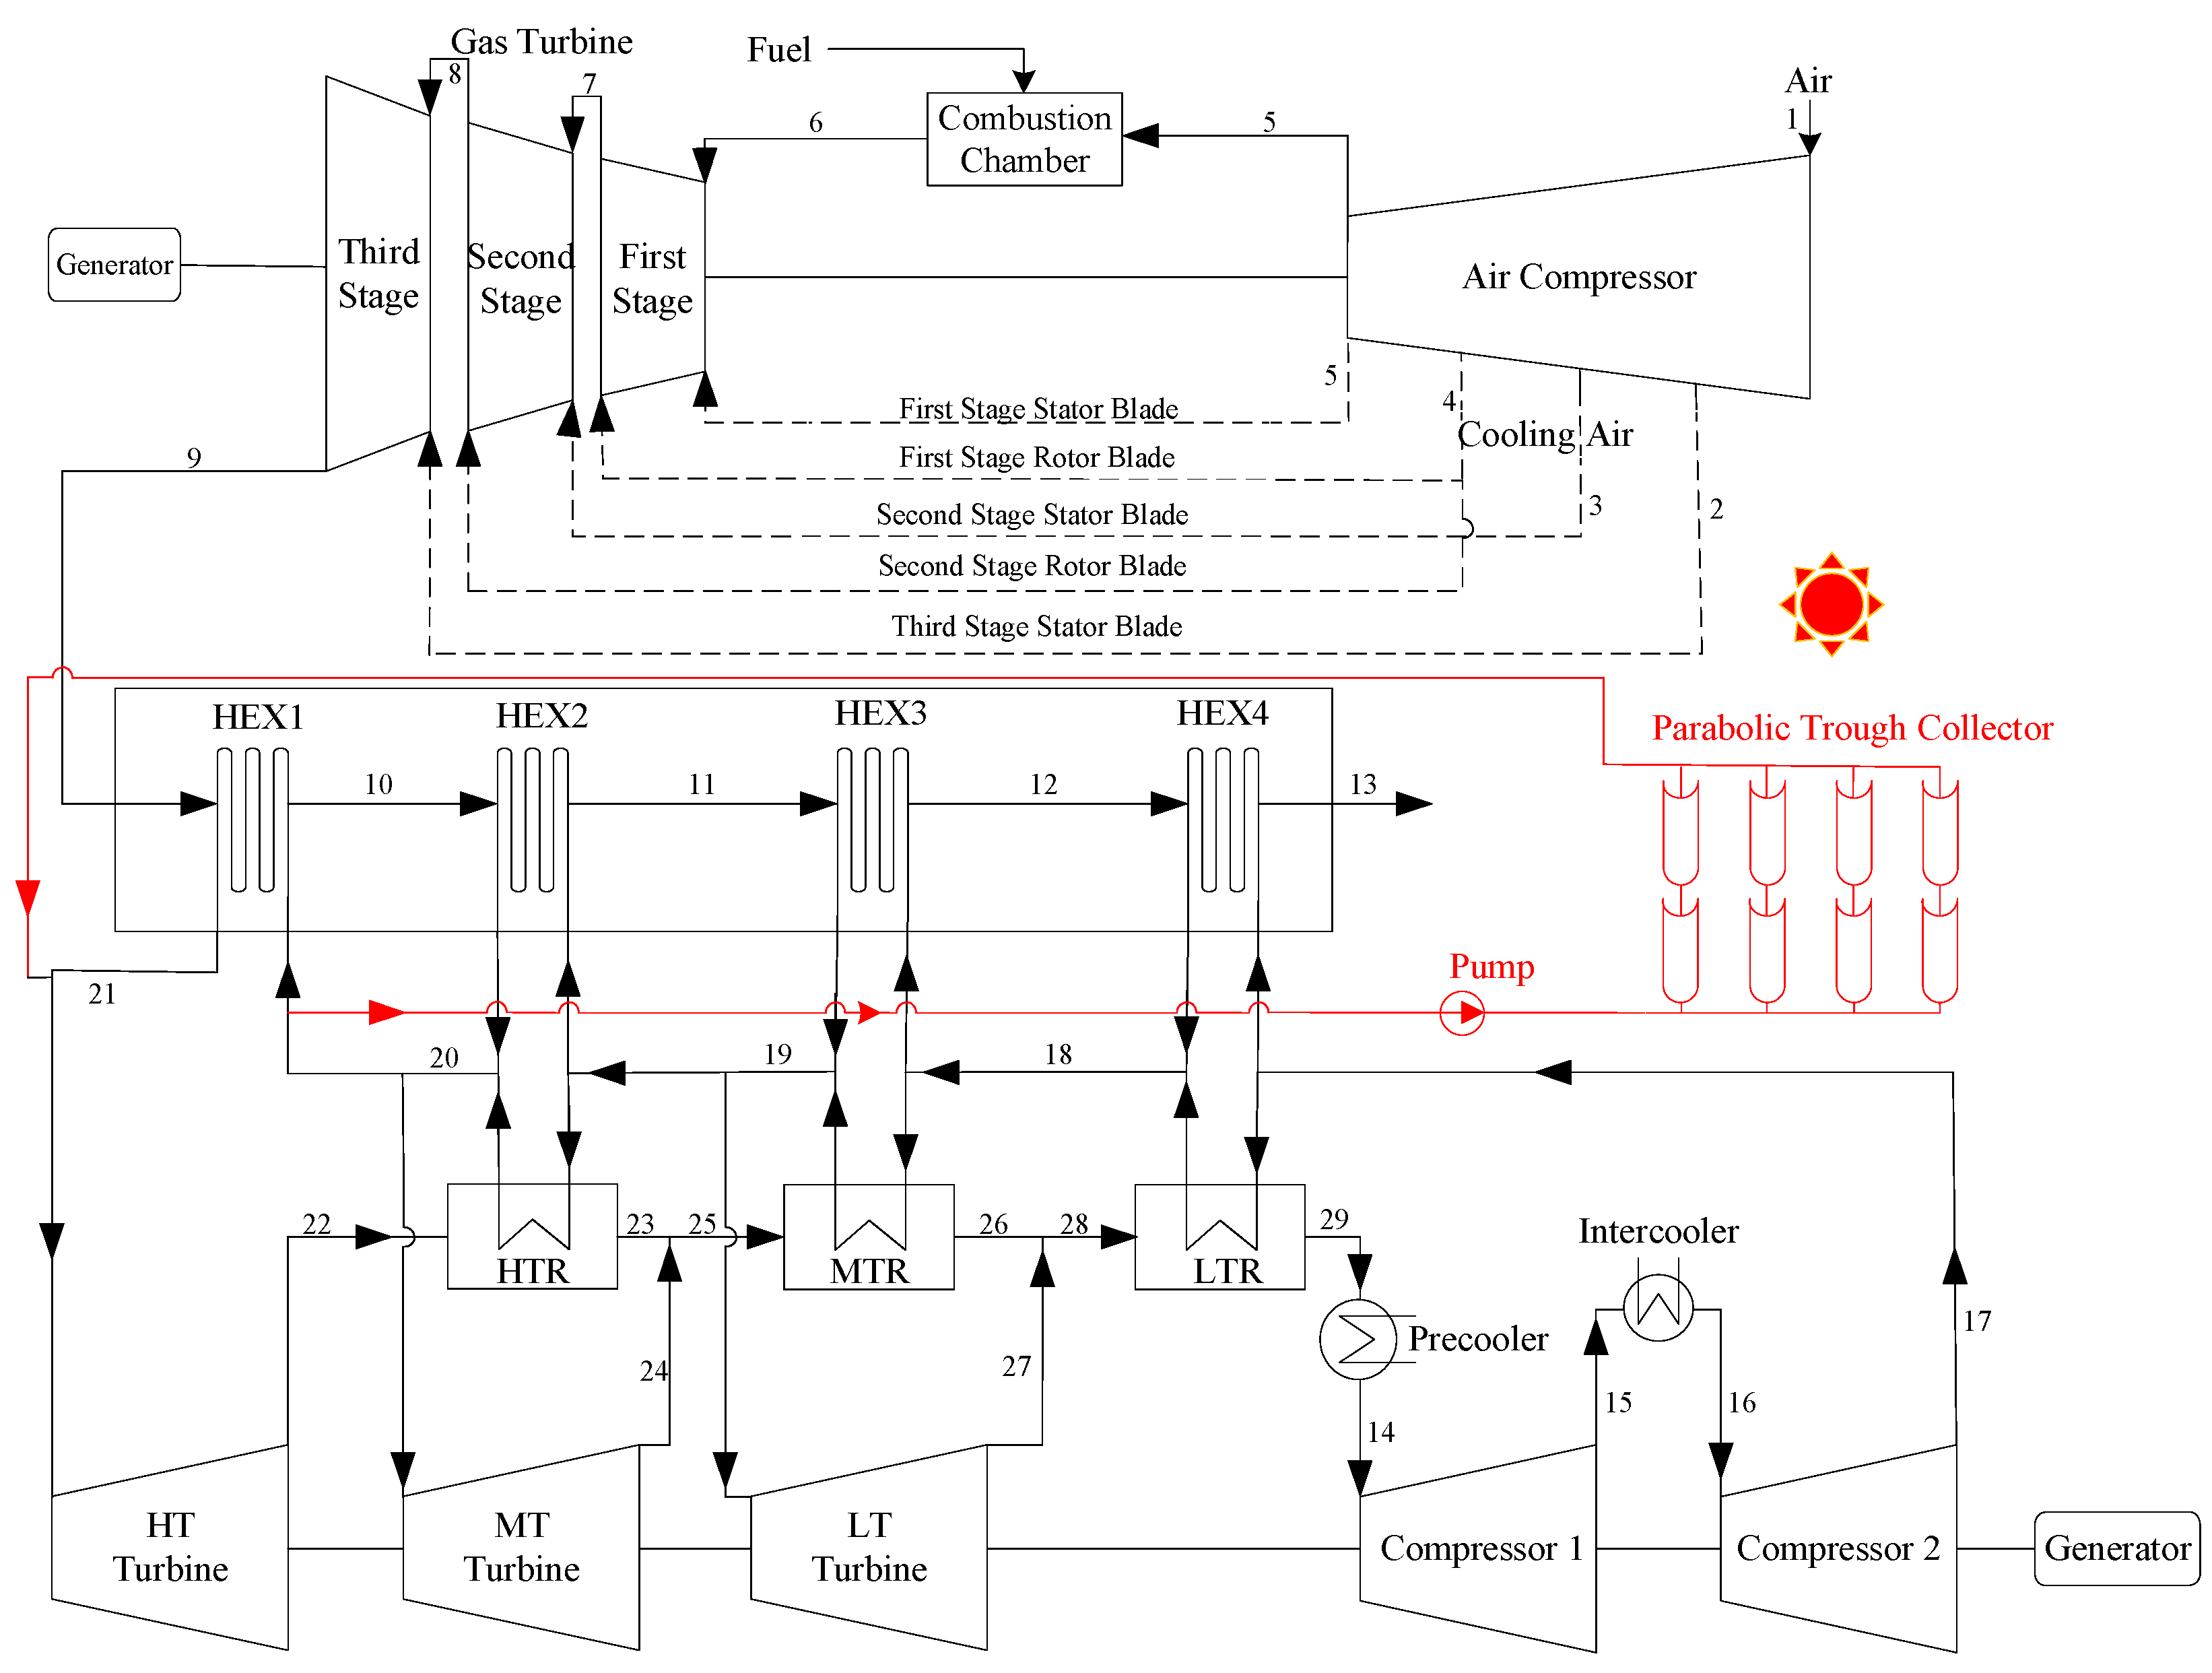
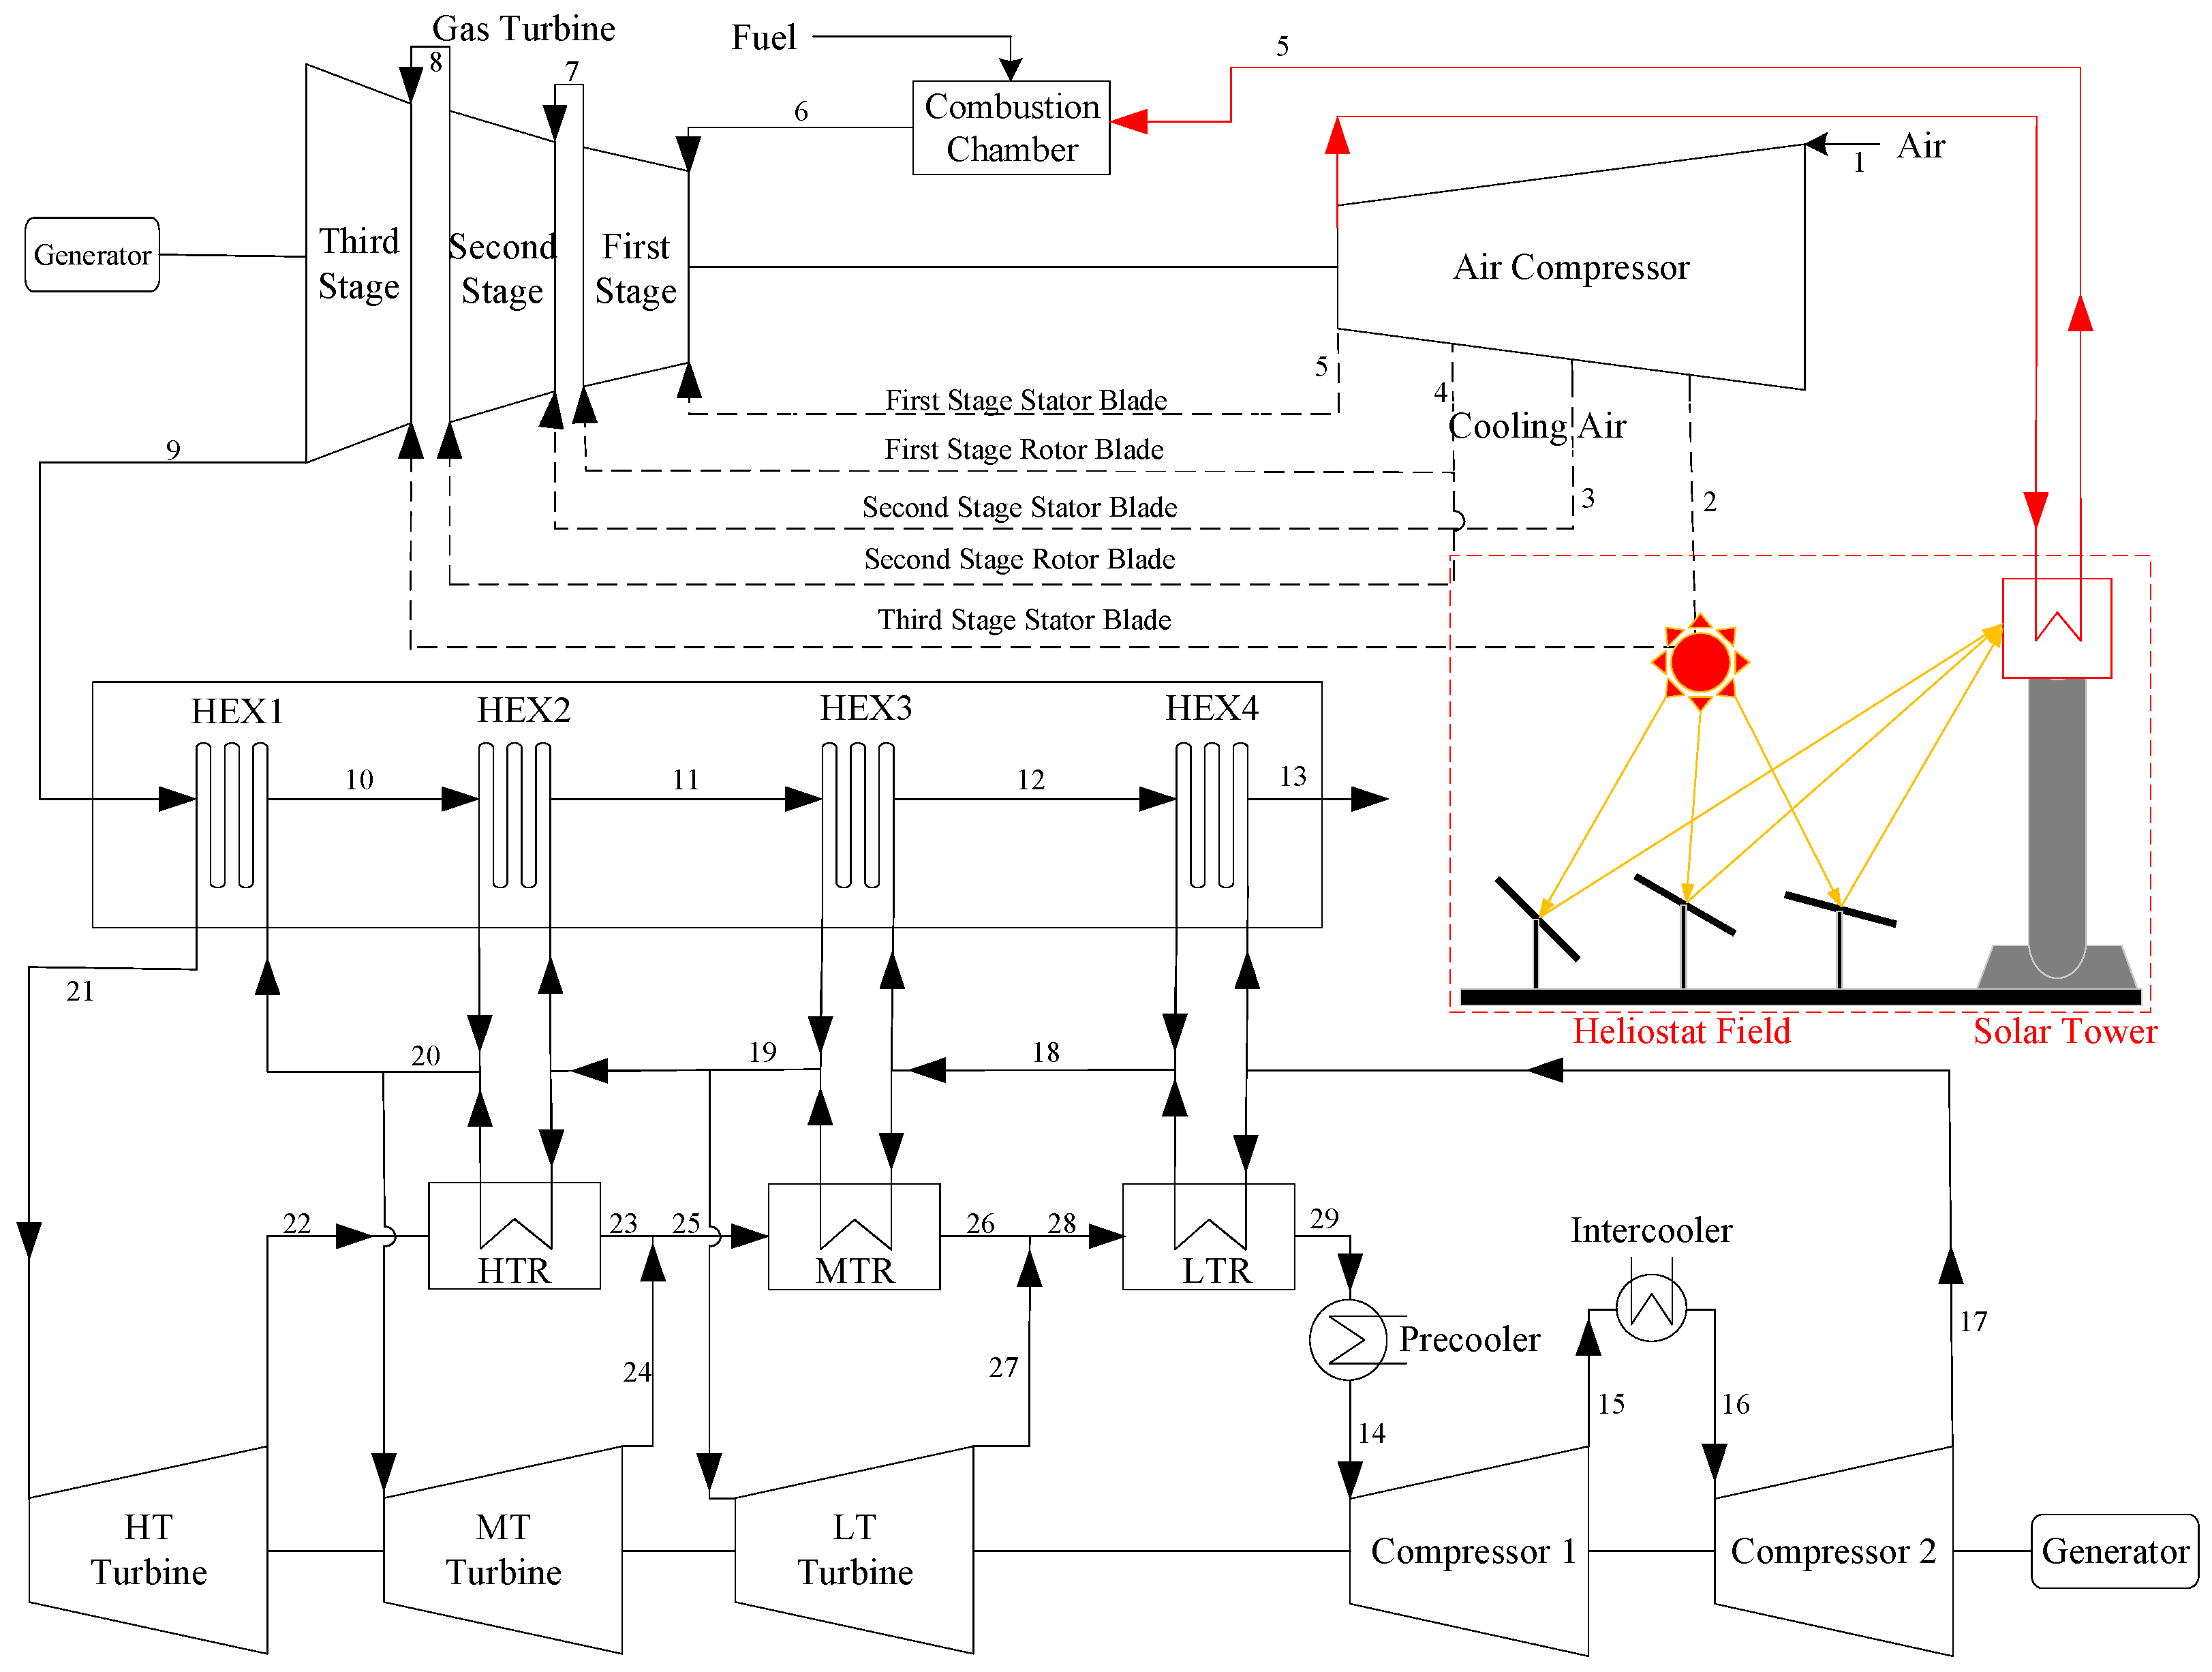
2.2. The ISCC System Based on the Novel Benchmark System

The flowcharts of the ISCC systems consisting of PTC and ST solar collector systems integrated into the novel GTCC benchmark systems are shown in Figure 2 and Figure 3, respectively. Indirect heat transfer via HTF or molten salt is not used for both PTC and ST solar collector systems, but rather direct heat transfer is adopted. For the ISCC system with PTC, the high temperature heat exchanger, HEX1, is chosen for the solar energy to integrate in the bottom cycle from the perspective of efficient utilization, which partially replaces the heat transfer process of the high-parameter working medium in HEX1. For the ISCC system with ST, solar energy is integrated into the compressor outlet to heat the high-pressure air, which reduces its heat absorption in the combustion chamber and saves the fuel consumption.

3. Thermodynamic Model of the ISCC System

3.1. System Assumptions

The commercial software EBSILON® Professional v14.00 (Shanghai, China) is used to simulate the novel ISCC systems, and the main assumptions are as follows:
  • System models are simulated based on steady state;
  • The variations of kinetic and potential energy in every component are ignored;
  • Isentropic efficiencies of compressors, turbines, and pumps are constant;
  • The fuel is completely burned in the combustion chamber, and the heat loss in the combustion chamber is 0.5%;
  • Leakage of working medium in the whole system is ignored;
  • The ambient temperature is assumed to be 15 °C and the ambient pressure is 1.013 bar;
  • Natural gas (mainly for methane) is chosen as the combustion chamber fuel, with a lower heating value (LHV) of 48,685 kJ/kg;
  • Pressure drops at the inlet and outlet of the gas turbine Brayton topping cycle are assumed to be 0.61% and 1.32%, respectively, whereas the pressure drop for the combustion chamber is 3.5%. The pressure drops at the hot and cold ends of the heat exchangers which supercritical CO2 passing through, including HEX1~HEX4, LTR, MTR, HTR, PC, and IC, are 2 kPa and 0.2 kPa, respectively. Additionally, the pressure drops in the solar collectors, PTC and ST, are assumed to be insignificant.

3.2. Benchmark GTCC System

The General Electric 9351FA gas turbine is selected as the key component for the GTCC system shown in Figure 1, which makes up of an 18-stage compressor, a combustion chamber, and a three-stage gas turbine. In order to keep the safe operation of the gas turbine, cooling air is extracted from the 9th, 13th, 15th, and 18th stages of the compressor, respectively, and then allocated to the stator and rotor blades of the gas turbine stages to cool down. The total amount of extracted cooling air is 18.45% of the total air volume [19]. The hot end temperature difference of the HT turbine in the bottom cycle is set at 15 °C. The specific design parameters of the GTCC system are listed in Table 1, Table 2 and Table 3.

3.3. ISCC System

The integration of solar energy into GTCC systems utilizing PTC and ST collector systems, respectively, constitutes different ISCC systems with PTC and ST. The geographical location is chosen in Dunhuang, Gansu Province, northwest of China (94.15° E, 40.13° N), and the design DNI is 800 W/m2.

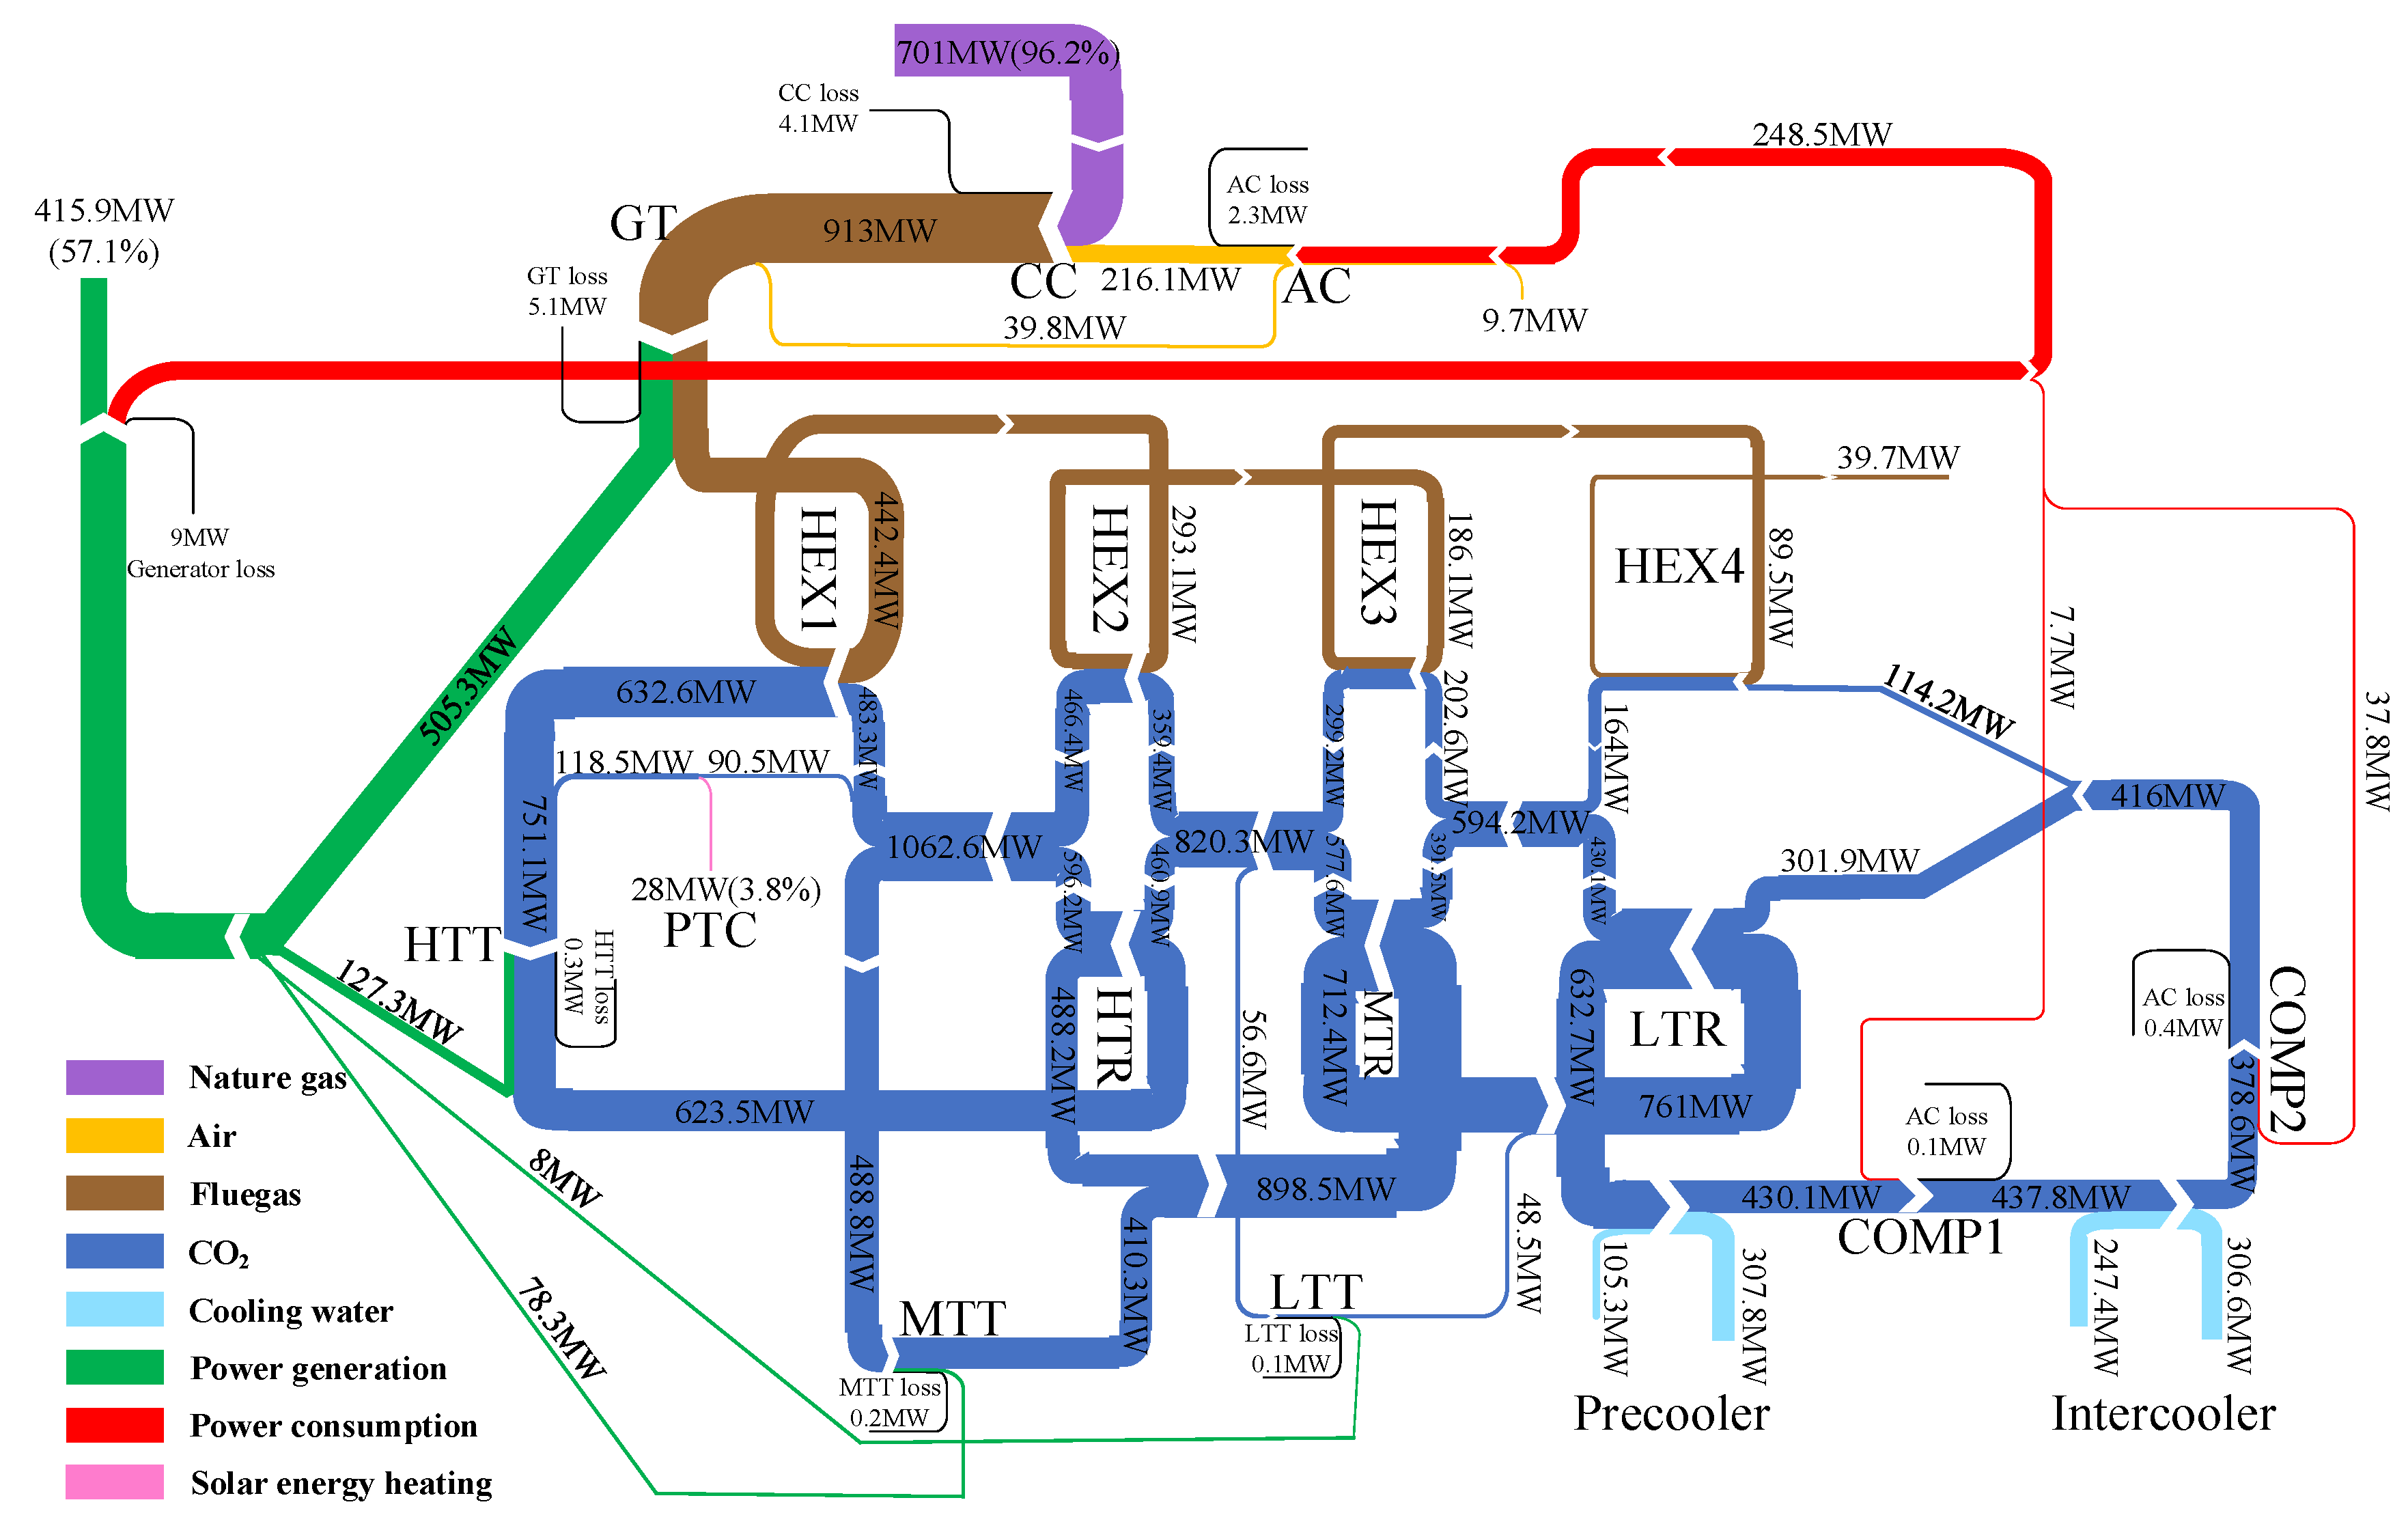
3.3.1. ISCC System with PTC

The ISCC system with PTC integrates solar energy into the HEX1 in the bottom cycle, partially replacing the heat exchange process of HEX1, thus increasing the mass flowrate of CO2 in the bottom cycle, and enhancing the system output power.
The solar collectors of the PTC are arranged horizontally in a north–south orientation, and the specific design parameters are shown in Table 4. It should be noted that in the calculation process of the optical efficiency, the effect caused by atmospheric attenuation losses is ignored; the collector availability is specified to be 100%.

3.3.2. ISCC System with ST

The ISCC system with ST integrates solar energy at the inlet of the combustion chamber of the topping cycle, heating the pressurized air.
The specific design parameters for ST are listed as Table 5. In the calculation of the conversion from solar energy to heat, the effects of atmospheric attenuation and wind factors on the performance of the heliostat field and receiver are ignored.

3.4. Model Validation

Model validation on gas turbine has already been performed in previous studies [19]. The resultant values of the supercritical CO2 bottom cycle model in this paper and reference [22] are compared under the same initial parameters, and the specific deviation values are shown in Table 6. The deviations for each value are within 2%, which shows the reasonability of the system modelling in this paper.

3.5. Thermodynamic Performance Evaluation Criteria

Because of the integration of solar energy into the ISCC system to supply the heat, the expressions for system efficiency differ slightly between the GTCC and ISCC systems as follows:
η g t c c = W g t c c Q f u e l = W g t c c t o p p i n g + W g t c c b o t t o m M g a s , g t c c L H V
η i s c c p t c = W i s c c p t c Q f u e l p t c + Q s t c p t c = W i s c c p t c t o p p i n g + W i s c c p t c b o t t o m M g a s , i s c c p t c L H V + Q s t c p t c
η i s c c s t = W i s c c s t Q f u e l s t + Q s t c s t = W i s c c s t t o p p i n g + W i s c c s t b o t t o m M g a s , i s c c s t L H V + Q s t c s t
where η g t c c , η i s c c p t c , and η i s c c s t are the system efficiencies of GTCC, ISCC system with PTC, and ISCC system with ST, respectively; W g t c c , W i s c c p t c , and W i s c c s t are the power generations of GTCC, ISCC system with PTC, and ISCC system with ST, MW, respectively; Q f u e l , Q f u e l p t c , and Q f u e l s t are the heat released from the fuel of GTCC, ISCC system with PTC, and ISCC system with ST, MW, respectively; M g a s , g t c c , M g a s , i s c c p t c , and M g a s , i s c c s t are the consumed gas mass flowrates of GTCC, ISCC system with PTC, and ISCC system with ST, kg/s, respectively; L H V is the lower heating value of the nature gas, kJ/kg; Q s t c p t c and Q s t c s t are the solar thermal collections of ISCC system with PTC and ISCC system with ST, MW, respectively; superscript t o p p i n g and b o t t o m represent the topping and bottom cycles of the system, respectively.
The calculation expressions of the topping cycle efficiencies of GTCC, ISCC system with PTC, and ISCC system with ST are shown as follows. It should be noted that the ISCC system with PTC has no influence on the topping cycle process due to the solar integration into the bottom cycle, therefore, the topping cycle efficiency of the ISCC system with PTC remains the same as that of GTCC system, i.e., η g t c c t o p p i n g = η i s c c p t c t o p p i n g .
η g t c c t o p p i n g = W g t c c t o p p i n g Q f u e l = W g t c c t o p p i n g M g a s , g t c c L H V
η i s c c p t c t o p p i n g = W i s c c p t c t o p p i n g Q f u e l p t c = W i s c c p t c t o p p i n g M g a s , i s c c p t c L H V
η i s c c s t t o p p i n g = W i s c c s t t o p p i n g Q f u e l s t + Q s t c s t = W i s c c s t t o p p i n g M g a s , i s c c s t L H V + Q s t c s t
The calculation expressions of the bottom cycle efficiencies of the GTCC, ISCC system with PTC, and ISCC system with ST are shown as follows:
η g t c c b o t t o m = W g t c c b o t t o m Q e x h a u s t
η i s c c p t c b o t t o m = W i s c c p t c b o t t o m Q e x h a u s t p t c + Q s t c p t c
η i s c c s t b o t t o m = W i s c c s t b o t t o m Q e x h a u s t s t
where Q e x h a u s t , Q e x h a u s t p t c , and Q e x h a u s t s t are the total heat from gas turbine exhaust gas of the GTCC, ISCC system with PTC, and ISCC system with ST, MW, respectively.
For the solar energy dimension, the solar irradiation incident on the mirror field (including parabolic trough mirror field and tower heliostat field) can be expressed as follows:
Q s o l a r p t c = D N I A p t m
Q s o l a r s t = D N I A h e l
where Q s o l a r p t c and Q s o l a r s t are the solar irradiation incident on the parabolic trough mirror field and the tower heliostat field, MW, respectively; D N I is the direct normal irradiance of solar energy, W/m2; A p t m and A h e l are the field areas of the parabolic trough mirror and the tower heliostat, m2, respectively.
The optical efficiency of the mirror field can be defined as:
η o p t p t c = η c o s p t c η s h a d p t c η e n d p t c η a t m p t c η c l e a n p t c η r e f p t c η a v a p t c
η o p t s t = η c o s s t η s h a d s t η e n d s t η a t m s t η c l e a n s t η r e f s t η a v a s t
where η o p t p t c and η o p t s t are the optical efficiencies of the parabolic trough mirror field and the tower heliostat field, respectively; η c o s p t c and η c o s s t are the cosine loss factors of the parabolic trough mirror field and the tower heliostat field, respectively; η s h a d p t c and η s h a d s t are the shading loss factors of the parabolic trough mirror field and the tower heliostat field, respectively; η e n d p t c and η e n d s t are the end loss factors of the parabolic trough mirror field and the tower heliostat field, respectively; η a t m p t c and η a t m s t are the atmospheric influence factors of the parabolic trough mirror field and the tower heliostat field, respectively; η c l e a n p t c and η c l e a n s t are the mirror cleanliness factors of the parabolic trough mirror field and the tower heliostat field, respectively; η r e f p t c and η r e f s t reflect the parabolic trough mirror field and the tower heliostat field, respectively; η a v a p t c and η a v a s t are the availability of the parabolic trough mirror field and the tower heliostat field, respectively. It is important to note that the shading loss factor, the end loss factor, and the cosine loss factor are closely associated with the altitude and azimuth angle of the incident beam.
The solar energy heat collection can be defined by the correlation equation for solar irradiation incident on the mirror field, as follows:
Q s t c p t c = Q s o l a r p t c η o p t p t c Q l o s s p t c
Q s t c s t = Q s o l a r s t η o p t s t Q l o s s s t
where Q l o s s p t c and Q l o s s s t are the losses of the vacuum collector in PTC and the tower receiver in ST, MW, respectively. The losses can be derived from the following equations:
Q l o s s p t c = Q h e a t l o s s + Q p i p e
Q l o s s s t = Q l o s s o p t + Q l o s s c o n v + Q l o s s r a d
where Q h e a t l o s s is the heat loss of the vacuum collector in PTC, which is assumed to only depend on the temperature difference between the inlet and outlet of the PTC and the atmosphere, MW; Q p i p e is the heat loss of the piping between two collectors and the header piping, MW; Q l o s s o p t is the optical loss of the tower receiver, MW; Q l o s s c o n v is the convective losses of the tower receiver, MW; Q l o s s r a d is the radiation losses of the tower receiver, MW.
The photothermal efficiency of solar energy can be expressed as follows:
η p t p t c = Q s t c p t c Q s o l a r p t c
η p t s t = Q s t c s t Q s o l a r s t
where η p t p t c and η p t s t are the photothermal efficiencies of solar energy in the ISCC system with PTC and ISCC system with ST, respectively.
The solar energy power generations in ISCC system with PTC and ISCC system with ST can be expressed as follows:
W s o l p t c = W i s c c p t c W g t c c
W s o l s t = W i s c c s t W g t c c M g a s , i s c c s t M g a s , g t c c
where W s o l p t c and W s o l s t are the solar energy power generations in the ISCC system with PTC and ISCC system with ST, MW, respectively.
The photoelectric efficiency of solar energy can be expressed as follows:
η p e p t c = W s o l p t c Q s o l a r p t c
η p e s t = W s o l s t Q s o l a r s t
where η p e p t c and η p e s t are the photoelectric efficiencies of solar energy in the ISCC system with PTC and ISCC system with ST, respectively.

3.6. Exergy Analysis

For any one component of the system, the component’s exergy destruction can be obtained as follows:
E l o s s = E i n p u t E p r o d u c t
where E l o s s is the exergy destruction of the component, MW; E i n p u t is the exergy input of the component, MW; E p r o d u c t is the exergy product of the component, MW.
However, it is worth to mention that the fuel exergy is related to the LHV and the energy grade of the fuel, which is obtained as follows:
E f u e l = M g a s L H V A
where E f u e l is the exergy of the fuel, MW; M g a s is the fuel mass flowrate, kg/s; A is the energy grade of the fuel, which is defined as 0.98 in this paper. The exergy of solar energy can be calculated as follows:
E s o l a r = Q s o l a r ( 1 4 3 T a t m T s o l + 1 3 T a t m T s o l 4 )
where E s o l a r is the exergy of solar energy, MW; Q s o l a r is the solar irradiation incident on the mirror field, MW; T a t m is the atmosphere temperature, K; T s o l is the solar surface temperature, which is defined as 5770 K.
The component’s exergy efficiency can be calculated as follows:
η e x = E p r o d u c t E i n p u t
where η e x is the exergy efficiency of the component.

4. Results and Discussion

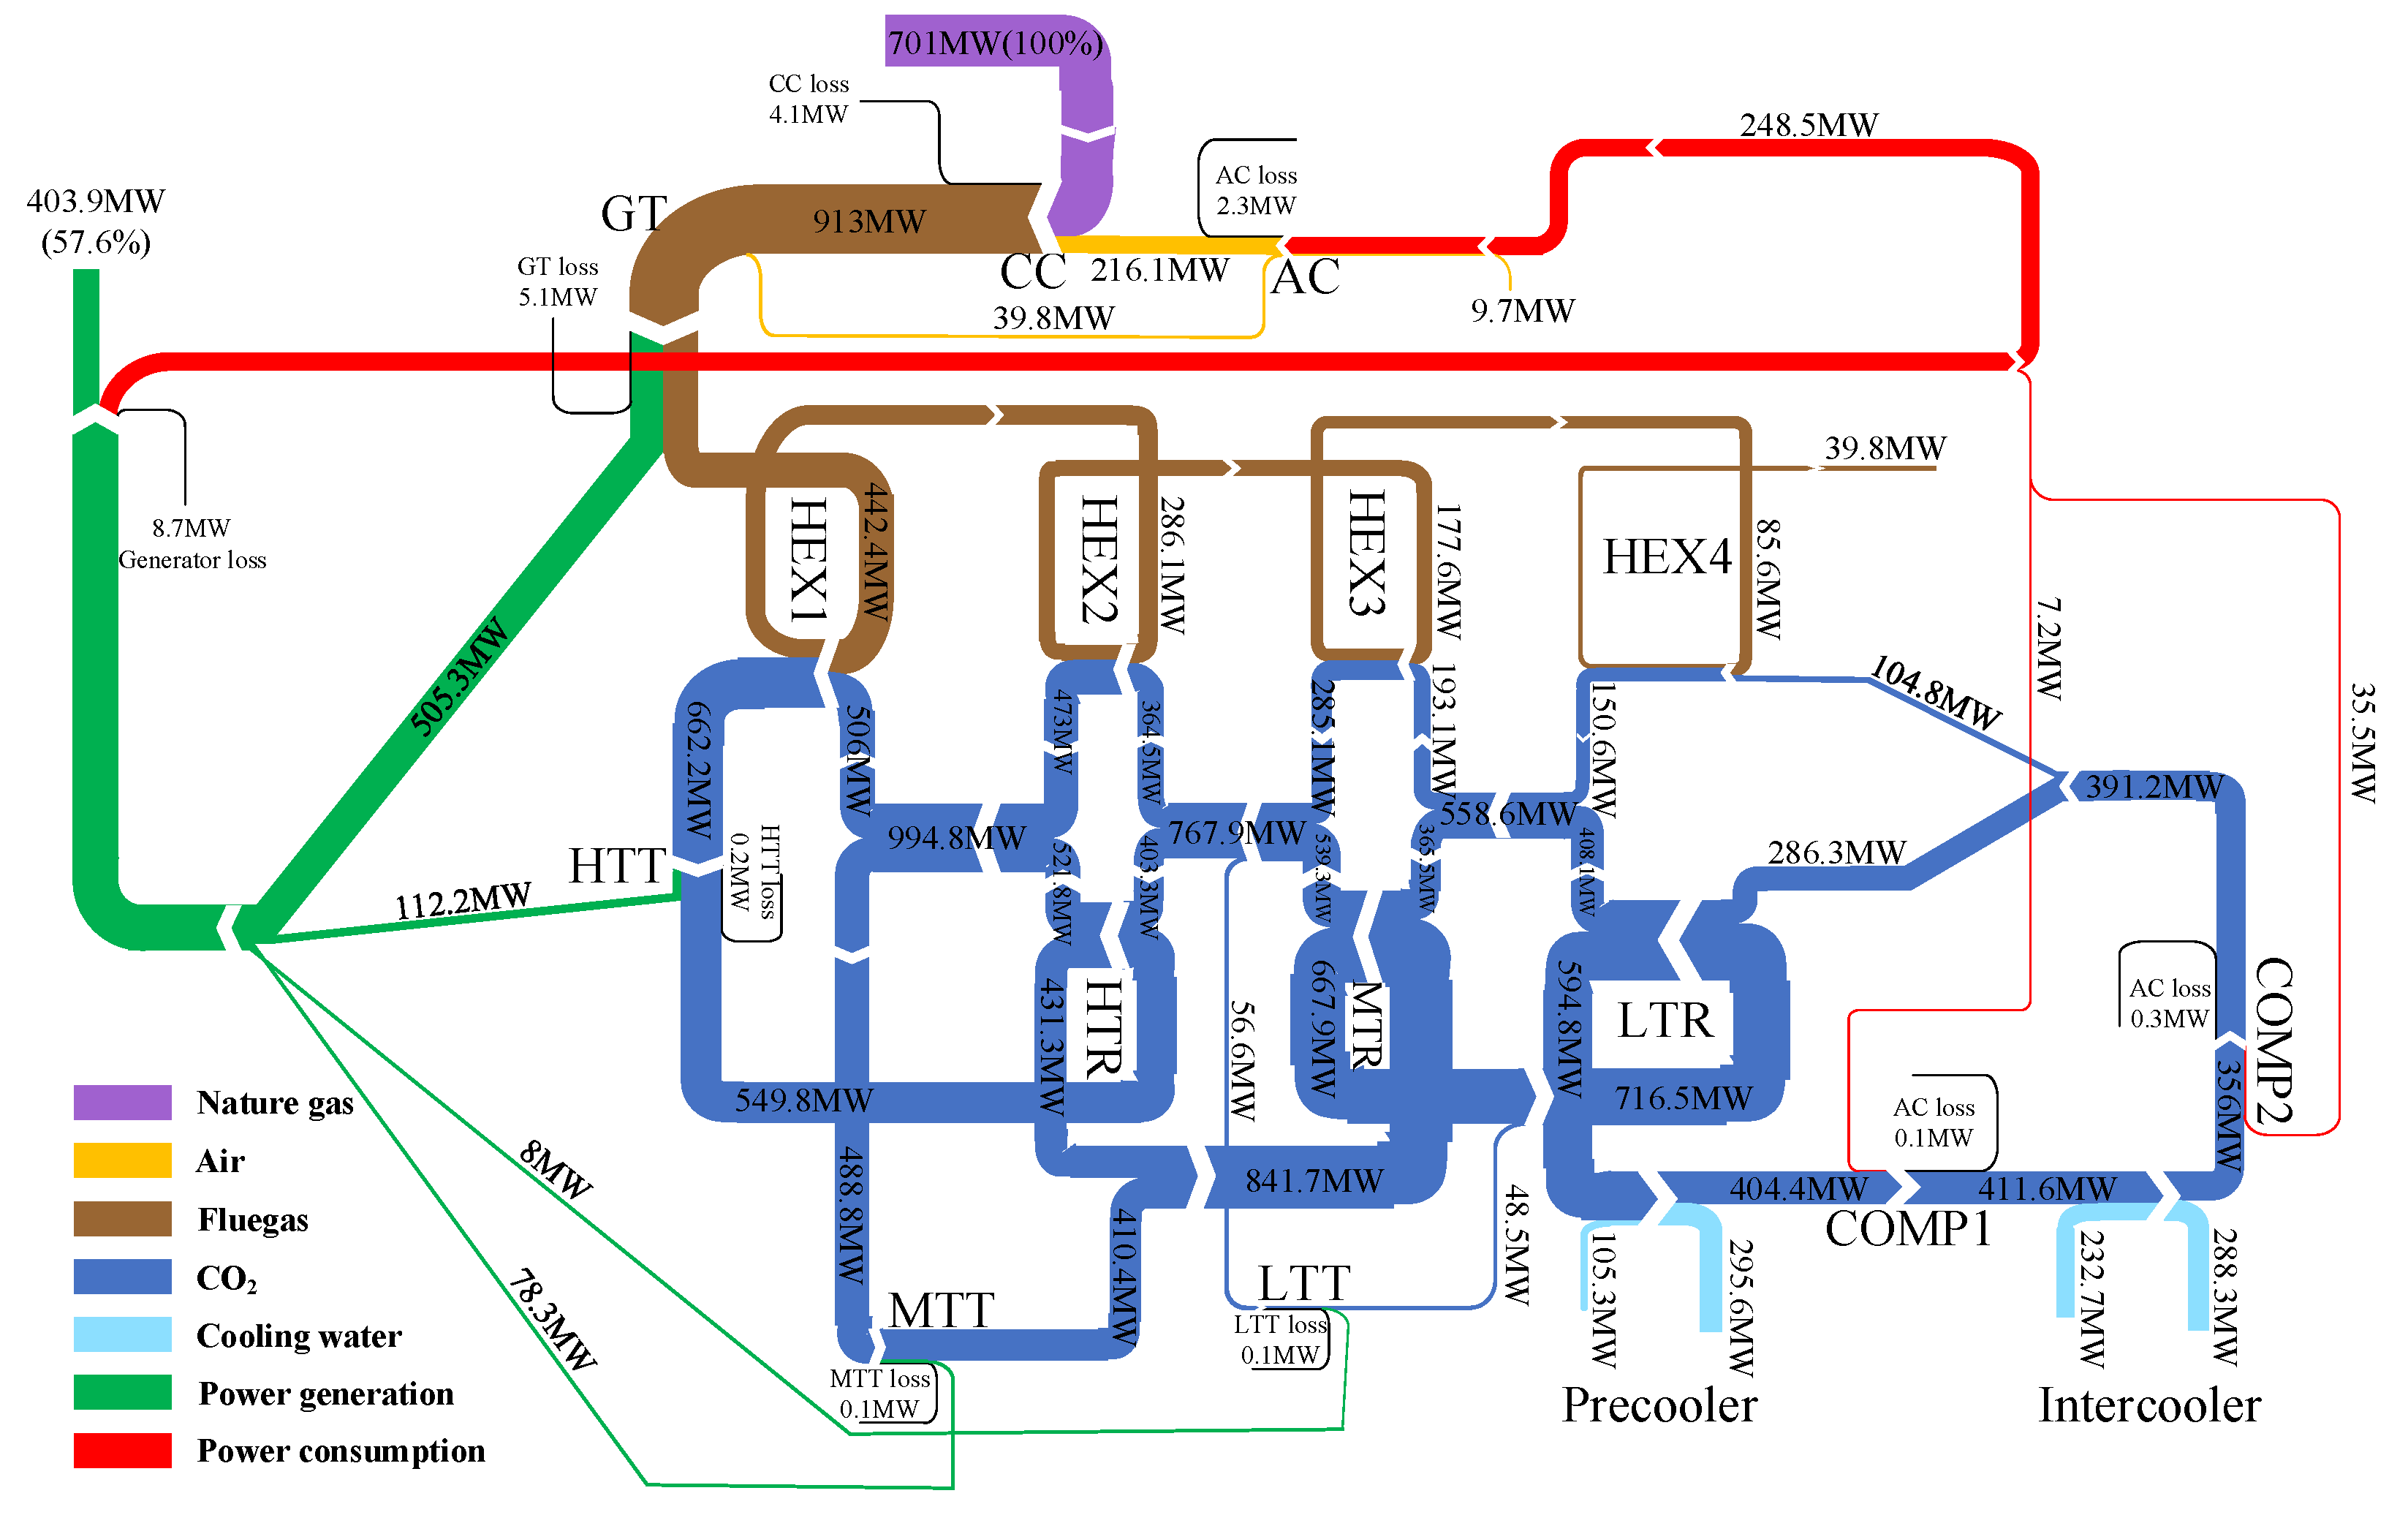
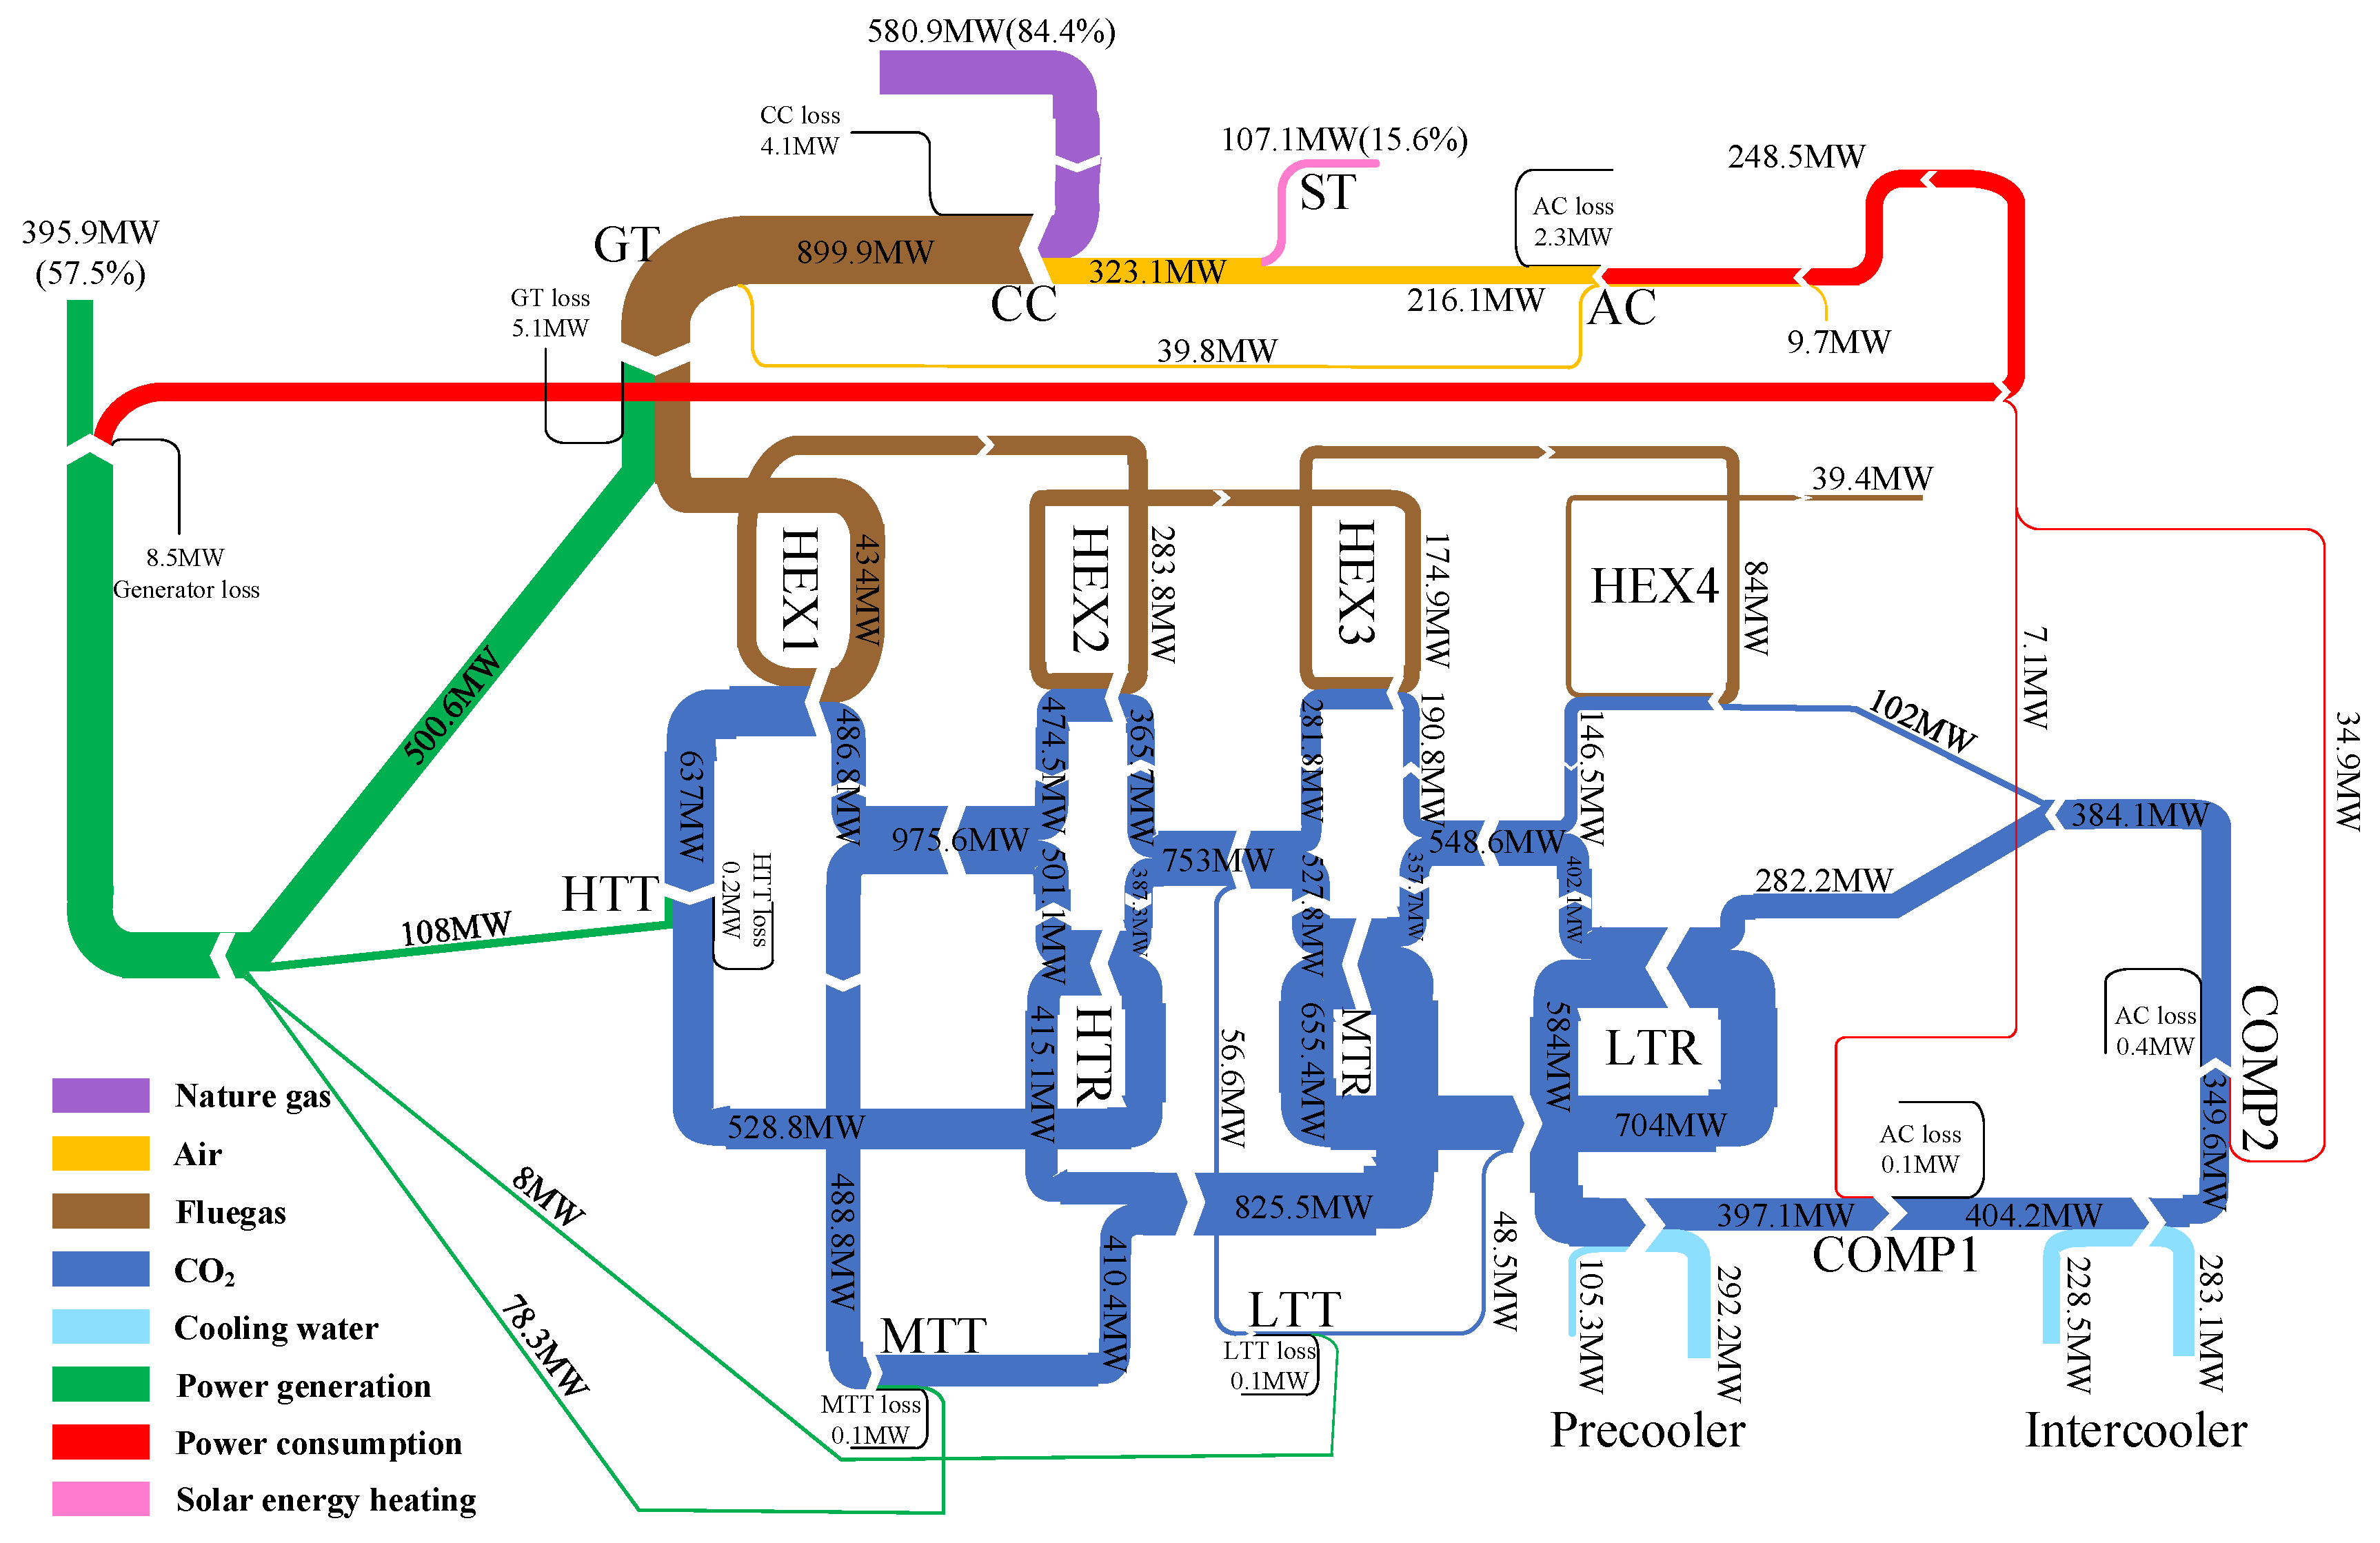
4.1. Performance of the Benchmark GTCC System

The energy flow diagram of the novel benchmark GTCC system with a supercritical CO2 Brayton bottom cycle is shown in Figure 4. It is obvious from the figure that the heat consumed by the fuel is 701 MW, the output power is 403.9 MW, and the system efficiency is 57.6%.
The T-Q diagram of the HRSG’s heat exchangers and the recuperators in the benchmark GTCC system with a supercritical CO2 Brayton bottom cycle is shown in Figure 5. The red curve represents the hot end temperature of each heat exchanger, and the light blue curve represents the cold end temperature of each heat exchanger. This graph shows the trend of the pinch point temperature difference for each heat exchanger during the heat transfer process. As can be seen, the pinch point temperature differences for the heat exchangers of HRSG are less than those of the recuperators. In fact, all heat exchangers have relatively small pinch point temperature differences, which can reduce irreversible losses of each heat exchanger in the heat transfer process and achieves a higher exergy efficiency.
Compared to conventional GTCC system, the novel GTCC system is not only more compact in structure but also has better thermal performance. Table 7 shows the differences in power generation and efficiency between these two GTCC systems. It can be seen that the novel GTCC system is slightly better than the conventional GTCC system with regard to power generation and efficiency and is more advantageous as a benchmark system for the ISCC system.

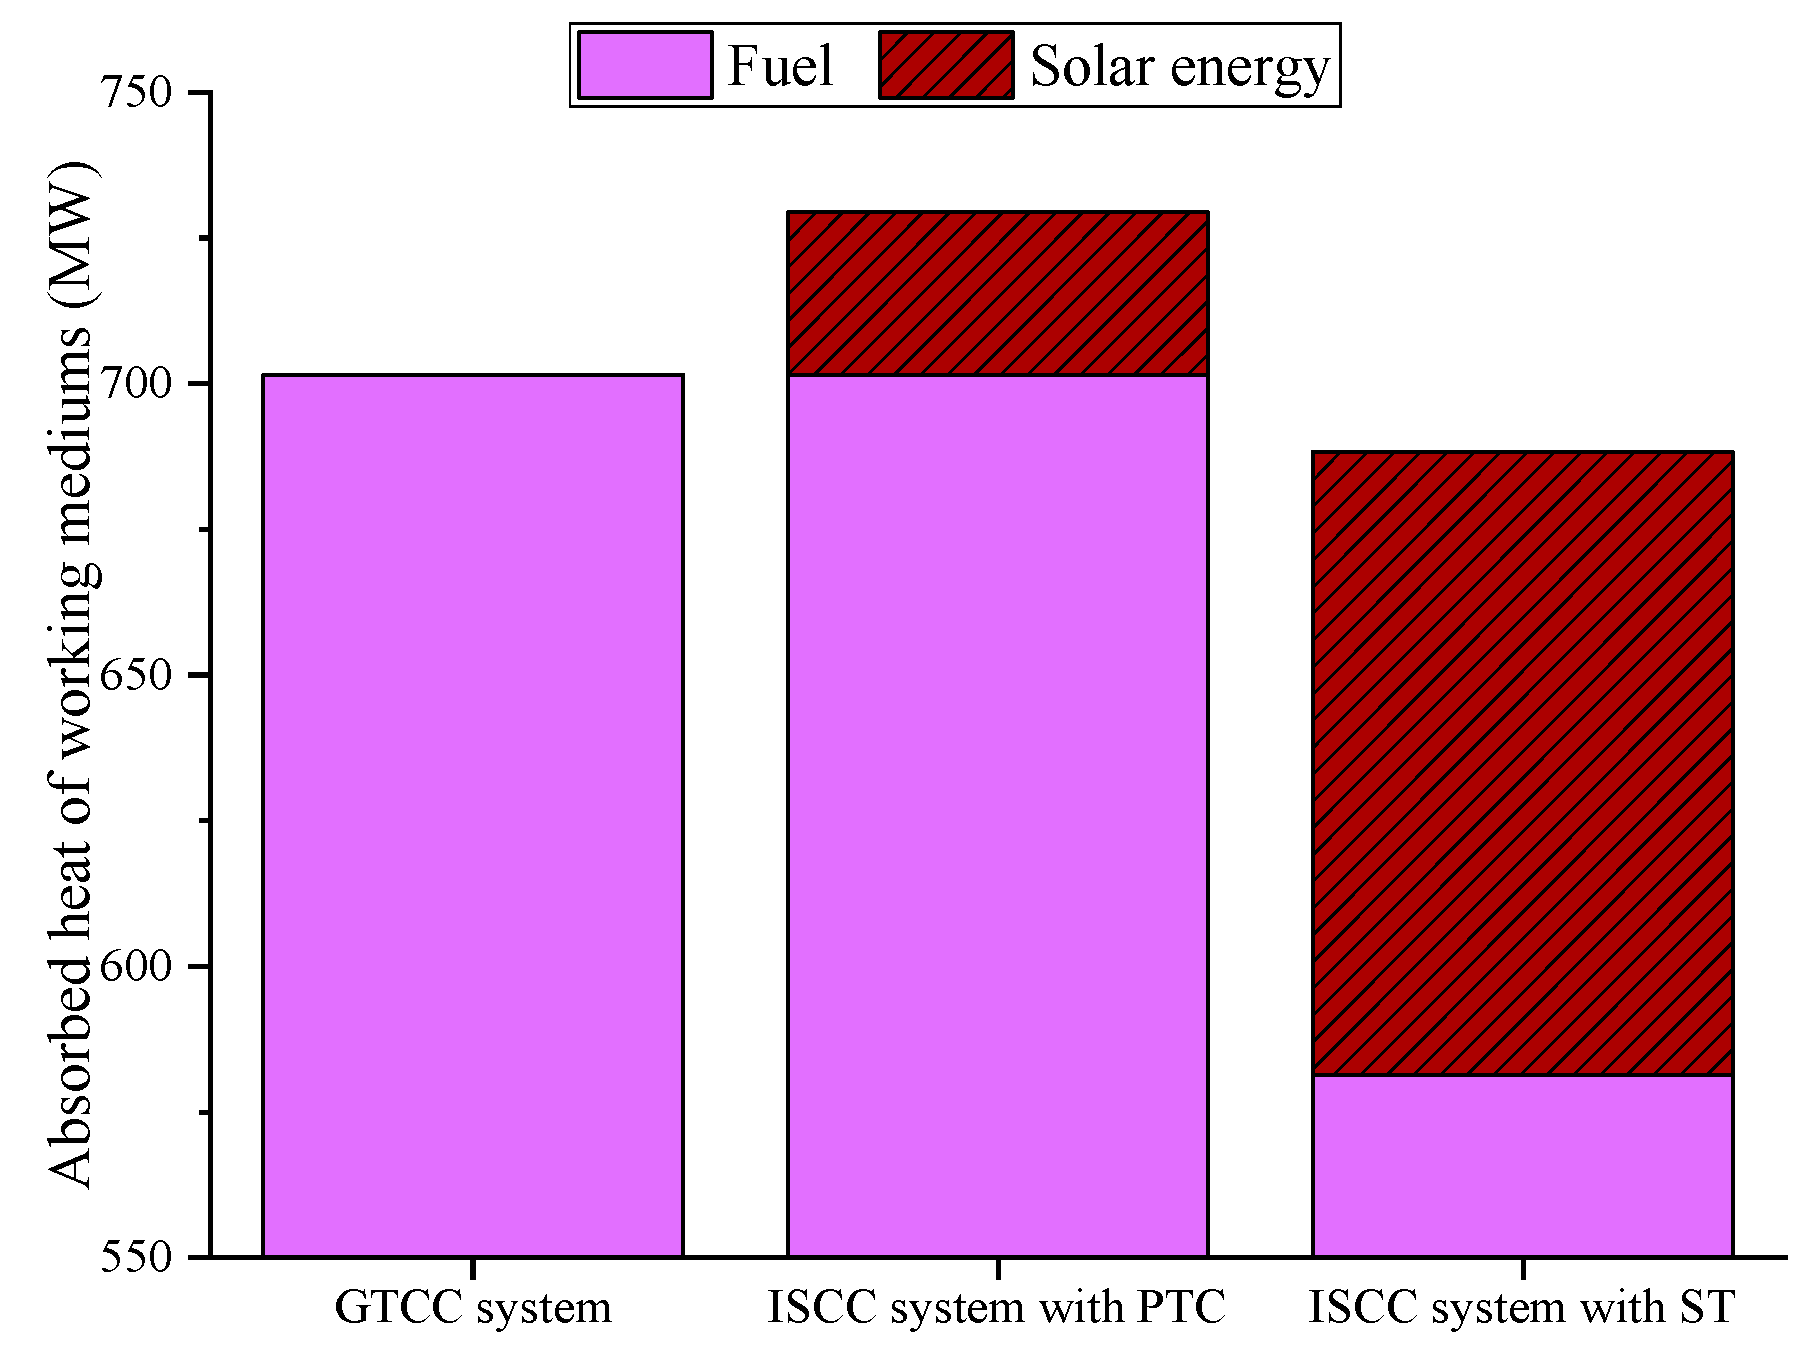
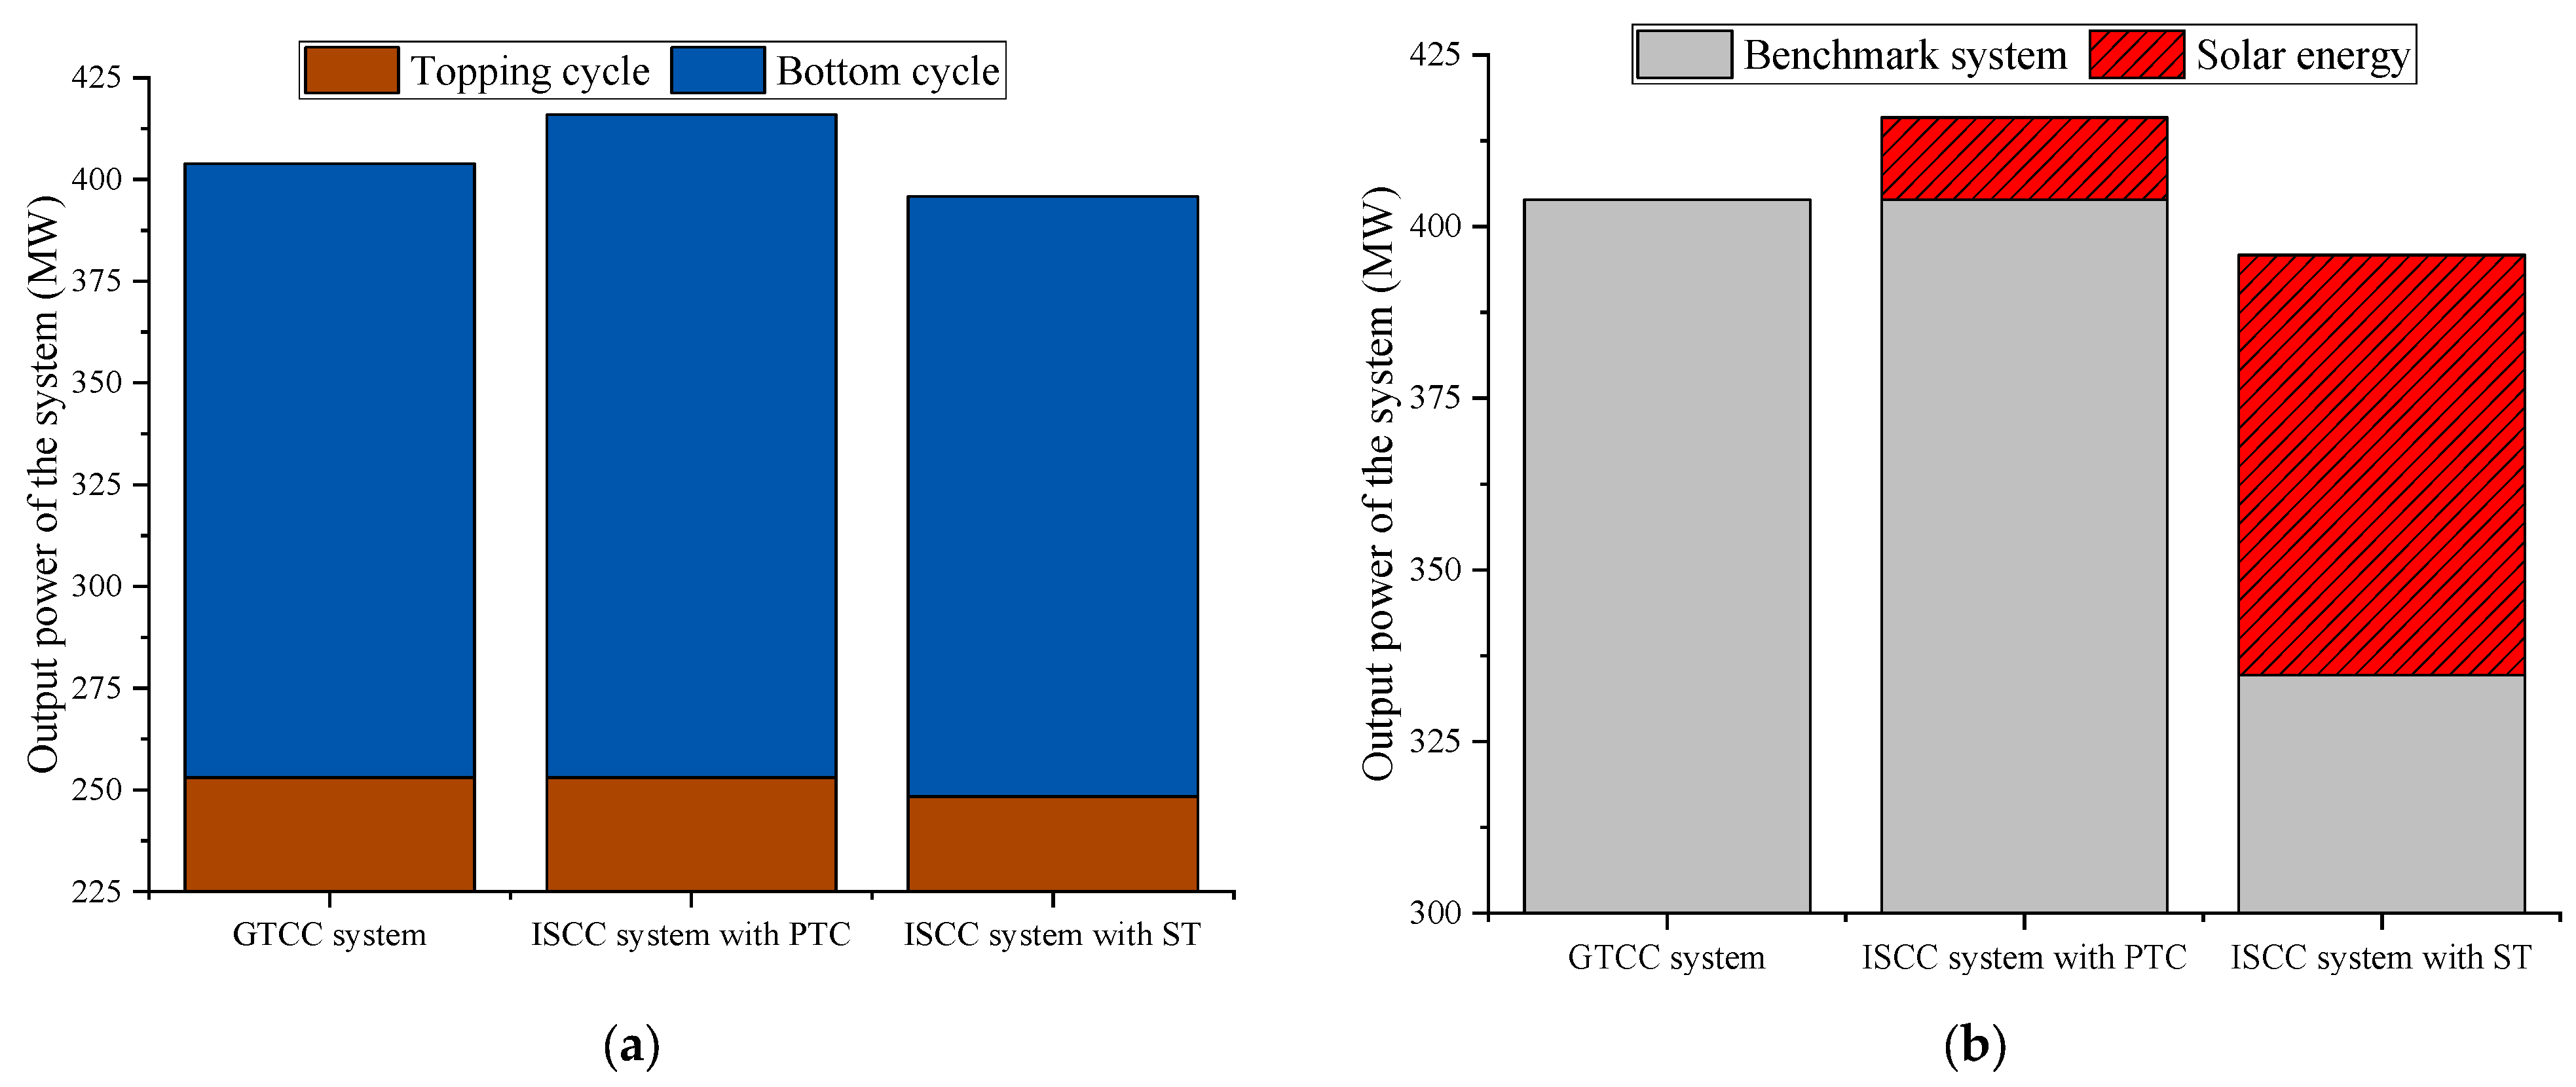
4.2. Thermodynamic Performance Analysis of the ISCC System

Figure 6 and Figure 7 show the energy flow diagrams for the ISCC system with PTC and ISCC system with ST, respectively. It can be seen from the diagram that the energy input of the ISCC system with PTC includes the fuel heat energy of 701 MW (96.2%) and solar energy of 28 MW (3.8%), the output power is 415.9 MW, and the total efficiency is 57.1%; the energy input of the ISCC system with ST includes the fuel heat energy of 580.9 MW (84.4%) and solar energy of 107.1 MW (15.6%), the output power is 395.9 MW, and the total efficiency is 57.5%.
The specific performance parameters of the GTCC system, ISCC system with PTC, and ISCC system with ST are listed in Table 8. The topping cycle output power and efficiency of the ISCC system with PTC remain consistent with those of the benchmark system at 253.03 MW and 36.1%, while the topping cycle output power and efficiency of the ISCC system with ST are slightly lower than those of the ISCC system with PTC at 248.36 MW and 36.08%. The bottom cycle output power and efficiency of ISCC system with PTC are greater than those of the benchmark system at 162.87 MW and 34.6%, while the bottom cycle output power and efficiency of the ISCC system with ST are less than those of the benchmark system at 147.51 MW and 33.99%. In terms of solar energy, the ST subsystem is designed with a larger mirror field area because of its higher concentration ratio than that of the PTC subsystem, which results in 61.16 MW of solar energy output power for the ISCC system with ST, which is much greater than that of the ISCC system with PTC (11.97 MW). The solar energy power generation efficiency of the ISCC system with ST is 25.5%, which is less than that of the ISCC system with PTC (27.6%).
Figure 8 shows a comparative diagram of the absorbed heat of the work mediums in these three systems. Figure 9 shows the comparison results for the output powers of these three systems. Therein, Figure 9a distinguishes the output power according to the topping and bottom cycles, while Figure 9b distinguishes the output power according to the benchmark system and the solar collector system.
Combining the comparison results in Figure 8 and Figure 9 and Table 8, it can be seen that the topping cycle parameters of the ISCC system with PTC remain the same compared with the benchmark system owing to the integration of the PTC subsystem into the bottom cycle, which has no effect on the topping cycle process. Due to the integration of the ST subsystem into the topping cycle, the air at the outlet of the compressor is delivered into the receiver of the ST subsystem for heating, therefore, the combustion chamber inlet temperature is greater than that of the ISCC system with PTC, and the fuel consumption is lower than that of the ISCC system with PTC. Because of the change in gas compositions owing to the reduction of fuel consumption, there is a slight decrease in the temperature and mass flowrate of the exhaust gas of the gas turbine. Therefore, the topping cycle output power and efficiency of the ISCC system with ST are lower than those of the ISCC system with PTC. Because of the integration of solar energy, the heat absorption in the bottom cycle of the ISCC system with PTC increases, which results in an increase in the mass flowrate of the CO2 working medium. The ISCC system with ST has a decrease in the heat absorption of the bottom cycle due to the decreases in the temperature and mass flowrate of the exhaust gas of the gas turbine, resulting in a lower mass flowrate of the CO2 working medium than that of the ISCC system with PTC. As a result, the bottom cycle of the ISCC system with PTC is greater than that of the benchmark system in terms of power generation and efficiency, while the bottom cycle of the ISCC system with ST is less than that of the benchmark system with regard to power generation and efficiency.
For the ISCC system with PTC, the integration of solar energy has no impact on the heat absorption and output power of the benchmark subsystem, it just increases the mass flowrate of the bottom cycle, which is used to absorb heat in the PTC subsystem and generate electricity, i.e., the total output power of the ISCC system with PTC is greater than that of the benchmark system. Whereas for ISCC system with ST, the integration of solar energy decreases the heat absorption of the benchmark subsystem, and the total heat absorption of the ISCC system with ST is also slightly less than that of the benchmark system due to the change in the gas composition at the gas turbine inlet, which results in a lower total output power of the ISCC system with ST than that of the benchmark system. At the point of efficiency, the power generation efficiencies of both the ISCC system with PTC and the ISCC system with ST are smaller than that of the benchmark system (57.6%) since the SEGS is integrated into the benchmark GTCC system as a more inefficient system.
For the solar energy section of these two ISCC systems, the ISCC system with PTC has a higher optical efficiency, photothermal efficiency, and photoelectric efficiency than the ISCC system with ST due to the different solar collection modes and the lower temperature of the integrated position.

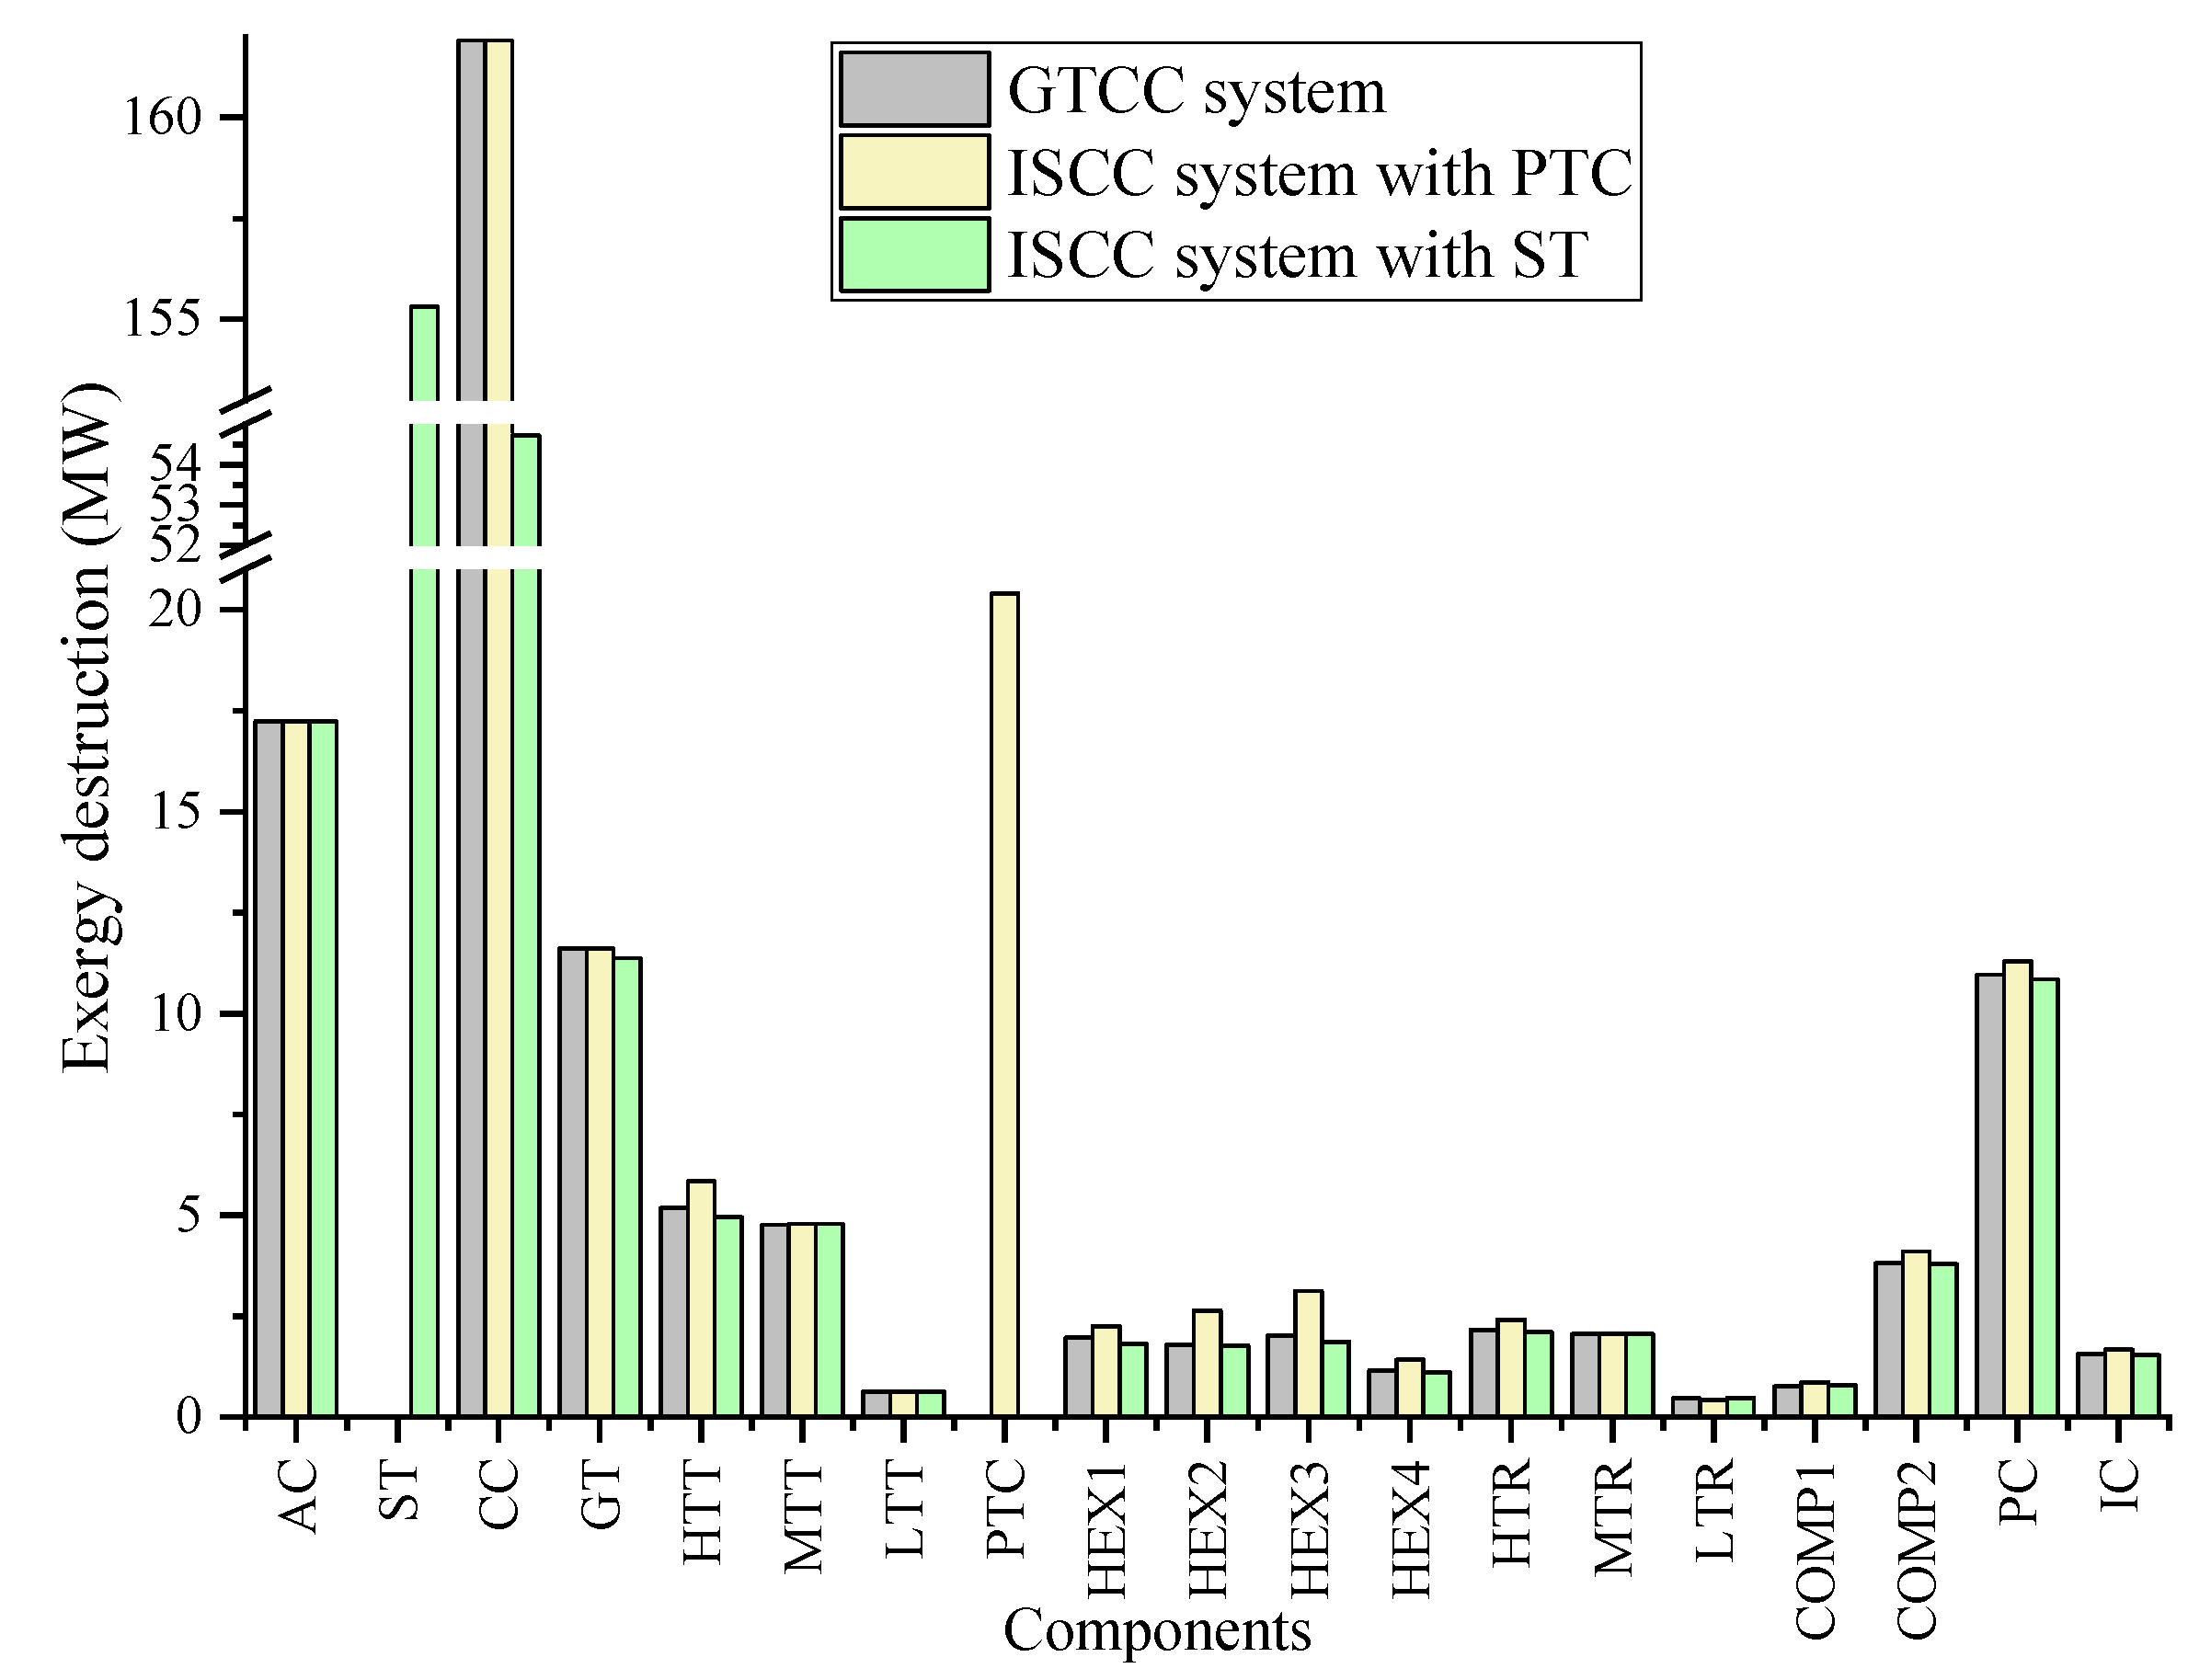
4.3. Exergy Analysis of the ISCC System

Figure 10 is a comparative graph of the exergy destruction of every component for the three systems. It can be seen that the exergy destruction of each component in the topping cycle of the ISCC system with PTC (including AC, CC, and GT) remains the same as those of the benchmark system, which also verifies that the thermal performance of the topping cycle of the ISCC system with PTC is unaffected by solar energy integration; while in the ISCC system with ST, due to the integration of the ST subsystem, the exergy destruction of component CC decreases dramatically compared to that of the benchmark system; meanwhile, due to the reduction of the gas turbine mass flowrate, there is a slight decrease in the exergy destruction of the component GT. For the bottom cycle of both ISCC systems, the bottom cycle components of the ISCC system with PTC have the slightly greater exergy destructions than those of the benchmark system, mainly due to the increased mass flowrate on the bottom cycle side, while the ISCC system with ST has a lower bottom cycle mass flowrate than that of the benchmark system, hence the bottom cycle components have the slightly lower exergy destructions than those of the benchmark system.
Figure 11 illustrates the exergy destruction percentages of key components in the three systems. The main components with high exergy destructions in the benchmark system are CC (70.35%), AC (7.49%), GT (5.04%), and PC (4.76%); the main components with high exergy destructions in the ISCC system with PTC are CC (63.55%), PTC (8.01%), AC (6.77%), and GT (4.56%); and the main components with high exergy destructions in the ISCC system with ST are ST (56.01%), CC (19.74%), AC (6.22%), and GT (4.1%). It is worth noting that both ISCC systems have very higher exergy destructions in their solar collector components (PTC or ST), which will be a main research direction for future system optimization.
Figure 12 illustrates the exergy efficiencies of the components in these three systems. As can be seen from the graph, for the benchmark system, the main components with lower exergy efficiencies are PC (53%), CC (76.4%), and IC (76.6%); for the ISCC system with PTC, the main components with lower exergy efficiencies are PTC (46.8%), PC (54.5%), and CC (76.4%); and for the ISCC system with ST, the main components with lower exergy efficiencies are ST (30.7%), PC (52.6%), and IC (76.6%). It can be concluded that, except for the solar collector subsystem, the components with lower exergy efficiencies are the precooler and CC. Comparing the component exergy efficiency of the ISCC systems with those of the benchmark system, it is evident that the effect of solar energy integration on the topping cycle components of ISCC system with PTC is extremely small. The main impact is on the bottom cycle’s recuperators and the heat exchangers in the HRSG, HEX1~4, which show that the exergy efficiencies of HEX1~4 are slightly lower than those of the benchmark system, while the exergy efficiencies of LTR, MTR, and HTR are slightly higher than those of the benchmark system. The impact of solar energy integration on the ISCC system with ST is mainly reflected in the CC component, where the integration of solar energy greatly improves the efficiency of the CC.

4.4. Parametric Analysis of the ISCC System

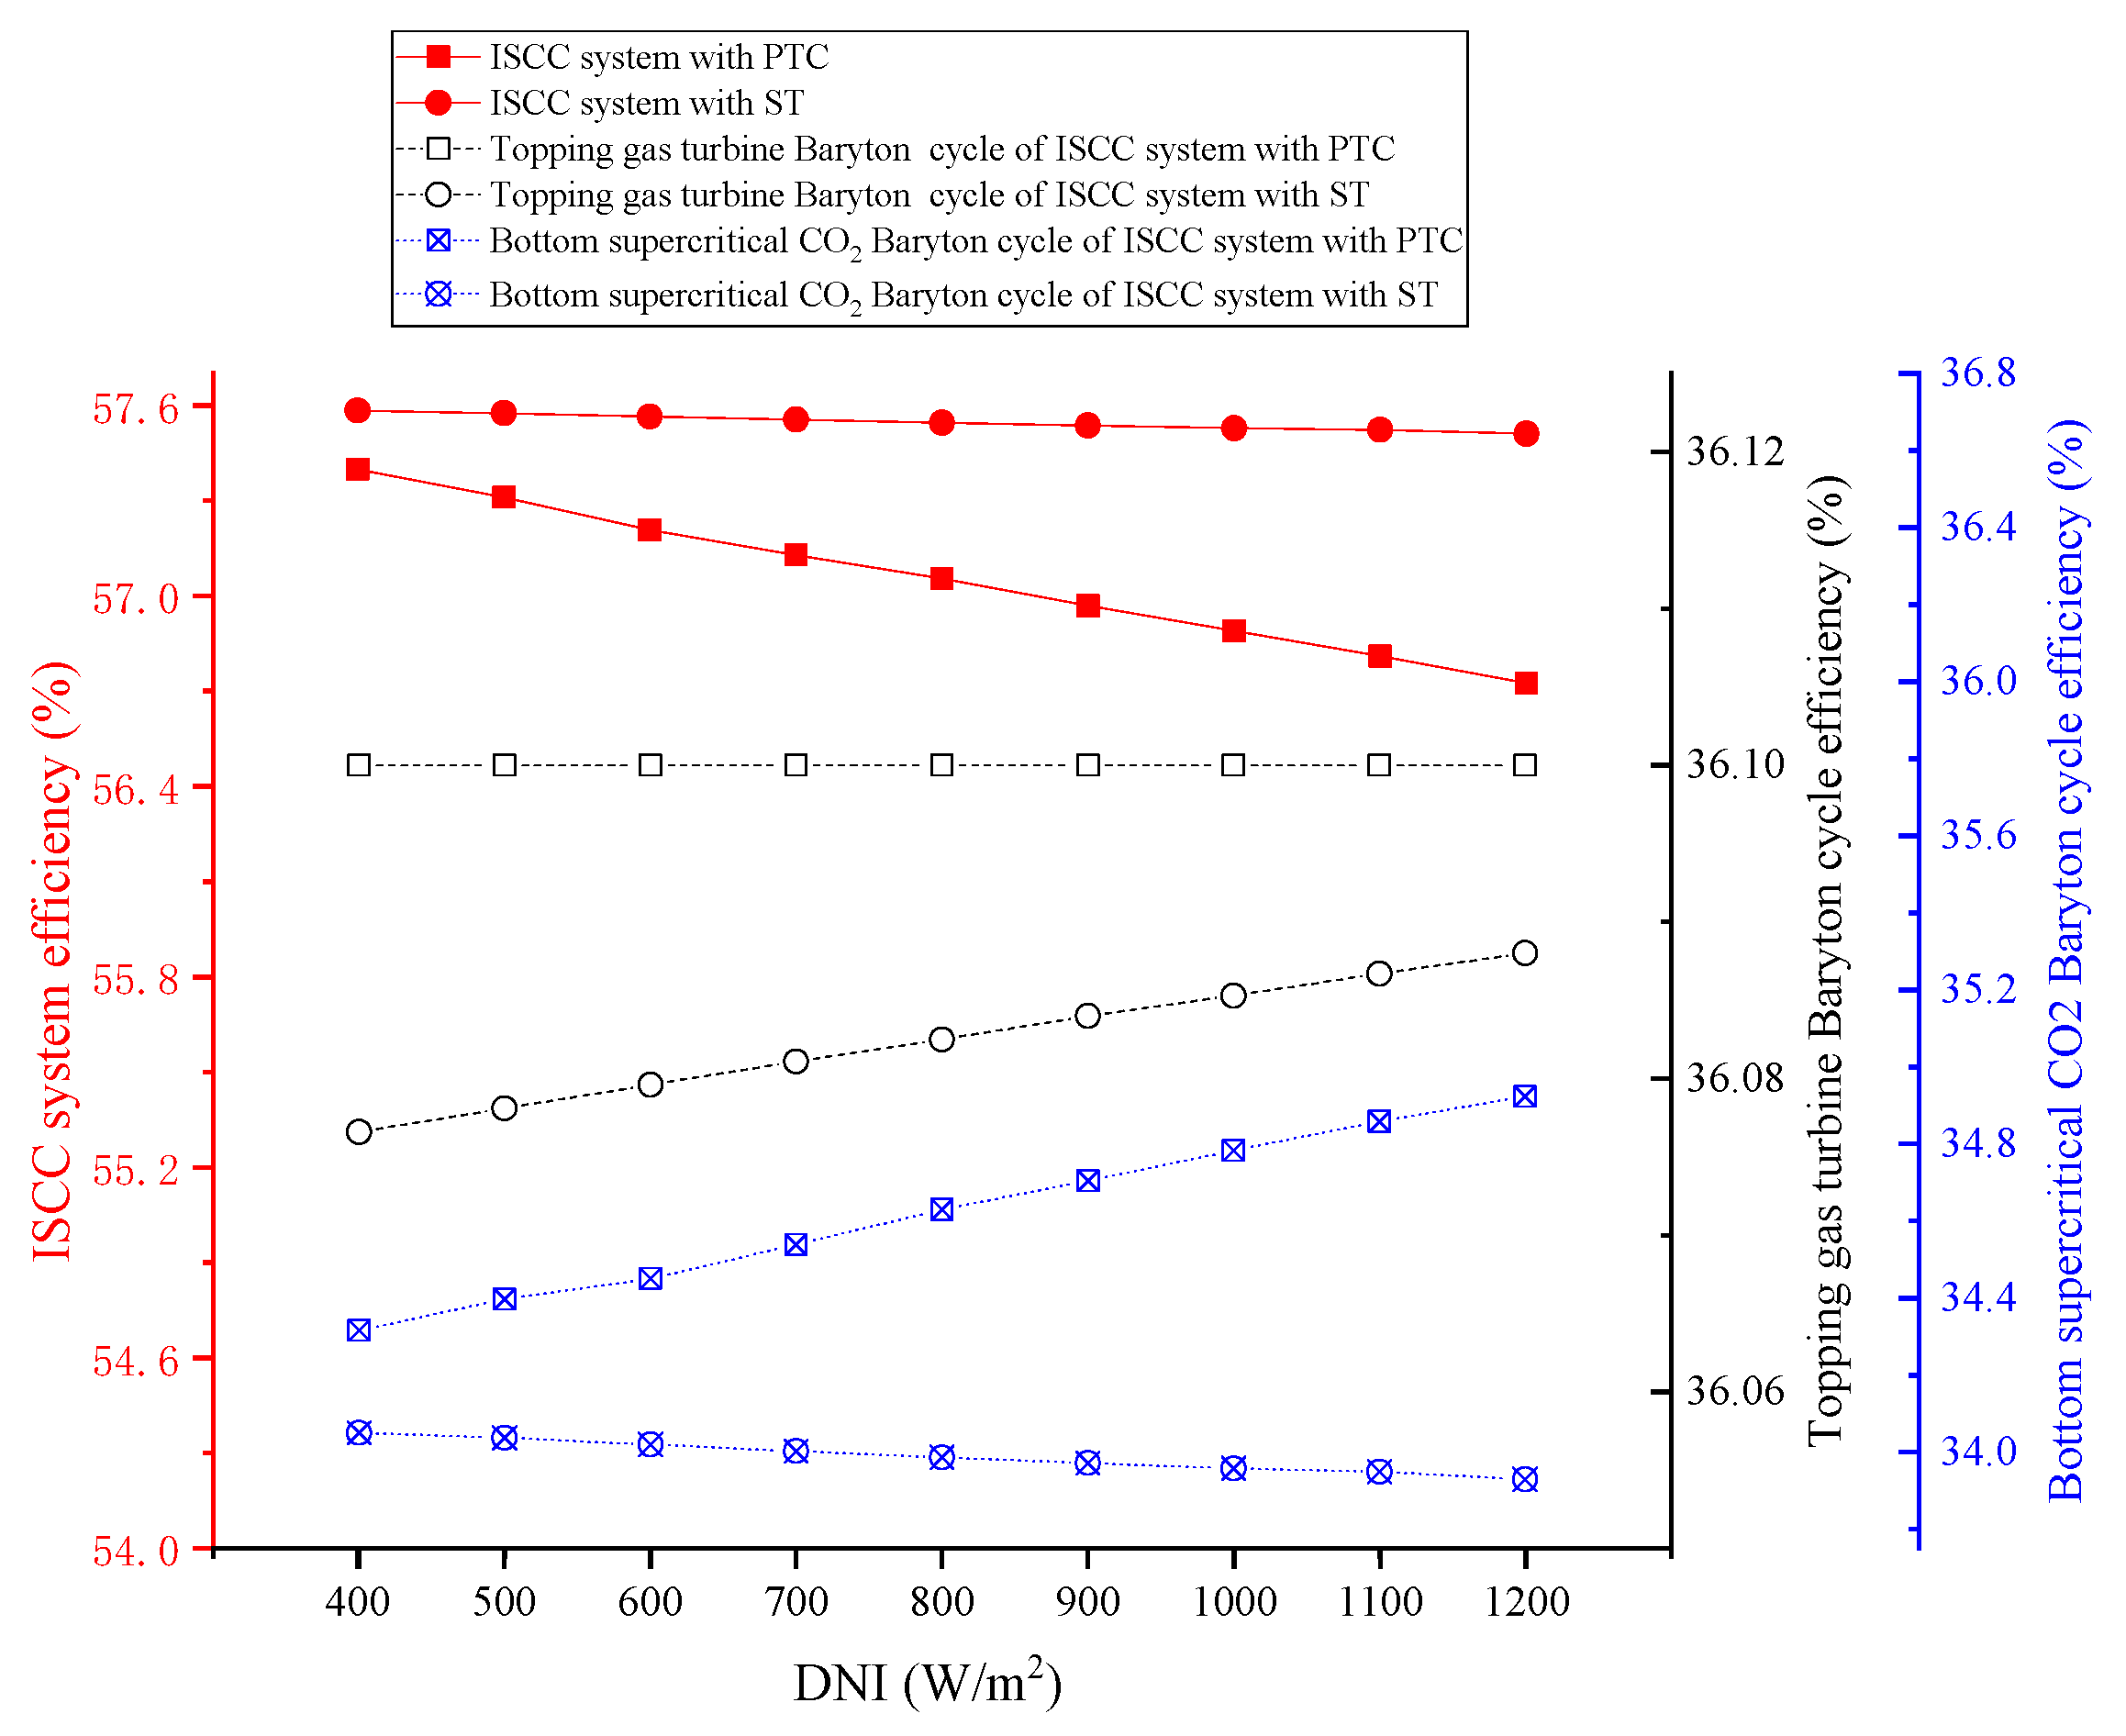
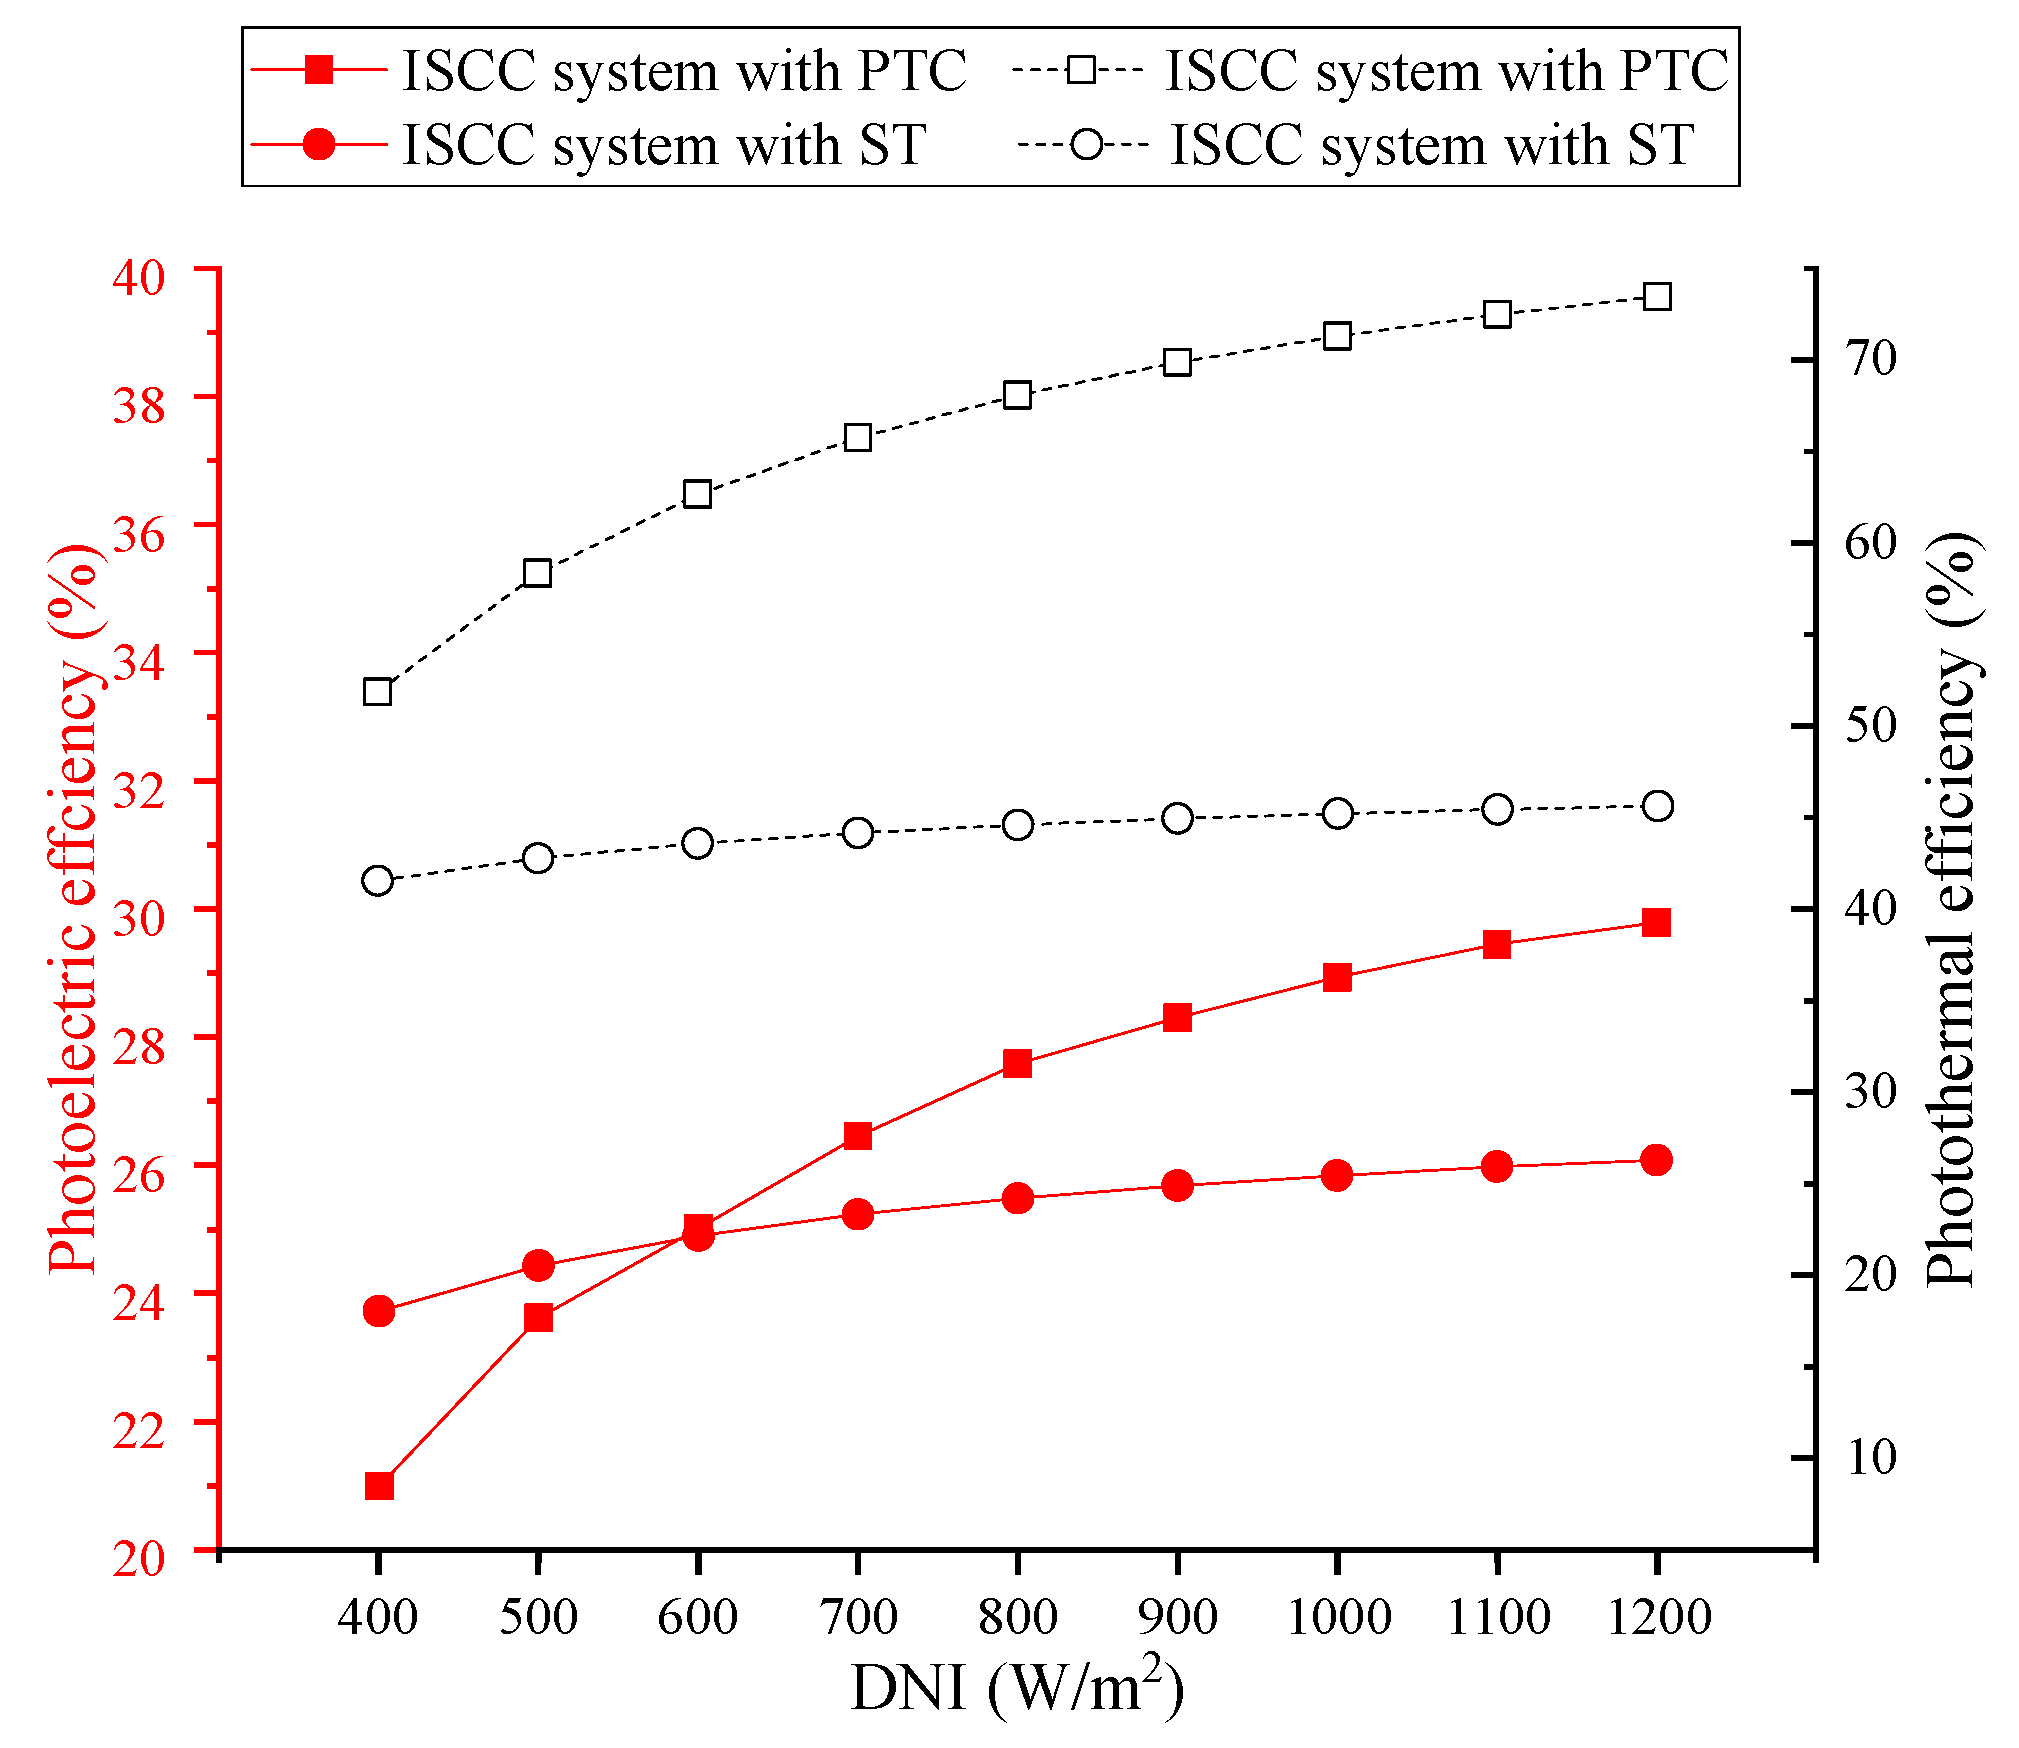
4.4.1. Impact of DNI

The variation of DNI affects the amount of solar energy collection in the ISCC system and consequently the thermodynamic parameters of the ISCC system. This subsection studies the trends in the thermal performance of two ISCC systems as the DNI fluctuates from 400 W/m2 to 1200 W/m2. Figure 13 illustrates the trend in the heat absorption of the working medium in ISCC system with the fluctuation of the DNI, showing that the total heat absorption of the ISCC system with PTC increases as the DNI increases, in which the heat absorption from the fuel remains constant and only the heat absorption from the solar energy increases. The heat absorption of the ISCC system with ST behaves in the opposite way: the total heat absorption slowly decreases as the DNI increases, although the heat absorption from the ST subsystem increases as the DNI increases, the mass flowrate of the fuel decreases for the purpose of keeping the TIT of the gas turbine constant; therefore, the heat absorption from the fuel decreases accordingly.
Figure 14 shows the trend of the output power of the ISCC system and solar energy with the fluctuation of DNI. It can be seen that for the ISCC system with PTC, the topping cycle output power is unaffected by the fluctuation of DNI and remains constant; as the DNI increases, the heat absorption of the PTC subsystem in the bottom cycle increases, and the bottom cycle output power also increases; eventually the total output power of the ISCC system with PTC increases with the increase of the DNI. For the ISCC system with ST, as the total heat absorption decreases with increasing DNI, the topping cycle output power also decreases slowly; and as the DNI increases, the consumption of fuel gradually decreases, which will lead to changes in the components of the gas turbine inlet gas, and its enthalpy decreases; these changes eventually lead to the reduction in both the mass flowrate and temperature of the gas turbine exhaust gas; and the gas turbine exhaust gas acts as the input hot side of the heat absorption in the bottom cycle, and the reduction in its total amount of heat leads to the reduction in bottom cycle output power; ultimately, the total system output power of the ISCC system with ST decreases with the increase of DNI. For both ISCC systems, the solar energy output power increases with increasing DNI, but it should be noted that as the design size of the ST subsystem is much larger than that of the PTC subsystem, the solar energy output power in ISCC system with ST is larger than that in ISCC system with PTC, both in order of the magnitude and the increase amplitude with increasing DNI.
Figure 15 presents the trends of the system efficiency, topping cycle efficiency, and bottom cycle efficiency of the ISCC system with the fluctuation of DNI. As shown in the figure, the system efficiencies of both the ISCC systems decrease as the DNI increases, with the ISCC system with PTC showing a greater decrease in efficiency than ISCC system with ST, in relative terms. The reason for this phenomenon is that the integrated position of the ISCC system with ST is at the topping cycle, which can participate in the whole thermodynamic process, and the temperature of its integrated position is also higher than that of the ISCC system with PTC. Therefore, the thermoelectric efficiency of the integrated solar energy in the ISCC system with ST is higher than that of ISCC system with PTC, and accordingly, the system efficiency in the ISCC system with ST is also higher than that of ISCC system with PTC; besides, the thermoelectric efficiency of the SEGS is lower than the system efficiency of the GTCC benchmark system. The greater the DNI is, the greater the proportion of integrated solar energy, and the greater the solar energy impact on the system efficiency. Solar energy has no impact on the topping cycle of the ISCC system with PTC, so the topping cycle efficiency of the ISCC system with PTC remains constant. The thermoelectric efficiency of the SEGS is slightly higher than the efficiency of a single topping or bottom cycle of the ISCC system; therefore, for the bottom cycle of the ISCC system with PTC, it is equivalent to coupling a SEGS with the higher thermoelectric efficiency to the bottom cycle of the benchmark system, which will inevitably lead to the increase in the bottom cycle efficiency of the ISCC system with PTC with the increase in DNI, and the trend of the topping cycle efficiency of the ISCC system with ST with the fluctuation of DNI can be obtained similarly. As the parameters of the gas turbine exhaust gas decrease with the increase of DNI, the operating conditions of the bottom cycle of ISCC system with ST gradually deviate from the design point, and its efficiency will inevitably decrease with the increase of DNI.
Figure 16 presents the trends of the photoelectric and photothermal efficiencies of the ISCC with the fluctuation of DNI. As shown in the figure, both the photoelectric efficiency and the photothermal efficiency of these two ISCC systems increase with the increase of DNI; however, the difference is that the increase amplitude of the two efficiency values of the ISCC system with PTC is greater than that of the ISCC system with ST. This is mainly because the solar energy collection temperature of the PTC subsystem is lower than that of the ST subsystem, i.e., the solar energy collection loss of the ISCC system with PTC is lower. It is worth noting that the photothermal efficiency of the ISCC system with PTC is higher than that of the ISCC system with ST when the DNI fluctuates in the range of 400 W/m2 to 1200 W/m2, while the curves of the photoelectric efficiencies of the two ISC systems are intersected at approximately 600 W/m2. If the DNI is less than 600 W/m2, the ISCC system with PTC has a lower photoelectric efficiency, while if the DNI is greater than 600 W/m2, the ISCC system with ST has a lower photoelectric efficiency.

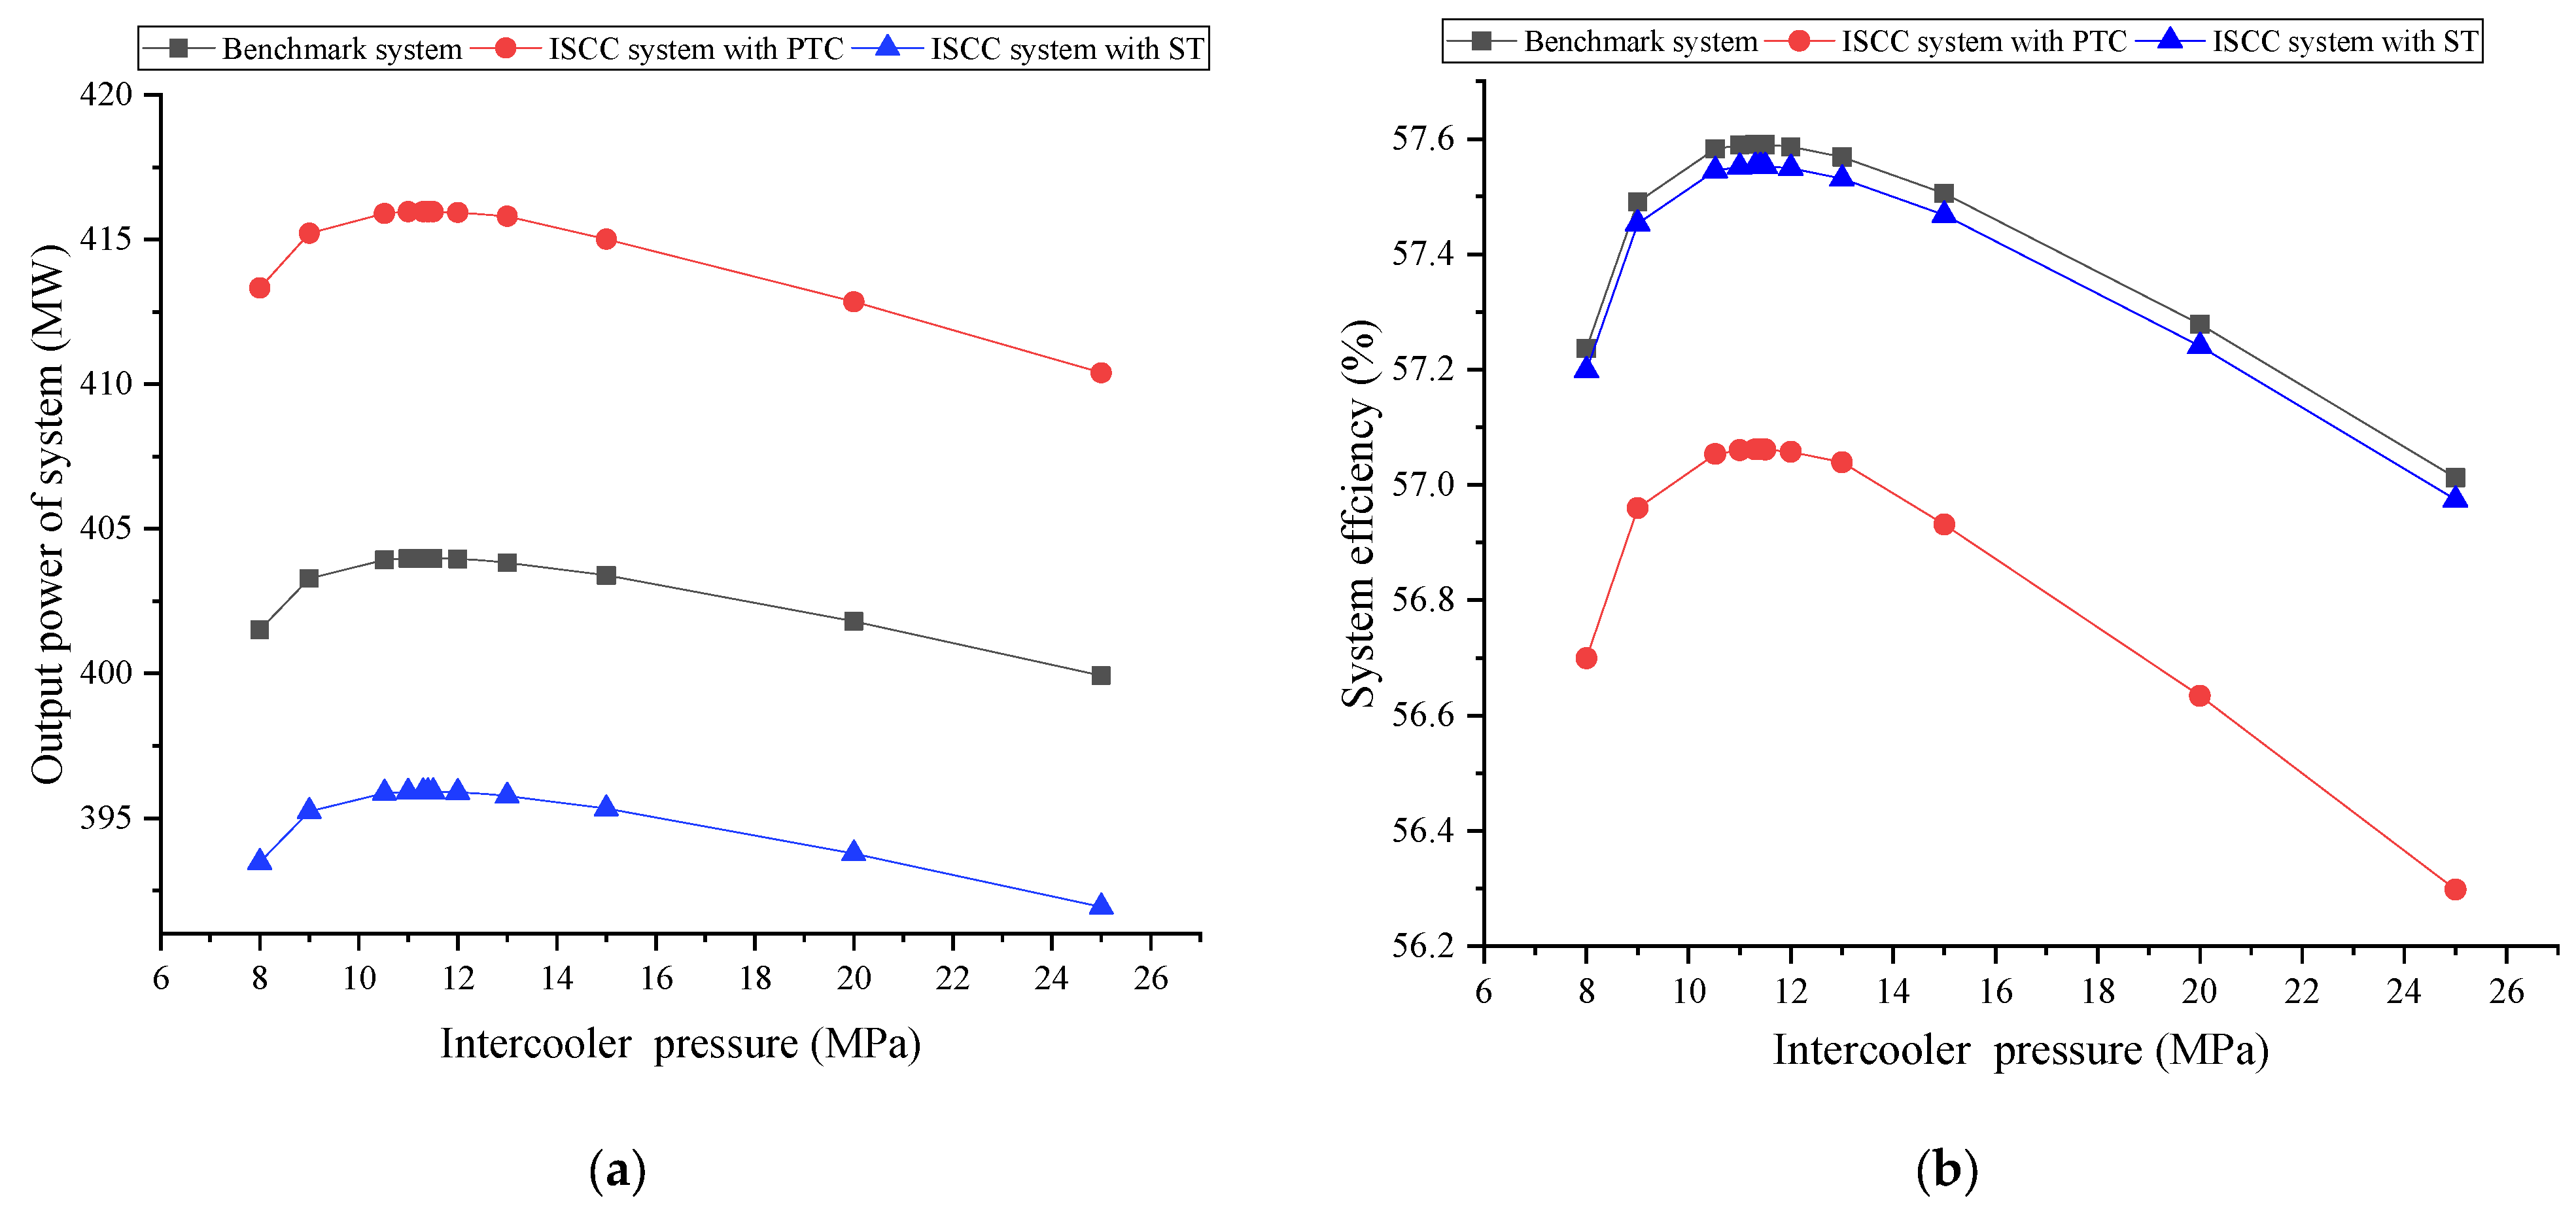
4.4.2. Impact of Intercooler Pressure

The trends of the output power and system efficiency of the benchmark system as well as the ISCC systems with the change of intercooler pressure are shown in Figure 17. As can be seen, the trend of output power and system efficiency with intercooler pressure fluctuation tends to be consistent for these three systems mentioned above, with their curves showing a parabolic-like variation and all reaching the maximum values when the intercooler pressure is approximately 11.3 MPa. The maximum output power of the benchmark system, ISCC system with PTC, and ISCC system with ST are 403.98 MW, 415.96 MW, and 395.92 MW, respectively; and the maximum system efficiency is 57.6%, 57.1%, and 57.6% respectively.

5. Conclusions

In this study, a novel GTCC system with a supercritical CO2 Brayton bottom cycle is proposed. The performance differences between the novel GTCC system and the conventional GTCC system are compared, and the model of the ISCC system with PTC and the ISCC system with ST are built with the novel GTCC system as the benchmark system. The main conclusions are as follows:
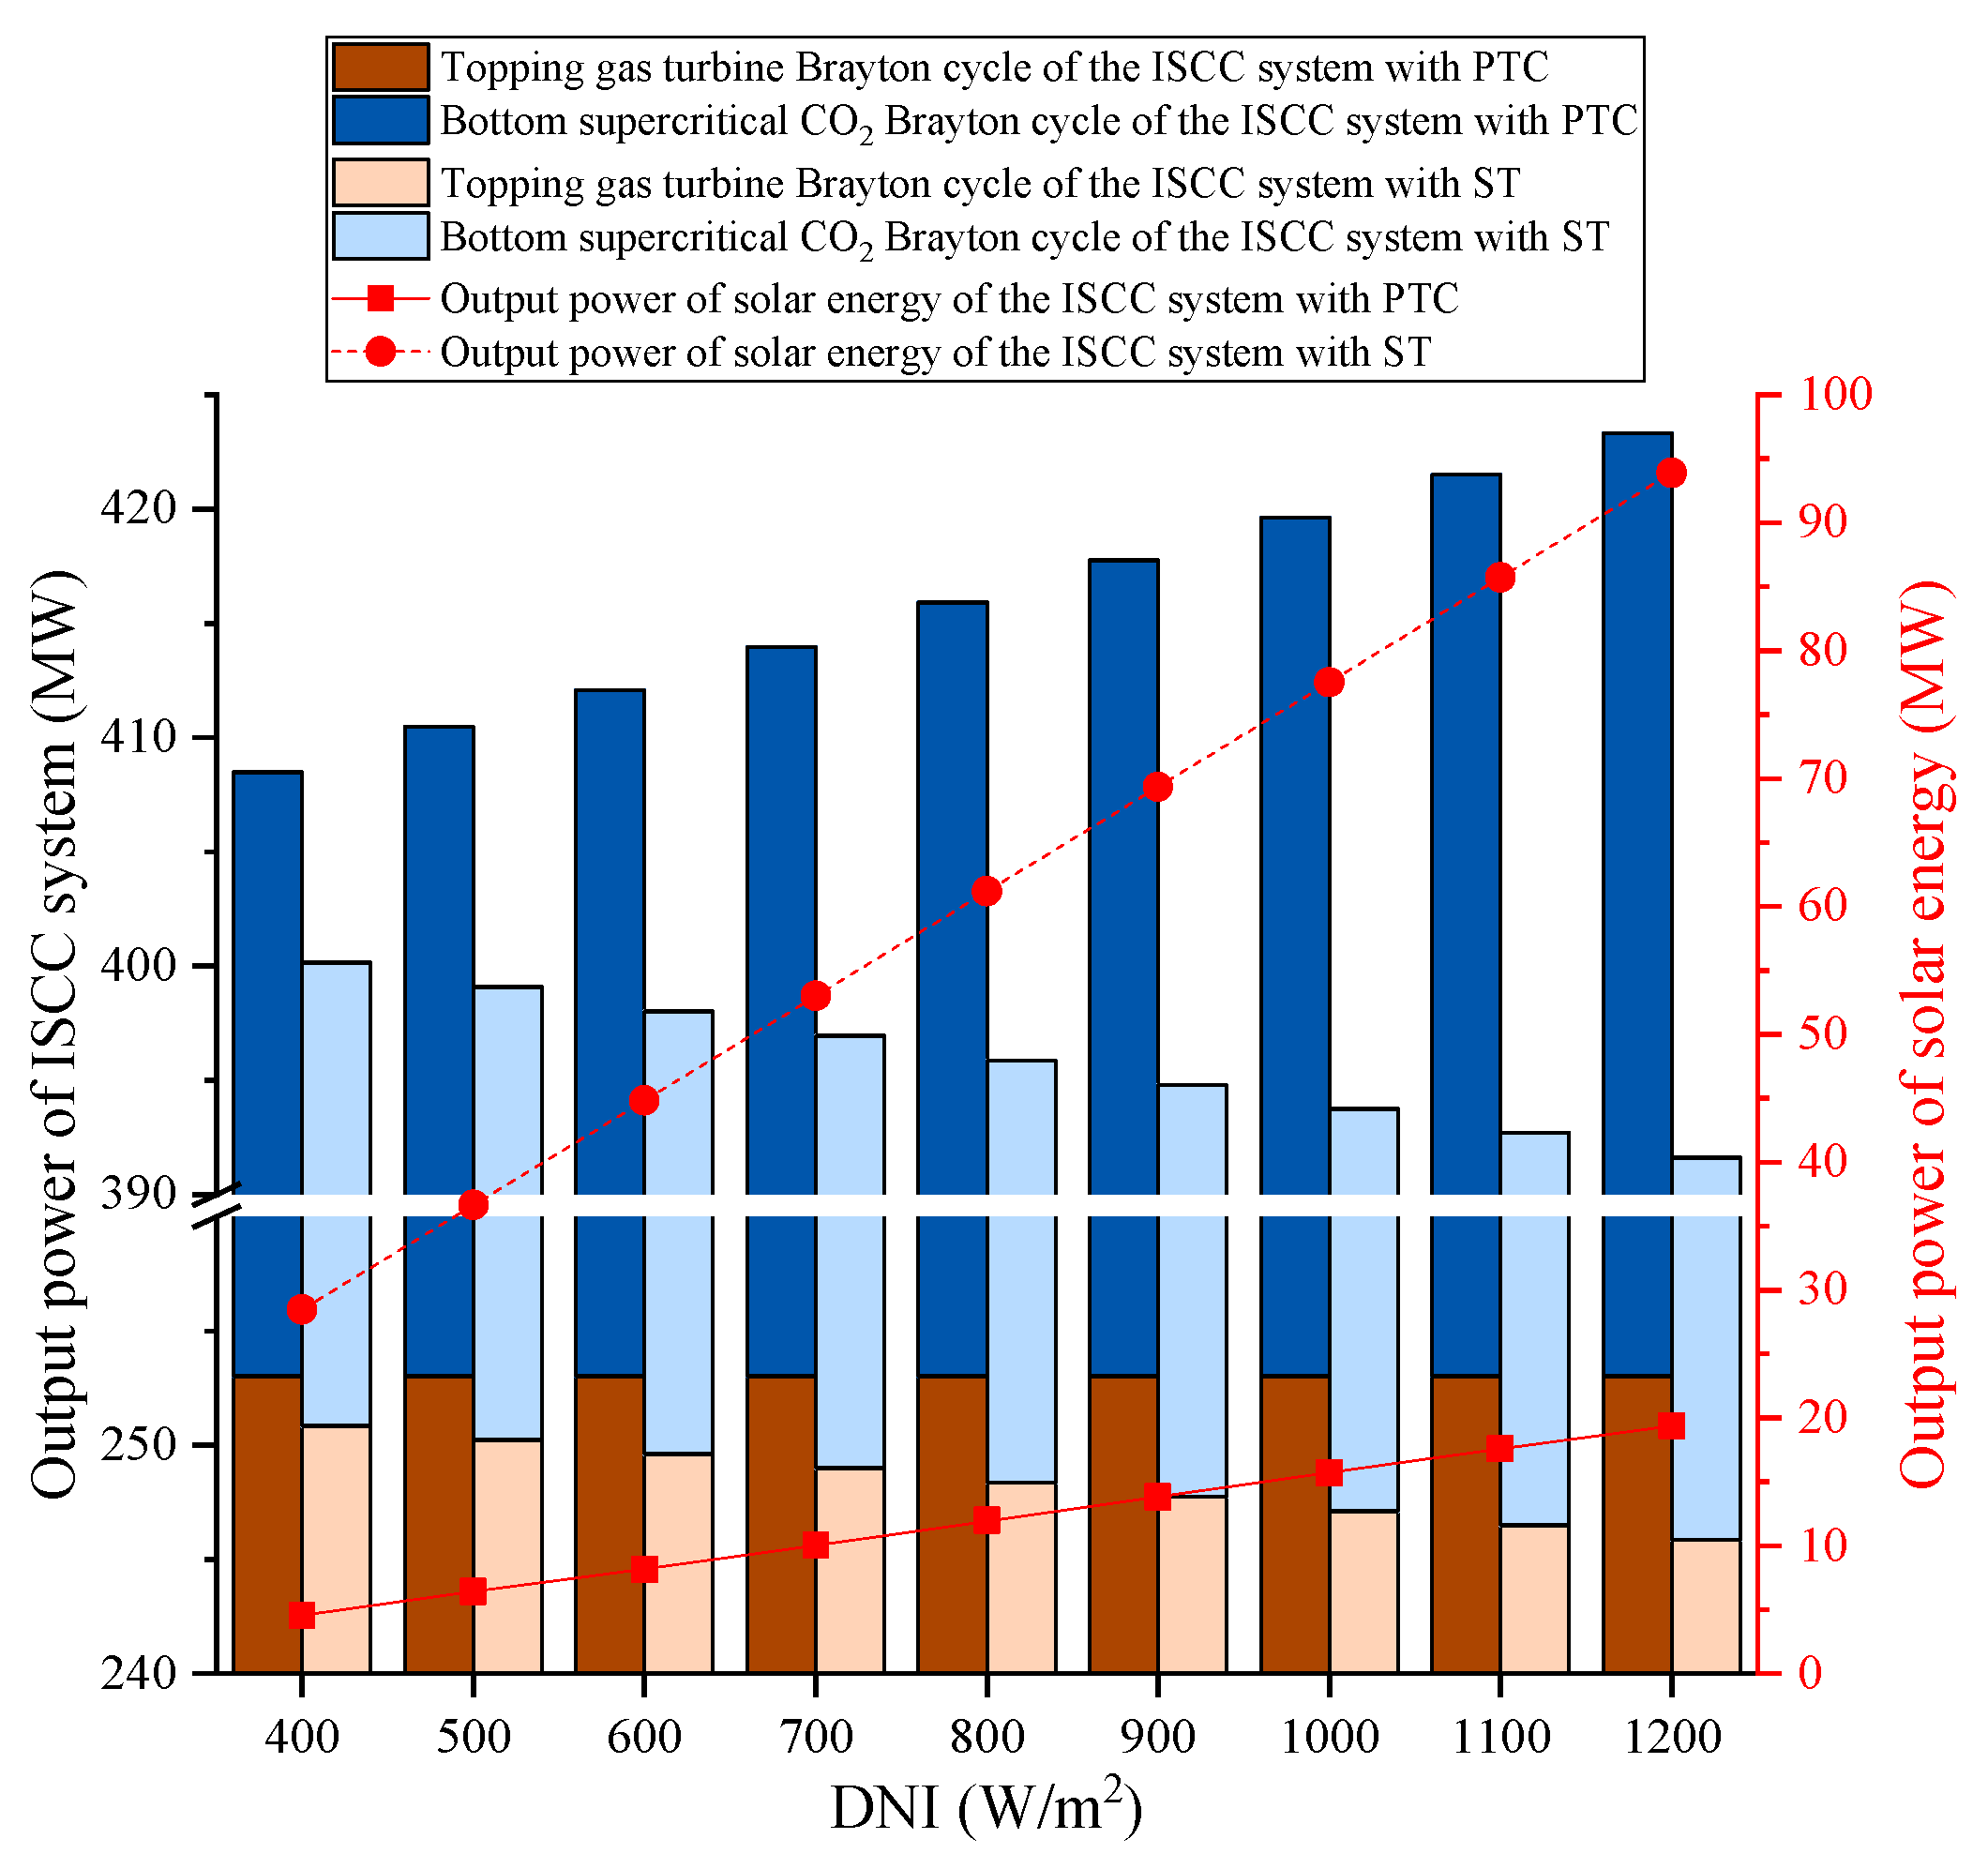
  • The solar energy integration of both ISCC systems leads to a reduction in system efficiency; however, with the increase of the DNI, the output power of ISCC system with PTC increases due to the increase of the working medium mass flowrate in the bottom cycle, while the output power of ISCC system with ST decreases due to the change in gas composition; the photoelectric efficiency of ISCC system with PTC is greater than that of ISCC system with ST as the losses in the PTC subsystem are less than that in the ST subsystem.
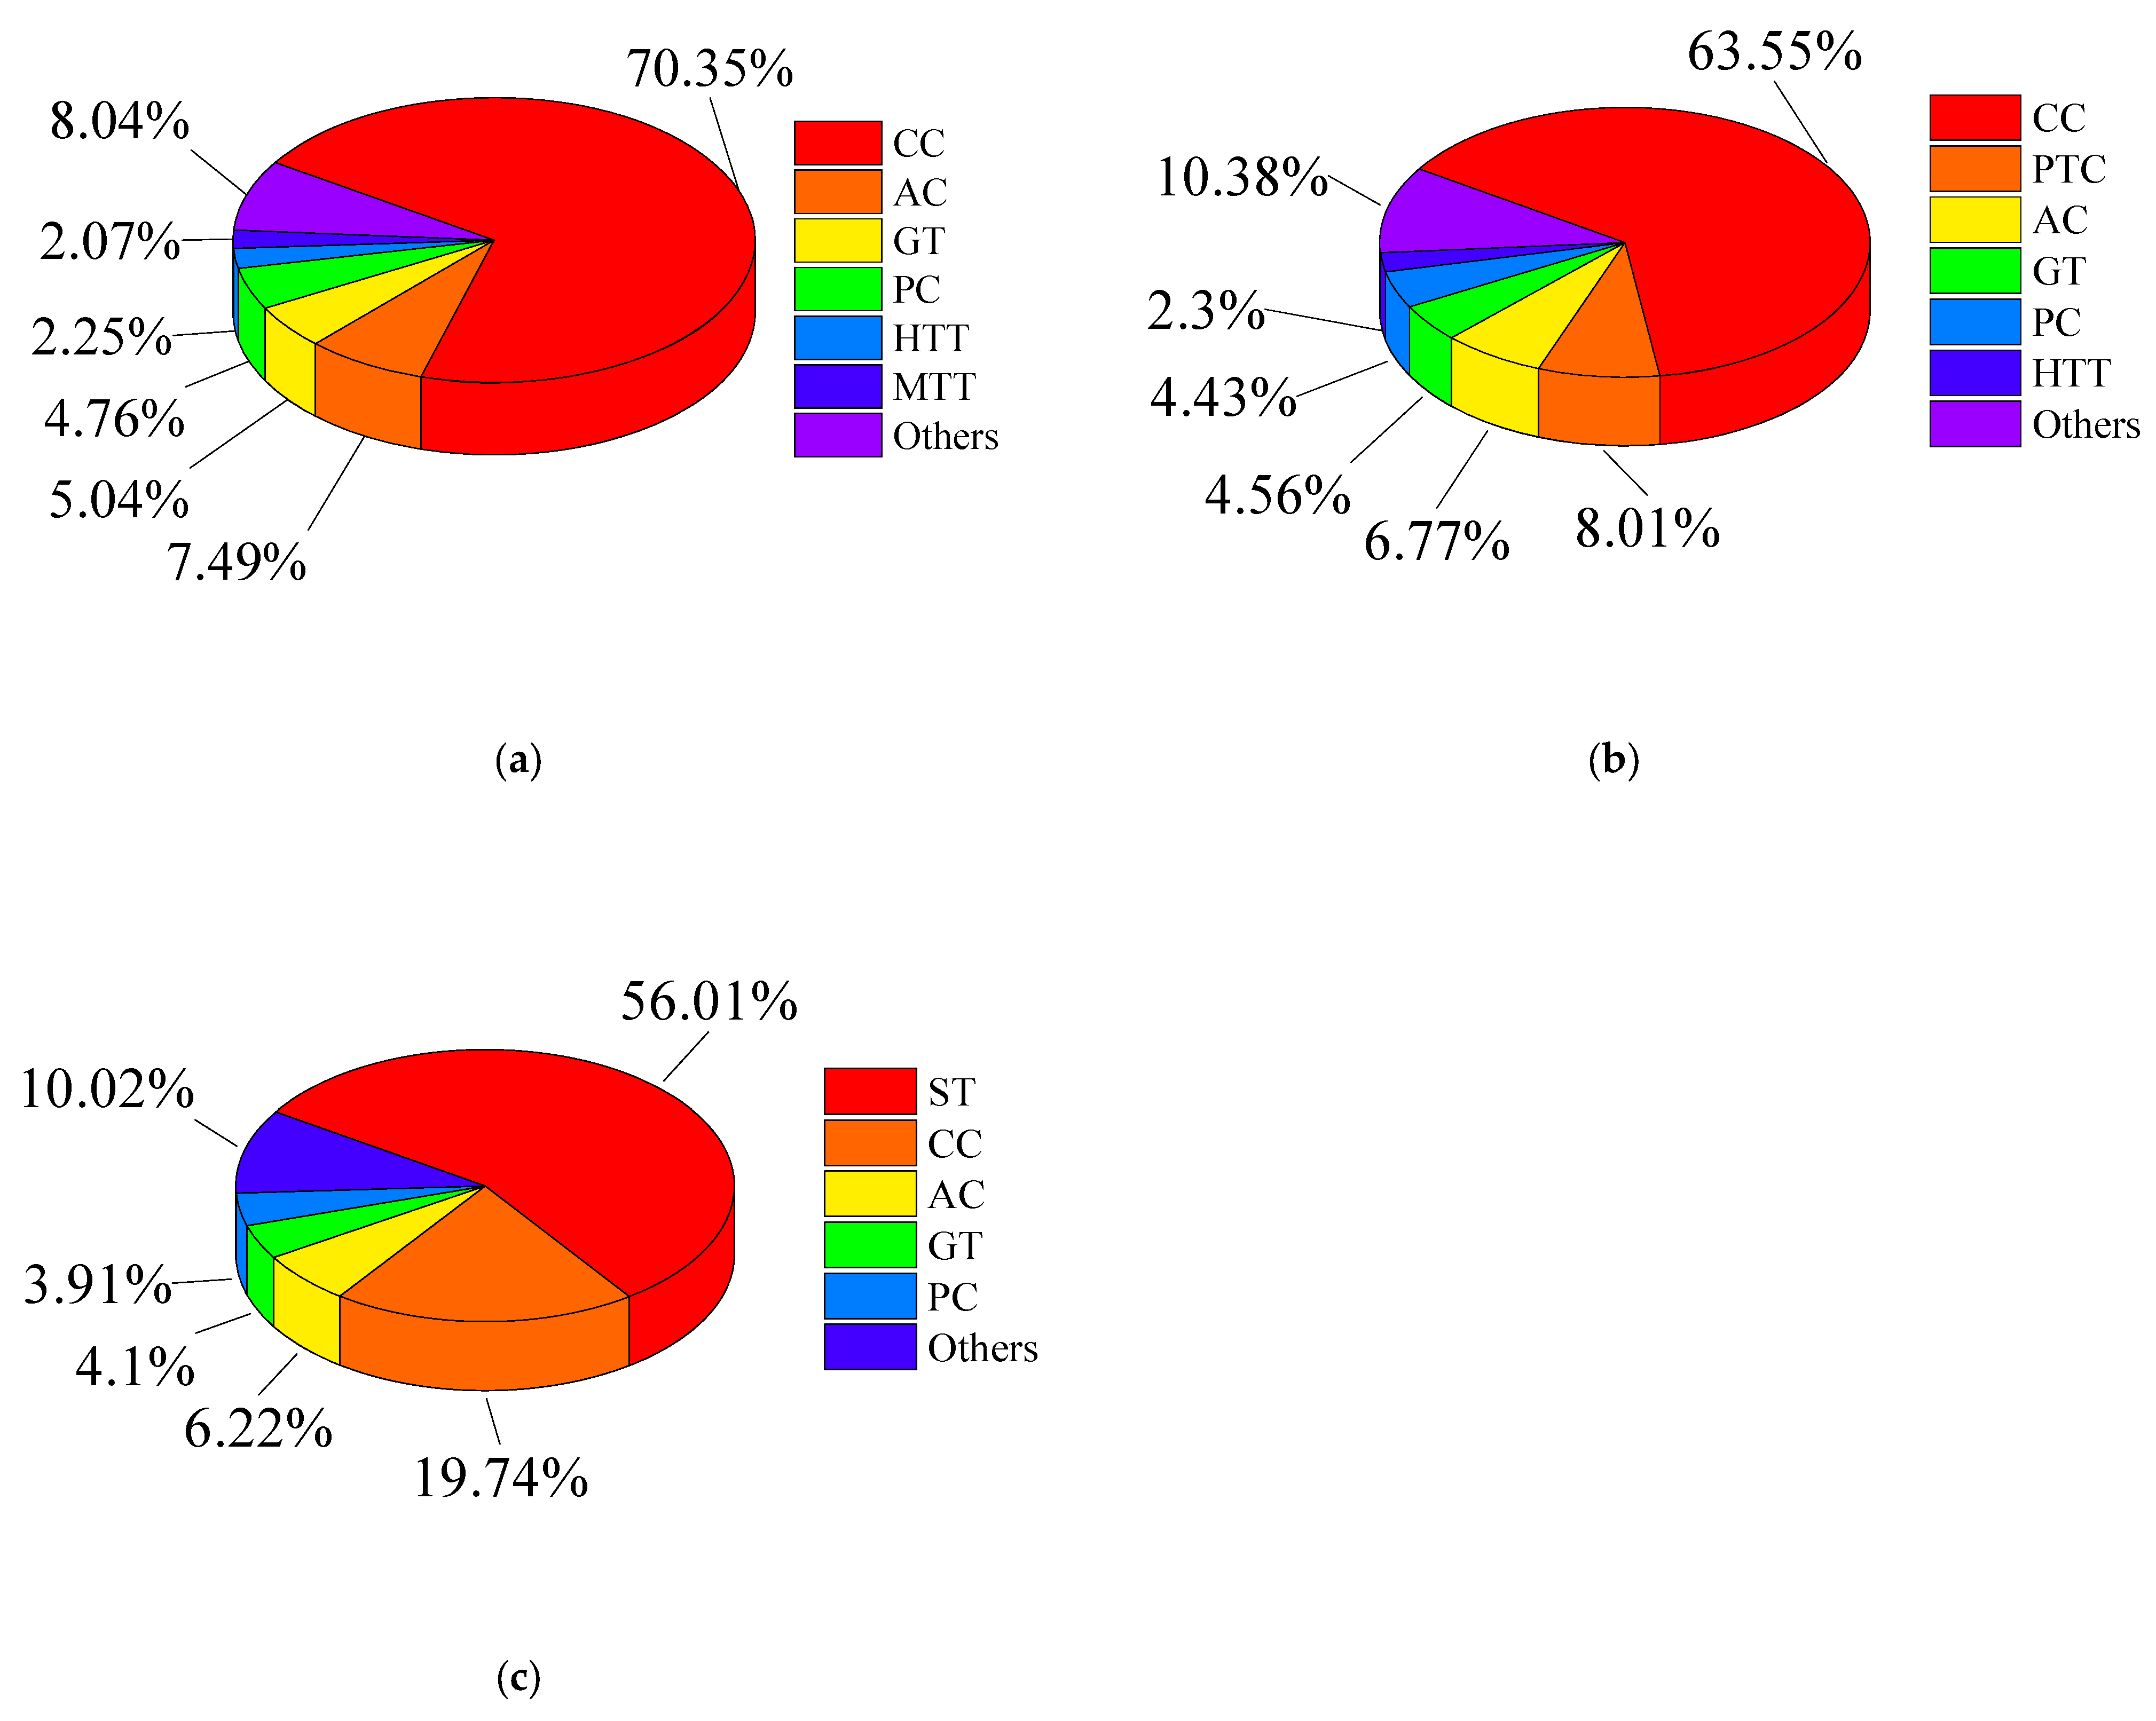
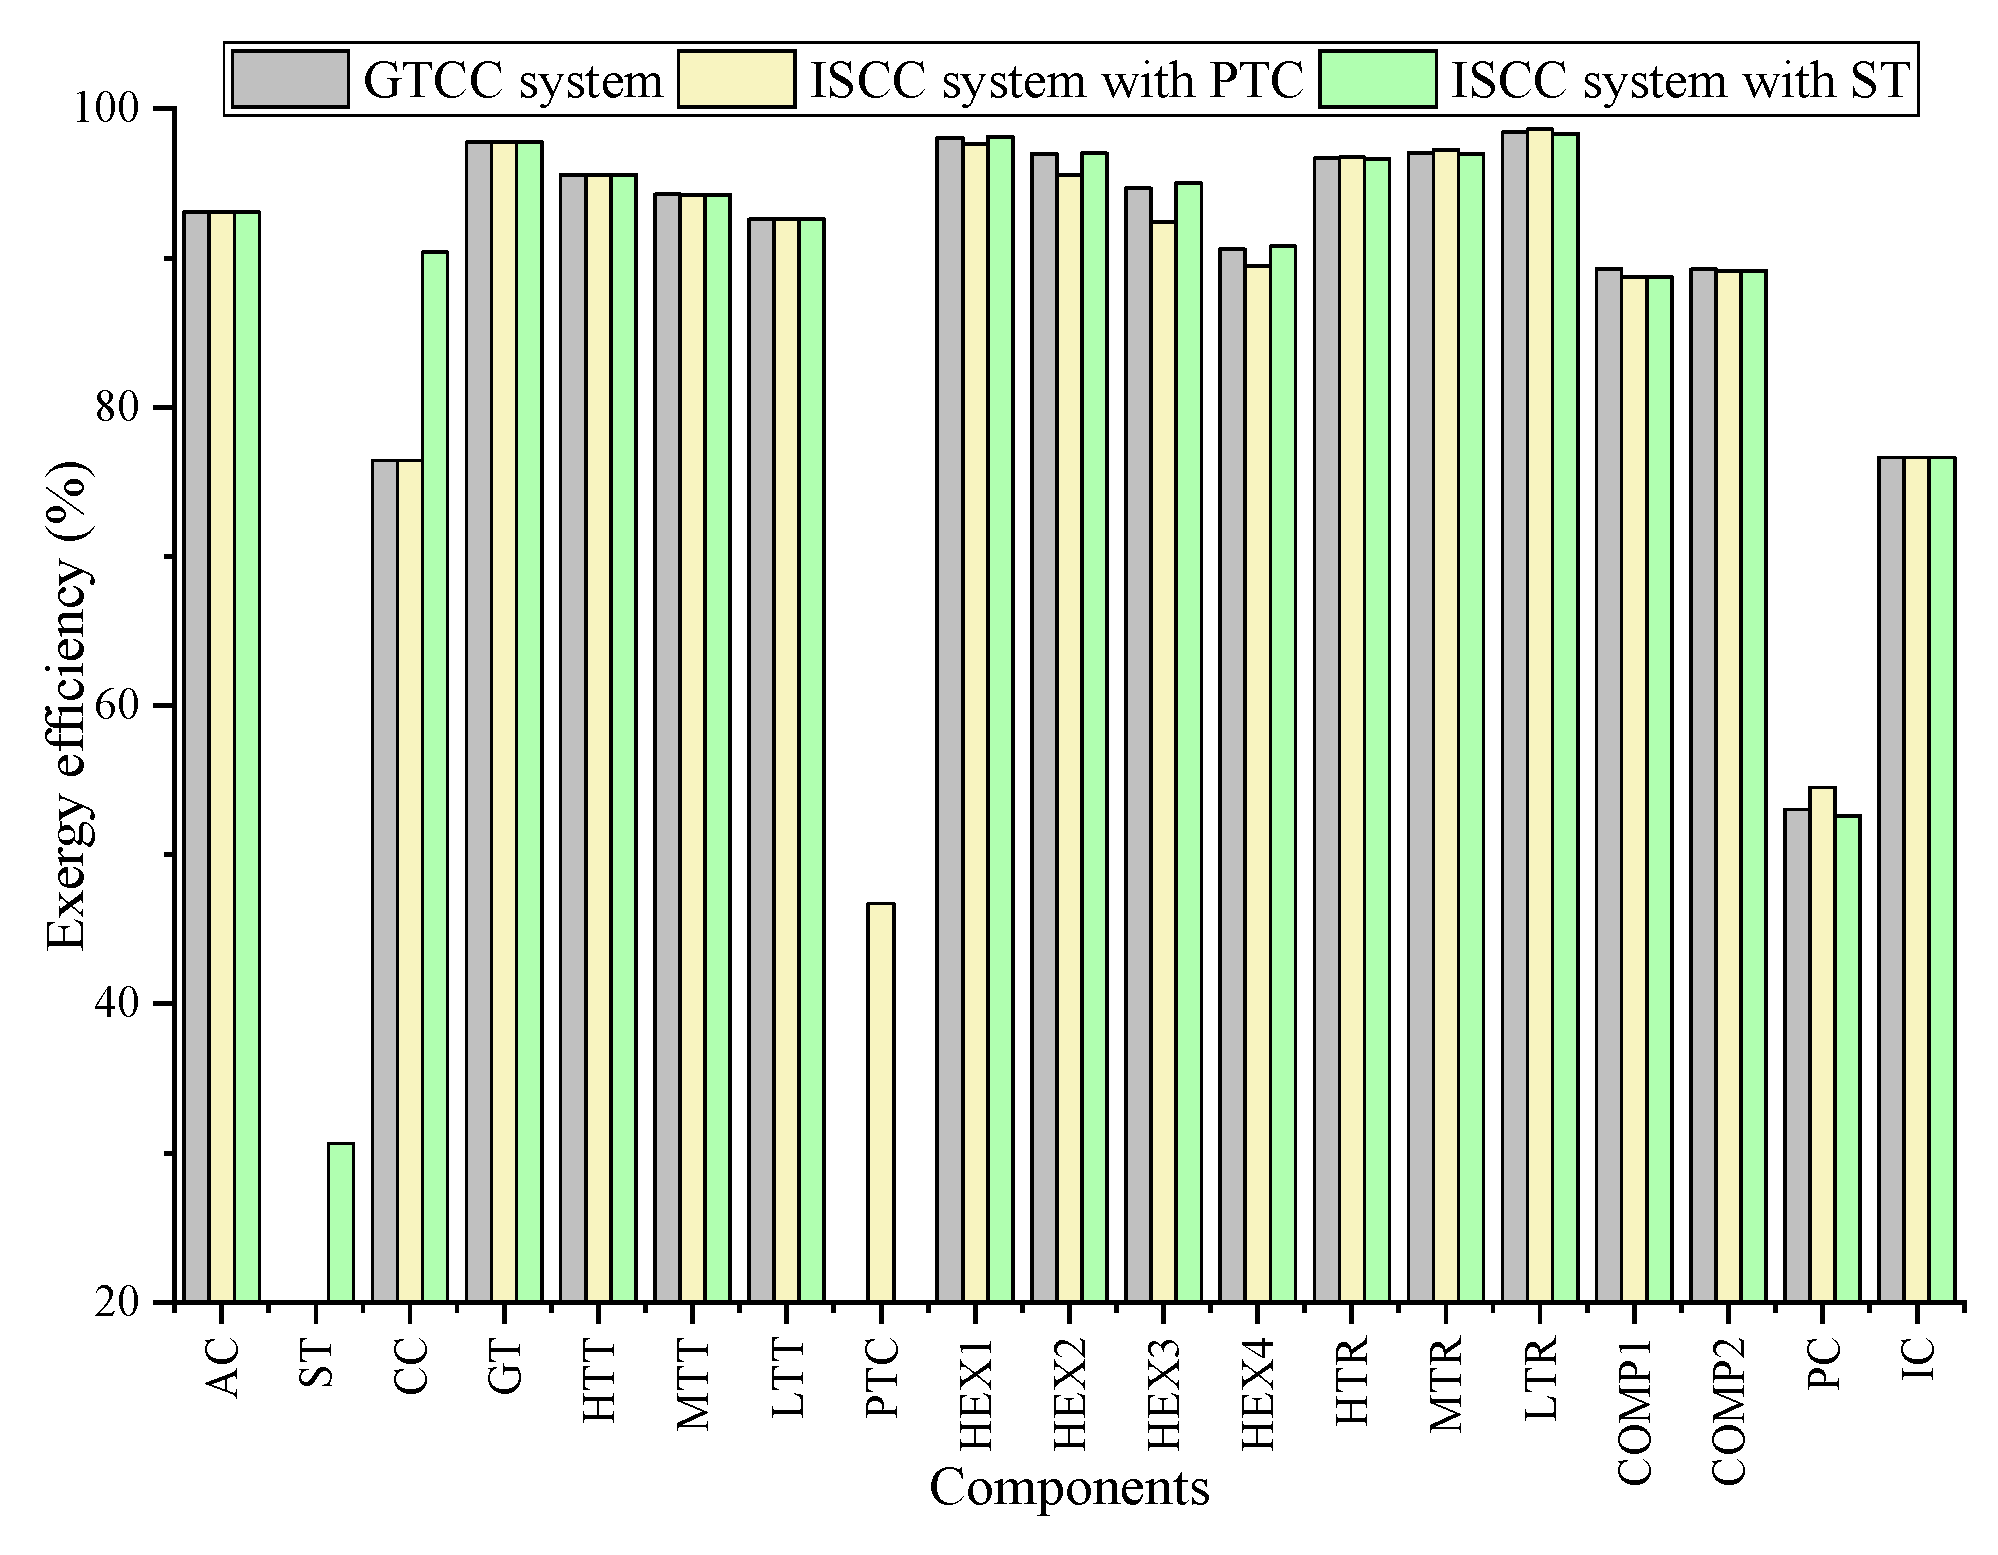
  • The integration of solar energy will change the exergy destruction and exergy efficiency of every component within the ISCC systems. CC, AC, GT, and solar energy collectors (including PTC and ST) are the components with the highest exergy destruction, while solar energy collectors (including PTC and ST) are the components with the lowest exergy efficiency in the ISCC systems.
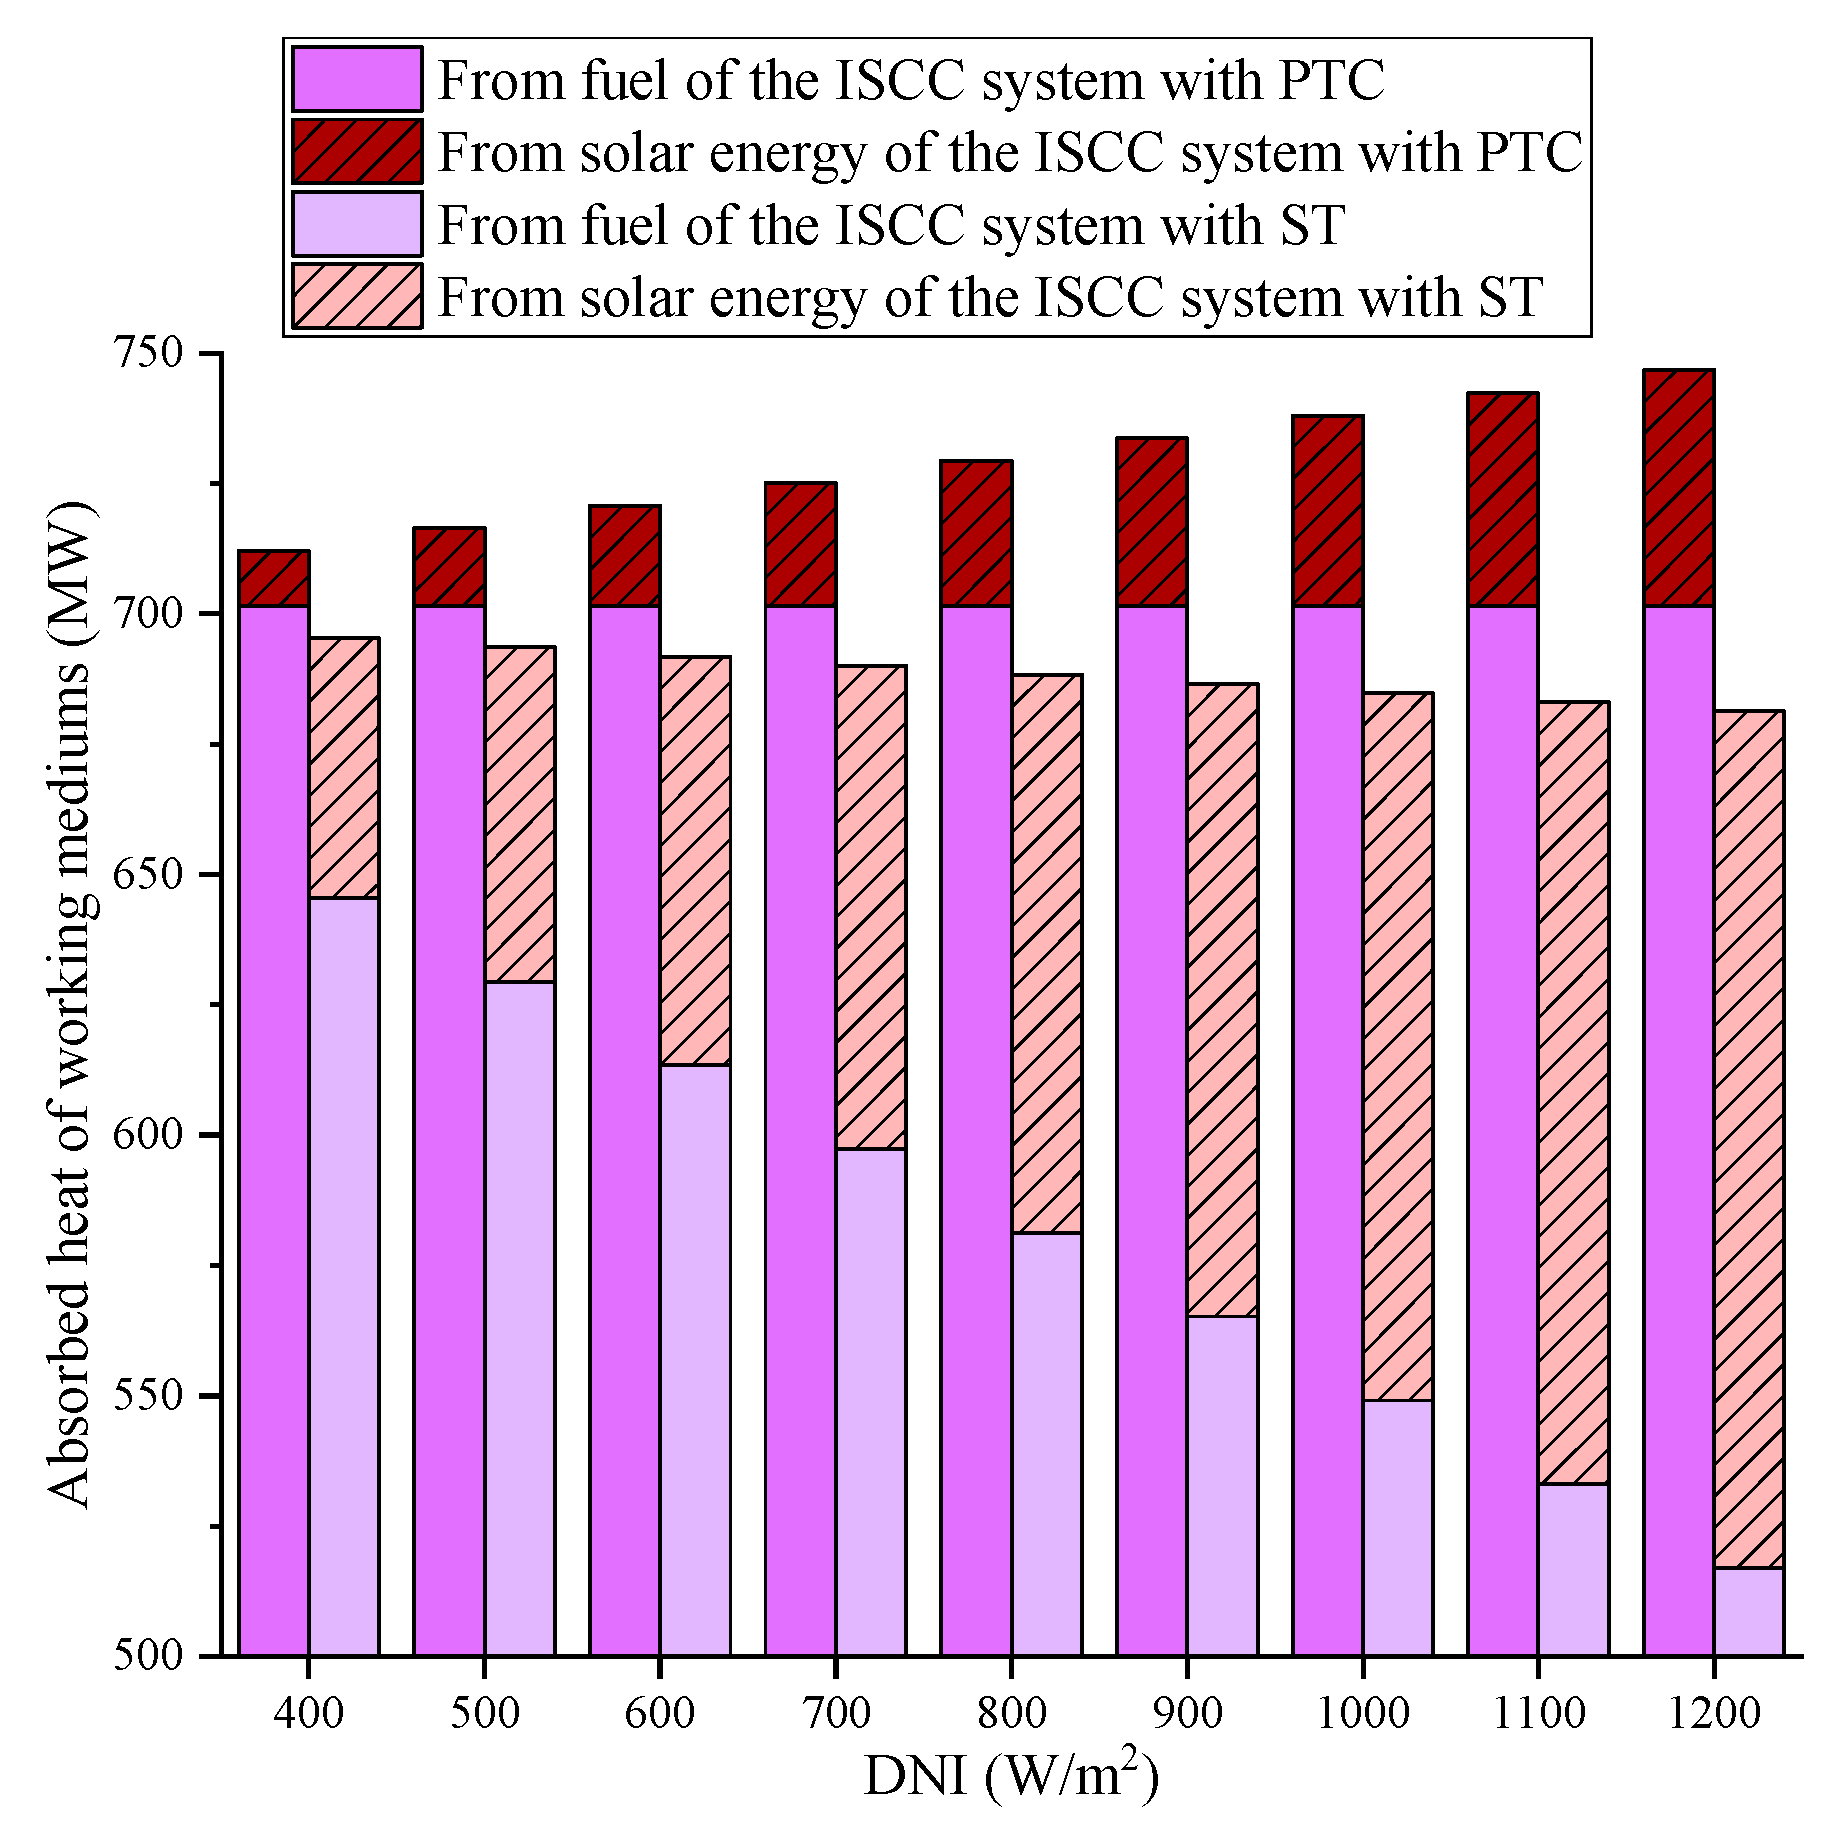
  • As the DNI increases, the heat absorption and output power of the ISCC system with PTC increase, while the opposite is true for the ISCC system with ST. Their system efficiencies decrease with the increase of DNI, while the photothermal efficiency and photoelectric efficiency increase. In addition, the photoelectric efficiency of the ISCC system with ST is higher when DNI is less than 600 W/m2; conversely, the photoelectric efficiency of the ISCC system with PTC is higher.
  • The GTCC benchmark system, the ISCC system with PTC, and the ISCC system with ST reach the optimum at an intercooling pressure of 11.3 MPa, where the maximum output power and system efficiency of the GTCC benchmark system are 403.98 MW and 57.6%, respectively; the maximum output power and system efficiency of the ISCC system with PTC are 415.96 MW and 57.1%, respectively; and the maximum output power and system efficiency of the ISCC system with ST are 395.92 MW and 57.6%, respectively.

Author Contributions

Z.Z.: methodology, software, writing. L.D.: supervision, writing—reviewing and editing. Z.W.: data curation, validation. Y.R.: supervision, editing. All authors have read and agreed to the published version of the manuscript.

Funding

This research was funded by the National Natural Science Foundation of China (No. 52090064), the Science Fund for Creative Research Groups of the National Natural Science Foundation of China (No. 51821004), and the Fundamental Research Funds for the Central Universities (No. 2018QN024).

Data Availability Statement

Data is contained within the article.

Conflicts of Interest

The authors declare no conflict of interest.

Nomenclature

Mathematical symbols:
A Energy grade of the fuel
A h e l Field area of the tower heliostat, m2
A p t m Field area of the parabolic trough mirror, m2
E f u e l Exergy of the fuel, MW
E i n p u t Exergy input of the component, MW
E l o s s Exergy destruction of the component, MW
E p r o d u c t Exergy product of the component, MW
E s o l a r Exergy of solar energy, MW
M g a s Fuel mass flowrate, kg/s
M g a s , i s c c p t c Consumed fuel mass flowrate of ISCC system with PTC, kg/s
M g a s , i s c c s t Consumed fuel mass flowrate of ISCC system with ST, kg/s
M g a s , g t c c Consumed fuel mass flowrate of GTCC, kg/s
Q e x h a u s t Total heat from gas turbine exhaust gas of GTCC, MW
Q e x h a u s t p t c Total heat from gas turbine exhaust gas of ISCC system with PTC, MW
Q e x h a u s t s t Total heat from gas turbine exhaust gas of ISCC system with ST, MW
Q f u e l Amount of heat released from the fuel of GTCC, MW
Q f u e l p t c Amount of heat released from the fuel of ISCC system with PTC, MW
Q f u e l s t Amount of heat released from the fuel of ISCC system with ST, MW
Q h e a t l o s s Heat loss of the vacuum collector in PTC, MW
Q l o s s c o n v Convective losses of the tower receiver, MW
Q l o s s o p t Optical loss of the tower receiver, MW
Q l o s s p t c Losses of the vacuum collector in PTC, MW
Q l o s s r a d Radiation losses of the tower receiver, MW
Q l o s s s t Losses of the tower receiver in ST, MW
Q p i p e Heat loss of the piping between two collectors and the header piping, MW
Q s o l a r Solar irradiation incident on the mirror field, MW
Q s o l a r p t c Solar irradiation incident on the parabolic trough mirror field, MW
Q s o l a r s t Solar irradiation incident on the tower heliostat field, MW
Q s t c p t c Solar thermal collection of ISCC system with PTC, MW
Q s t c s t Solar thermal collection of ISCC system with ST, MW
T a t m Atmosphere temperature, K
T s o l Solar surface temperature, K
W g t c c Power generation volume of GTCC, MW
W i s c c p t c Power generation volume of ISCC system with PTC, MW
W i s c c s t Power generation volume of ISCC system with ST, MW
W s o l p t c Amount of solar energy power generation in ISCC system with PTC, MW
W s o l s t Amount of solar energy power generation in ISCC system with ST, MW
Greek letters:
η a t m p t c Atmospheric influence factor of the parabolic trough mirror field
η a t m s t Atmospheric influence factor of the tower heliostat field
η a v a p t c Availability of the parabolic trough mirror field
η a v a s t Availability of the tower heliostat field
η c l e a n p t c Mirror cleanliness factor of the parabolic trough mirror field
η c l e a n s t Mirror cleanliness factor of the tower heliostat field
η c o s p t c Cosine loss factor of the parabolic trough mirror field
η c o s s t Cosine loss factor of the tower heliostat field
η e n d p t c End loss factor of the parabolic trough mirror field
η e n d s t End loss factor of the tower heliostat field
η e x Exergy efficiency of the component
η g t c c System efficiency of GTCC
η i s c c p t c System efficiency of ISCC system with PTC
η i s c c s t System efficiency of ISCC system with ST
η o p t p t c Optical efficiency of the parabolic trough mirror field
η o p t s t Optical efficiency of the tower heliostat field
η p e p t c Photoelectric efficiency of solar energy in ISCC system with PTC
η p e s t Photoelectric efficiency of solar energy in ISCC system with ST
η p t p t c Photothermal efficiency of solar energy in ISCC system with PTC
η p t s t Photothermal efficiency of solar energy in ISCC system with ST
η r e f p t c Reflectivity of the parabolic trough mirror field
η r e f s t Reflectivity of the tower heliostat field
η s h a d p t c Shading loss factor of the parabolic trough mirror field
η s h a d s t Shading loss factor of the tower heliostat field
Superscripts:
b o t t o m Bottom cycle of the system
t o p p i n g Topping cycle of the system
Abbreviations:
DNIDirect normal irradiance
DRDEDeveloped double recuperative double expansion
DSGDirect steam generation
GTCCGas turbine combined cycle
HEX1Heat exchanger 1
HEX2Heat exchanger 2
HEX3Heat exchanger 3
HEX4Heat exchanger 4
HRSGHeat recovery steam generator
HTHigh temperature
HTFHeat transfer fluid
HTRHigh temperature recuperator
ICIntercooler
ISCCIntegrated solar combined cycle
LCOELevelized cost of energy
LHVLower heating value
LTLow temperature
LTRLow temperature recuperator
MTMedium temperature
MTRMedium temperature recuperator
ORCOrganic Rankine cycle
PCPrecooler
PTCParabolic trough solar collector
SEGSSolar electric generating system
STSolar tower
TITTurbine inlet temperature

References

  1. Heide, S.; Gampe, U.; Orth, U.; Beukenberg, M.; Gericke, B.; Freimark, M.; Langnickel, U.; Pitz-Paal, R.; Buck, R.; Giuliano, S. Design and Operational Aspects of Gas and Steam Turbines for the Novel Solar Hybrid Combined Cycle SHCC®. In Controls, Diagnostics and Instrumentation, Proceedings of the Turbo Expo: Power for Land, Sea, and Air, Glasgow, UK, 14–18 June 2010; Cycle Innovations; Marine; ASMEDC: Glasgow, UK, 2010; Volume 3, pp. 465–474. [Google Scholar]
  2. Johansson, T.B. Renewable Energy, Sources for Fuels and Electricity; Island Press: Washington, DC, USA, 1993; Chapter 5; pp. 234–235. [Google Scholar]
  3. Zhang, Z.; Duan, L.; Wang, Z.; Ren, Y. General Performance Evaluation Method of Integrated Solar Combined Cycle (ISCC) System. Energy 2022, 240, 122472. [Google Scholar] [CrossRef]
  4. Horn, M.; Führing, H.; Rheinländer, J. Economic Analysis of Integrated Solar Combined Cycle Power Plants: A Sample Case: The Economic Feasibility of an ISCCS Power Plant in Egypt. Energy 2004, 29, 935–945. [Google Scholar] [CrossRef]
  5. Alqahtani, B.J.; Patiño-Echeverri, D. Integrated Solar Combined Cycle Power Plants: Paving the Way for Thermal Solar. Appl. Energy 2016, 169, 927–936. [Google Scholar] [CrossRef] [Green Version]
  6. Achour, L.; Bouharkat, M.; Behar, O. Performance Assessment of an Integrated Solar Combined Cycle in the Southern of Algeria. Energy Rep. 2018, 4, 207–217. [Google Scholar] [CrossRef]
  7. Dersch, J.; Geyer, M.; Herrmann, U.; Jones, S.A.; Kelly, B.; Kistner, R.; Ortmanns, W.; Pitz-Paal, R.; Price, H. Trough Integration into Power Plants—A Study on the Performance and Economy of Integrated Solar Combined Cycle Systems. Energy 2004, 29, 947–959. [Google Scholar] [CrossRef]
  8. Elmorsy, L.; Morosuk, T.; Tsatsaronis, G. Comparative Exergoeconomic Evaluation of Integrated Solar Combined-Cycle (ISCC) Configurations. Renew. Energy 2022, 185, 680–691. [Google Scholar] [CrossRef]
  9. Rovira, A.; Montes, M.J.; Varela, F.; Gil, M. Comparison of Heat Transfer Fluid and Direct Steam Generation Technologies for Integrated Solar Combined Cycles. Appl. Therm. Eng. 2013, 52, 264–274. [Google Scholar] [CrossRef]
  10. Reyes-Belmonte, M.A.; Rovense, F. High-Efficiency Power Cycles for Particle-Based Concentrating Solar Power Plants: Thermodynamic Optimization and Critical Comparison. Energies 2022, 15, 8579. [Google Scholar] [CrossRef]
  11. Shaaban, S. Analysis of an Integrated Solar Combined Cycle with Steam and Organic Rankine Cycles as Bottoming Cycles. Energy Convers. Manag. 2016, 126, 1003–1012. [Google Scholar] [CrossRef]
  12. Rovira, A.; Abbas, R.; Sánchez, C.; Muñoz, M. Proposal and Analysis of an Integrated Solar Combined Cycle with Partial Recuperation. Energy 2020, 198, 117379. [Google Scholar] [CrossRef]
  13. Wang, Z.; Duan, L. Study on Integrated Solar Combined Cycle System with a New Operation Strategy of Changeable Integration Mode under Different Direct Normal Irradiance (DNI) Conditions. Energy Sci. Eng. 2020, 8, 2907–2921. [Google Scholar] [CrossRef]
  14. Brodrick, P.G.; Brandt, A.R.; Durlofsky, L.J. Operational Optimization of an Integrated Solar Combined Cycle under Practical Time-Dependent Constraints. Energy 2017, 141, 1569–1584. [Google Scholar] [CrossRef]
  15. Ameri, M.; Mohammadzadeh, M. Thermodynamic, Thermoeconomic and Life Cycle Assessment of a Novel Integrated Solar Combined Cycle (ISCC) Power Plant. Sustain. Energy Technol. Assess. 2018, 27, 192–205. [Google Scholar] [CrossRef]
  16. Li, Y.; Yang, Y. Thermodynamic Analysis of a Novel Integrated Solar Combined Cycle. Appl. Energy 2014, 122, 133–142. [Google Scholar] [CrossRef]
  17. Li, Y.; Xiong, Y. Thermo-Economic Analysis of a Novel Cascade Integrated Solar Combined Cycle System. Energy 2018, 145, 116–127. [Google Scholar] [CrossRef]
  18. Duan, L.; Wang, Z.; Liu, Y.; Pang, L. Comparison Study of Two Different Integrated Solar Combined Cycle Systems. In Proceedings of the ASME 2020 Power Conference, Electr Network, Virtual, 4 August 2020. [Google Scholar]
  19. Zhang, Z.; Duan, L.; Wang, Z.; Ren, Y. Integration Optimization of Integrated Solar Combined Cycle (ISCC) System Based on System/Solar Photoelectric Efficiency. Energies 2023, 16, 3593. [Google Scholar] [CrossRef]
  20. Wang, S.; Fu, Z. Thermodynamic Investigation of an Integrated Solar Combined Cycle with an ORC System. Entropy 2019, 21, 428. [Google Scholar] [CrossRef] [Green Version]
  21. Rovira, A.; Abbas, R.; Muñoz, M.; Sebastián, A. Analysis of an Integrated Solar Combined Cycle with Recuperative Gas Turbine and Double Recuperative and Double Expansion Propane Cycle. Entropy 2020, 22, 476. [Google Scholar] [CrossRef] [Green Version]
  22. Cho, S.K.; Kim, M.; Baik, S.; Ahn, Y.; Lee, J.I. Investigation of the Bottoming Cycle for High Efficiency Combined Cycle Gas Turbine System with Supercritical Carbon Dioxide Power Cycle; American Society of Mechanical Engineers Digital Collection: New York, NY, USA, 2015. [Google Scholar]
  23. Thanganadar, D.; Asfand, F.; Patchigolla, K. Thermal Performance and Economic Analysis of Supercritical Carbon Dioxide Cycles in Combined Cycle Power Plant. Appl. Energy 2019, 255, 113836. [Google Scholar] [CrossRef]
  24. Kimzey, G. Development of a Brayton Bottoming Cycle Using Supercritical Carbon Dioxide as the Working Fluid. University Turbine Systems Research Program. Available online: https://www.swri.org/utsr/presentations/kimzey-report.pdf (accessed on 15 June 2012).
  25. Huck, P.; Freund, S.; Lehar, M.; Peter, M.; Global, G.E. Performance Comparison of Supercritical CO2 versus Steam Bottoming Cycles for Gas Turbine Combined Cycle Applications. In Proceedings of the 5th International Symposium—Supercritical CO2 Power Cycles, San Antonio, TX, USA, 28–31 March 2016. [Google Scholar]
  26. Cao, Y.; Habibi, H.; Zoghi, M.; Raise, A. Waste Heat Recovery of a Combined Regenerative Gas Turbine—Recompression Supercritical CO2 Brayton Cycle Driven by a Hybrid Solar-Biomass Heat Source for Multi-Generation Purpose: 4E Analysis and Parametric Study. Energy 2021, 236, 121432. [Google Scholar] [CrossRef]
  27. Pan, Z.; Yan, M.; Shang, L.; Li, P.; Zhang, L.; Liu, J. Thermoeconomic Analysis of a Combined Natural Gas Cogeneration System with a Supercritical CO2 Brayton Cycle and an Organic Rankine Cycle. J. Energy Resour. Technol. 2020, 142, 102108. [Google Scholar] [CrossRef]
  28. Cha, S.-H.; Na, S.-I.; Lee, Y.H.; Kim, M.S. Thermodynamic Analysis of a Gas Turbine Inlet Air Cooling and Recovering System in Gas Turbine and CO2 Combined Cycle Using Cold Energy from LNG Terminal. Energy Convers. Manag. 2021, 230, 113802. [Google Scholar] [CrossRef]
  29. Wang, S.; Zhang, L.; Liu, C.; Liu, Z.; Lan, S.; Li, Q.; Wang, X. Techno-Economic-Environmental Evaluation of a Combined Cooling Heating and Power System for Gas Turbine Waste Heat Recovery. Energy 2021, 231, 120956. [Google Scholar] [CrossRef]
  30. Bishal, S.S.; Faysal, D.F.; Ehsan, M.M.; Salehin, S. Performance Evaluation of an Integrated Cooling and Power System Combining Supercritical CO2, Gas Turbine, Absorption Refrigeration, and Organic Rankine Cycles for Waste Energy Recuperating System. Results Eng. 2023, 17, 100943. [Google Scholar] [CrossRef]
  31. Hou, S.; Zhou, Y.; Yu, L.; Zhang, F.; Cao, S.; Wu, Y. Optimization of a Novel Cogeneration System Including a Gas Turbine, a Supercritical CO2 Recompression Cycle, a Steam Power Cycle and an Organic Rankine Cycle. Energy Convers. Manag. 2018, 172, 457–471. [Google Scholar] [CrossRef]
  32. Al-Rashed, A.A.A.A.; Afrand, M. Multi-Criteria Exergoeconomic Optimization for a Combined Gas Turbine-Supercritical CO2 Plant with Compressor Intake Cooling Fueled by Biogas from Anaerobic Digestion. Energy 2021, 223, 119997. [Google Scholar] [CrossRef]
  33. Wang, S.; Liu, C.; Li, J.; Sun, Z.; Chen, X.; Wang, X. Exergoeconomic Analysis of a Novel Trigeneration System Containing Supercritical CO2 Brayton Cycle, Organic Rankine Cycle and Absorption Refrigeration Cycle for Gas Turbine Waste Heat Recovery. Energy Convers. Manag. 2020, 221, 113064. [Google Scholar] [CrossRef]
  34. Fan, G.; Lu, X.; Chen, K.; Zhang, Y.; Han, Z.; Yu, H.; Dai, Y. Comparative Analysis on Design and Off-Design Performance of Novel Cascade CO2 Combined Cycles for Gas Turbine Waste Heat Utilization. Energy 2022, 254, 124222. [Google Scholar] [CrossRef]
Figure 1. Flowchart and T-s diagram of the gas turbine combined cycle (GTCC) system with a supercritical CO2 Brayton bottom cycle: (a) Flowchart diagram; (b) T-s diagram.
Energies 16 04833 g001aEnergies 16 04833 g001b
Figure 2. Flowchart of the integrated solar combined cycle (ISCC) system with the parabolic trough solar collector (PTC).
Energies 16 04833 g002
Figure 3. Flowchart of the ISCC system with the solar tower (ST).
Energies 16 04833 g003
Figure 4. Energy flow diagram of the benchmark GTCC system.
Energies 16 04833 g004
Figure 5. T-Q diagram of the novel benchmark GTCC system: (a) Heat exchangers in HRSG; (b) Recuperators.
Energies 16 04833 g005aEnergies 16 04833 g005b
Figure 6. Energy flow diagram of the ISCC system with PTC.
Energies 16 04833 g006
Figure 7. Energy flow diagram of the ISCC system with ST.
Energies 16 04833 g007
Figure 8. Absorbed heat of the work mediums in the GTCC system, ISCC system with PTC, and ISCC system with ST.
Energies 16 04833 g008
Figure 9. Output power of the GTCC system, ISCC system with PTC, and ISCC system with ST: (a) Differentiation by topping and bottom cycle; (b) Differentiation by benchmark system and solar energy.
Energies 16 04833 g009
Figure 10. Exergy destruction of each component for the GTCC system, ISCC system with PTC, and ISCC system with ST.
Energies 16 04833 g010
Figure 11. Exergy destruction percentages of the components in the GTCC system, ISCC system with PTC, and ISCC system with ST: (a) GTCC system; (b) ISCC system with PTC; (c) ISCC system with ST.
Energies 16 04833 g011
Figure 12. Exergy efficiency of each component for the GTCC system, ISCC system with PTC, and ISCC system with ST.
Energies 16 04833 g012
Figure 13. Trend of the heat absorption of the working medium in the ISCC systems with the fluctuation of the DNI.
Energies 16 04833 g013
Figure 14. Trend of the output power of the ISCC system and solar energy with the fluctuation of the DNI.
Energies 16 04833 g014
Figure 15. Trends of the system efficiency, topping cycle efficiency, and bottom cycle efficiency of the ISCC system with the fluctuation of DNI.
Energies 16 04833 g015
Figure 16. Trends of the photoelectric and photothermal efficiencies of the ISCC with the fluctuation of DNI.
Energies 16 04833 g016
Figure 17. Trends of the output power and system efficiency of the benchmark system and the ISCC systems with intercooler pressure changes: (a) Trend of the output power; (b) Trend of the system efficiency.
Energies 16 04833 g017
Table 1. Design parameters of the gas turbine Brayton topping cycle.
ParametersValues
CompressorPressure ratio15.4
Inlet mass flowrate/(kg/s)645
Cooling air mass flowrate/(kg/s)119
Outlet temperature/°C399.08
Isentropic efficiency/%89
Combustion chamberFuel mass flowrate/(kg/s)14.4
Gas turbineInlet turbine temperature/°C1327
Outlet turbine temperature/°C608.55
Isentropic efficiency (first/second/third stage)/%90/90/90.8
Gas turbine Brayton topping cycleOutput power/MW253.03
Power generation efficiency/%36.1
Table 2. Design parameters of supercritical CO2 Brayton bottom cycle.
ParametersValues
CompressorInlet temperature/°C32
Inlet pressure/MPa7.61
Intercooling pressure/MPa10.52
Outlet pressure/MPa30
Outlet temperature /°C56.77
Isentropic efficiency/%88
TurbineMass flow rate of CO2 (HT/MT/LT)/(kg/s)610.82/590.1/88.5
Turbine inlet temperature of CO2 (HT/MT/LT)/°C593.55/391.55/247.64
Turbine outlet temperature of CO2 (HT/MT/LT)/°C427.62/248.35/120.4
Isentropic efficiency/%90
Supercritical CO2 Brayton bottom cycle Output power/MW150.9
Power generation efficiency/%34.1
Table 3. Design parameters of the GTCC system.
ParametersValues
Output power of GTCC/MW403.93
Power generation efficiency of GTCC/%57.6
Mechanical losses of GTCC/%1
Generator loss of GTCC/%1
Table 4. Design parameters of PTC.
ParametersValues
Number/(pcs)200
Width/m5.76
Length/m47.1
Row spacing/m17.28
Optical active portion of aperture/%94.61
Reflectance/%92
Mirror cleanliness factor/%95
Piping heat losses/(W/m2)20
Table 5. Design parameters of ST.
ParametersValues
Heliostat fieldTotal number of heliostats/(pcs)3000
Heliostat reflective area/m2100
Heliostat cleanliness factor/%95
Reflectance/%93
Averaged track consumption/(W/m2)100
ReceiverReceiver optical losses/%7
Emissivity of receiver surface/%83
Convective heat loss coefficient/(W/(m2 × K))7
Receiver surface temperature /°C590
Table 6. Validation of the supercritical CO2 bottom cycle model.
ParametersValues (Simulation)Values (Reference [22])Relative Deviation
Compressor outlet temperature/°C73.19273.20.01%
HRSG heat absorption/MW369.18369.20.01%
HRSG exhaust gas temperature/°C98.672100.31.62%
High temperature turbine outlet temperature/°C 398.199398.10.02%
Low temperature turbine outlet temperature/°C175.701175.70.00%
Bottom cycle net efficiency/%31.732.11.25%
Bottom cycle output power/MW116.92118.51.33%
Total exchanged heat/MW883.988840.00%
Total cycle efficiency/%55.956.10.36%
Table 7. Design parameters of the conventional GTCC system and the novel GTCC system.
ParametersConventional GTCCNovel GTCC
Topping cycle output power/MW253.03253.03
Topping cycle efficiency/%36.136.1
Bottom cycle output power/MW141.83150.9
Bottom cycle net efficiency/%32.134.1
Total output power/MW394.86403.93
Total cycle efficiency/%56.357.6
Table 8. Performance parameters of the GTCC system, ISCC system with PTC, and ISCC system with ST.
ParametersGTCC SystemISCC System with PTCISCC System with ST
Combustion chamber inlet temperature/°C399.08399.08585.57
Fuel consumption/(kg/s)14.414.411.93
Gas turbine exhaust gas mass flowrate/(kg/s)659.4659.4656.93
Gas turbine exhaust gas temperature/°C608.55608.55604.31
Topping cycle output power/MW253.03253.03248.36
Topping cycle efficiency/%36.136.136.08
Bottom cycle supercritical CO2 mass flowrate/(kg/s)1289.41371.381266.17
Bottom cycle output power/MW150.9162.87147.51
Bottom cycle net efficiency/%34.134.633.99
Total output power/MW403.93415.9395.86
Total cycle efficiency/%57.657.157.5
Solar irradiation incident on the mirror field/MW-34.6240
Optical efficiency/%-84.251.3
Photothermal efficiency/%-68.144.6
Solar energy heat collection/MW-27.95107.05
Solar energy output power/MW-11.9761.16
Photoelectric efficiency/%-27.625.5
Disclaimer/Publisher’s Note: The statements, opinions and data contained in all publications are solely those of the individual author(s) and contributor(s) and not of MDPI and/or the editor(s). MDPI and/or the editor(s) disclaim responsibility for any injury to people or property resulting from any ideas, methods, instructions or products referred to in the content.

