1. Introduction
According to official statistical data [
1,
2] the average energy consumption for space heating in Polish households grew from 235 kWh/m
2 in 1990 to 325 kWh/m
2 in 1993. Rising energy prices and stricter regulations related to thermal transmittance of building partitions introduced in 1991 [
3] caused the upward trend and return in 1997 to the level from 1991. In 1998 the Thermal Modernisation Law was introduced [
4] and the Thermal Modernisation Fund was put into service [
5] with related technical regulations [
3], resulting in the commencement of thermal refurbishment in the residential sector in Poland on a massive scale. Significant numbers of objects have been modernised [
6], and unit energy consumption for space heating dropped to 160 kWh/m
2 in 2008.
Nevertheless, there still exists a potential for further improvements [
7]. Estimation of these possibilities and resulting benefits, however, requires knowledge of the various social (occupant behaviour), technical (HVAC systems, building envelope) and environmental (weather) factors.
In general, three types of models are used to estimate energy demand of buildings, namely, physical, statistical and hybrid models [
8]. The first category contains solutions based on mathematical description of heat transfer between the building’s zone and surrounding environment applied in various building energy simulation programmes [
9]. The second approach utilises statistical methods to determine correlations between physical parameters of a building and calculated or measured energy consumption. The last solution benefits from the advantages of both previous ones, providing the opportunity to calculate energy demand using data-driven tools [
10,
11].
2. Literature Review
In the case of statistical solutions to estimate energy use in buildings it is often indicated that correlation models are less time-consuming than detailed simulations. Hence, despite their lower accuracy they are likely to be used in more general studies [
12]. Additionally, the link between energy use and building thermal properties is very intuitive, making interpretation of these models very easy.
Recently, numerous studies on energy use in selected groups of buildings in different countries and climatic zones to assess their energy performance have been reported. Ozarisoy and Altan [
13] presented a review of existing studies and methods to evaluate building energy performance and investigated the gap between design and real energy use in social housing. Apart from physical ones, social factors were also taken into account. Among others, the authors found correlations between a household’s income and building use.
In their next paper [
14], the authors investigated the impact of occupant behavioural patterns on energy use for space heating and cooling in 36 multifamily residential blocks using correlation analysis and multivariate regression. Based on 118 questionnaires from the occupants, the authors found that energy consumption in the studied objects was significantly influenced by the type of heating and cooling systems used.
Ruellan et al. [
15] analysed four publicly available datasets of the residential building stock of the Walloon region in Belgium. In this way, several independent variables were defined, such as housing type, income category, ownership rate and relative number of households in the city. Then, a statistical analysis using code developing in the R software was performed. Firstly, they studied the geographical distribution of these parameters. Then, they applied linear regression to find correlations between the stock’s technical parameters and the social and economic data of its occupants. Finally, a multiple linear regression (MLR) modelled the relationship between the average energy efficiency and several explanatory variables. In this way, the authors confirmed the positive correlation between income categories and energy efficiency in households. The MLR formula explained with 62% certainty the variation of energy consumption in relation to geometry, income and ownership variables. The authors concluded that, in the category of households with annual income of EUR 10,000–20,000, each percent increase means a 7.22 kWh/m
2 increase in the average energy efficiency of the analysed stock.
Eriksson et al. [
16] proposed an energy signature method to calculate the primary energy use of a single city district with 95 multifamily buildings. As input data, the authors used typical technical parameters such as the design indoor temperature, thermal transmittance of external partitions, ventilation flow, number of occupants, electricity and hot water use. Then, that method was used to simulate primary energy consumption by each building and to assess which of them should be renovated.
Hewitt and Wang [
17] analysed the Residential Energy Consumption Survey (USA) data from 2015. A binary logistic regression was applied to determine if selected socioeconomic and demographic factors influence the decision to undertake an energy audit. They found that this decision is positively and significantly correlated with age but is negatively correlated with renting. Hewitt and Boucher [
18] analysed the New York State-sponsored retrofit projects of residential buildings from 2011 to 2016. In general, the authors confirmed a relationship between the location of audits, completed retrofit projects and pro-modernisation and pro-efficiency behaviours.
To enhance support of the decision-making process of modernisation, various methods and tools were developed [
19,
20,
21]. Representative buildings [
22] or correlation-based models were also used [
12,
17,
23].
The second group of studies utilised simpler methods and standardised energy audits or in situ measurements to develop more general correlations linking easily available physical parameters of buildings with their energy performance.
Castrillón Mendoza et al. [
24] analysed a district heating system serving 31 buildings, most of which are educational buildings. They introduced an energy baseline variable, based on natural gas consumption in the central boilers, that turned out to be linearly dependent on degree days with R
2 = 0.978.
Kim et al. [
25] proposed a window-to-floor ratio (WFR) coefficient to assess the energy performance of office buildings. Simulations in EnergyPlus confirmed that energy demand increased proportionally when the WFR was higher than 0.1.
The energy performance of eight different schools was simulated in EnergyPlus and then validated against measurements in [
26]. Finally, the authors presented three correlations between the product of opaque area and its U-value and the gross volume of the buildings, heat loss through the external surfaces and heating energy consumption with R
2 > 0.80 in all cases.
Wang [
27] analysed energy consumption in 74 educational objects. The obtained Pearson’s correlation coefficient, in high and elementary schools, between the number of students, number of teachers, land area, gross floor area and total energy consumption was 0.677, 0.629, 0.308 and 0.419, respectively. The same, in relation to universities, was 0.669, 0.917, 0.575 and 0.960, respectively. No other equations based on thermal properties of buildings were provided.
As far as Poland is concerned, case studies of thermal modernisations have been published recently, such as of single family [
28,
29], multifamily [
30], school [
31] and other educational [
32] buildings. In addition, several analyses based on larger groups of objects have been conducted, but most of them for east or north-east Poland. In [
33], the authors described long-term evaluation of heating energy consumption of 43 multifamily buildings before, during and after their thermal retrofitting. The study revealed that the mean level of energy savings estimated in energy audits was 38.5% in comparison to 30.3% from measurements. However, the authors did not present relationships between energy consumption and physical parameters of studied objects.
In [
34], the authors presented an assessment of measured energy consumption for space heating of 10 multifamily buildings during the 2002–2020 period, including pre- and post-modernisation conditions. Implemented retrofit measures resulted in annual heating demand lowering from 19.8% to 35%. The application of a weather forecast-based control system allowed the achievement of an additional savings from 4.8% to 23.5%, except for one building, where arise of 2.1% was noticed. In [
35], the authors expanded the studied group by another 22 objects. Once again they presented savings obtained using weather forecast control of heating systems, but they did not show relationships for estimation of annual heating demand.
The next study [
36] was carried out for 85 various public buildings. Using rough set theory (RST) and thermal properties of buildings they evaluated the thermal demand of analysed buildings and then compared the obtained results with audits. During training of a neural network the authors used five input variables, which were type of building, construction technology, heating system, thermal power for heating, shape factor and E
A index. The developed model had R
2= 0.91.
Two kindergartens and seven schools were analysed in [
37]. Comparisons of measured annual heating energy consumption showed savings from 27.9% to 67.3%. They were lower than those calculated in energy audits. The authors also presented a correlation between primary energy consumption and A/V ratio. Similarly, a group of 14 buildings, including schools, kindergartens and offices, was studied in [
38]. The calculated (audit) savings of energy for space heating were higher than measured and ranged from 37.6% to 77.1% in comparison to 21.8–60.5%.
Studies have also been presented on thermal refurbishment strategies of selected cities [
39,
40] or voivodeships [
41]. However, they were based on advanced methodologies and the authors did not show any correlations for fast and simple assessment of basic energy performance indicators of buildings.
The calculation methods, input parameters and dataset types used in energy analyses of buildings are given in
Table 1. As technical input parameters there are defined geometric dimensions and thermal and physical properties of partitions and systems.
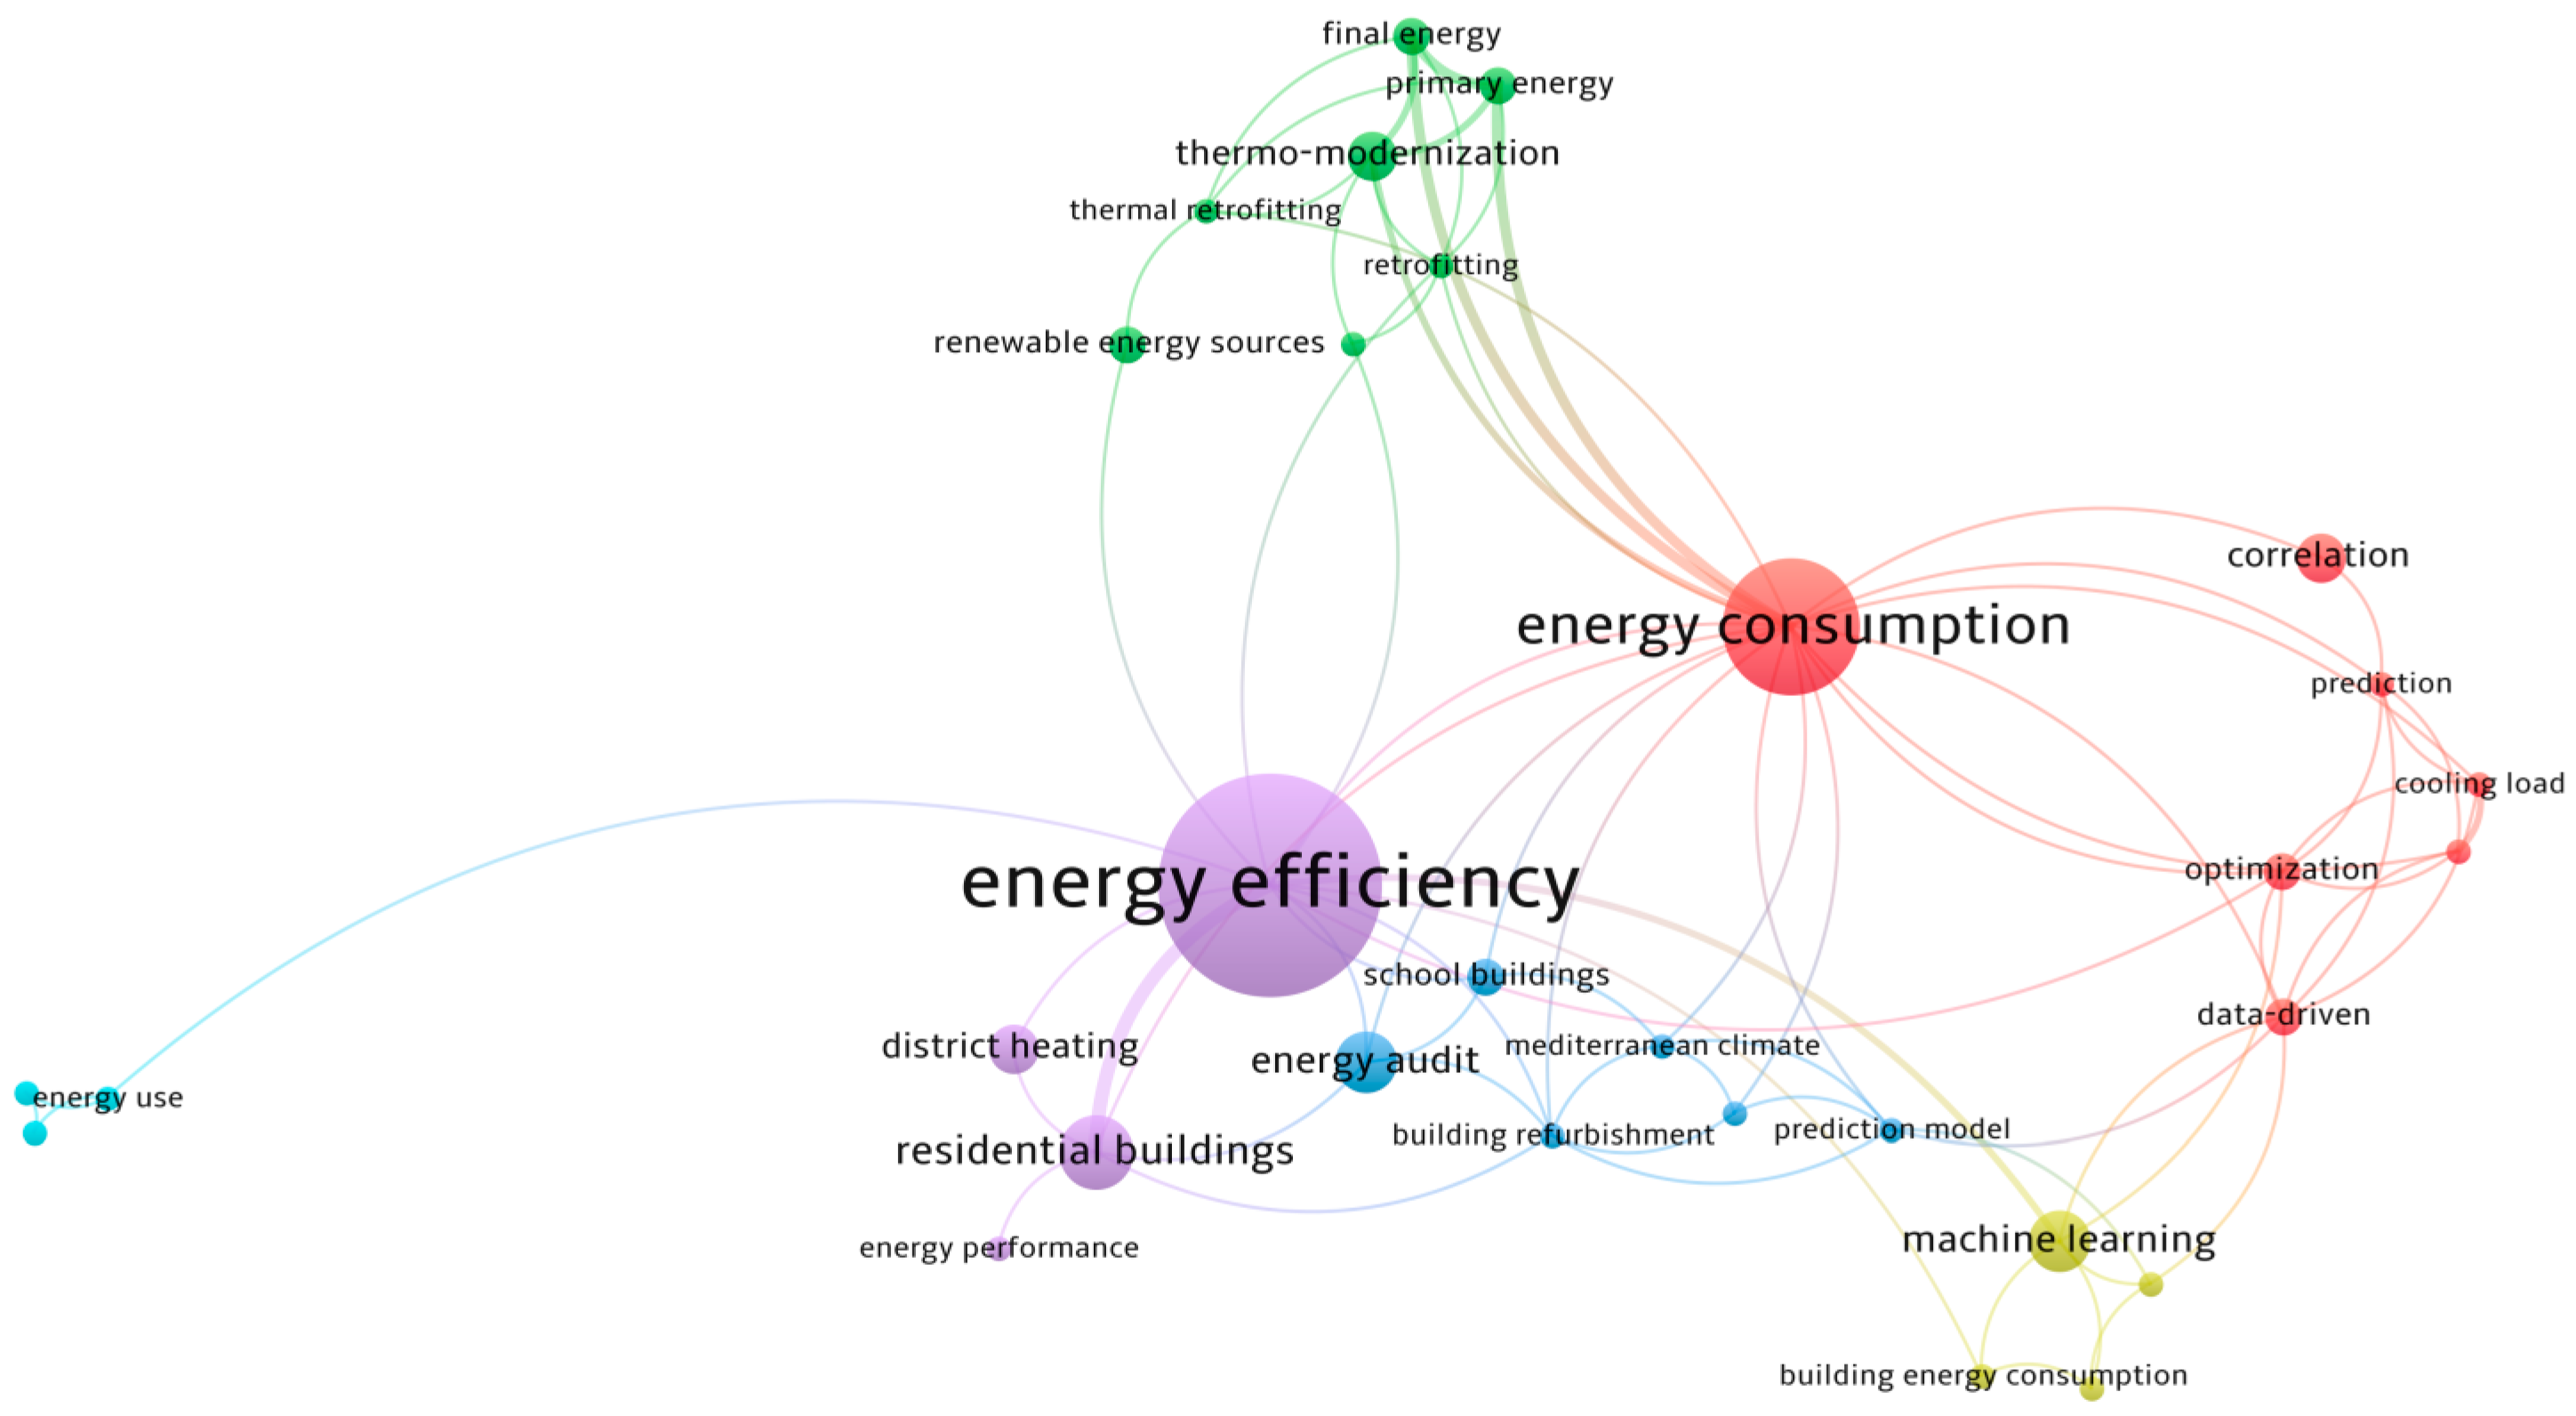
To visually present the performed literature review a visual map was generated (
Figure 1) with the help of VOSviewer software [
48,
49]. This map shows the connections between keywords in analysed papers. Each keyword is identified by means of circle size and colour. It can be noticed that, among “energy efficiency” and “energy consumption”, “residential building” and “correlation” keywords are also highlighted.
Hence, there arises a research gap that can be defined as the need to provide relationships to estimate annual energy needs of buildings based on their technical parameters that are easily available in audits. This paper aims to answer the question of if it is possible to derive such dependencies for multifamily buildings based on a set of objects with their energy audits performed in accordance with Polish standards. It is also interesting to know what parameters, not directly available in audits, can be useful for further improvement of such evaluations.
In the next section Polish regulations related to energy efficiency in buildings are briefly shown. Then, analysed buildings and their spatial distribution are introduced. Based on the presented methodology the most important findings are given and compared with other studies. Finally, concluding remarks are presented.
3. Materials and Methods
3.1. Calculations
Legal regulations related to energy auditing and financial support of thermal refurbishment of buildings in Poland have been described recently [
31].
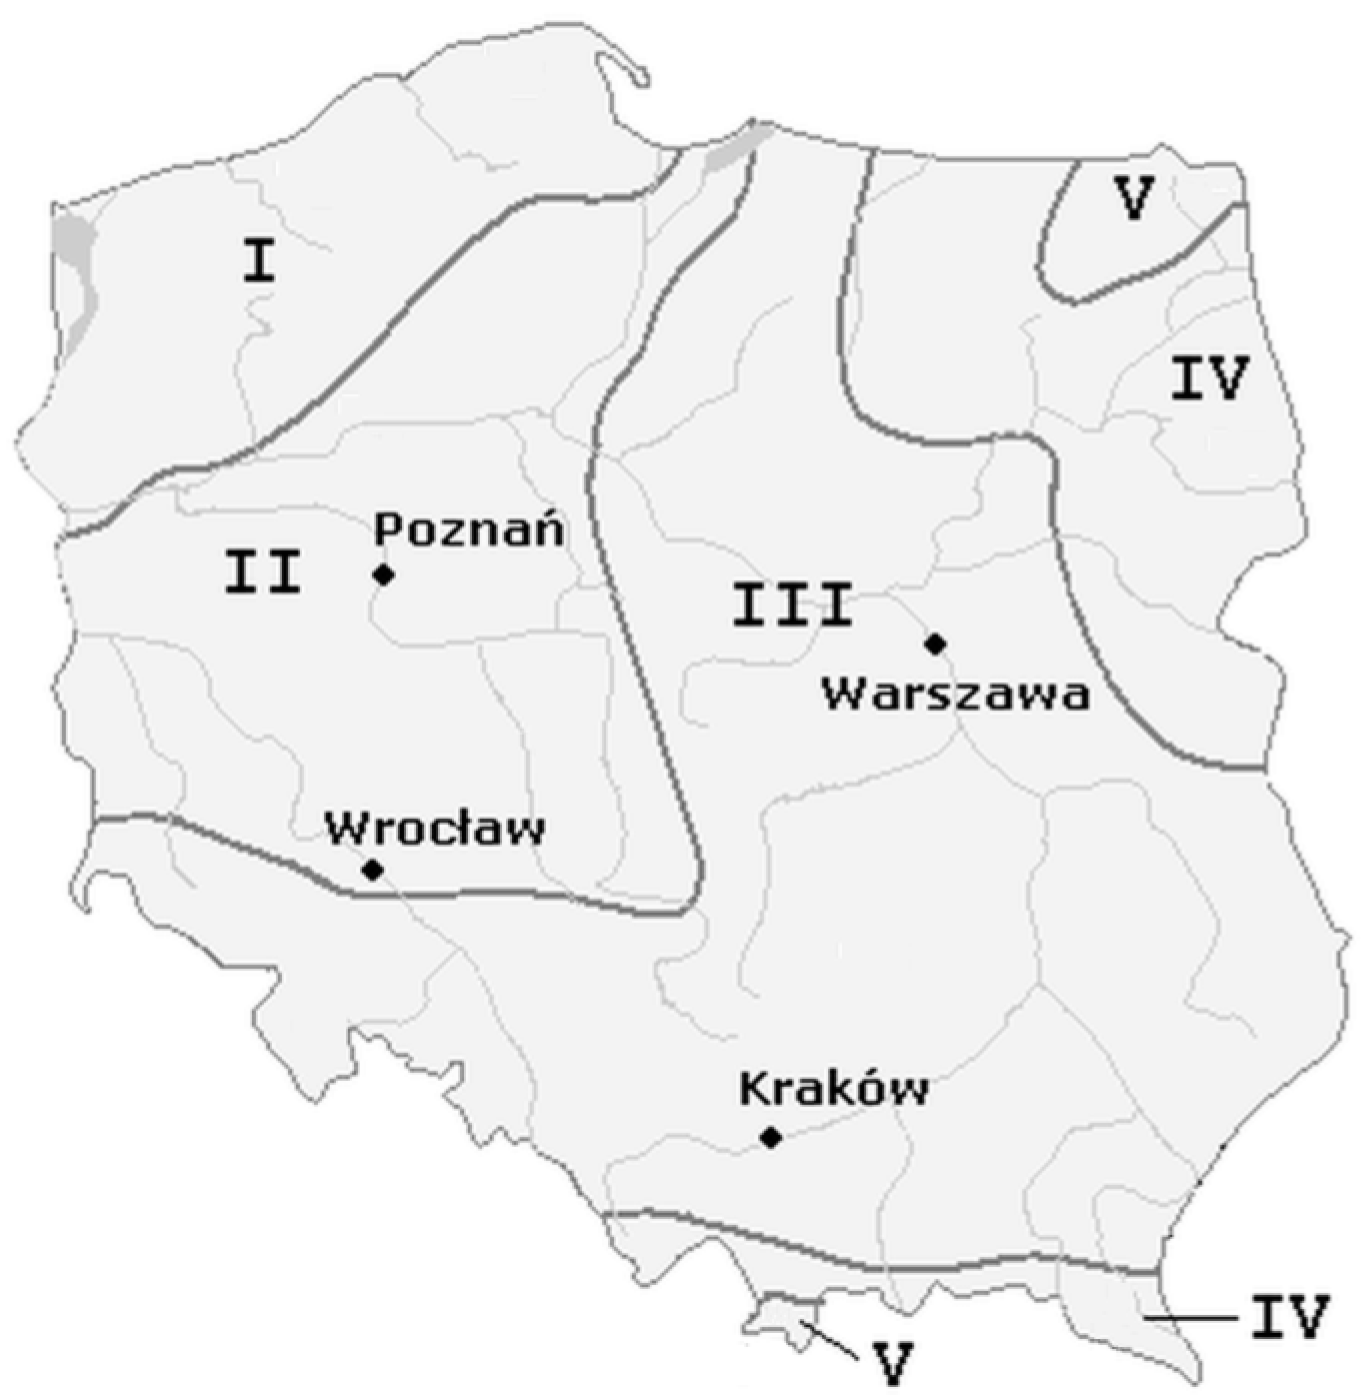
At the design stage of the modernisation project thermal calculations follow the PN EN 12831 standard [
50,
51]. Here, the area of Poland is divided into 5 climatic zones [
52] (
Figure 2) with different values of the outdoor design temperature (
Table 2).
Apart from the design heat load (Φ
H) annual energy demand for space heating (Q
H,nd) is also calculated. It is also known as the usable energy and it is net energy to cover a given energy need (consumed directly) [
52,
53]. It is calculated using the quasi-steady-state monthly method of the EN ISO 13790 standard [
54], which remained almost unchanged [
55] in the newly introduced EN ISO 52016-1 standard [
56].
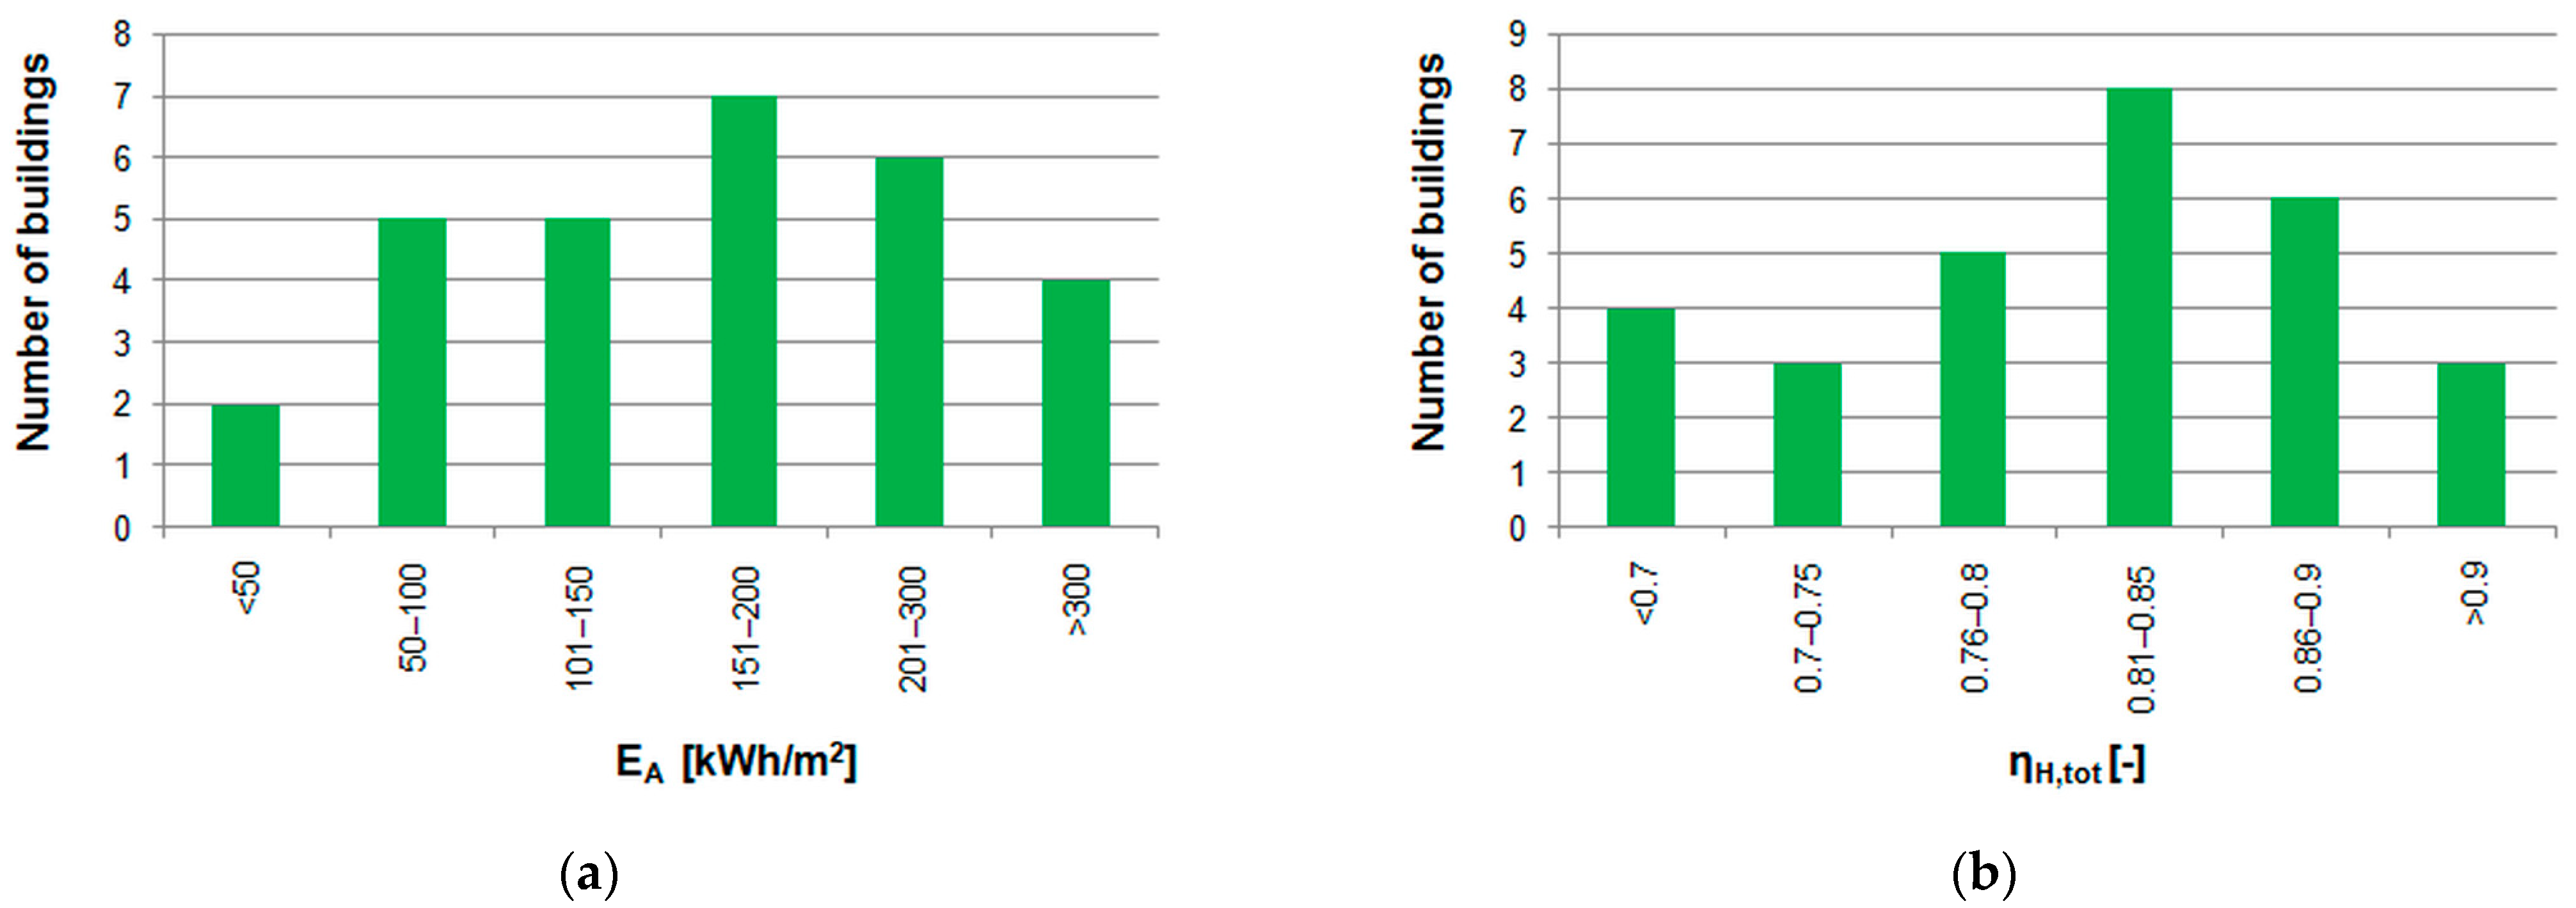
The E
A index is given by the relationship:
At the same, the E
V index is defined with regard to the internal volume of a building:
The annual demand for final energy (Q
k,H) supplied to the heating system of the building is calculated according to the formula:
where:
ηH,tot—mean seasonal total efficiency of the heating system.
Usable energy for domestic hot water preparation [
53]:
where:
Vw—daily unit demand for domestic hot water per heated area, dm3/(m2·day),
Af—heated floor area, m2,
cw—specific heat of water, cw = 4.19 kJ/kgK,
ρw—water density, ρw = 1.00 kg/dm3,
tw—design hot water temperature in the tap, tw = 55 °C,
t0—design water temperature before heating, tw = 10 °C,
kR—correction factor due to breaks in the use of domestic hot water, —,
Nd—number of days in the year, Nd = 365 days.
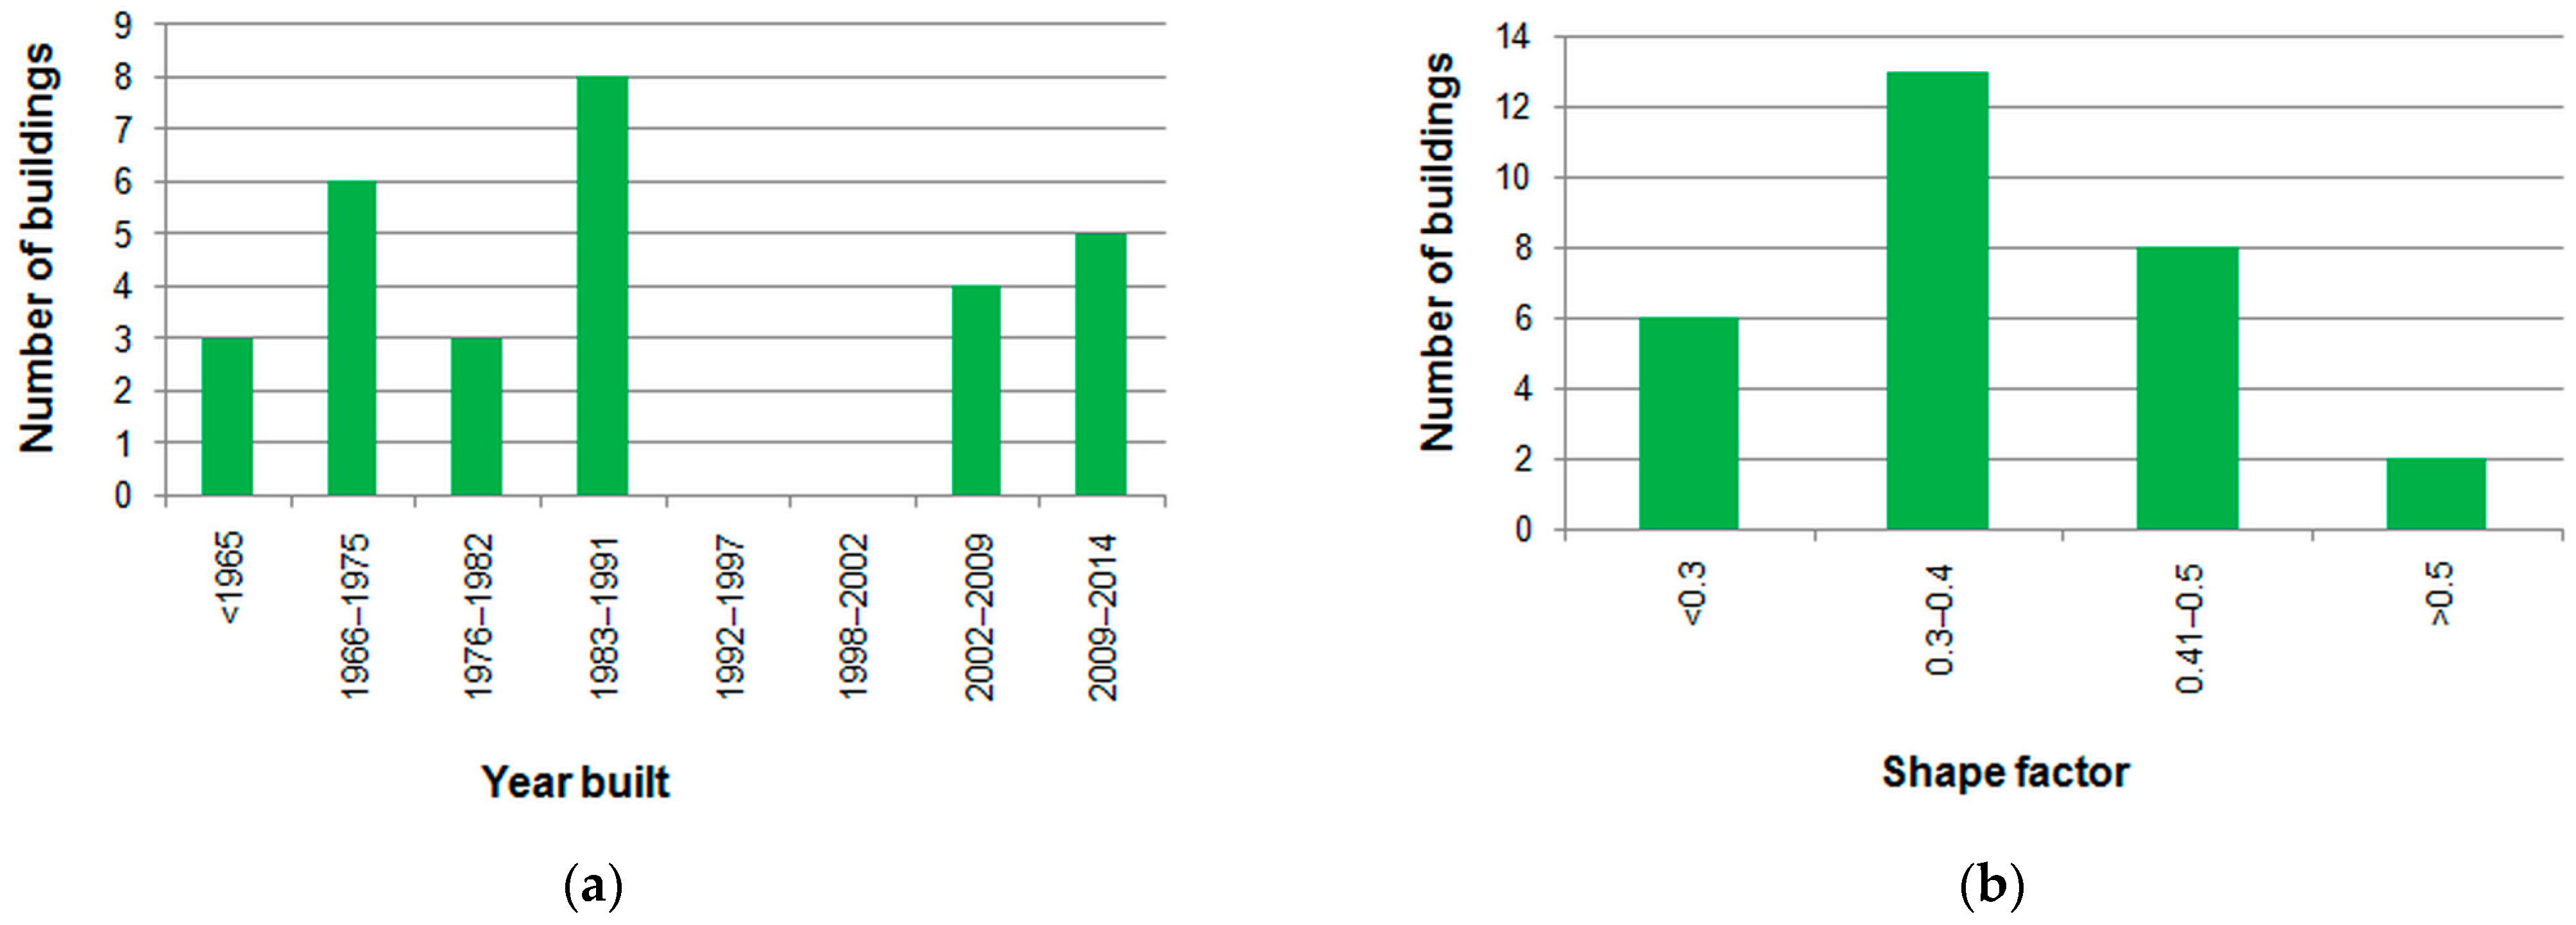
3.2. Case Buildings
The database of energy audits of the Department of Power Systems and Environmental Protection Facilities of AGH University was used as a source. For further analysis objects were selected from the separate subcategory of multifamily buildings. It contained 29 objects built between 1958 and 2012. They were located in south-east Poland in three voivodeships: Śląskie, Małopolskie and Podkarpackie, mainly in the 3rd zone (twenty-six), one in the 4th zone and two in the 5th zone. They were mostly built with large panel technology [
57]. Only a few objects were built with traditional technology, from ceramic blocks.
In order to assess if this sample is representative, the minimum sample size (m) was calculated with the relationship [
41]:
where:
n—minimum representative size of the sample,
uα—critical value of the normal distribution,
d—statistical error.
Assuming [
41] significance level α = 0.05 and d = 0.05 we obtain u
α = 1.96 and n = 385 objects. For α = 0.01 we obtain u
α = 2.98 and n = 888. Hence, in the considered case, the sample does not allow an approximate description of the total population of all multifamily buildings in the studied area.
However, within the considered dataset a more detailed analysis based on several basic statistical measures is possible. Correlation analysis is simple to use and relatively easy to interpret. It provides information about the association (strength and direction) of the linear relationship between two variables. These variables are treated equally. The dependent and independent variables are not distinguished—this is already the task of analysing the phenomenon under study from a physical point of view. Therefore, the statistical correlation between variables x and y is the same as that between y and x.
To assess the strength of this relationship, the Pearson correlation coefficient (r) is used. For the number of x and y pairs given by n, the following relationship is calculated:
where:
r—Pearson coefficient,
xi—i-th sample of the variable x,
—average of x,
yi—i-th sample of the variable y,
—average of y,
n—total number of pairs of samples,
d—statistical error.
The value of that coefficient varies from r = −1, which means perfect negative correlation, to r = 1, for perfect positive correlation. Intermediate values indicate the strength of the relationship between the variables (
Table 3).
For more complex statistical analysis the “Correlation” option in the Analysis ToolPak add-in in MS Excel was used. It produces a correlation matrix with the values of the Pearson correlation coefficient (r) [
60] for all possible combinations of pairs of variables. The table’s row and column headers contain the names of the variables. In table cells there are correlation coefficients. In this way correlation strength between all pairs of analysed variables can be easily obtained.
The selected audits have been checked for compliance with Polish standards and legal guidelines. There are three groups of information in each audit. The first one is of a general character:
Information on a building’s location: type of building, address, year built, climatic zone, the nearest meteorological station, latitude and longitude.
General data on a building: construction technology, number of storeys, heated volume, net area, usable residential area, commercial and other non-residential parts, number of dwellings, number of occupants, type of heating system, type of domestic hot water system and shape factor.
The second group contains technical parameters of various elements of a building before and after its planned thermal refurbishment:
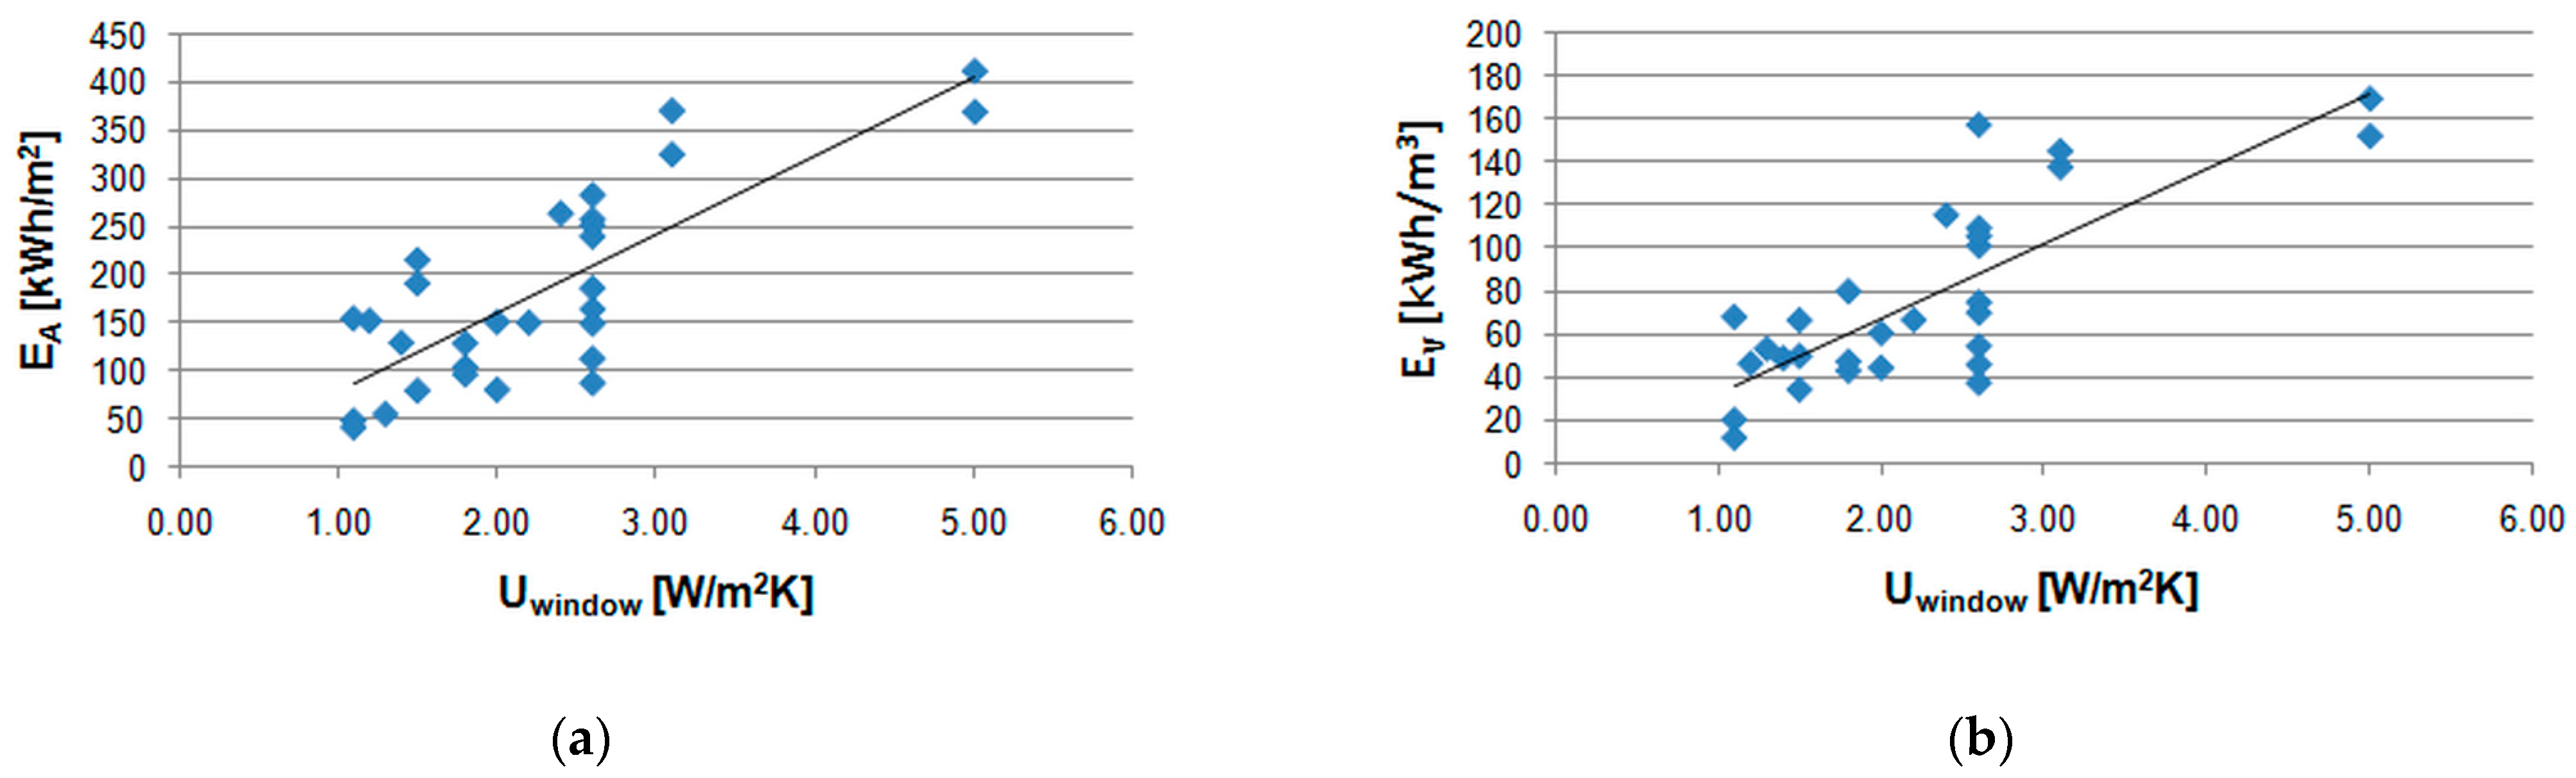
Thermal transmission coefficients of external walls, roof, basement ceiling, windows and doors.
Average seasonal efficiency of heat generation, heat distribution, control and heat storage, heating breaks during the week and during the day.
Information on ventilation: type of ventilation (natural, mechanical), the method of ventilation air supply and exhaust, ventilation air flow rate and air change rate.
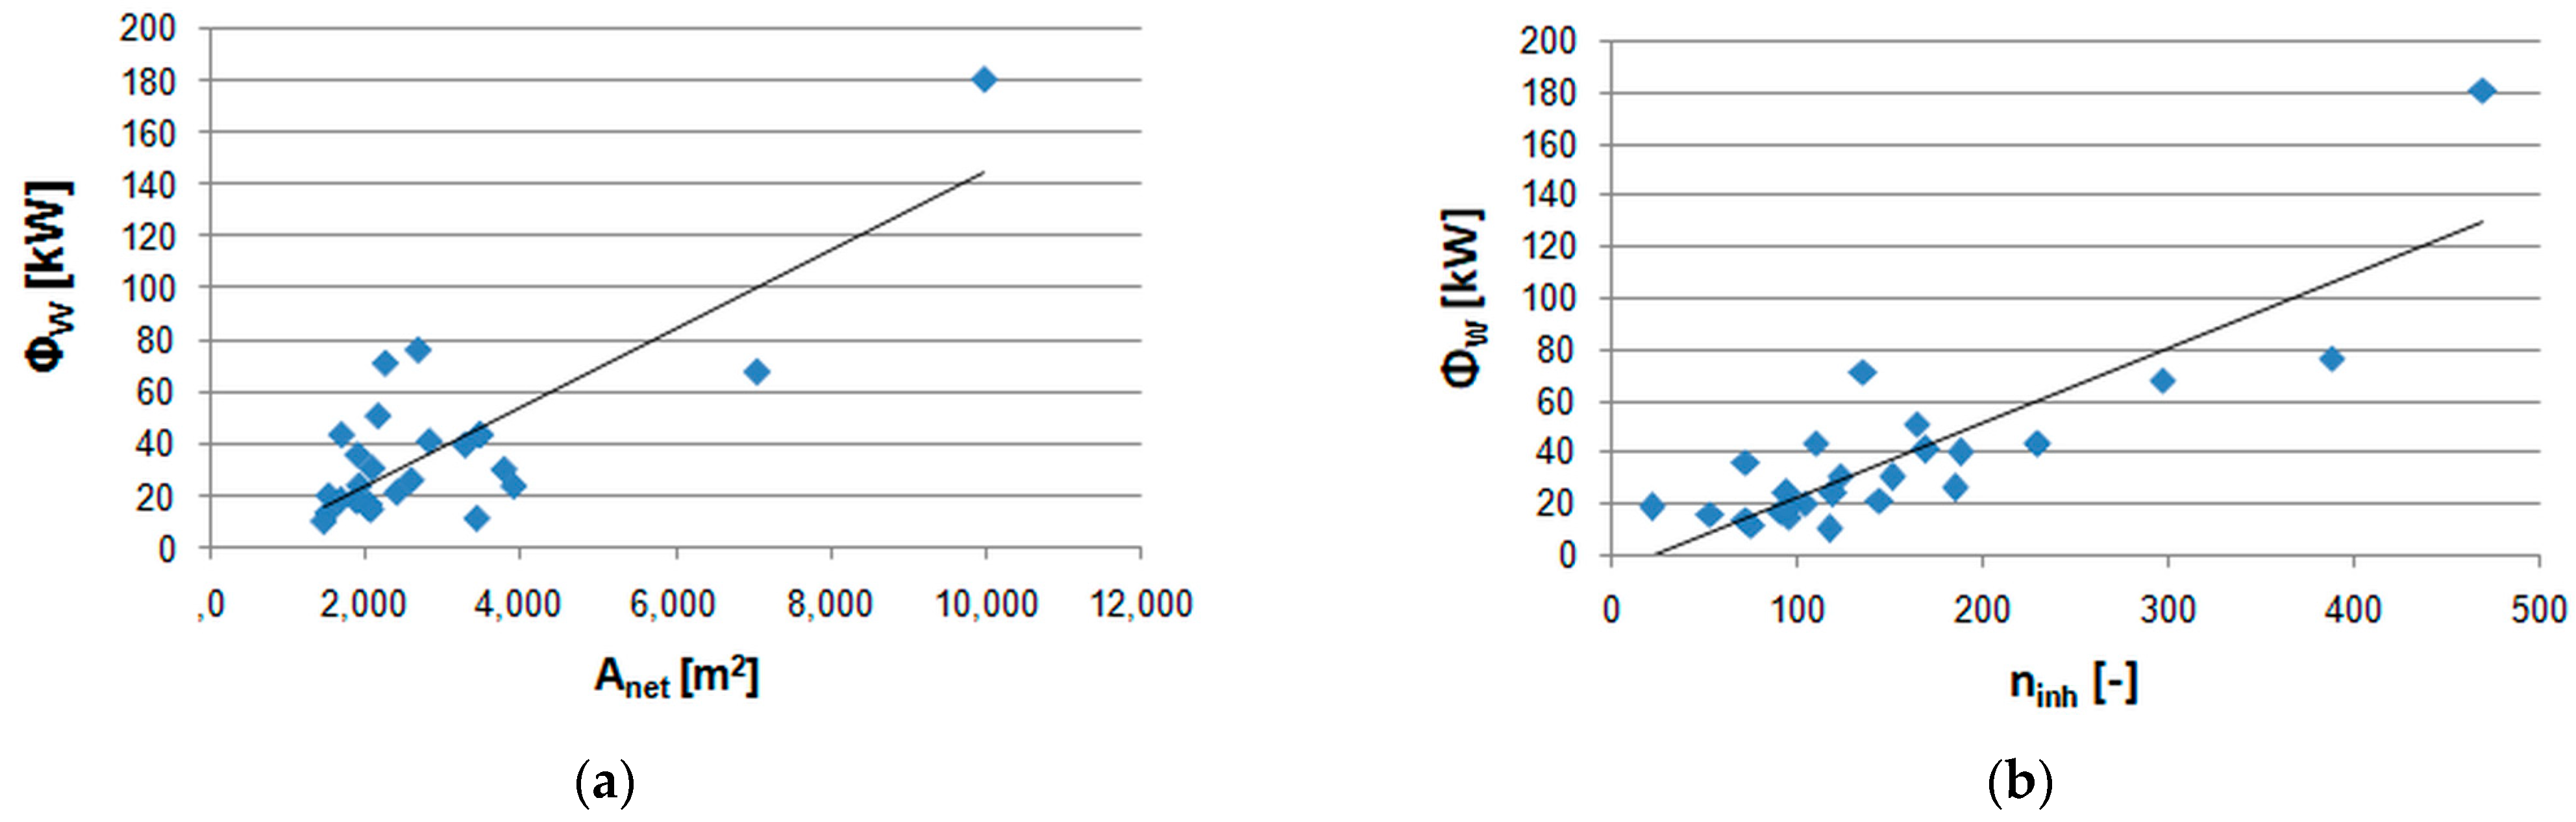
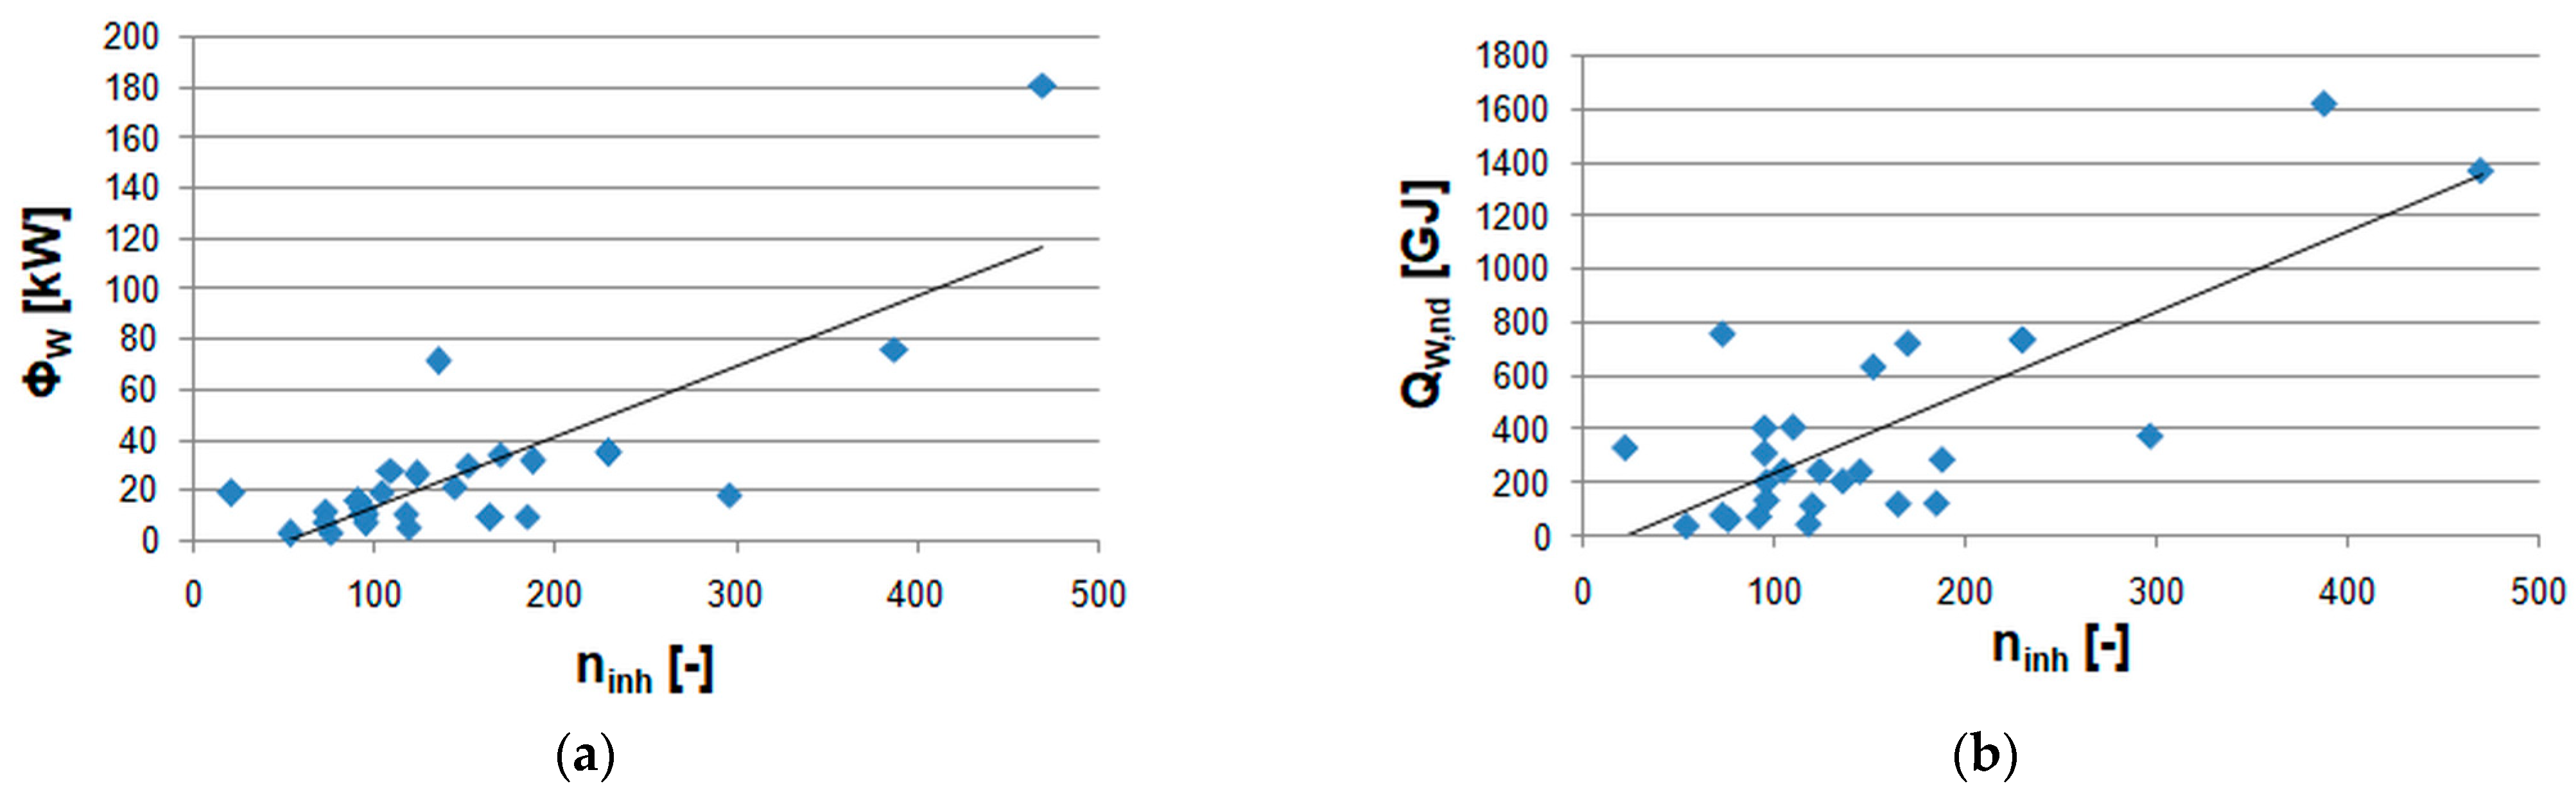
Information on a heating system: design thermal power for space heating and for domestic hot water, annual space heating demand, annual heating demand for domestic hot water, measured heat consumption for heating and domestic hot water recalculated for standard seasonal conditions, unit annual space heating demand and final energy demand for space heating per net area of a building.
The third group contains data on economic parameters of the planned thermal refurbishment: fee per 1 GJ of energy for heating, monthly fee for 1 MW of ordered capacity, fee for 1 m3 of domestic hot water, fee for 1 MW of energy ordered for hot water heating per month, fee for the heating of 1 m3 of usable space per month, planned total investment costs, annual reduction in energy demand, thermal modernisation premium and annual energy cost savings.
All audits, apart from the printed form, also have an electronic version. Each audit, in its introductory part, contains a summary table with the data presented above. This table was copied from each audit to the collective database in MS Excel format. Each table was on a separate worksheet. Thanks to this, it was possible to quickly download the same information (e.g., building’s volume) for a selected group of buildings.
Due to its practical importance and scope of the paper, for further analysis parameters were selected only from the first and the second group. They are given in
Table 4. When choosing them, quantities that were not directly measurable (such as type of heating system) or not present in all the audits analysed were excluded. For consistency, audits performed after 2008, i.e., after the introduction in Poland of EN ISO 13790, were used.
The net floor area of a building is calculated along the internal perimeter of all rooms in the building following the ISO 9836 standard [
61]. It differs from the usable area of a building or a dwelling, which is the area of all the rooms: living room, kitchen, bathroom, hallway, corridor, etc., that serve to meet the residential and economic needs of occupants. In Poland, for rooms with a clear height between 1.40 and 2.20 m, 50% of their area is counted as usable area. When the clear height is lower than 1.40 m, then this space is not counted as usable area.
5. Conclusions
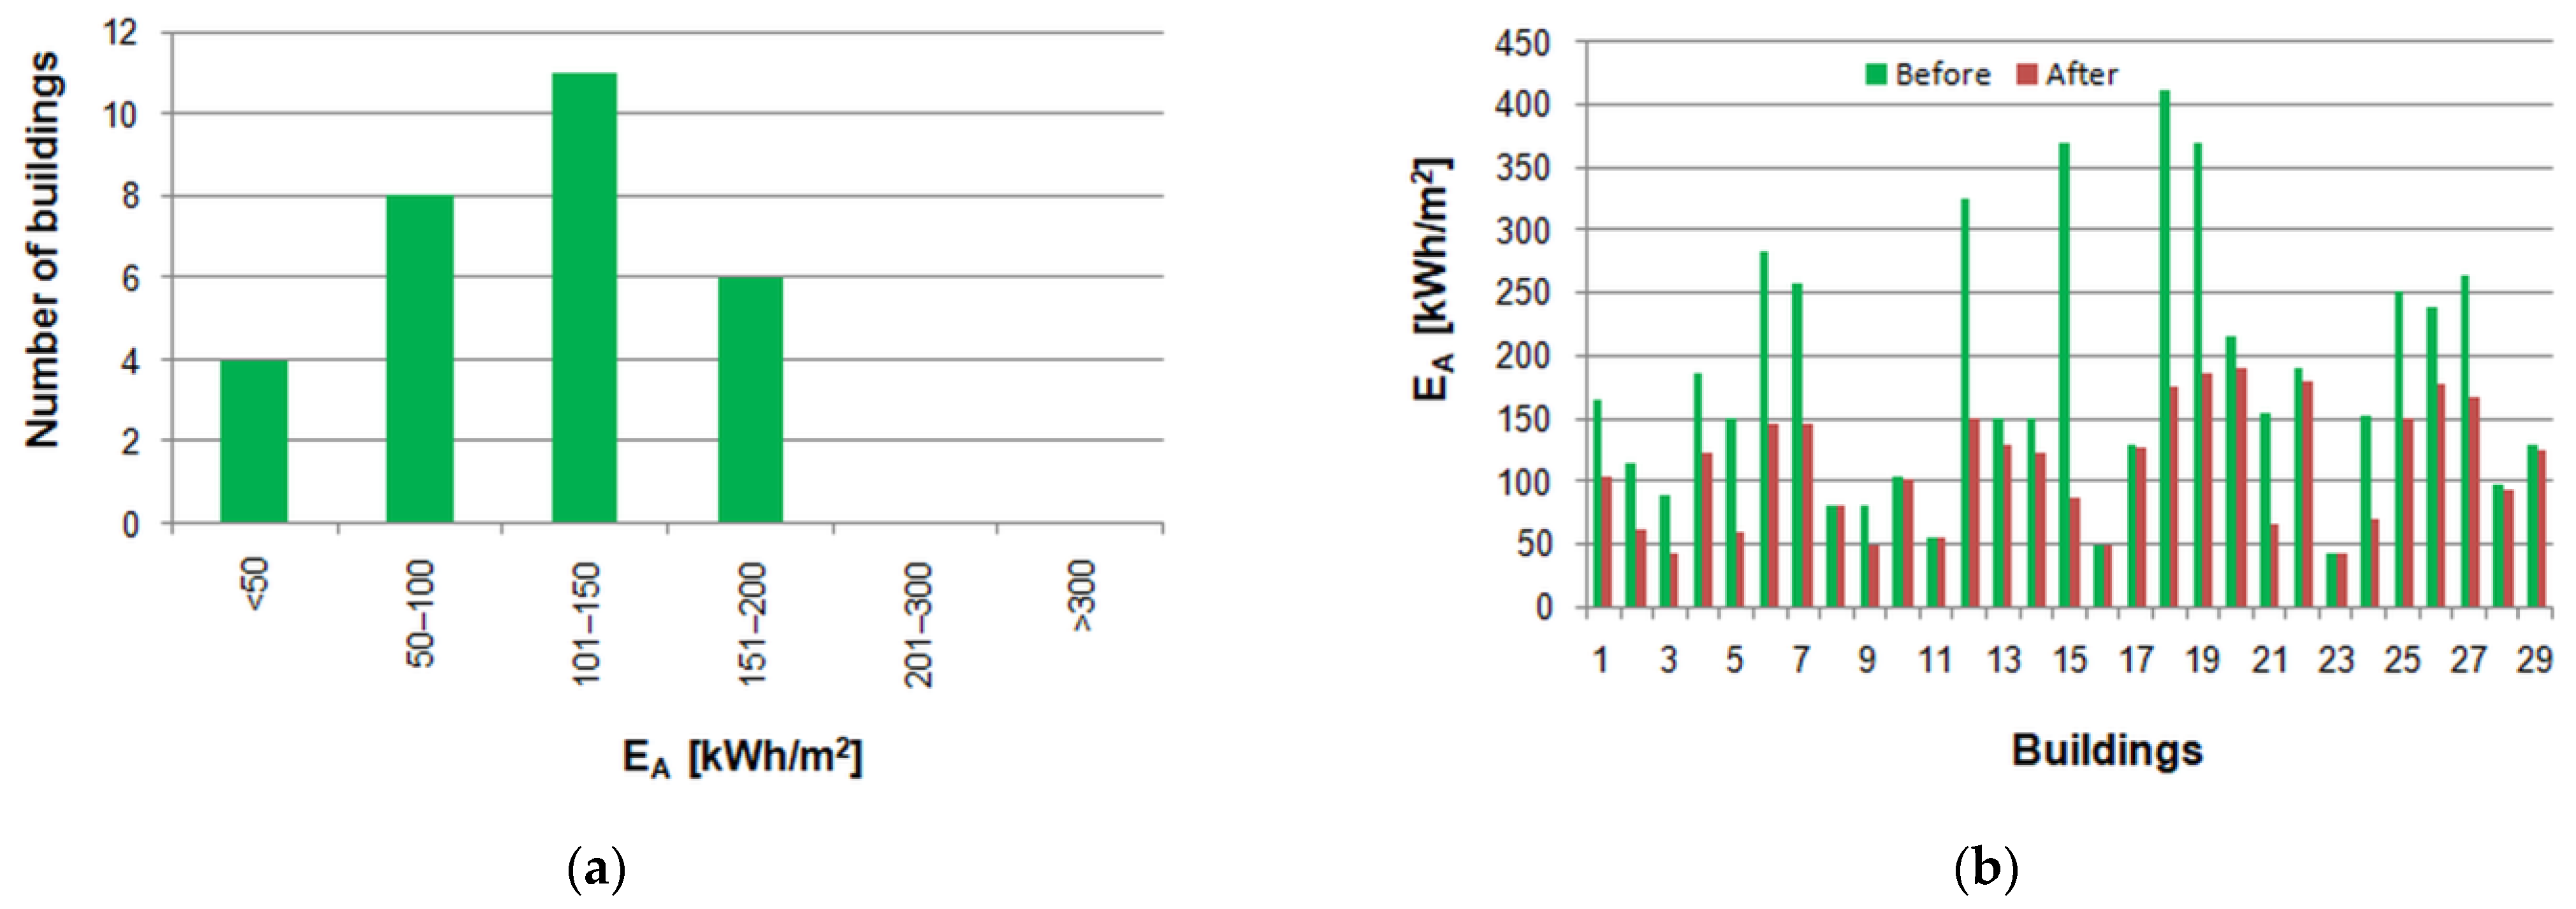
This study focuses on the description of the energy performance indices of multifamily buildings before and after their thermal refurbishment. The source data were taken from energy audits which can be considered as reliable sources of information in the standardised form. Based on them several correlations were derived which can be used in the preliminary energy assessment of buildings by quick and rough calculations based on general technical data available in audits.
A small number of similar works and the obtained results indicate the need for further research using a larger sample of objects. Then, it will be possible to develop more correlations which are currently too weak to be considered significant.
The most important limitation of the presented study is the relatively small number of analysed objects. Hence, it is difficult to generalise the results to all multifamily buildings. Despite this disadvantage the presented findings proved that in a group of buildings there is a link between indicators of their thermal performance and selected easily measurable technical parameters. This creates ways for further development of models to predict energy use both in individual buildings and their larger sets, such as whole districts. Therefore, outcomes of this paper might be interesting for policymakers and other bodies involved in the energy policy, especially on a local level.
It should also be emphasised that there is a lack of studies on correlations between energy performance of Polish multifamily buildings and their technical and physical features. Hence, this study should be considered rather as an introduction to this topic than a concluding report.
It is worthy to also include in future considerations parameters which cannot be directly measured, but can be described by numerical values, such as type of building, type of heating system or construction technology. In energy audits it may also be necessary to take into account very important thermal parameters of assessed buildings, provided by the monthly methods of EN ISO 13790 and EN ISO 52016-1, i.e., heat transfer coefficients by transmission (Htr) and by ventilation (Hve) and thermal capacity of a building (Cm). They give a more detailed and standardised view of a building, but currently are not highlighted in energy audits.


