Article

Protein Extraction, Precipitation, and Recovery from Chlorella sorokiniana Using Mechanochemical Methods

Biosystems and Agricultural Engineering, Michigan State University, East Lansing, MI 48824, USA
*
Author to whom correspondence should be addressed.
Energies 2023, 16(12), 4809; https://doi.org/10.3390/en16124809
Submission received: 6 April 2023 / Revised: 9 June 2023 / Accepted: 12 June 2023 / Published: 20 June 2023

Abstract

:
Protein extraction, precipitation, and recovery methods were evaluated by this study using a green alga—Chlorella sorokiniana. A mechanochemical cell disruption process was applied to facilitate protein extraction from microalgal biomass. Optimization of the mechanochemical process resulted in milling conditions that achieved a protein extraction of 52.7 ± 6.45%. The consequent acid precipitation method was optimized to recover 98.7% of proteins from the microalgal slurry. The measured protein content of the protein isolate was 41.4% w/w. These results indicate that the precipitation method is successful at recovering the extracted proteins in the algal slurry; however, the removal of non-protein solids during centrifugation and pH adjustment is not complete. The energy balance analysis elucidated that the energy demand of the protein extraction and recovery operation, at 0.83 MJ/kg dry algal biomass, is much lower than previous studies using high-pressure homogenization and membrane filtration. This study concludes that mechanochemical protein extraction and recovery is an effective, low-energy processing method, which could be used by algal biorefineries to prepare algal proteins for value-added chemical production as well as to make algal carbohydrates and lipids in the residual biomass more accessible for biofuel production.

1. Introduction

Atmospheric carbon dioxide (CO2) emissions reached 4.75 million metric tons (Gt) in the U.S. and 36.4 Gt globally in 2018 [1]. Development and implementation of carbon capture technologies and mitigation strategies are critical to alleviate the negative impact of CO2 on the climate. Using microalgae to biologically sequester CO2 and produce biomass rich in valuable metabolites is an environmentally friendly and economically sound solution. Despite the potential of biological CO2 sequestration, several challenges must be addressed before its widespread implementation and successful adoption. Namely, the cost and energy demands associated with cultivation must be offset during downstream processing. The manufacturing of products from high-value cellular components and the development of co-product systems has the potential to address these challenges. However, current microalgal processing technologies demand improvements that will lower the overall cost and energy required to obtain value-added products. Developing low-energy, low-cost processing technologies is a critical step toward the success of microalgal technologies.
Following the cultivation of microalgae, biomass in suspension must be harvested from the reactor or pond, and dewatered. Once the biomass has been harvested and dewatered, the next step in converting biomass into value-added products is typically cell disruption. Downstream products receive their value from intracellular components, such as lipids, proteins, and pigments, that are transformed into goods, such as biofuels or nutraceuticals. Different techniques have been explored to achieve different degrees of disruption, including alkali/acid treatment, enzymatic treatment, microwave, sonication, high-pressure homogenizers, thermochemical conversion, pulsed electric field treatment, and milling with beads or balls [2,3,4]. Protein extraction is often done in series with lipid extraction, and the extraction of lipids before proteins has been shown to increase the overall recovery of intracellular proteins [5]. Several reports indicate that despite the high energy demands of mechanical methods such as homogenizers and mills, they are the most efficient techniques for cell disruption and offer the best opportunities for scalability [4]. Notably, reports of imbalances in the energy and cost of these techniques are based on data from microalgal suspensions that have low biomass concentrations (w/w) [4]. Increasing the solids content of the microalgal suspensions and scaling up the cell disruption process has been shown to reduce the overall energy demand [6]. Research efforts should be focused on developing methods capable of handling suspensions with high biomass concentrations and evaluating these techniques on a process scale.
Following cell disruption, the component, or components, of interest can be isolated and recovered. There are several techniques for the recovery of microalgal metabolites, including the use of alkali or organic solvents, ionic liquids, and aqueous two-phase extraction [7,8]. Those recovery techniques mainly focused on lipids, pigments, and antioxidants. Lipids have been of high interest due to their use in the development of biofuels. However, efforts have started to shift towards other valuable cellular components, such as protein. Protein is especially valuable for its use in nutraceuticals and food products; however, methods for protein extraction and recovery from microalgal biomass are scarce and under-developed [8].
The goal of this study was to develop a low-energy, mechanochemical cell disruption process for protein extraction from concentrated microalgal biomass suspensions. Chlorella sorokiniana, a freshwater species of green microalgae, is a good candidate for this application due to its demonstrated resilience against acidifying gases, such as SOx and NOx, that can be present in flue gas [9]. In addition, C. sorokiniana has a high protein content, recorded as being 58.6% of the dry matter [10]. C. sorokiniana biomass was first characterized using gel electrophoresis and macromolecular analysis. Dewatered biomass was used for cell disruption using ball mills and, to increase the efficiency of cell disruption and reduce the overall energy demand, simultaneous alkali treatment was performed. Additionally, this study developed a protocol for protein recovery using the isoelectric point of microalgal proteins. Finally, a mass balance and energy analysis were performed to demonstrate the scalable nature and energetic viability of these processing technologies. The studied process could be used by algal biorefineries as a pretreatment step to fractionate protein, carbohydrate, and lipids in algal biomass for value-added chemical and fuel production.

2. Materials and Methods

2.1. Microalgal Strain and Cultivation Techniques

Chlorella sorokiniana MSU biomass was collected from an indoor photobioreactor (PBR) at the T.B. Simon Power Plant on Michigan State University’s campus. C. sorokiniana is a microalgal strain native to the Great Lakes region [11]. The PBR used in this study was installed by PHYCO2 LLC in the T.B. Simon Power Plant and has been described previously [12]. The 118 L PBR (100 L working volume) comprises a helical coil accompanied by a vertical up-tube and LED light sources. Light is provided to the PBR with 12, 8-foot LED light bars (Independence LED Lighting LLC, Berwyn, PA, USA), with 4 bars in the center of the coil and 8 around the up-tube. Each light bar contains 44 red and 12 blue diodes, providing light at 660 nm and 450 nm, respectively. Combined, the light bars deliver a continuous photosynthetic photon flux density (PPFD) of approximately 407 μmol m2/s, as measured by an LI-190R Quantum Sensor paired with an LI-250A light meter (LI-COR, Lincoln, NE, USA).
Flue gas, generated by natural gas-fired combustion, is pumped directly from the stack into the PBR. A gas sparger at the bottom of the up-tube delivers the flue gas at a rate of 12 L/min and drives flow throughout the reactor. A continuous emissions monitoring system (CEMS), as regulated by the United States Environmental Protection Agency (EPA), was used to determine the CO2 and NOx emissions in the flue gas to be 7.2 ± 0.06% v/v and 76.9 ± 0.4 ppmv, respectively. Modified Tris-Acetate-Phosphate media containing the following nutrients was used for cultivation: 3.75 mmol/L of NH4NO3; 0.34 mmol/L of CaCl2∙2H2O; 0.4 mmol/L of MgSO4∙7H2O; 0.68 mmol/L of K2HPO4 (anhydrous); 0.45 mmol/L of KH2PO4 (anhydrous); and 0.09 mmol/L FeCl3∙6H2O. All nutrient solutions and media were prepared using deionized water, and tap water (freshwater) from the power plant was used for cultivation. No sterilization was performed.

2.2. Microalgal Biomass and Protein Characterization

Untreated, whole C. sorokiniana biomass was characterized using standard forage analysis methods [
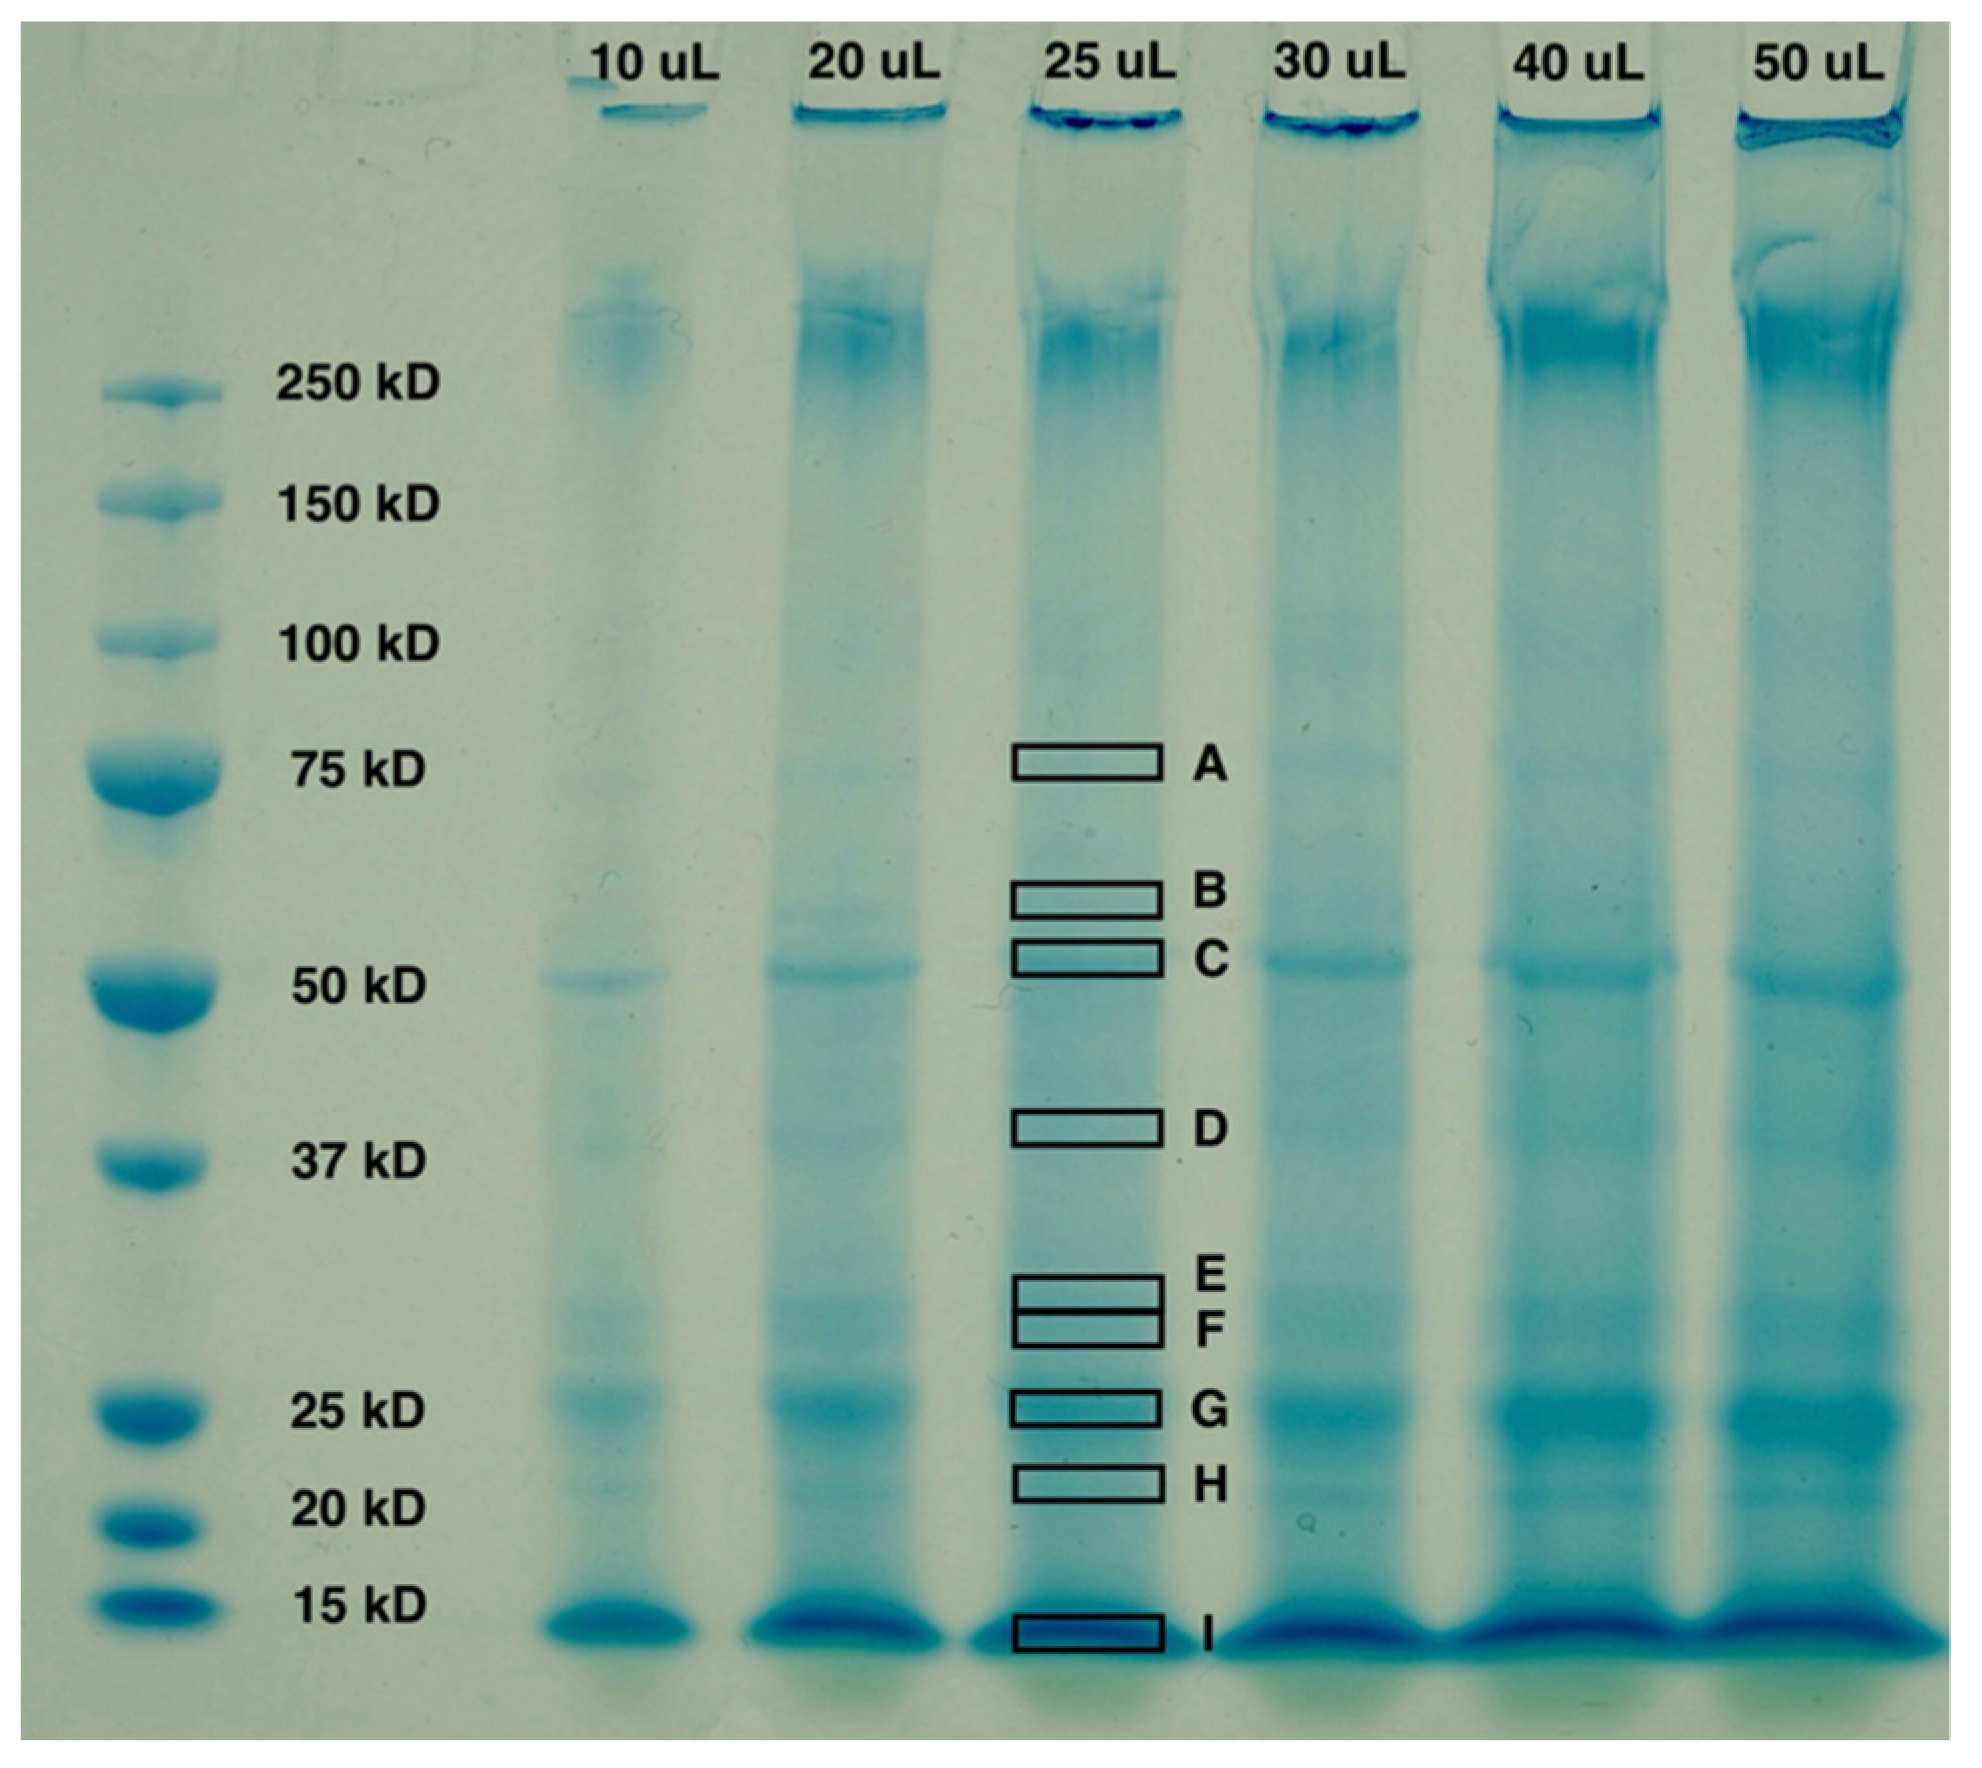
12]. Gel electrophoresis was performed to characterize the proteins present in the untreated biomass. The Mini-PROTEAN® Tetra Cell System (Bio-Rad Laboratories Inc., Hercules, CA, USA) was used to perform SDS-PAGE. In addition, 2× Laemmli sample buffer, 10× Tris/Glycine/SDS buffer, and Bio-Safe™ Coomassie stain were obtained from Bio-Rad Laboratories. The purpose of this experiment was not to mimic the mechanochemical methods discussed in subsequent sections, but rather to identify a reliable and repeatable procedure for the characterization of intracellular microalgal proteins. The volume necessary for this characterization is considerably smaller than the mechanochemical methods discussed herein.
A working 2× Laemmli sample buffer was obtained by adding 50 μL of 2-mercaptoethanol per 950 μL of sample buffer. A sample of biomass, previously frozen at 4 °C, was thawed and the microalgal cells were lysed using a mortar and pestle. A mortar and pestle were selected for cell lysis, instead of a ball mill, based on the statements above. The sample was ground for approximately 5 min to achieve total lysis. To maintain protein integrity, liquid nitrogen was added incrementally during grinding and the lysed cells were immediately put in pre-chilled 2× Laemmli buffer. Lysed cells were then heated at 80 °C for 10 min and allowed to cool to room temperature. Proteins were then precipitated using acetone following a protocol adapted from Pierce Protein Biology TR0049.0 (Thermo Fisher Scientific Inc., Waltham, MA, USA). Samples were incubated overnight at −20 °C and a centrifuge speed of 14,000 rpm was used to collect the precipitated proteins. Following precipitation, residual acetone was allowed to evaporate off and all samples were resuspended in 2× Laemmli sample buffer. To encourage solubilization, samples were then heated for another 10 min at 80 °C. Any lingering insoluble material was isolated with a final centrifuge step for 5 min at 14,000 rpm. All samples were loaded onto 10% polyacrylamide, 10-well Mini-PROTEAN® TGX™ Precast Protein Gels and run at 150 V for approximately 40 min. Empty wells were loaded with 2× Laemmli sample buffer.

2.3. Mechanochemical Protein Extraction and Recovery

2.3.1. Ball Milling Optimization

Microalgal biomass was harvested from the PBR previously described and dewatered using centrifugation. The dewatered microalgal biomass had a total solids content of 20% w/w (0.2 g dry biomass/g wet biomass) and was frozen at 0 °C immediately after harvest. For cell disruption, biomass was thawed and used directly without additional drying. Optimization of the ball milling process was completed in a lab-scale planetary ball mill with a power rating of 100 W (Tencan, Changcha City, Hunan Province, China). Five milling parameters were varied to induce different cell disruption conditions, including the type of milling media, rotational speed, run time, ball-to-biomass ratio, and the amount of potassium hydroxide (KOH) added. Agate (SiO2) and zirconia (ZrO2 and Y2O3) milling media were selected to evaluate the effectiveness of the two characteristically different materials. Agate is relatively soft, according to the Mohs scale, while zirconia is quite hard. Additionally, agate is, on average, much less expensive than zirconia. The agate media was a heterogeneous mix of four 12 mm, ten 10 mm, and ten 8 mm balls. Likewise, the zirconia media was made up of two 12 mm, three 10 mm, and four 8 mm balls. Ball sizes and quantity were determined based on mass, therefore, the denser media (zirconia) had fewer overall balls. The ball-to-biomass ratio was varied between 2:1 and 4:1 to determine the most effective mass loading conditions of the planetary ball mill.
The selected milling vessels can hold approximately 25 mL and are made of the corresponding milling material. The rotational speed of the ball mill was varied between 400, 500, and 600 rpm, and the run time was varied between 30 and 60 min. The milling speed and milling time, and their respective values, represent the mechanical intensity of the cell disruption. Finally, the KOH to algae ratio was based on mole ratios of KOH and nitrogen (N), and varied between 1 mol KOH/2 mol N (1:2) and 1 mol KOH/1 mol N (1:1) to determine the preferred chemical intensity of the cell disruption (Equation (1)). A protein content of 58.6% w/w for C. sorokiniana biomass was previously determined using standard forage analysis methods [3]. A protein-to-nitrogen conversion factor of 6.25 was selected for this study [13]. Equation (1) was used with the molecular weight of KOH (56.11 g/mol KOH) to determine the KOH loading required for each ratio.
D r y   b i o m a s s m o l   N = 1   g   d r y   b i o m a s s 0.586   g   p r o t e i n × 6.25   g   p r o t e i n 1   g   N × 14   g   N 1   m o l   N = 149   g   d r y   b i o m a s s 1   m o l   N
The metric used to compare treatments and to determine the most effective milling conditions was the percentage of protein extracted. This was calculated as the amount of protein in the fractionated biomass, or microalgal slurry, divided by the expected protein in the untreated biomass. The expected protein was calculated using a previously determined protein content of 58.6% of the dry matter. The protein content of the microalgal slurry was determined by measuring the total nitrogen and converting the nitrogen to protein. Total nitrogen was used in place of a protein assay due to its ease of measurement and conversion, and thus, measurements were completed in duplicate. The total nitrogen concentration (mg/L) of the microalgal slurry was measured using nutrient test kits (HACH Company, Loveland, CO, USA) following an appropriate dilution and in reference to EPA methods [14]. The minimum data point from each data pair was selected to use for statistical analysis to underestimate the protein extraction efficacy of the milling process. The milling conditions that yielded the highest percentage of protein extracted were used for all scaled-up experiments.

2.3.2. Protein Precipitation by pH Shifting

Following the optimization of cell disruption, the process was scaled up to a 2 L (1.5 working volume), 100 W stirred ball mill (Tencan, China). Due to its larger capacity, the amount of microalgal slurry acquired from the 2 L ball mill will be sufficient to evaluate the efficacy of pH shifting to the isoelectric point to precipitate the extracted proteins. To remove insoluble cell matter and isolate a protein-rich supernatant prior to pH adjustment, the microalgal slurry was centrifuged at 3000 rpm for 15 min in 50 mL centrifuge tubes (Alkali Scientific, Fort Lauderdale, FL, USA) using an Allegra® X-12R centrifuge (Beckman Coulter, Brea, CA, USA). This centrifugation step was identified as a key pre-treatment to obtain a protein-rich supernatant, thus this separation process needed to be optimized. The total solids content of the microalgal slurry was ~20% w/w, which can lead to poor separation during centrifuging. Therefore, dilution factors of 0 (no dilution), 2, 5, and 10 were applied to the microalgal slurry prior to centrifugation to optimize the total solids content of the slurry.
Following the initial centrifugation, the microalgal slurry was separated into protein-rich supernatant and settled solids. The protein-rich supernatant was removed from the settled solids for pH adjustment to the isoelectric point of microalgal proteins which, according to previous examination, is approximately a pH of 4 [3,15]. The pH of the protein-rich supernatant was adjusted using 1 M sulfuric acid (H2SO4) in 1 mL intervals and 0.1 mL intervals close to the pI while being stirred consistently. Once the pI was reached, the protein-rich supernatant was centrifuged at 3000 rpm for 15 min to obtain a supernatant and precipitated proteins. The supernatant, containing mostly K2SO4 as a result of the reaction between KOH added for cell disruption and H2SO4 added for pH adjustment, was referred to as the salt supernatant.
The applied dilution factors were evaluated based on net recovered protein isolate (dry, g), percentage of recovered protein (w/w%), and relative protein content (w/w%). The protein content (g/L) of all samples was determined by measuring the TN, using nutrient test kits (HACH Company, Loveland, CO, USA) in duplicate, and the stoichiometric conversion. The net recovered protein was determined by calculating the dry weight of the protein in a sample using protein content measurement. The percentage of recovered protein was calculated as the mass of recovered protein per mass of expected protein. The net mass of recovered protein was determined as previously mentioned, and expected protein was estimated using the protein content of the untreated dry biomass and the calculated protein extraction following optimization of cell disruption. Relative protein content was calculated as the dry mass of recovered protein divided by the total dry mass of the sample. The relative protein content was used as an indicator of the purity of the protein isolate. The dry mass of the samples was determined by drying them in duplicate at 105 °C for 24 h.

2.4. Mass Balance and Energy Analysis

Mass and energy balances of the mechanochemical process (mechanochemical cell disruption and protein recovery) at a process scale were completed to identify key mass flows and estimate the energy intensity. The current mechanochemical cell disruption was scaled to process 10,000 kg of wet biomass (2000 kg of dry biomass) per batch. An envisioned cylindrical ball mill with a diameter and height of 1.2 m and 2.4 m, respectively, and an effective volume of 10 m3 was assumed to carry out the mechanochemical cell disruption. The agitation power was calculated according to Equation (2) [16].
P = N P ρ N i 3 D i 5
The agitation power P (W) was calculated based on the following coefficients and values: N P is the power number (0.35) for the rod impeller in the turbulent regime; ρ is the density of the biomass slurry (kg/m3); Ni is the agitator speed (rotation per second); and Di is the impeller diameter of 1.18 m. Centrifugation is used to remove solids from the protein-rich supernatant and to recover the isolated proteins (Alfa Laval WHPX 513 TGD 24-60, Dolphin Centrifuge, Warren, MI, USA). The selected centrifuge has a processing capacity of 14 m3/h with a power requirement of 11.24 kW. The resulting protein yield was based on a 58.6% protein content of the dry biomass, and the calculated protein extraction and protein recovery efficiencies. Finally, it was assumed that 5% of the total microalgal slurry would be lost during the cell disruption process due to the high solids content and resulting high viscosity.

2.5. Statistical Analysis

R (version 4.0.3) and R Studio were used to analyze the data collected for this study. A Shapiro-Wilk’s test was applied to check for normality and an F-test was applied to confirm equal variances. Data with normal distributions and equal variances were tested using parametric, analysis of variance (ANOVA) statistical tests. To determine if there were any statistically significant interactions between treatments during milling optimization, a factorial ANOVA was used followed by Tukey’s test for post hoc multiple comparisons. A one-way ANOVA and Tukey’s test were used to determine optimal pH shifting conditions. Data with non-normal distributions and unequal variances were tested using the non-parametric Kruskal-Wallis test. All tests were performed with α = 0.05 and statistical significance was determined as a p-value ≤ 0.05.

3. Results and Discussion

3.1. C. sorokiniana Characterization

The results from forage analysis of the original biomass used for cell disruption and protein recovery can be found in Table S1. The crude protein content of the untreated biomass, at 58.3 ± 1.84%, is expected based on a previously recorded value of 58.6% [3]. Lipid, carbohydrate, and ash contents are also consistent with previous analyses. SDS-PAGE was performed to characterize the proteins present in the untreated biomass. Figure 1 shows the proteins present in untreated biomass loaded at 10, 20, 25, 30, 40, and 50 uL. The observed bands A-I, and their estimated molecular weights, are detailed in Table 1. Bands C, G, and I, at approximately 50, 25, and 15 kD, were observed to have the darkest staining and thus, the highest protein concentration. A related study of C. sorokiniana identified proteins with similar molecular weights [17]. Using nanoLC-nanoESI MS/MS, researchers were able to accurately characterize proteins such as Phosphoglycerate Kinase (49.13 kD), ATP Synthase Subunit Beta (Chloroplast) (51.83 kD), 50S Ribosomal Protein L7/L12 (Chloroplast) (13.58 kD), and Fe-superoxide Dismutase (26.41 kD).

3.2. Mechanochemical Cell Disruption

A total of 48 experiments were conducted in duplicate, producing 96 data points that were analyzed with a factorial ANOVA (Table S2). Results indicate that milling speed and ball-to-biomass ratio have no significant effect on protein extraction as measured by the percentage of protein extracted (p > 0.05). However, the milling time, milling media, and KOH to biomass ratio have a significant effect on protein extraction (p < 0.05). Due to the complexity created by having several independent variables, the results from the factorial ANOVA also show multiple significant interactions between variables. Notably, there is no significant interaction between all five parameters (p > 0.05), indicating that there is a synergistic effect resulting in similar protein extraction efficiencies. A post-hoc comparison with Tukey’s test detailed nearly 1400 significant interactions between factors and the levels within those factors.
There are only three significant individual factors: milling media, milling time, and KOH to biomass ratio. The optimal milling conditions for these factors are 60 min, zirconia media, and a 1:1 ratio. It’s clear that the most significant parameter is the KOH to biomass ratio (Figure 2a), with the 1:1 ratio resulting in better protein extraction at 54.0 ± 11.1% compared to 31.0 ± 4.63% with the 1:2 ratio. This is followed by milling media (Figure 2b), where zirconia performed better than agate, extracting 48.0 ± 15.1% of protein compared to 36.9 ± 11.2%. Finally, Figure 2c shows mean protein extraction grouped by milling times of 30 and 60 min. The data seem to indicate that there is no significant difference between 30 and 60 min, with protein extraction of 40.3 ± 13.2% and 44.4 ± 15.2%, respectively. However, the results from the factorial ANOVA indicate a significant difference between the two milling times. This significance is likely due to the statistical test’s ability to detect the dependent nature of seemingly independent variables, such as milling time. The complexity of the system, its variables, and their interactions is further confirmed by the results from Tukey’s test.
Figure 2d,e show the means of these factors when grouped and separated by milling media. The data clearly show that there is a significant interaction between milling media and KOH to biomass ratio, and KOH to biomass ratio and milling time. The 1:1 KOH to biomass ratio results in significantly higher protein extraction across milling media and milling times. Looking at the means with a 1:1 KOH to biomass ratio and zirconia for milling media, 30 min resulted in 59.1 ± 7.75% and 60 min resulted in 65.1 ± 4.83% protein extracted. Comparatively, agate media with a 1:1 KOH to biomass ratio resulted in 42.8 ± 8.01% and 49.5 ± 7.37% protein extracted from 30- and 60-min milling times, respectively.
Due to the complexity of the results from the factorial ANOVA and corresponding Tukey’s test, decisions regarding milling conditions for scale-up were made based on both statistical significance and practical considerations. A KOH to biomass ratio of 1:1 proved to be significantly more effective for protein extraction on several levels, and thus was used for scaled-up experiments. Although there was no significant difference between the ball-to-biomass ratios, a 4:1 ratio is preferred for scaling purposes to address clogging and cleaning issues. Additionally, a rotational speed of 400 rpm will require less energy and is thus the optimal speed. Due to the significance resulting from interactions between milling time and other factors, a 60-min milling time was selected. The results from the factorial ANOVA revealed that zirconia was significantly better than agate in terms of protein extraction efficiency using the planetary ball mill. However, the density of zirconia (5.68 g/cm3) is much higher than agate (2.62 g/cm3), and it has been observed that microalgal biomass and zirconia media do not mix well in a stirred tank ball mill. This can cause high energy demand and may impact protein extraction efficiency as well. This reason, in addition to the cost difference between the two materials, resulted in agate being the selected milling media for scale-up. Under these selected milling conditions, the mean protein extraction was 52.7 ± 6.45%.

3.3. Protein Precipitation

Following cell disruption, a total of 18 samples were produced using the precipitation protocol. The samples were then tested for total nitrogen to determine the protein content. A total of 18 data points were collected for statistical analysis using the three metrics previously described: net recovered protein, percentage of protein recovered, and relative protein content. Figure 3 shows the mean of each metric for 0- (no dilution), 2-, 5-, and 10-times diluted microalgal slurry.
The percentage of protein recovered, shown in Figure 3a, was calculated using the net mass of protein recovered and the starting mass of protein in the microalgal slurry after mechanochemical cell disruption. The starting mass of protein was determined using the dry mass of the microalgal slurry used for precipitation, a mean protein extraction of 52.7%, and protein content of 58.6% of the dry matter. The sample that received no dilution performed significantly better than those samples that were diluted 2-, 5-, and 10-times, with a mean protein recovery of 98.7 ± 9.40%. The lower recovery for the 2-, 5-, and 10-times diluted samples is likely due to the lower starting mass and the larger effect that any mass losses had on recovery. Figure 3b shows the relative protein content, or the purity, of the samples. The 10-times diluted samples had a significantly higher relative protein content than all other dilution factors, with a mean of 59.3 ± 6.13%. The samples that received no dilution had a mean relative protein content of 41.4 ± 4.97%, which was significantly higher than the samples diluted 5-times but not significantly higher than those that were only diluted 2-times.
Figure 3c shows the net dry mass of recovered protein, which was significantly higher for the samples that received no dilution when compared to all other dilution factors, with means equal to 3.07 ± 0.292 g, 0.910 ± 0.077 g, 0.224 ± 0.034 g, and 0.179 ± 0.013 g for the 0-, 2-, 5-, and 10-times diluted samples, respectively. This result is expected because the starting biomass for the 2-times diluted sample is half that of the sample that was not diluted, and likewise for the 5- and 10-times diluted samples. The descending order of net recovered protein correlating with the increasing dilution factors indicates that, though not exact, the precipitation method can recover protein that is proportional to the starting biomass. The results detailed in Figure 3 indicate that while the precipitation method is successful at recovering nearly all the protein extracted during the milling process, its unable to successfully remove all non-protein solids.

3.4. Mass Balance and Energy Analysis

The mass and energy balance analyses were based on processing 2000 kg of dry microalgal biomass for protein production (Table 2). Parameters used to calculate the power required for cell disruption were based on the optimal milling conditions selected in this study. The ball mill was assumed to have a zirconia vessel and rod impeller. However, agate balls were selected as the milling media. Using a 1:4 mass ratio of wet biomass to agate, the density of the microalgal slurry was estimated to be 1857 kg/m3. The agitator speed was set as 6.67 rps (400 rpm) and the milling time was set to 60 min. The extraction efficiency of cell disruption was assumed to be 52.7%, a dilution factor of 0, and a corresponding protein recovery of 97.8% were used for this analysis.
The consumption of 5959 kg of 1M H2SO4 is equivalent to the consumption of 540 kg of 99.9% H2SO4 and 5419 kg of water. The mechanochemical cell disruption and protein recovery process generated 618 kg of dry protein isolate from 2000 kg of dry algal biomass per batch. Meanwhile, the energy demands for the ball mill and centrifuge were 0.79 and 0.036 MJ/kg dry algal biomass. The energy required for centrifugation reflects the two stages in the protein recovery method and a processing capacity of 14 m3/h. Yap et al. found that Nannochloropsis sp. suspensions with 25% w/w solids can be processed by high-pressure homogenization with an energy consumption of about 1.00 MJ/kg dry [6]. Safi et al. achieved 49% protein yield from 10% w/w solids suspensions of Nannochloropsis sp. with an energy input of 1.58 MJ/kg dry using high pressure homogenization [18]. The total energy consumed by the mechanochemical process was 0.83 MJ/kg dry biomass at the envisioned commercial scale in this study. With a solids content of approximately 20% w/w and a 52.7% protein extraction efficiency, this study was able to achieve protein recovery from a high total solids biomass with a much lower energy consumption than other reported mechanical disruption methods.

4. Conclusions

This study evaluated protein extraction, precipitation, and recovery methods of algal biomass. Optimization of the mechanochemical process resulted in a set of milling conditions that achieved protein extraction of 52.7 ± 6.45%. These conditions were successfully scaled up from a bench-top planetary mill to a standing stirred mill. The acid precipitation method was optimized to recover 98.7% of proteins from the microalgal slurry at a solids content of 20% w/w. This recovery rate from a high solids slurry stands out when compared to results from Obeid et al. where the maximum recovery of proteins from a low solids (20:1 liquid to solid ratio) was 73% after lipids were extracted [5]. However, the measured protein content of the protein isolate remained relatively low, at 41.4% w/w. These results indicate that the precipitation method is successful at recovering the extracted proteins in the algal slurry, however, the removal of non-protein solids during centrifugation and pH adjustment is not complete. Future work should address these challenges by modifying the method for the removal of solids. Lipid extraction may be a necessary step to obtaining a pure protein isolate. The energy balance analysis elucidated that the energy demand of the protein extraction and recovery operation, at 0.83 MJ/kg dry algal biomass, is much lower than previous studies using high-pressure homogenization and membrane filtration. Collectively, this study suggests that mechanochemical protein extraction and recovery is an effective, low-energy processing method for algal biorefining to facilitate the separation of protein, carbohydrate, and lipid in biomass, and to improve the efficiency of value-added chemical and fuel production. Future work should be focused on improving the richness and integrity of the protein isolate, and further evaluating the viability of this method at the pilot and demonstration scale.

Supplementary Materials

The following supporting information can be downloaded at: https://www.mdpi.com/article/10.3390/en16124809/s1, Table S1: Forage analysis characterization of C. sorokiniana biomass. Samples were freeze dried prior to analysis. Values represent the average of two samples; Table S2: Results of the factorial ANOVA for optimization of mechanochemical cell disruption. More than one variable indicates the presence of a significant interaction between variables.

Author Contributions

Conceptualization, A.C., S.U.-D., Y.L. and W.L.; methodology, A.C. and W.L.; validation, A.C., H.F. and S.U.-D.; formal analysis, A.C.; investigation, A.C.; data curation, A.C. and H.F.; writing—original draft preparation, A.C.; writing—review and editing, A.C., S.U.-D. and W.L.; visualization, A.C.; supervision, S.U.-D., Y.L. and W.L.; project administration, Y.L. and W.L.; funding acquisition, Y.L. and W.L. All authors have read and agreed to the published version of the manuscript.

Funding

The authors greatly appreciate the financial support from the United States Department of Energy (DOE) National Energy Technology Laboratory (NETL) (Award No.: DE-FE0030977).

Data Availability Statement

The data that support the findings of this study are available from the corresponding author, W.L., upon reasonable request.

Acknowledgments

The authors thank Michigan AgBioResearch for funding this work through faculty salaries.

Conflicts of Interest

The authors declare no conflict of interest.

References

  1. Climate Watch Historical GHG Emissions. 2021. Available online: https://www.climatewatchdata.org/ghg-emissions?breakBy=sector&end_year=2018&gases=co2&start_year=1990 (accessed on 5 April 2021).
  2. Ganesan, R.; Manigandan, S.; Samuel, M.S.; Shanmuganathan, R.; Brindhadevi, K.; Chi, N.T.L.; Duc, P.A.; Pugazhendhi, A. A review on prospective production of biofuel from microalgae. Biotechnol. Rep. 2020, 27, e00509. [Google Scholar] [CrossRef] [PubMed]
  3. Ursu, A.V.; Marcati, A.; Sayd, T.; Sante-Lhoutellier, V.; Djelveh, G.; Michaud, P. Extraction, fractionation and functional properties of proteins from the microalgae Chlorella vulgaris. Bioresour. Technol. 2014, 157, 134–139. [Google Scholar] [CrossRef] [PubMed]
  4. Guenerken, E.; D’Hondt, E.; Eppink, M.H.M.; Garcia-Gonzalez, L.; Elst, K.; Wijffels, R.H. Cell disruption for microalgae biorefineries. Biotechnol. Adv. 2015, 33, 243–260. [Google Scholar] [CrossRef] [PubMed]
  5. Obeid, S.; Beaufils, N.; Peydecastaing, J.; Camy, S.; Takache, H.; Ismail, A.; Pontalier, P.-Y. Microalgal fractionation for lipids, pigments and protein recovery. Process Biochem. 2022, 121, 240–247. [Google Scholar] [CrossRef]
  6. Yap, B.H.J.; Dumsday, G.J.; Scales, P.J.; Martin, G.J.O. Energy evaluation of algal cell disruption by high pressure homogenisation. Bioresour. Technol. 2015, 184, 280–285. [Google Scholar] [CrossRef] [PubMed]
  7. t Lam, G.P.; Vermuë, M.H.; Eppink, M.H.M.; Wijffels, R.H.; van den Berg, C. Multi-Product Microalgae Biorefineries: From Concept towards Reality. Trends Biotechnol. 2018, 36, 216–227. [Google Scholar] [CrossRef] [PubMed]
  8. Eppink, M.H.M.; Olivieri, G.; Reith, H.; van den Berg, C.; Barbosa, M.J.; Wijffels, R.H. From Current Algae Products to Future Biorefinery Practices: A Review. In Biorefineries; Wagemann, K., Tippkotter, N., Eds.; Springer International Publishing Ag: Cham, Switzerland, 2019; Volume 166, pp. 99–123. [Google Scholar]
  9. Mortensen, L.M.; Gislerød, H.R. The growth of Chlorella sorokiniana as influenced by CO2, light, and flue gases. J. Appl. Phycol. 2016, 28, 813–820. [Google Scholar] [CrossRef]
  10. Cutshaw, A.; Daiek, C.; Zheng, Y.; Frost, H.; Marks, A.; Clements, D.; Uludag-Demirer, S.; Verhanovitz, N.; Pavlik, D.; Clary, W.; et al. A long-term pilot-scale algal cultivation on power plant flue gas—Cultivation stability and biomass accumulation. Algal Res. 2020, 52, 102115. [Google Scholar] [CrossRef]
  11. Wang, X.Q.; Ruan, Z.H.; Sheridan, P.; Boileau, D.; Liu, Y.; Liao, W. Two-stage photoautotrophic cultivation to improve carbohydrate production in Chlamydomonas reinhardtii. Biomass Bioenerg. 2015, 74, 280–287. [Google Scholar] [CrossRef]
  12. Pavlik, D.; Zhong, Y.; Daiek, C.; Liao, W.; Morgan, R.; Clary, W.; Liu, Y. Microalgae cultivation for carbon dioxide sequestration and protein production using a high-efficiency photobioreactor system. Algal Res. 2017, 25, 413–420. [Google Scholar] [CrossRef]
  13. Jones, D.B. Factors for converting percentages of nitrogen in foods and feeds into percentages of protein. USDA Circ. 1931, 183, 1–21. [Google Scholar]
  14. Hach. EPA Compliant Methods. 1996. Available online: https://www.hach.com/epa (accessed on 5 April 2021).
  15. Cavonius, L.R.; Albers, E.; Undeland, I. pH-shift processing of Nannochloropsis oculata microalgal biomass to obtain a protein-enriched food or feed ingredient. Algal Res. 2015, 11, 95–102. [Google Scholar] [CrossRef] [Green Version]
  16. Doran, P.M. Bioprocess Engineering Principles, 2nd ed.; Elsevier: Amsterdam, The Netherlands, 2013. [Google Scholar]
  17. Tejano, L.A.; Peralta, J.P.; Yap, E.E.S.; Panjaitan, F.C.A.; Chang, Y.-W. Prediction of Bioactive Peptides from Chlorella sorokiniana Proteins Using Proteomic Techniques in Combination with Bioinformatics Analyses. Int. J. Mol. Sci. 2019, 20, 1786. [Google Scholar] [CrossRef] [PubMed] [Green Version]
  18. Safi, C.; Campos, R.P.; Engelen-Smit, N.; Mulder, W.J.; van den Broek, L.A.M.; Sijtsma, L.; Olivieri, G. Biorefinery of microalgal soluble proteins by sequential processing and membrane filtration. Bioresour. Technol. 2017, 225, 151–158. [Google Scholar] [CrossRef] [PubMed] [Green Version]
Figure 1. SDS-PAGE characterization of untreated biomass under different loading volumes. Letters A-I correspond to observed molecular weights in Table 1.
Energies 16 04809 g001
Figure 2. Average protein extraction based on KOH to biomass ratio (a), milling media (b), milling time (c), KOH to biomass ratio and milling time for zirconia media (d), and KOH to biomass ratio and milling time for agate media (e). Error bars are equal to the standard deviation.
Energies 16 04809 g002
Figure 3. Mean protein recovery (a), relative protein content (b), and net recovered protein (c) and are representative of 5, 4, 6, and 3 replicates for 0-, 2-, 5-, and 10-times dilution factors, respectively. Error bars are equal to the standard deviation.
Energies 16 04809 g003
Table 1. Observed molecular weights of the proteins present in C. sorokiniana biomass.
IDObserved MW
A75
B55
C50
D37
E30
F29
G25
H22
I19
Table 2. Key mass and energy flow from the mass and energy balance analyses.
ParameterValue
Microalgal biomass (wet, kg)10,000
Microalgal biomass (dry, kg)2000
KOH (kg)760
1 M H2SO4 (kg)5959
Protein (kg)618
Ball mill (MJ/kg dry biomass)0.79
Centrifuge (MJ/kg dry biomass)0.036
Total energy demand (MJ/kg dry algal biomass)0.83
Disclaimer/Publisher’s Note: The statements, opinions and data contained in all publications are solely those of the individual author(s) and contributor(s) and not of MDPI and/or the editor(s). MDPI and/or the editor(s) disclaim responsibility for any injury to people or property resulting from any ideas, methods, instructions or products referred to in the content.

