Article

Electrochemical Production of Sodium Hypochlorite from Salty Wastewater Using a Flow-by Porous Graphite Electrode

1
Canal Higher Institute of Engineering and Technology, Chemical Engineering Department, Suez P.O. Box 11837, Egypt
2
Water Pollution Research Department, National Research Centre, 33 Behooth St., Dokki, Giza P.O. Box 12622, Egypt
3
Faculty of Civil and Environmental Engineering, Gdansk University of Technology, Narutowicza 11/12, 80-233 Gdansk, Poland
4
Department of Engineering Mathematics and Physics, El-Shorouk Academy, Cairo P.O. Box 11835, Egypt
*
Authors to whom correspondence should be addressed.
Energies 2023, 16(12), 4754; https://doi.org/10.3390/en16124754
Submission received: 25 April 2023 / Revised: 27 May 2023 / Accepted: 14 June 2023 / Published: 16 June 2023
(This article belongs to the Special Issue Wastewater Treatment Related to Energy)

Abstract

:
The production of sodium hypochlorite (NaOCl) from salty wastewater using an electrochemical cell has several advantages over other methods that often require hazardous chemicals and generate toxic waste, being more sustainable and environmentally friendly. However, the process of producing sodium hypochlorite using an electrochemical cell requires careful control of the operating conditions, such as the current density, flow rate, inert electrode spacing, and electrolyte concentration, to optimize the conversion efficiency and prevent electrode fouling and degradation. In this study, NaOCl was produced via a bench-scale electrochemical cell using a flowing porous graphite electrode in a continuous flow system from salty wastewater collected from the Suez Canal in Egypt. The aim of the investigation was to examine the factors that affect the concentration of NaOCl and energy consumption, such as anodic current density, salinity, inert electrode spacing, and influent feed flow rate. A lab-scale reactor with two electrodes was used to conduct the experiments. The highest NaOCl yield of 20.6% was achieved with a graphite electrode, which had high current efficiency and rigidity at a flow rate of 4.5 mL/min, a current density of 3.183 mA/cm2, an electrode space of 0.5 cm, salinity of 40,000 ppm, and a pH of 6.4. The power consumption under these conditions was 0.0137 kwh. Additionally, a statistical and least square multivariate regression technique was employed to establish a correlation for predicting the % NaOCl production. The obtained correlation had an R2 value of 98.4%. Overall, this investigation provides valuable insights into the production of NaOCl using a continuous flow system from salty wastewater, which could have potential for industrial applications in various sectors such as textiles, detergents, paper, and pulp.

1. Introduction

Aqueous sodium hypochlorite (NaOCl) is present in the form of hypochlorite ions (-OCl) and is commonly known as free chlorine. It is a potent oxidizing agent widely used in water treatment to prevent fouling in different kinds of membrane systems such as microfiltration [1,2,3] and ultrafiltration [4,5] membrane separation techniques. Sodium hypochlorite is also widely used as a disinfectant in homes and hospitals to disinfect various surfaces from viruses and bacteria [6], including Staphylococcus aureus, Escherichia coli [7,8], and Bacillus subtilis [9,10]. Additionally, it is also used for treating hospital waste and wastewater [11] to prevent the spread of viruses and infections in the environment. Moreover, sodium hypochlorite is commonly utilized on a large scale for fabric bleaching and odor elimination [12,13].
In the wastewater field, hypochlorite could be produced in situ for the anodic oxidation of dye molecules [13,14] and phenols [15]. Sodium hypochlorite has several benefits, such as the safety of its storage and transportation, and it does not leave any residual effluent in the environment. In household bleach form (5%), sodium hypochlorite is used for stain removal from clothes. Residual hypochlorite can be neutralized by post-treatment with weak organic acids, such as acetic acid (vinegar), and chlorine can be volatilized. Sodium hypochlorite is also used in the disposal of cyanide wastes and could be used in the water disinfection of swimming pools [13].
In general, sodium hypochlorite can be produced using two methods: chemical and electrochemical. However, due to the potential environmental risks associated with liquid chlorine storage and transportation, the electrochemical method is preferred [13]. Nowadays, more consumers are opting to create their own hypochlorite solutions through direct electrolysis of weak brine or seawater using undivided electrolytic cells that can be customized to meet specific requirements. However, some hazardous byproducts of wastewater such as leachate can also produce sodium hypochlorite and can have dual benefits of treating hazardous wastewater and producing hypochlorite in small amounts via the electrochemical process [16,17]. This process involves using DC-powered electrodes, usually with a voltage of 2–4 V, to convert brine into chlorine in an undivided electrolytic cell by electrolyzing synthetic seawater (an aqueous 3% NaCl solution) or seawater. During this process, chlorine is produced at the anode and caustic at the cathode. Another way to produce sodium hypochlorite is through the direct chemical reaction of chlorine gas (Cl2) and caustic solution (NaOH). In the electrolysis of sodium chloride, hydrogen gas is produced at the cathode, while chlorine gas is released at the anode. The chlorine is then dissolved in the bulk solution and hydrolyzed to produce hypochlorous acid, which in turn leads to the formation of hypochlorite [18]. Figure 1 exhibits the schematic diagram of an electrolyzing seawater mechanism to produce sodium hypochlorite.
At anode: NaCl → Na+ + Cl; 2Cl − 2e → Cl2
At cathode: H2O → H+ + OH; 2 H+ +2e →H2; Na+ + OH → NaOH
In the tank: NaOH + Cl2 → NaOCl + NaCl + H2O
Chlorine can be generated either in gas form or through the hydrolysis of hypochlorite (OCl), which produces sodium hypochlorite (NaOCl), commonly known as bleach. However, due to safety concerns, only large, centralized chlor-alkali plants use cells that produce chlorine gas. Hypochlorite-producing cells, on the other hand, can be smaller and safer, requiring only basic safety measures and knowledge [19]. This makes them suitable for smaller on-site operations as well. Hypochlorite generators are electrolytic cells that produce sodium hypochlorite. During electrolysis, molecular chlorine and hydroxide ions (OH) are formed at the anode and cathode, respectively, and since they are allowed to mix freely, they react to produce hypochlorite (OCl) (reaction 3). In chloro-alkali cells, caustic soda (NaOH) and chlorine gas are produced separately. These two substances are combined in specific concentrations to create household and industrial-strength bleach, which can be as strong as 30 and 150 g/L, respectively [18].
Producing electrochemical-forming chlorine from seawater and using it as sodium hypochlorite can be a cost-effective option [20,21]. This technique involves the electrolysis of seawater to produce sodium hypochlorite, using readily available and inexpensive ingredients, electricity, and saltwater. During electrolysis, the anode and cathode produce products that mix and form hypochlorite (OCl). The resulting concentrations of sodium hypochlorite are similar to those found in household and industrial-strength bleach, which are produced separately in chlor-alkali cells by mixing chlorine gas and caustic soda (NaOH) [22].
To date, there has been no research conducted on the electrochemical production of sodium hypochlorite at a laboratory bench scale using a flow-by porous graphite electrode. Flow-by graphite electrodes are known to offer a larger surface area for oxidation reactions, and porous electrodes have been found to have higher mass transfer rates and electroactive area per unit reactor volume compared to two-dimensional electrode materials [23]. Porous electrodes, which allow for the mass to pass through them, have been utilized to overcome this issue [23]. Flow-through and flow-by electrodes have been widely used due to their ability to provide high mass-transfer coefficients and large electrode surface areas [24,25].
The objective of this study was to optimize the practical processing parameters, including feed flow rate, salinity, inert electrode spacing, and anodic current density, for the continuous electrochemical production of NaOCl from salty wastewater. The experiments were conducted using a bench-scale electrochemical cell with flow-by porous graphite electrodes. Our electrochemical cell offers several advantages, such as the use of inexpensive graphite electrodes that provide a high surface area for anodic oxidation reactions, resulting in low energy consumption for sodium hypochlorite production compared to other electrochemical cell designs. Additionally, our electrochemical cell operates continuously, allowing for high daily production quantities of sodium hypochlorite, whereas batch systems are limited by specific quantities and time periods. Moreover, the electrolysis time is shorter compared to other types of electrolysis, and a wide range of sodium hypochlorite concentrations can be produced. The results also revealed that increasing the applied current density and salt concentration, as well as decreasing the salty wastewater flow rate, led to a higher yield of sodium hypochlorite. The best operating conditions for the electrochemical cell were obtained. The study also obtained a multivariate square and statistical regression analysis for expecting the % NaOCl production. A comparison was made between the cell that we manufactured and other cells for the production of sodium hypochlorite, which proved the quality of the proposed cell at optimum operating conditions and thus the quality of the product (NaOCl) and its concentration ratio, reflected economically and environmentally in the process of producing sodium hypochlorite.

2. Materials and Methods

2.1. Physical and Chemical Characteristics of Salty Wastewater

This study utilized a real sample of salty wastewater collected from the Suez Canal in the Suez Governorate, Egypt, which exhibited the characteristics listed in Table 1. The pH value was determined using the JENWAY 3510 device, while the total dissolved solids (TDS) value was measured using the JENWAY 4510 device. To determine the concentrations of calcium, magnesium, sodium, and potassium in the salty wastewater, it was filtered through a 0.22 µm membrane filter (Thermo Fisher, USA) and analyzed using ion chromatography (ICS 5000+, Dionex Corporation, USA). Additionally, the bicarbonate, carbonate, chlorine, and sulfate ions were measured using the methods described by APHA [26].

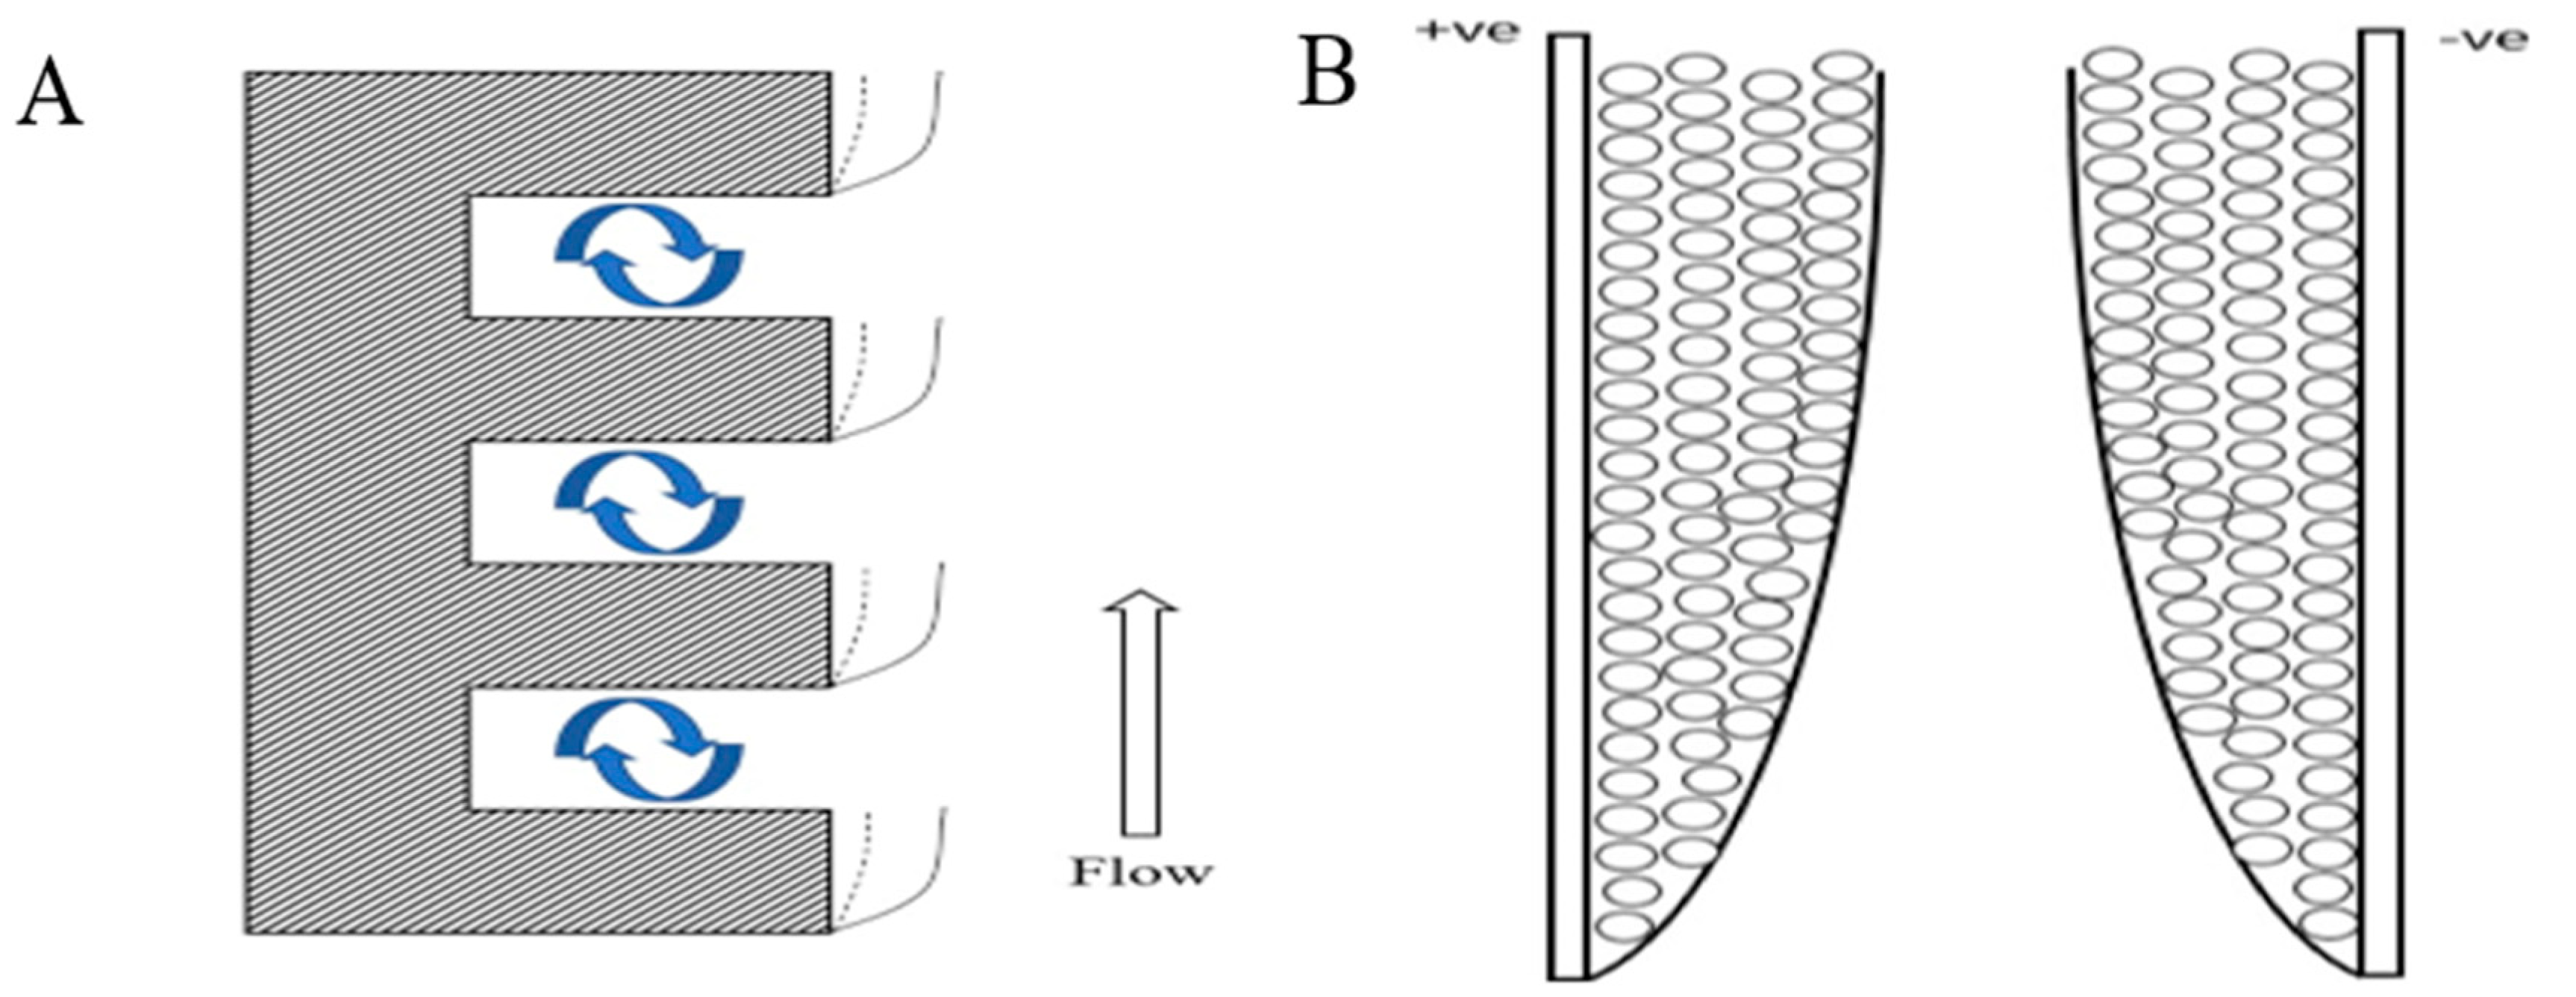
2.2. Cell Construction

Figure 2 displays the experimental cell that incorporates a dosing pump and is designed to assess the NaOCl production capacity of a typical cell using salty water. The noteworthy characteristic of this cell is its porous electrode, which is fully immersed in salty water and connected to a DC power supply model RXN-3050, Range (30V–5A). The potential of the cell was measured using a digital multimeter of type M3800, while the current was measured using a multimeter of type ALDA-DT830. The feed of the salty water was injected into the cell through a dosing pump that can handle a maximum volumetric flow rate of 2.7 L/h, with an upward flow through the bed that can be controlled by adjusting the dosing pump. The porous electrode consists of an acrylic glass cylinder with two end flanges. The feed is introduced through a hole in the bottom of the cell, and the outlet and vent are released through a hole in the upper flange of the cell. Additionally, two parallel stainless-steel rods (D = 8 mm, L = 200 mm) were drilled through a PVC bush, with one serving as an anode current collector and the other as a cathode current collector. The electrode area measured 1256.68 cm2. On the feed side of the electrode, a cylinder made of PVC with a thickness of 4 inches was drilled with holes 1.5 mm in diameter and covered by metal meshwork (mesh size 5).

2.3. Characterizations of Graphite Bed

Graphite is a vitreous carbon material with a honeycomb structure and open pores, selected as the electrode material for its high surface area, isotropic electrical conductivity, rigid structure, and chemical inertness over a wide range of potentials in various aqueous media [27,28]. Commercially available in porosity grades ranging from 4 to 40 pores/cm [29,30], the electrode was prepared by compacting graphite granules that passed through sieve no. 20 and were retained on sieve no. 200, as shown in Figure 3. The granules were added to the cell through a PVC bush. Table 2 shows the sieve analysis of the graphite electrode granules. The basic properties of the porous electrode, as listed in Table 3, were either measured or estimated in this work, including the potential (V) and current (A) between the anode and cathode in the electrical circuit.

2.4. Experimental Work

For each trial, the electrochemical cell was fed with one liter of seawater sample at a controlled flow rate using a dosing pump. The experiments were conducted under continuous conditions, rather than a batch system, and were carried out at a standard temperature of approximately 25 °C and a neutral pH of 6.4. The pH solution was measured using a pH meter (Type Schott Gerate CG710) before and after treatment. Continuous agitation was achieved using a magnetic stirrer, and the total dissolved solids (TDS) concentration in the influent and effluent streams was measured for each trial using a TDS meter (Type HI 9835, Hanna). Each trial lasted for a minimum of 2.5 h, during which seawater samples were collected every 20 min to determine the NaOCl concentration using the standard analytical method of iodometric titration. Electrolysis tests were conducted by varying factors including current density (0.79577–3.183 mA/cm2), salinity (40,000–340,000 ppm), feed flow rate (4.5–45 mL/min), and the gap between the anode and cathode electrodes (0.5 to 2.5 cm).

3. Results and Discussion

3.1. Influence of Influent Feed Flow Rate on NaOCl Concentration in the Effluent Stream with the Effect of Porous Electrode

In this study, the electrochemical process for producing NaOCl from salty wastewater using a flowing porous graphite electrode was investigated by examining various operating factors. These factors include the anodic applied current density, salinity, gap between anode and cathode electrodes, and influent feed flow rate. Figure 4 illustrates the influence of feed flow rate on the NaOCl concentration generated from the electrochemical cell using a flow-by porous graphite electrode. In the experiment, the current density was held constant at 1.59 mA/cm2, the salinity was 40,000 ppm, the inert electrode spacing was 0.5 cm, and the electrolysis time was 20 min. We chose the concentration of salty wastewater to be 40,000 ppm because this is the same concentration of seawater in Egypt; thus, to evaluate the treatment according to real-world conditions, this concentration was used. The results showed that the flow rate has an inverse relationship with the NaOCl concentration. This indicates that the NaOCl concentration is strongly influenced by the flow rate, as a higher flow rate reduces the decomposition reaction rate and NaOCl concentration at a constant current density [13].
The use of graphite granules anode for anodic oxidation of salty water at various flow rates and residence times also played a significant role in achieving a high concentration of NaOCl. The highest concentration of hypochlorite was obtained at an optimal flow rate of 4.5 mL/min. This is due to a decrease in the diffusion layer thickness (δ) at the anode and cathode, resulting in an increase in the rate of mass transfer at the cathode and anode [31].
Clearly and according to Equations (4) and (5), the rate of diffusion reactions increases as the diffusion layer thickness decreases, and this observation was the same as that of Kamel et al., 2022 [32], who reported a decrease in sodium hypochlorite with an increase in the flow rate.
At the anode: 6OCl + 3H2O→2ClO−3 + 4Cl + 6H+ + 32 O2 + 6e
At the cathode: OCl + H2O + 2e→Cl + 2OH

3.2. Effect of the Porous Electrode on the Cell Performance

It is known that the roughness of any surface of the material increases the ability of the treatment [33] with increasing the area of the electrode per unit volume and increases cell capacity, with effects on the cell performance as a result. At the non-porous electrode surface, as the hydrodynamic layer is formed along the electrode, the thickness of the diffusion layer increases with the increasing height of the electrode. In this study, a continuous hydrodynamic boundary layer was formed on each porous electrode with the formation of eddies inside the pores [34], meaning that the average diffusion layer thickness (δ) of the porous electrode was less than that of the smooth one. The disorder and informality resulting from pores affected the produced amount of NaOCl as follows: firstly, these pores could enhance the mass transfer that would increase the rate of the whole reaction; secondly, the pores help significantly to remove the bubbles that are produced while removing the chloride with their fast dissolution in the solution. The fast movement of chloride in the solution reduces the polarization of the solution. The porosity and roughness mainly affect the whole process and the amount of the produced NaOCl; however, some work on electrode roughness, such as that of M. Kamel et al. (2022) [32], confirmed that the roughness and the pores in the electrode increase the yield by an amount ranging from 13% to 24% as the degree of electrode surface roughness increases. Moreover, the current efficiency increases as the pores of the electrode increase; this may be explained by the fact that in the anode area, a decrease in the effective current density could occur. This decrease would lead to a decrease in the evolved oxygen gas, i.e., improve the current efficiency of the generated chlorine and the formed hypochlorite. M. Kamel et al. (2022) [32] stated that energy consumption decreases with increasing surface roughness by an amount ranging from 23% to 39%, and this was mainly due to the decrease in cell voltage and the increase in NaOCl current efficiency with increasing surface roughness, as shown in Figure 5. This theory is in line with the theory of this study, that the pores that influence the roughness of the electrode positively affect the produced hypochlorite.

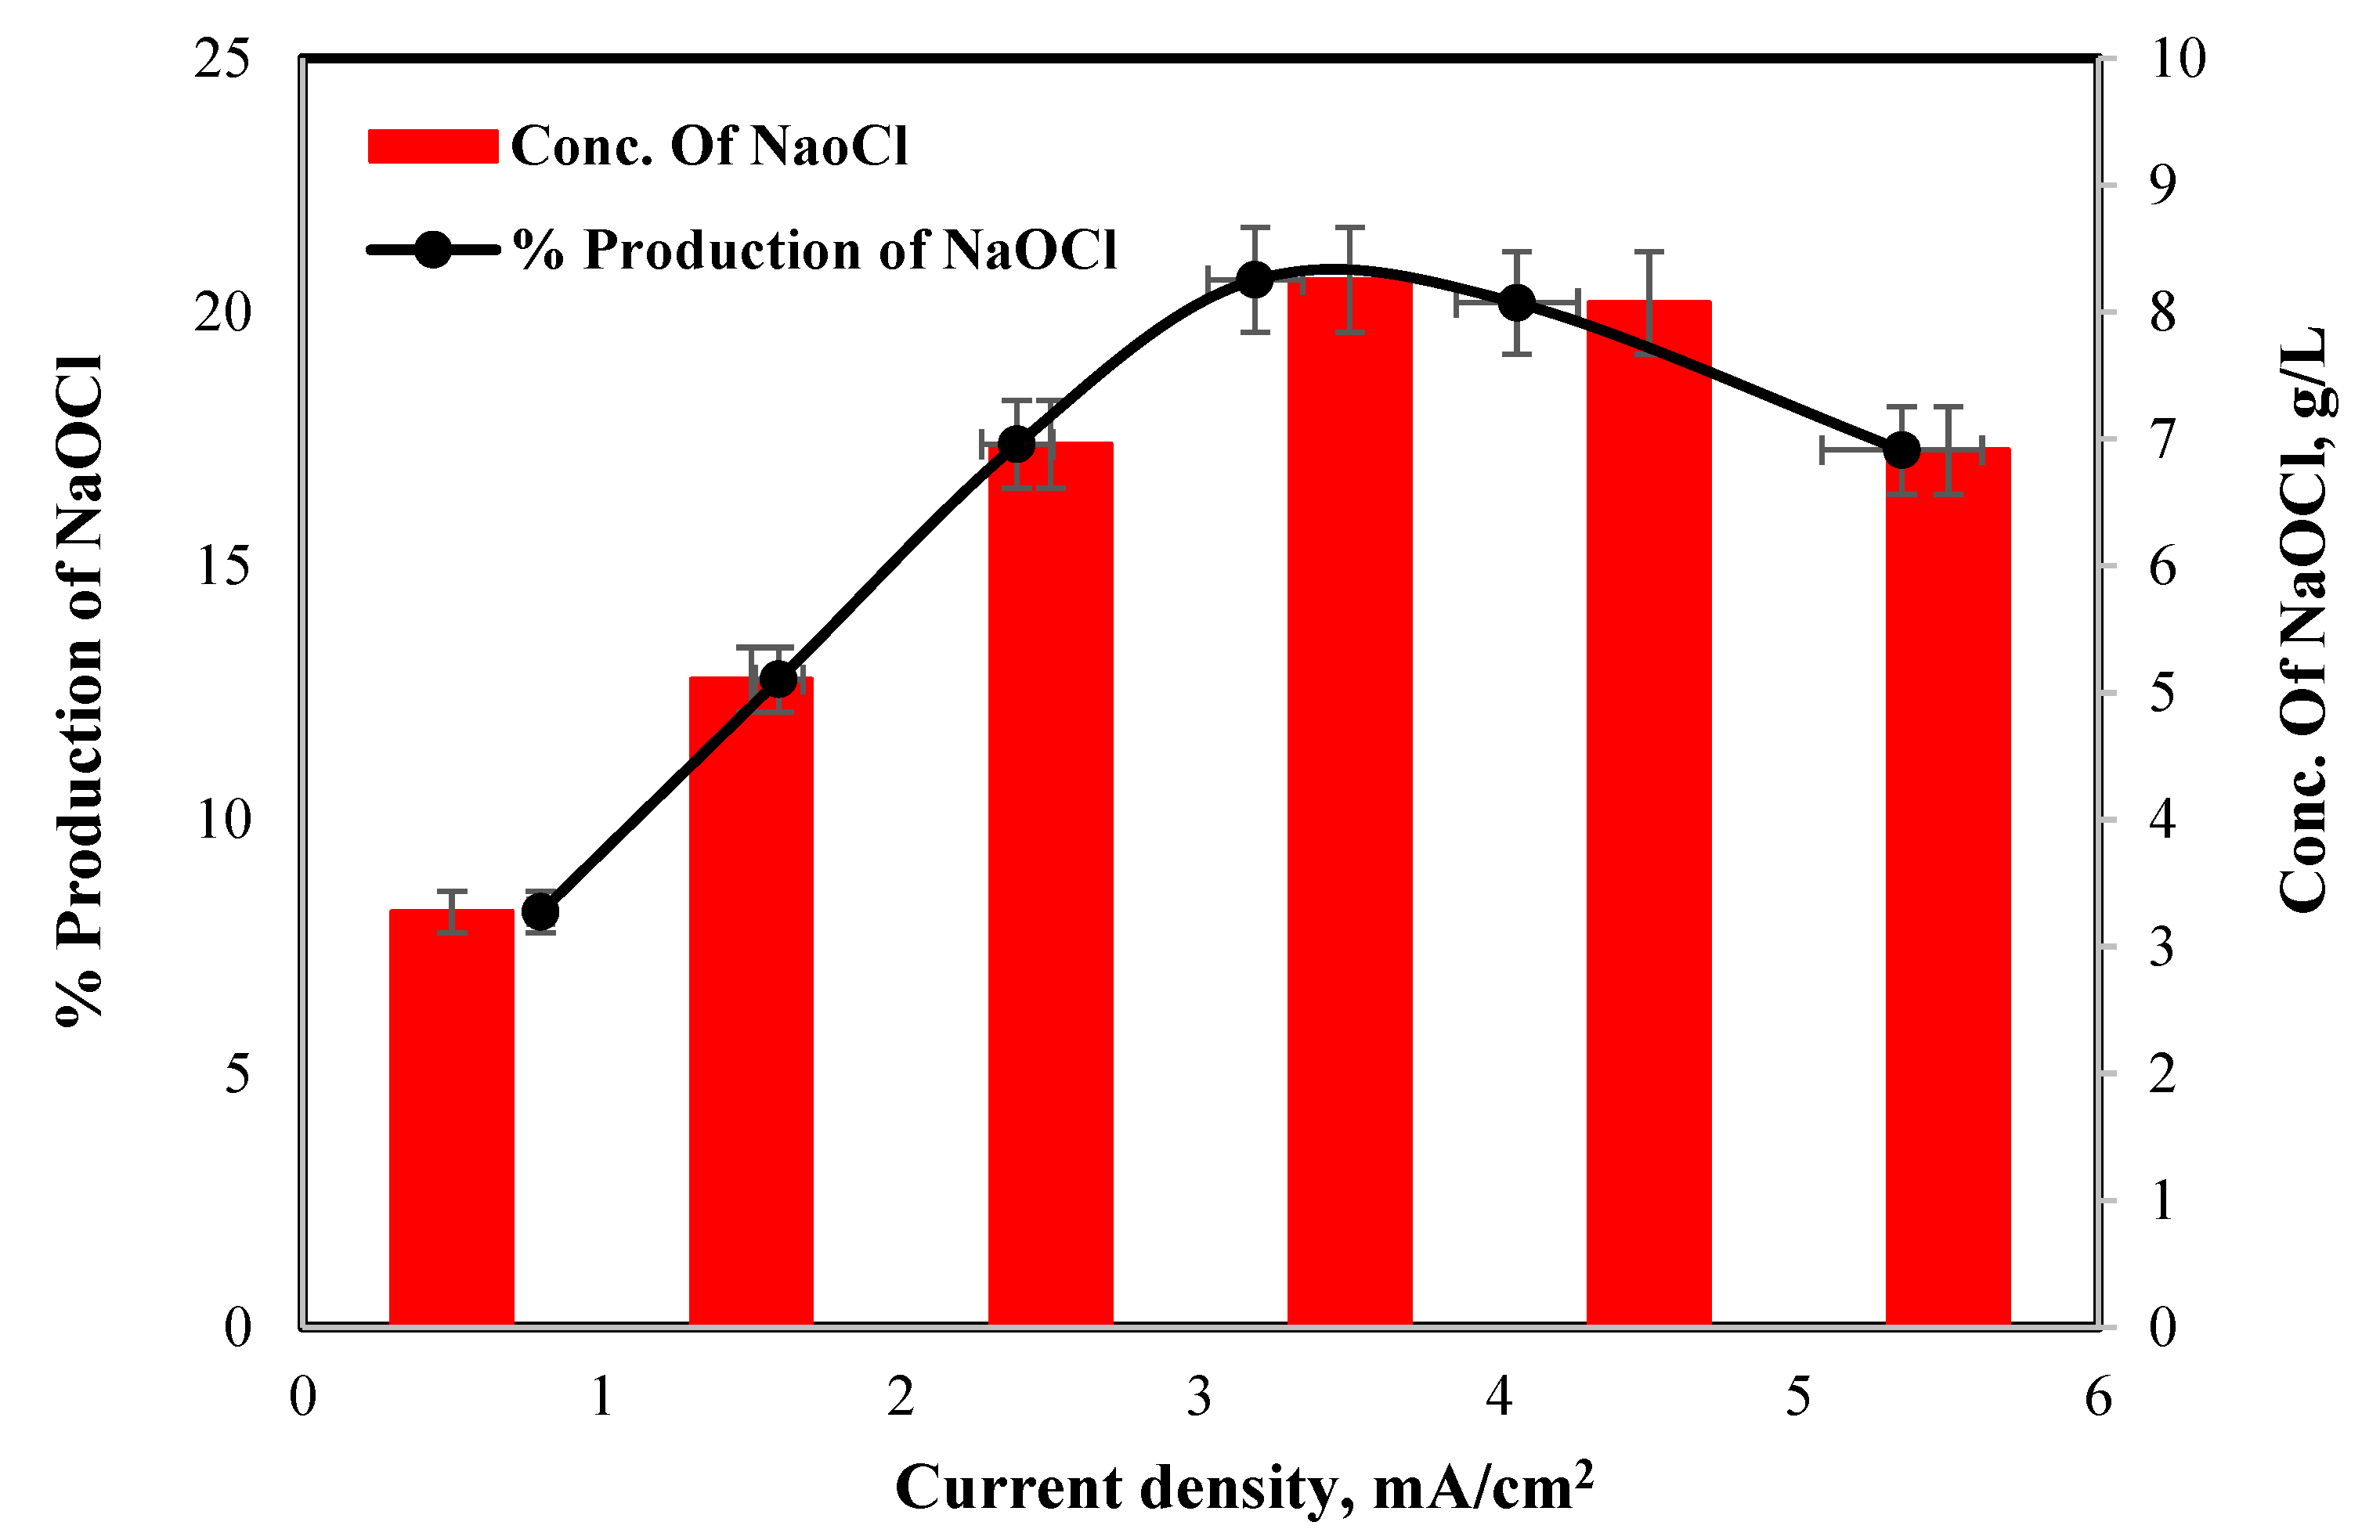
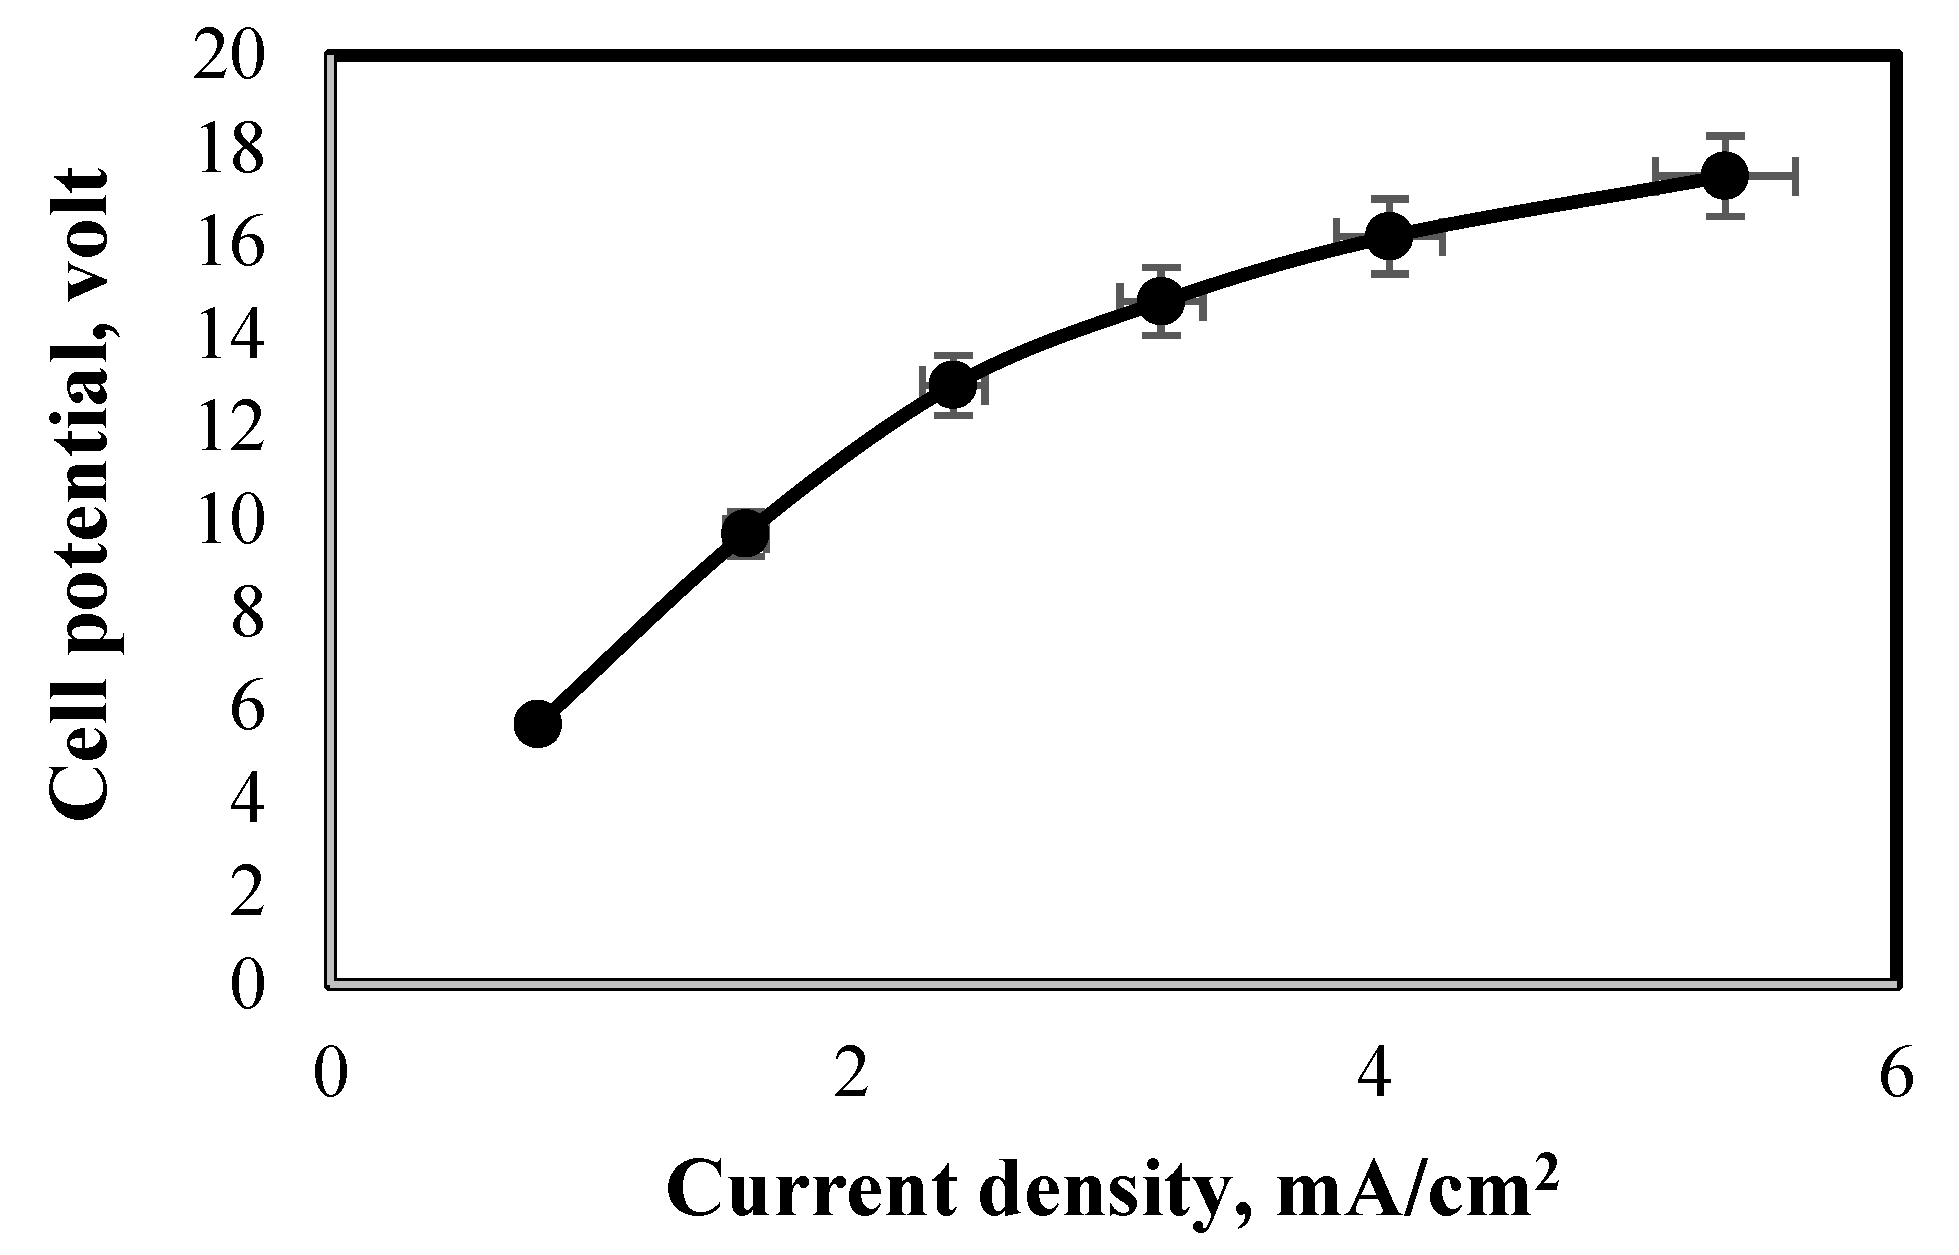
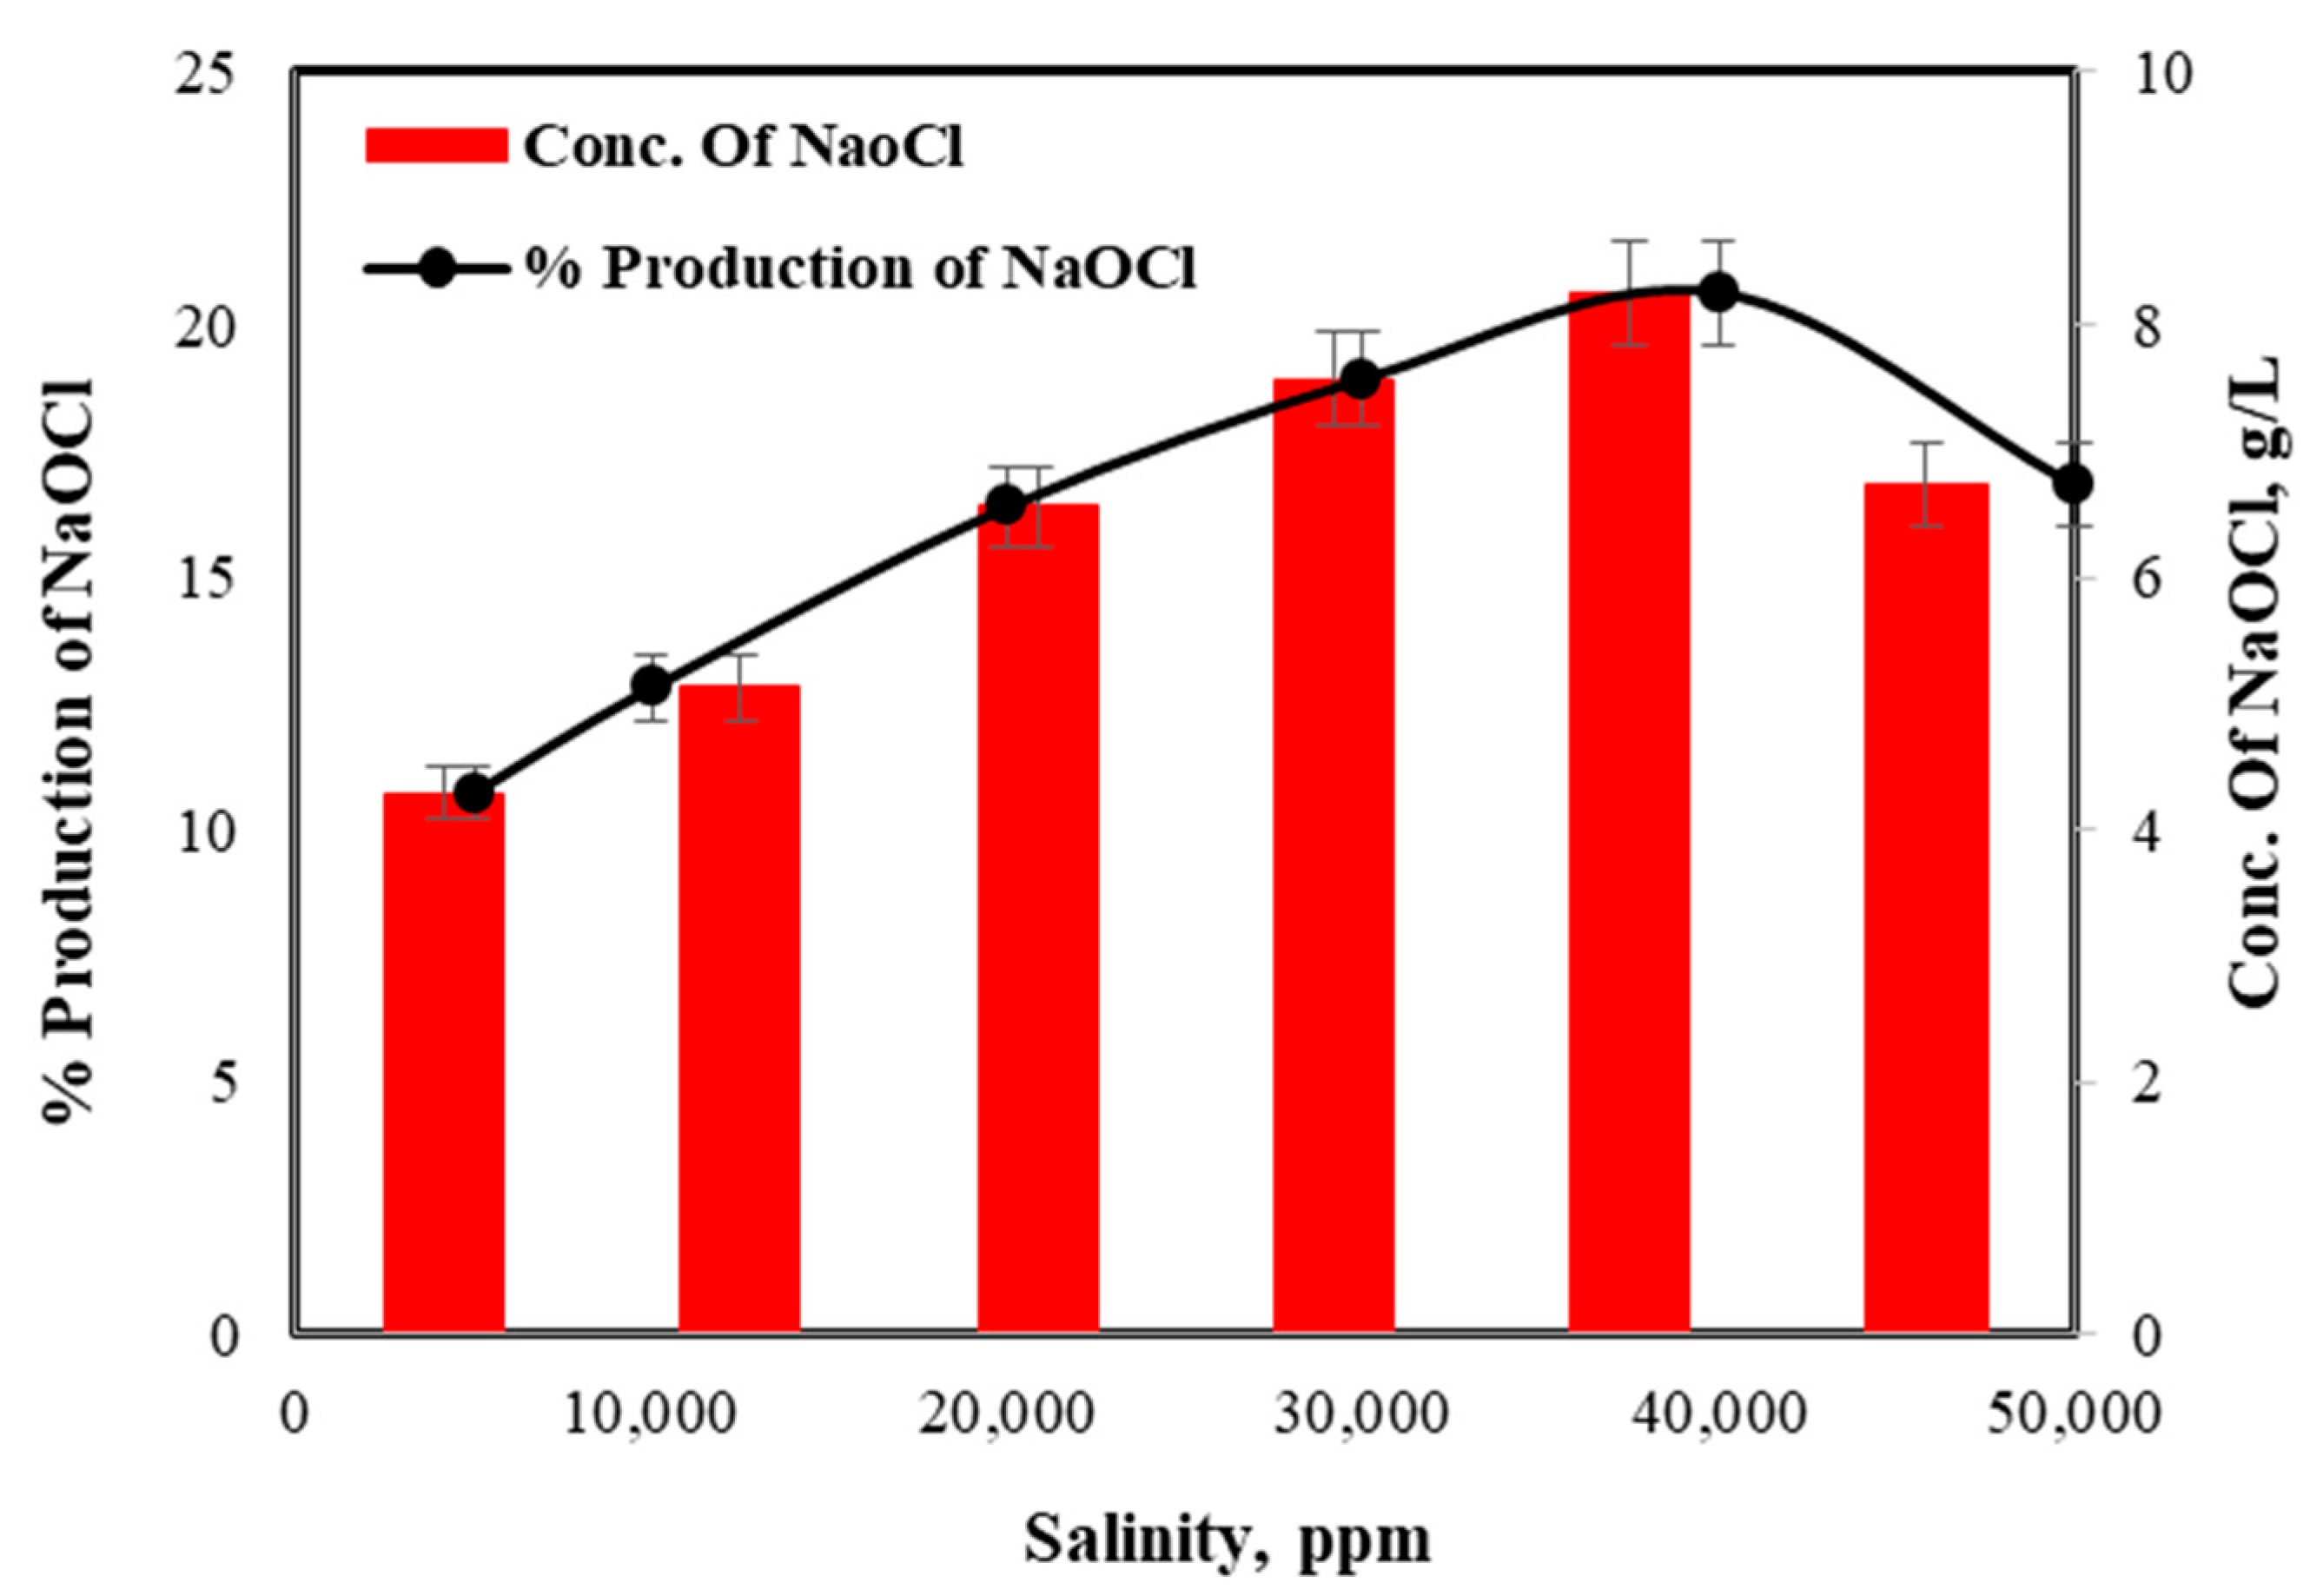
3.3. Influence of Current Density and Salinity on the Produced NaOCl Concentration

The influence of the current density on NaOCl concentration is presented in Figure 6. This set of experiments was accomplished at a feed flow rate of 4.5 mL/min, 40,000 ppm salinity, 0.5 cm inert electrode spacing, and 20 min electrolysis time. The results revealed that when the current density increases up to 3.18 mA/cm2, the NaOCl concentration increases at the same flow rate [35,36]. This is due to the anodic oxidation of salty water on the graphite granule surface, which is considered a direct electro-oxidation process, and the result of this process is the hydroxyl radical group that is considered a powerful oxidant. Nevertheless, chloro-hydroxyl radicals are also generated on the anode surface, and the reactions between water molecules, hydroxyl radicals, and chloro-hydroxyl radicals near any anode surface can yield a valuable product such as hypochlorite. Hypochlorite ions are reacted with sodium ions to produce sodium hypochlorite in the effluent. There is no obvious change in NaOCl concentration (8.2 g/L) at 4.05 mA/cm2 current density. Increasing the applied current density beyond 4.05 mA/cm2 decreased the NaOCl concentration. This is a result of the increase in cell temperature (above 35 °C) with an increase in current density as the decomposition of sodium hypochlorite to sodium chlorate occurs [13]. From the results, the current density of 3.18 mA/cm2 was acquired to be more suitable for producing the maximum NaOCl concentration (8.2 g/L). The optimal value of the current density should be utilized for effective production at the lowest cost because the current density is directly connected to the production cost [37]. For that reason, the results obtained from Figure 6 demonstrate that the current density of 3.18 mA/cm2 is a rational value for the effective production of sodium hypochlorite. One of the most significant factors affecting the use of the electrochemical technique is the processing cost. Since the processing cost is a conclusive subject in the industry, the influence of current density on the cost was inspected. In addition to the cost of the electrode and other accessories of the cell, the major operating cost is the power consumption during the operation of the electrochemical process. The electric power consumption in the process (0.0137 kwh) can be estimated by the following equation with the optimal processing factors [38]:
Electric   power   consumption   ( kwh ) = = I . t . U 1000   V
where I = current intensity (A), t = time (h), V = seawater solution volume (L), and U = applied voltage (volt). Consequently, it is important to select the best applied current density to realize economic operation. The essential driving force of the system is the electrical potential; each time the voltage rises, the electric current passing through the system also increases and causes the current density to increase at the same time [39]. The current density is greatly influenced by the electric potential. Increasing the voltage and increasing the current density improved the sodium hypochlorite production rate, as noticed in Figure 7.
Figure 8 exhibits the influence of salinity on sodium hypochlorite production. The results revealed that with a current density of 3.18 mA/cm2, electrolysis time of 20 min, 0.5 cm inert electrode spacing, and flow rate of 4.5 mL/min as the operating parameters, when the salt concentration increased, the sodium hypochlorite concentration increased, reaching its maximum value of 8.2 g/L at a salt concentration of 40,000 ppm. It is noticed that above this salt concentration, the NaOCl concentration reduces. Therefore, a salt concentration of 40,000 ppm is considered the optimal concentration, as the NaOCl concentration drops above this. This reduction in NaOCl concentration for elevated salt concentrations could be due to the fact that all the chloride ions existing in the solution were not converted to hypochlorite. This can also be elucidated by a salt concentration of more than 40,000 ppm; the potential of the cell reduces as the electrical energy supplied by the DC supply power is inadequate to oxidize the chloride ions in the solution. Similarly, this observation can also be explained by the solution being very saturated, leading to salt deposition on the surface of the electrode, which reduces its active area.

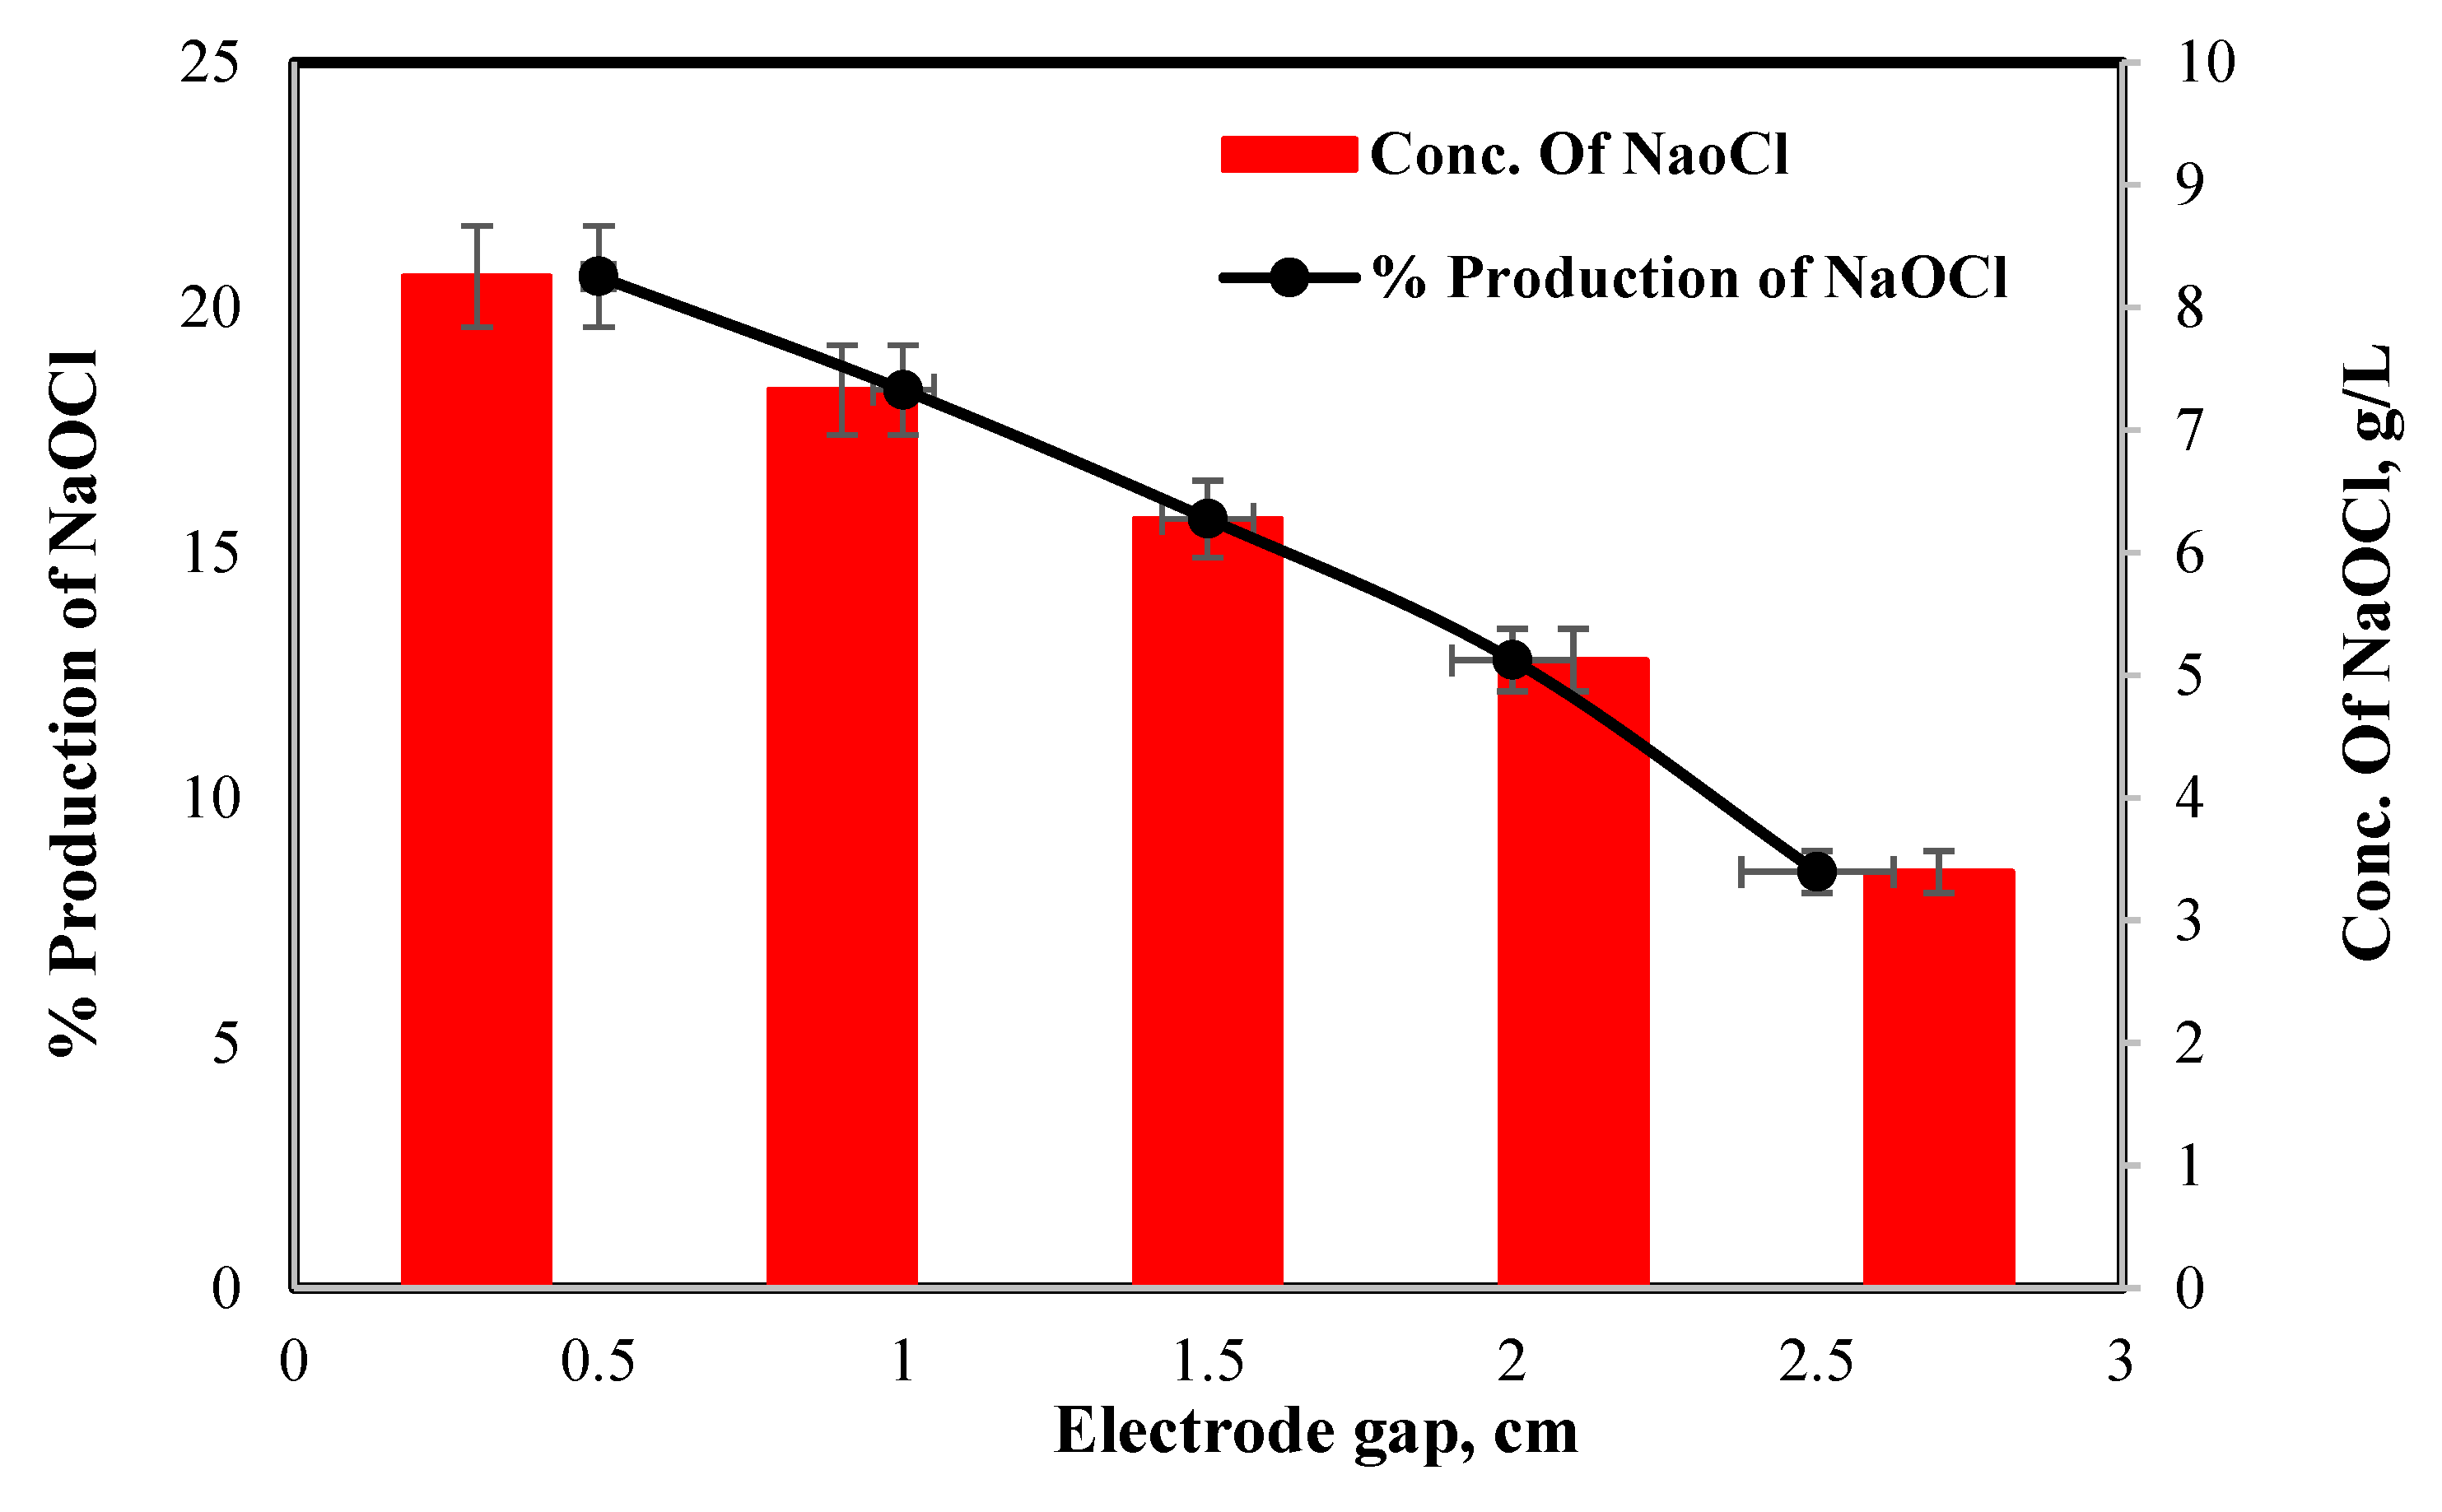
3.4. Influence of Inter-Electrode Spacing on NaOCl Concentration in the Effluent

Because it affects efficiency and the cost of production, inter-electrode spacing is crucial in the electrochemical process. The influence of spacing across both the anode and cathode on the generation of NaOCl can be observed in Figure 9. This experiment was performed at a feed flow rate of 4.5 mL/min, 40,000 ppm salinity, 3.18 mA/cm2, and 20 min electrolysis time. When the inter-electrode distance increased to 0.5 cm, the NaOCl concentration decreased. This finding may be explained by the hypothesis that proximity between the anode and cathode, which lowers the ohmic potential drop and boosts the cell’s current density, should encourage the conversion of chloride ions into hypochlorite. An inter-electrode separation of 10 mm was attained by Ghalwa et al. [40]. They noticed that the active chlorine concentration was high for close distances but decreased for ranges greater than 20 mm. The equation R = L/γs, where γ is the conductivity, L is the space across the electrodes, and S is the size of the electrodes, yields resistance (R). The ohmic potential drop (U) in the electrochemical reactor will be substantial and is determined by the equation U = R.I., if the electrode separation is large. According to the following formula, energy (W) is related to current intensity and time (t): W = U.I.t. This indicates that as the ohmic drop rises, so does the power usage. The main drawback of this energy usage is the rise in the cost of producing sodium hypochlorite [41]. The optimal amounts of generated NaOCl were thus reached at a 0.5 cm interspacing.
From previous results, it can be deduced that the optimum processing factors illustrated in Table 4 were the flow rate (4.5 mL/min), current density (3.18 m A/cm2), 0.5 cm inert electrode spacing, and 40,000 ppm salinity, with 20 min (steady state) as an optimum treatment time. A comparison was made between the quality of the product (NaOCl) using the proposed cell and its concentration ratio (20%) with the concentration ratio of commercial NaOCl (approximately 8–12%), which proved the quality of proposed cell at optimum operating conditions and thus the quality of the product (NaOCl) and its concentration ratio.

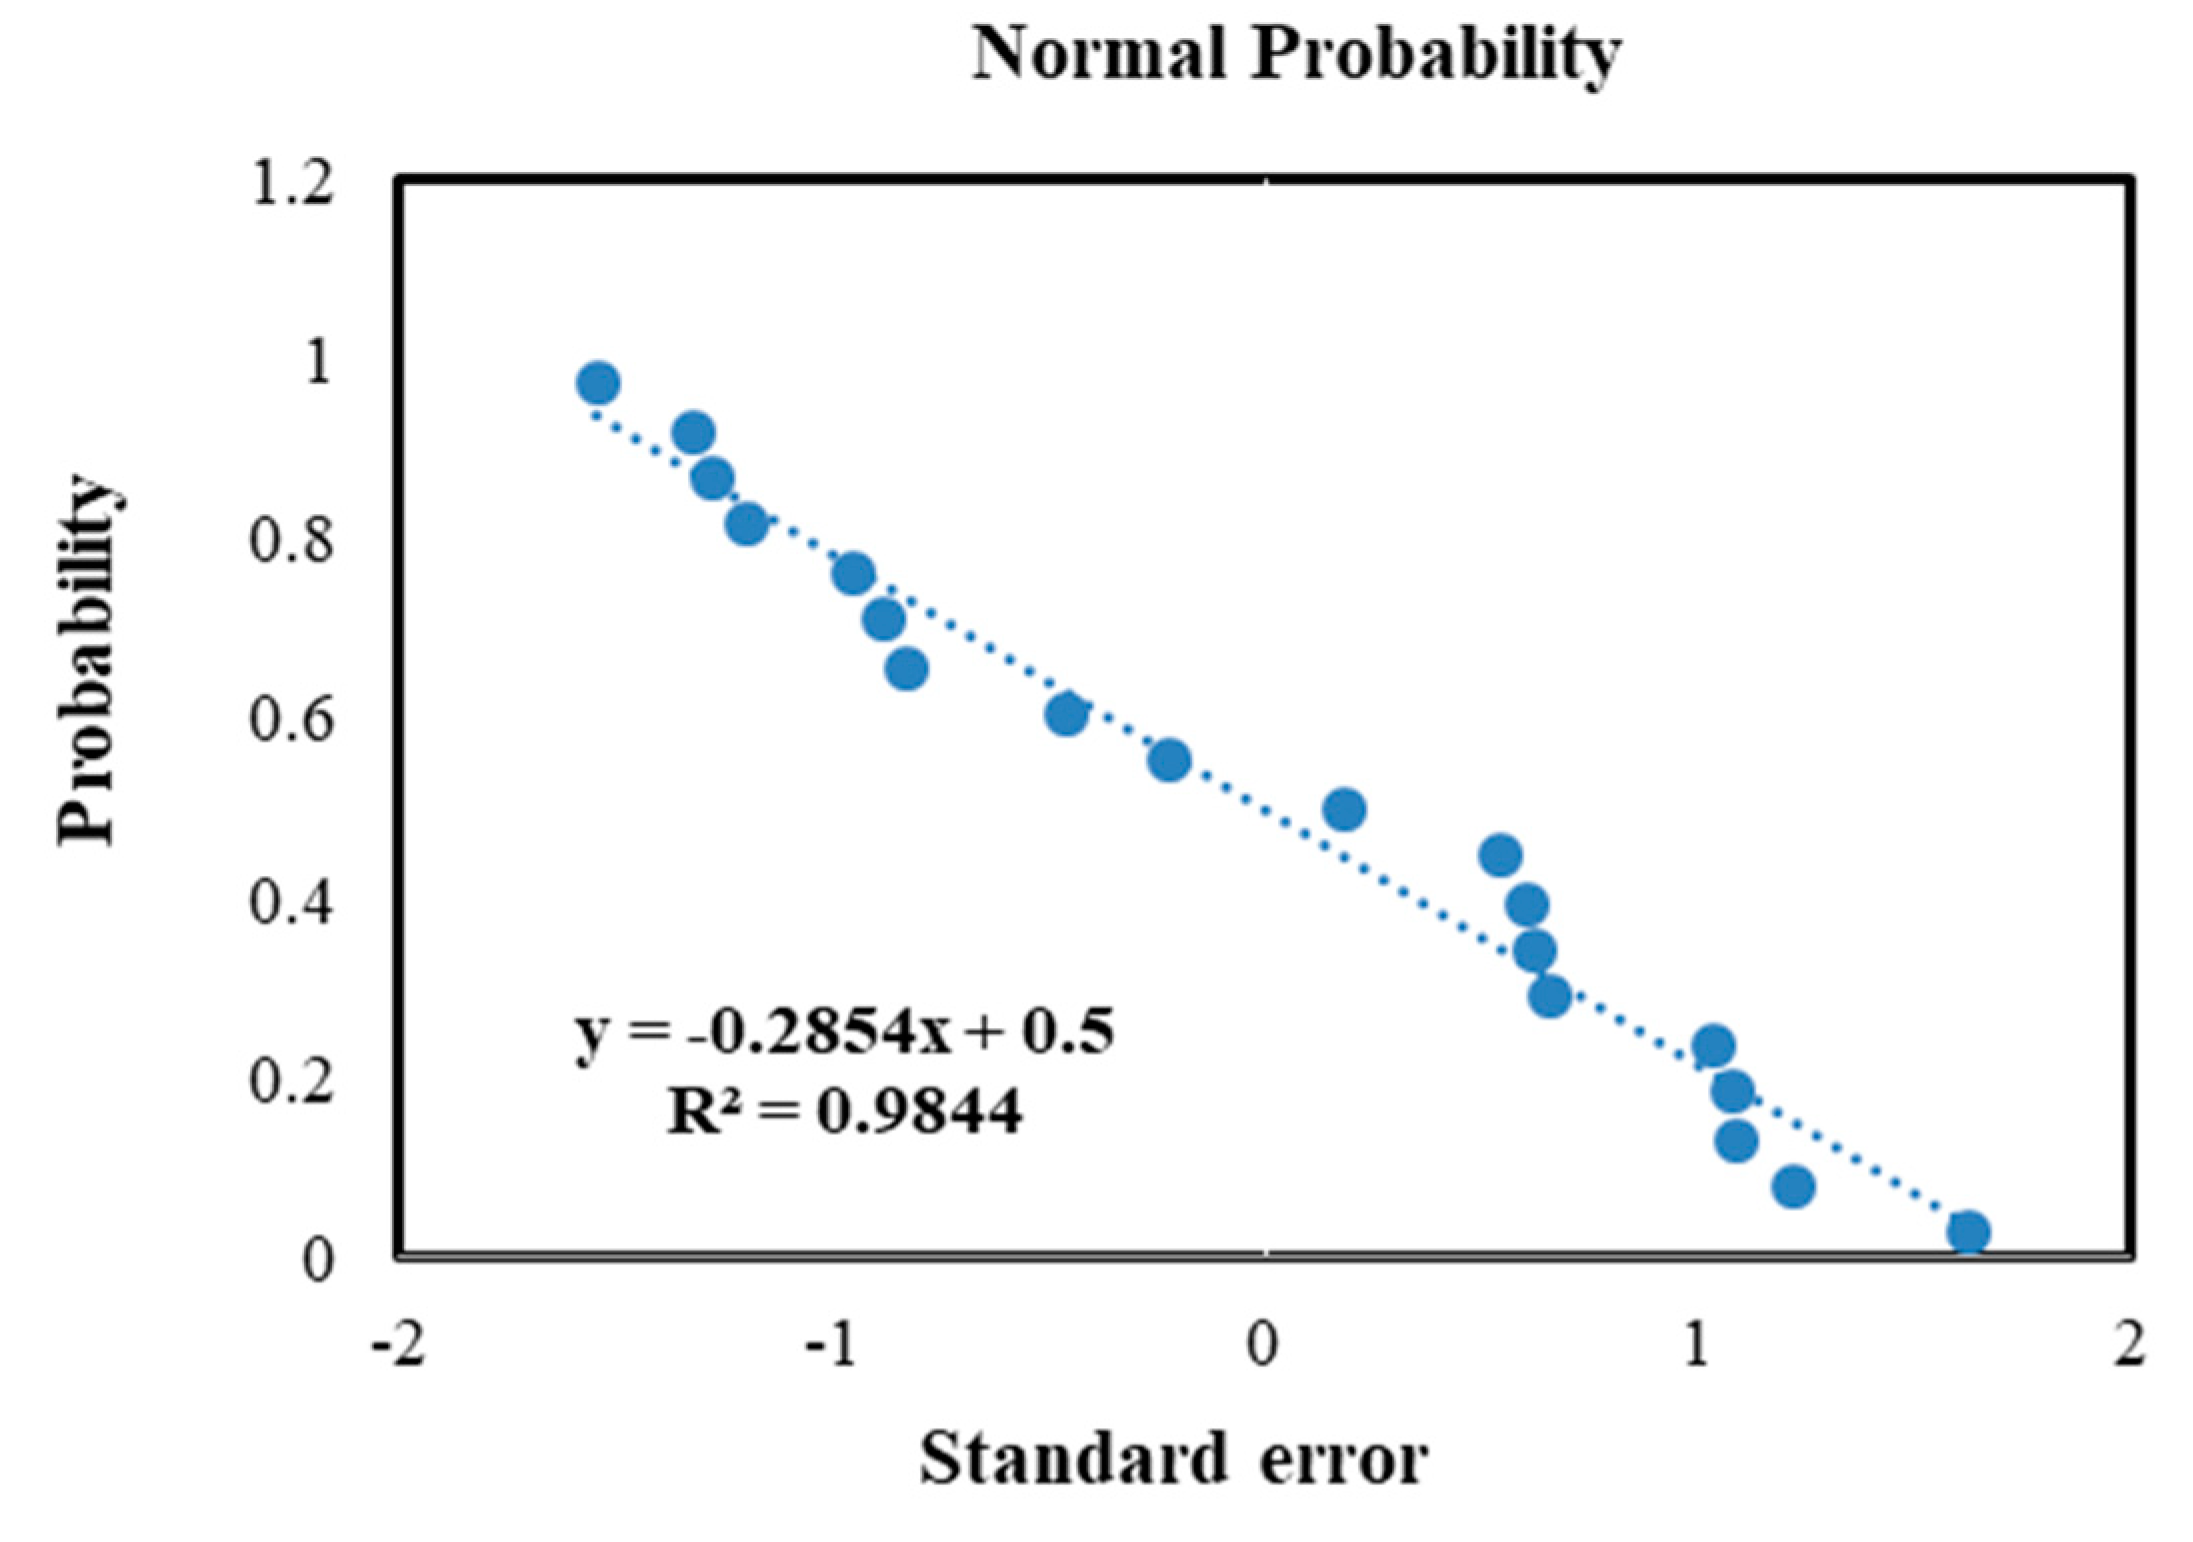
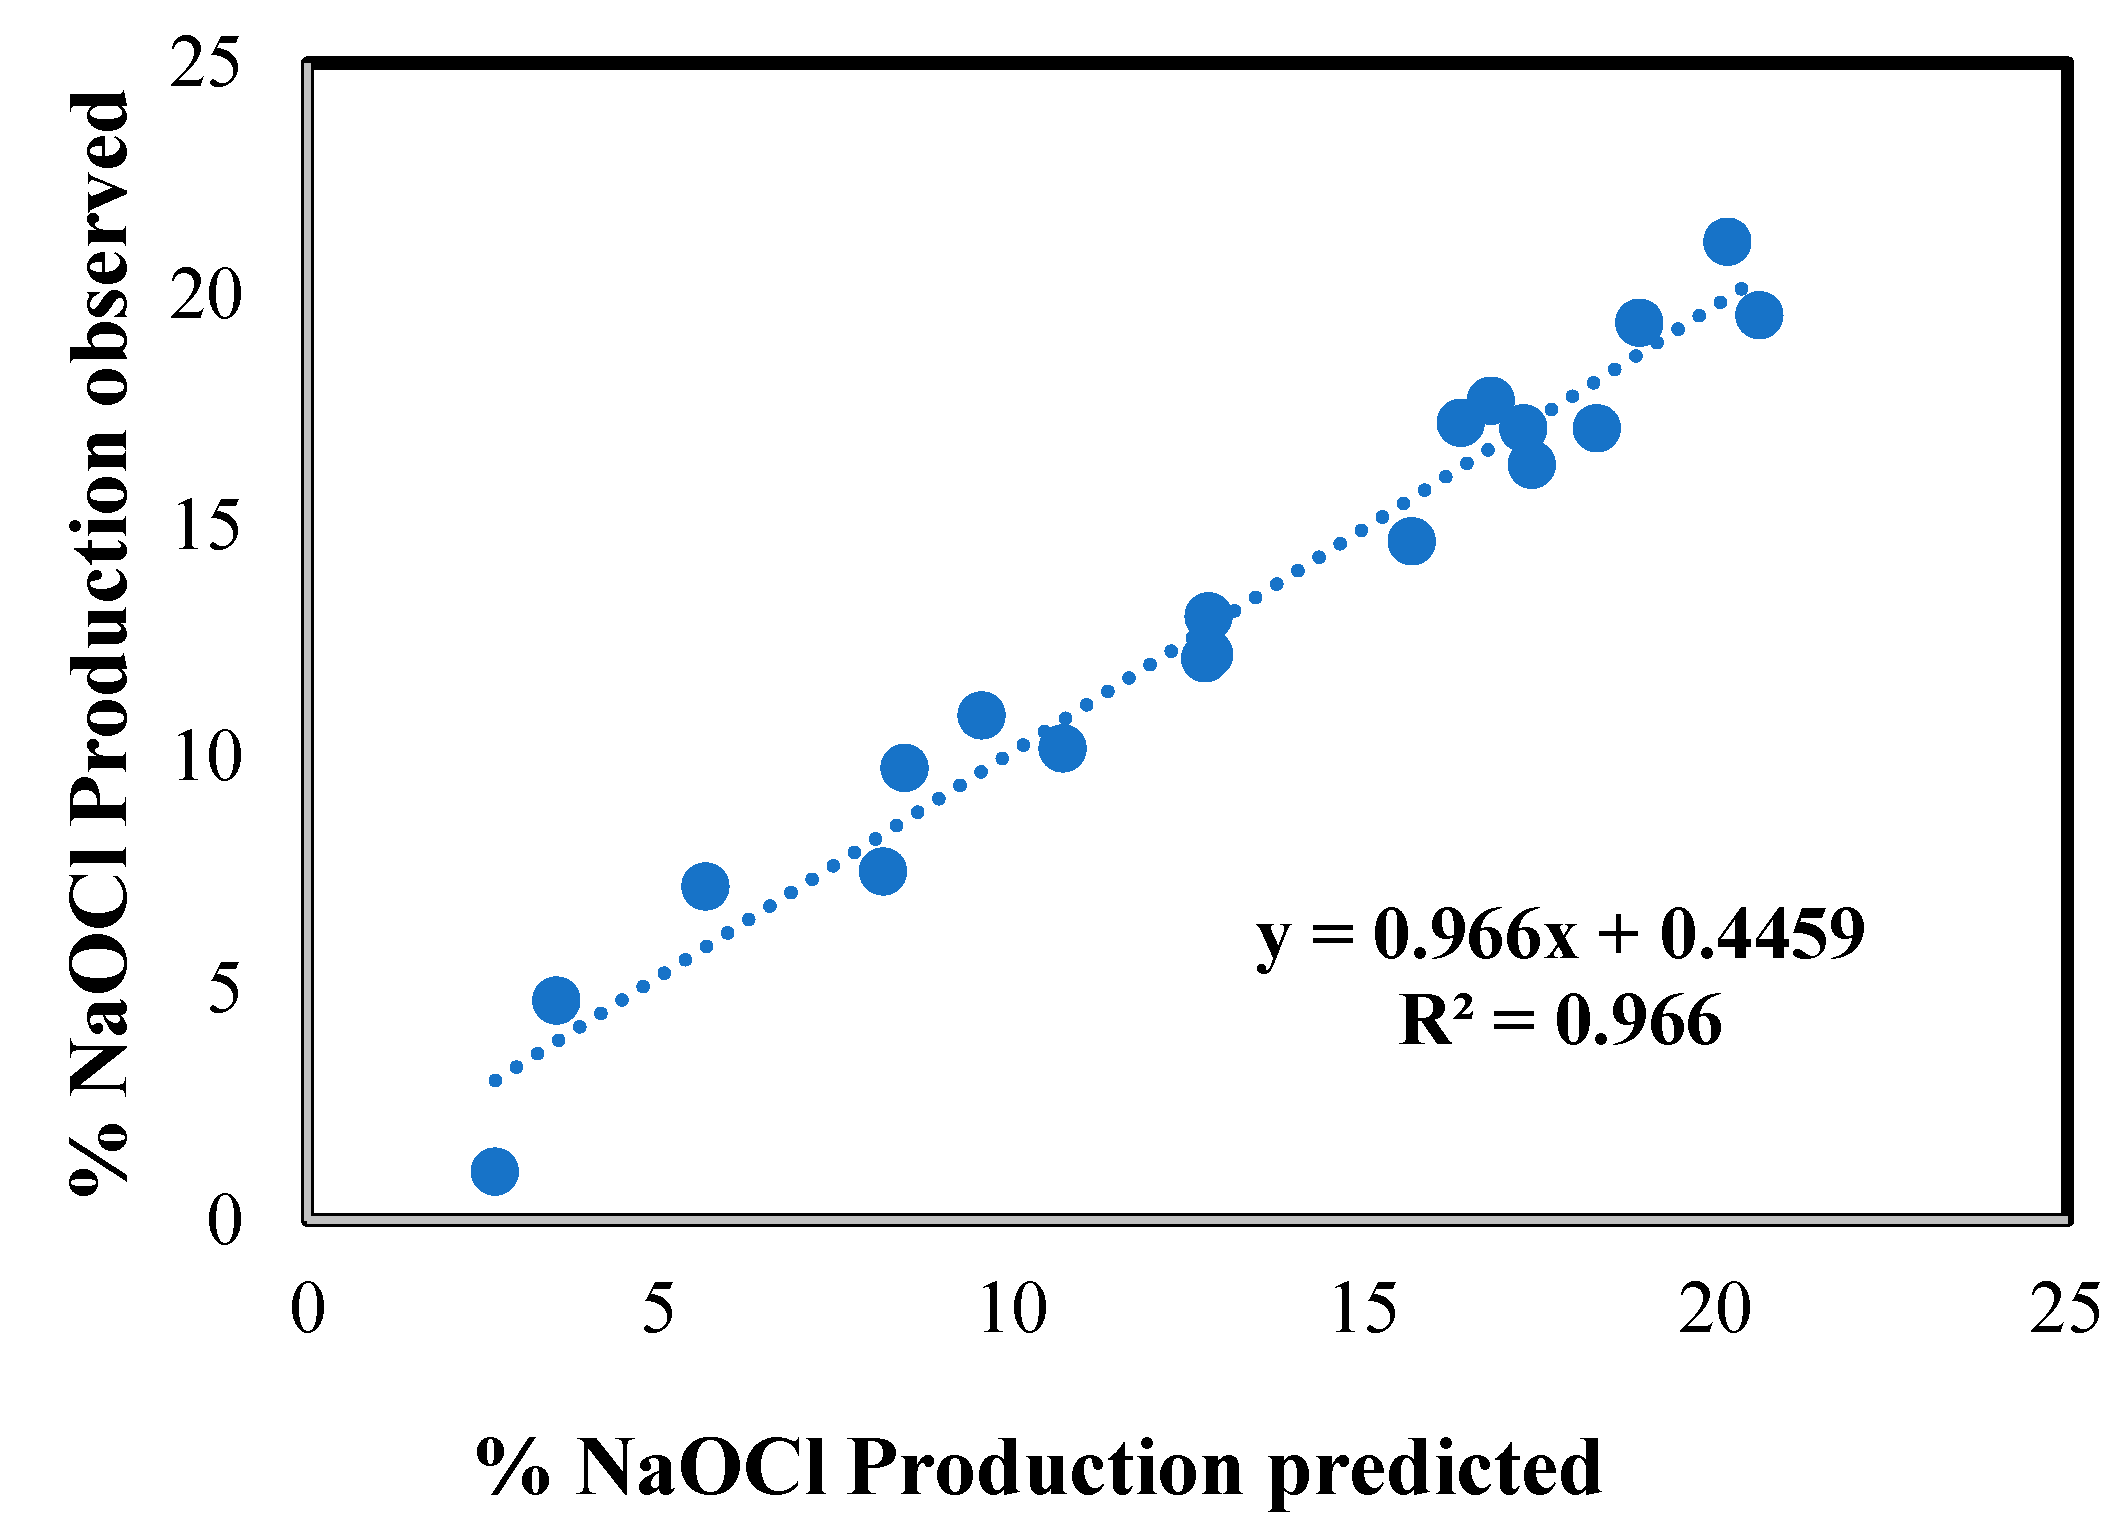
4. Statistical Analysis

To elucidate the impact of the processing factors on NaOCl production %, a mathematical correlation must be submitted. Based on the aforementioned results, % NaOCl production = f (feed flow rate, current density, salinity, and electrode gap). To acquire a correlation that explicitly expresses the influence of all these operating variables on % NaOCl production, a nonlinear statistical and least square multivariate regression technique was used.
% NaOCl production = bo + b1 (F.R) + b2 (C.D) + b3 (S) + b4 (E.G) + ε
where bo to b4 are the correlation coefficients; F.R, C.D, S, and E.G are flow rate, current density (mA/cm2), salinity (ppm), and electrode gap (cm), respectively; and ε is the error, which is the difference between the detected experimental values and the correlation expectation values. Table 5 elucidates the values and p-values of the correlation coefficients. All the p-values are less than 0.001, which indicates that each term of the correlation is significant. The ensuing correlation is:
% NaOCl production = −6.229 − 273.995 F.R + 5.955 C.D + 0.00072 S − 4.889 E.G − 0.0215 C.D4 − 1.005 S2
The normalized probability of the standard residuals and the mean of correlation errors is equal to zero, as exhibited in Figure 10. The linear distribution of the residual errors shows that the errors are normally distributed, indicating that the model anticipations are not influenced. Figure 11 exhibits that the acquired correlation is comparatively predictive of the detected values of % NaOCl production.

5. Comparison between Proposed Electrochemical Cell Using Flow-by Porous Graphite Electrode and Traditional Electrochemical Technologies

Table 6 exhibits the comparison between electrochemical cells applied in this study and other types of electrochemical cells applied in other research. It is obvious that there are different results due to differences in electrode materials used for the anode and cathode, as well as cell design, operating conditions, and system type. This comparison was made using various factors such as the electrode material used for the anode and cathode, along with the current density, NaOCl concentration, and electrolysis time (h).
The results demonstrate that the electrochemical cell applied in this study can produce sodium hypochlorite from salty wastewater with higher concentrations at a lower current (power) compared to other methods. This is due to the graphite granules used as anodes with a high surface area per unit volume compared to other planar electrode types. On the other hand, this cell also has a shorter electrolysis time compared to the ceramic membrane (Na3Zr2Si2POC)12 method, which needs 74 h [19]. The results also demonstrate that this cell had the second-best sodium hypochlorite concentration in the effluent after RuO on Ti as the anode and stainless steel as the cathode, but it is better than this method in terms of the current needed (power) [19]. Ultimately, this cell is economical in energy, operation time, and product concentration. The results also demonstrate that the production of sodium hypochlorite was achieved at a higher concentration (approximately 20%) than the concentrations of commercial sodium hypochlorite (approximately 8–12%).

6. Conclusions

This study aimed to develop a continuous flow system for producing sodium hypochlorite from salty wastewater in Egypt. The experimental setup utilized a bench-scale electrochemical cell with porous graphite electrodes as the anode material. The study investigated the impact of various parameters, such as flow rate, salt concentration, inert electrode spacing, and current density, on the production of sodium hypochlorite. The results revealed that increasing the applied current density and salt concentration, as well as decreasing the salty wastewater flow rate, led to a higher yield of sodium hypochlorite. The most optimal conditions for maximum sodium hypochlorite yield (20.6%) were observed at a 4.5 mL/min flow rate, 3.183 mA/cm2 applied current density, 0.5 cm inert electrode spacing, and 40,000 ppm salinity, with a power consumption of 0.0137 Kwh for 20 min. The use of flow-by porous electrodes proved to be highly effective in producing sodium hypochlorite from seawater, and the proposed electrochemical cell demonstrated superior performance in terms of energy and operation time, as well as product concentration, compared to other methods, and a commercial sodium hypochlorite concentration of approximately 8–12%. The study also generated a statistical and least square multivariate regression technique to predict the % NaOCl production, with an achieved correlation R2 of 98.4%. The ensuing correlation is:
% NaOCl production = −6.229 − 273.995 F.R + 5.955 C.D + 0.00072 S − 4.889 E.G − 0.0215 C.D4 − 1.005 S2

Author Contributions

Conceptualization, G.K.H.; Methodology, A.A.A. and G.K.H.; Software, R.M.M.; Validation, G.K.H., R.M.K., J.D., J.M. (Joanna Majtacz), J.M. (Jacek Mąkinia) and H.A.E.-G.; Formal analysis, A.A.A.; Investigation, A.A.A., G.K.H., R.M.K., R.M.M. and H.A.E.-G.; Resources, J.D. and J.M. (Joanna Majtacz); Data curation, G.K.H., H.E.A.-H. and H.A.E.-G.; Writing—original draft, A.A.A., G.K.H. and H.A.E.-G.; Writing—review and editing, A.A.A., G.K.H., R.M.M., J.D., J.M. (Joanna Majtacz), J.M. (Jacek Mąkinia) and H.A.E.-G.; Visualization, G.K.H.; Supervision, J.M. (Jacek Mąkinia). All authors have read and agreed to the published version of the manuscript.

Funding

This research received no external funding.

Data Availability Statement

Data sharing is not applicable to this article as no datasets were generated or analyzed in the current study.

Acknowledgments

The authors thank the Canal Higher Institute of Engineering and Technology, Chemical Engineering Department, Suez, Egypt, for financial support and National Research Centre, Dokki, Egypt for technical support.

Conflicts of Interest

The authors declare no conflict of interest.

References

  1. Al-Sayed, A.; Hellal, M.S.; Al-Shemy, M.T.; Hassan, G.K. Performance Evaluation of Submerged Membrane Bioreactor for Municipal Wastewater Treatment: Experimental Study and Model Validation with GPS-X Software Simulator. Water Environ. J. 2023; online ahead of print. [Google Scholar] [CrossRef]
  2. Tawfik, A.; Al-Sayed, A.; Hassan, G.K.; Nasr, M.; El-Shafai, S.A.; Alhajeri, N.S.; Khan, M.S.; Akhtar, M.S.; Ahmad, Z.; Rojas, P. Electron Donor Addition for Stimulating the Microbial Degradation of 1, 4 Dioxane by Sequential Batch Membrane Bioreactor: A Techno-Economic Approach. Chemosphere 2022, 306, 135580. [Google Scholar] [CrossRef] [PubMed]
  3. El-Qelish, M.; Hassan, G.K.; Leaper, S.; Dessì, P.; Abdel-Karim, A. Membrane-Based Technologies for Biohydrogen Production: A Review. J. Environ. Manag. 2022, 316, 115239. [Google Scholar] [CrossRef]
  4. Ding, J.; Wang, S.; Xie, P.; Zou, Y.; Wan, Y.; Chen, Y.; Wiesner, M.R. Chemical Cleaning of Algae-Fouled Ultrafiltration (UF) Membrane by Sodium Hypochlorite (NaClO): Characterization of Membrane and Formation of Halogenated by-Products. J. Membr. Sci. 2020, 598, 117662. [Google Scholar] [CrossRef]
  5. Al-Hazmi, H.E.; Shokrani, H.; Shokrani, A.; Jabbour, K.; Abida, O.; Khadem, S.S.M.; Habibzadeh, S.; Sonawane, S.H.; Saeb, M.R.; Bonilla-Petriciolet, A. Recent Advances in Aqueous Virus Removal Technologies. Chemosphere 2022, 305, 135441. [Google Scholar] [CrossRef]
  6. Henwood, A.F. Coronavirus Disinfection in Histopathology. J. Histotechnol. 2020, 43, 102–104. [Google Scholar] [CrossRef] [Green Version]
  7. Gebendorfer, K.M.; Drazic, A.; Le, Y.; Gundlach, J.; Bepperling, A.; Kastenmüller, A.; Ganzinger, K.A.; Braun, N.; Franzmann, T.M.; Winter, J. Identification of a Hypochlorite-Specific Transcription Factor from Escherichia coli. J. Biol. Chem. 2012, 287, 6892–6903. [Google Scholar] [CrossRef] [Green Version]
  8. Baert, L.; Vandekinderen, I.; Devlieghere, F.; Van Coillie, E.; Debevere, J.; Uyttendaele, M. Efficacy of Sodium Hypochlorite and Peroxyacetic Acid to Reduce Murine Norovirus 1, B40-8, Listeria Monocytogenes, and Escherichia Coli O157: H7 on Shredded Iceberg Lettuce and in Residual Wash Water. J. Food Prot. 2009, 72, 1047–1054. [Google Scholar] [CrossRef]
  9. Slaughter, R.J.; Watts, M.; Vale, J.A.; Grieve, J.R.; Schep, L.J. The Clinical Toxicology of Sodium Hypochlorite. Clin. Toxicol. 2019, 57, 303–311. [Google Scholar] [CrossRef]
  10. Young, S.B.; Setlow, P. Mechanisms of Killing of Bacillus Subtilis Spores by Hypochlorite and Chlorine Dioxide. J. Appl. Microbiol. 2003, 95, 54–67. [Google Scholar] [CrossRef]
  11. Wang, J.; Shen, J.; Ye, D.; Yan, X.; Zhang, Y.; Yang, W.; Li, X.; Wang, J.; Zhang, L.; Pan, L. Disinfection Technology of Hospital Wastes and Wastewater: Suggestions for Disinfection Strategy during Coronavirus Disease 2019 (COVID-19) Pandemic in China. Environ. Pollut. 2020, 262, 114665. [Google Scholar] [CrossRef]
  12. Yang, X.; Shen, Q.; Guo, W.; Peng, J.; Liang, Y. Precursors and Nitrogen Origins of Trichloronitromethane and Dichloroacetonitrile during Chlorination/Chloramination. Chemosphere 2012, 88, 25–32. [Google Scholar] [CrossRef]
  13. Asokan, K.; Subramanian, K. Design of a Tank Electrolyser for In-Situ Generation of NaClO. In Proceedings of the World Congress on Engineering and Computer Science, London, UK, 3–5 July 2009; Volume 1, pp. 139–142. [Google Scholar]
  14. Zhu, J.; Ba, X.; Guo, X.; Zhang, Q.; Qi, Y.; Li, Y.; Wang, J.; Sun, H.; Jiang, B. Oxychlorides Induced Over-Evaluation of Electrochemical COD Removal Performance over Dimensionally Stable Anode (DSA): The Roles of Cathode Materials. Sep. Purif. Technol. 2022, 303, 122197. [Google Scholar] [CrossRef]
  15. Rajkumar, D.; Guk Kim, J.; Palanivelu, K. Indirect Electrochemical Oxidation of Phenol in the Presence of Chloride for Wastewater Treatment. Chem. Eng. Technol. Ind. Chem. Equip. Process Eng. 2005, 28, 98–105. [Google Scholar] [CrossRef]
  16. Elmaadawy, K.; Liu, B.; Hassan, G.K.; Wang, X.; Wang, Q.; Hu, J.; Hou, H.; Yang, J.; Wu, X. Microalgae-Assisted Fixed-Film Activated Sludge MFC for Landfill Leachate Treatment and Energy Recovery. Process Saf. Environ. Prot. 2022, 160, 221–231. [Google Scholar] [CrossRef]
  17. Hassan, G.K.; El-Gohary, F.A. Evaluation of Partial Nitritation/Anammox Process for Reduction of Pollutants from Sanitary Landfill Leachate. Water Air Soil Pollut. 2021, 232, 134. [Google Scholar] [CrossRef]
  18. Alvarado-Ávila, M.I.; Toledo-Carrillo, E.; Dutta, J. Cerium Oxide on a Fluorinated Carbon-Based Electrode as a Promising Catalyst for Hypochlorite Production. ACS Omega 2022, 7, 37465–37475. [Google Scholar] [CrossRef] [PubMed]
  19. Balagopal, S.; Malhotra, V.; Pendleton, J.; Reid, K.J. Electrolytic Process to Produce Sodium Hypochlorite Using Sodium Ion Conductive Ceramic Membranes. U.S. Patent No. 8,268,159, 18 September 2012. [Google Scholar]
  20. Altaf, A.; Noor, S.; Sharif, Q.M.; Najeebullah, M. Different Techniques Recently Used for the Treatment of Textile Dyeing Effluents: A Review. J. Chem. Soc. Pakistan 2010, 32, 115–116. [Google Scholar]
  21. Huang, L.; Huang, X.; Yan, J.; Liu, Y.; Jiang, H.; Zhang, H.; Tang, J.; Liu, Q. Research progresses on the application of perovskite in adsorption and photocatalytic removal of water pollutants. J. Hazard. Mater. 2022, 442, 130024. [Google Scholar] [CrossRef] [PubMed]
  22. Key, J.D.V. Development of a Small-Scale Electro-Chlorination System for Rural Water Supplies. Master’s Thesis, University of the Western Cape, Cape Town, South Africa, 2010. [Google Scholar]
  23. Abdel-Monem, N.M.; Abdel-Salam, O.E.; Nassar, A.F.; Mahmoud, M.H. Oxidation of Urea in Human Urine Using Flow-by Porous Graphite Electrode. Int. J. Sci. Eng. Res. 2013, 4, 1715–1723. [Google Scholar]
  24. Trainham, J.A.; Newman, J. A Comparison between Flow-through and Flow-by Porous Electrodes for Redox Energy Storage. Electrochim. Acta 1981, 26, 455–469. [Google Scholar] [CrossRef]
  25. Pathak, A.; Sharma, A.K.; Gupta, A.K. Dimensional Analysis of a Flow-by Porous Electrode and Demonstration to All-Vanadium Redox Flow Batteries Thereon. J. Energy Storage 2021, 44, 103258. [Google Scholar] [CrossRef]
  26. APHA. Standard, Methods for the Examination of Water and Wastewater; American Public Health Association: Washington, DC, USA, 2012. [Google Scholar]
  27. Abbar, A.H.; Sulaymon, A.H.; Mohammed, S.A.M. Mass Transfer Characteristics of a Flow-by Fixed Bed Electrochemical Reactor Composed of Vertical Stack Stainless Steel Screens Cathode. Heat Mass Transf. 2019, 55, 2419–2428. [Google Scholar] [CrossRef]
  28. Pletcher, D.; WHYTE, I.; Walsh, F.C.; Millington, J.P. Reticulated Vitreous Carbon Cathodes for Metal Ion Removal from Process Streams. III: Studies of a Single Pass Reactor. J. Appl. Electrochem. 1993, 23, 82–85. [Google Scholar] [CrossRef]
  29. Meseldzija, S.; Petrovic, J.; Onjia, A.; Volkov-Husovic, T.; Nesic, A.; Vukelic, N. Utilization of Agro-Industrial Waste for Removal of Copper Ions from Aqueous Solutions and Mining-Wastewater. J. Ind. Eng. Chem. 2019, 75, 246–252. [Google Scholar] [CrossRef]
  30. Adeyiga, A.A.; Hu, L.; Greer, T. Removal of Metal Ions from Wastewater with Natural Wastes. In Proceedings of the Sixth Annual Historically Black Colleges and Universities and Other Minority Institutions Symposium, Ocean City, MD, USA, 28–29 April 1998. [Google Scholar]
  31. Naderi, M.; Nasseri, S. Optimization of Free Chlorine, Electric and Current Efficiency in an Electrochemical Reactor for Water Disinfection Purposes by RSM. J. Environ. Health Sci. Eng. 2020, 18, 1343–1350. [Google Scholar] [CrossRef] [PubMed]
  32. Kamel, M.; El-Ashtoukhy, E.S.Z.; Abdel-Aziz, M.H.; Zahran, R.R.; Sedahmed, G.H.; El Gheriany, I. Effect of Additives and Electrode Roughness on the Production of Hypochlorite Sanitizer by the Electrolysis of NaCl Solution in a Batch Recycle Reactor. Chem. Eng. Process. Intensif. 2022, 176, 108959. [Google Scholar] [CrossRef]
  33. Hassan, G.K.; Al-Shemy, M.; Adel, A.M.; Al-Sayed, A. Boosting Brackish Water Treatment via Integration of Mesoporous γ-Al2O3NPs with Thin-Film Nanofiltration Membranes. Sci. Rep. 2022, 12, 19666. [Google Scholar] [CrossRef]
  34. Pohl, A. Removal of Heavy Metal Ions from Water and Wastewaters by Sulfur-Containing Precipitation Agents. Water Air Soil Pollut. 2020, 231, 503. [Google Scholar] [CrossRef]
  35. Sealey, S. Modern Chlor-Alkali Technology; Royal Society of Chemistry: London, UK, 1998; Volume 7, ISBN 0854047239. [Google Scholar]
  36. Slade, P.E. Handbook of Fiber Finish Technology; CRC Press: Boca Raton, FL, USA, 2018; ISBN 020371928X. [Google Scholar]
  37. Saleem, M.; Chakrabarti, M.H.; Hasan, D.B.; Islam, M.; Yusoff, R.; Hajimolana, S.A.; Hussain, M.A.; Khan, G.M.A.; Ali, B.S. On Site Electrochemical Production of Sodium Hypochlorite Disinfectant for a Power Plant Utilizing Seawater. Int. J. Electrochem. Sci. 2012, 7, 3929–3938. [Google Scholar]
  38. Saleem, M. Biofouling Management in the Cooling Circuit of a Power Industry Using Electrochemical Process. J. Chem. Soc. Pakistan 2011, 33, 295. [Google Scholar]
  39. Hsu, G.-S.W.; Lu, Y.-F.; Hsu, S.-Y. Effects of Electrolysis Time and Electric Potential on Chlorine Generation of Electrolyzed Deep Ocean Water. J. Food Drug Anal. 2017, 25, 759–765. [Google Scholar] [CrossRef] [Green Version]
  40. Ghalwa, N.A.; Tamos, H.; ElAskalni, M.; El Agha, A.R. Generation of Sodium Hypochlorite (NaOCl) from Sodium Chloride Solution Using C/PbO 2 and Pb/PbO 2 Electrodes. Int. J. Miner. Metall. Mater. 2012, 19, 561–566. [Google Scholar] [CrossRef]
  41. Doumbi, R.T.; Noumi, G.B.; Ngobtchok, B. Tannery Wastewater Treatment by Electro-Fenton and Electro-Persulfate Processes Using Graphite from Used Batteries as Free-Cost Electrode Materials. Case Stud. Chem. Environ. Eng. 2022, 5, 100190. [Google Scholar] [CrossRef]
  42. Rhees, R.C.; Behrens, R.E.; Reid, K.J.; Morgan, L.B. Method for Producing Chlorine or Hypochlorite Product; Royal Society of Chemistry: London, UK, 1997. [Google Scholar]
Figure 1. Schematic diagram of an electrolyzing seawater mechanism to produce sodium hypochlorite.
Energies 16 04754 g001
Figure 2. Electrochemical cell for the treatment of salty water using a flow-by electrode. 1. Feed inlet; 2. Outlet; 3. Rod (D = 0.8 cm) anode current collector; 4. Rod (D = 0.8 cm) cathode current collector; 5. Gas vent; 6. Graphite (granules); 7. Cylindrical tube made of UPVC; 8. Support; 9. Graphite feed inlet; 10. Metal screen; 11. Plexiglas.
Energies 16 04754 g002
Figure 3. Scan analysis for graphite granules (electrode material) P1.
Energies 16 04754 g003
Figure 4. Influence of feed flow rate on NaOCl concentration and % production of NaOCl (current density of 1.5915 mA/cm2; 0.5 cm inert spacing; 40,000 ppm salinity; time of 20 min).
Energies 16 04754 g004
Figure 5. Flow field at smooth and grooved electrodes (A) with the formation of a bubble layer at the gas-evolving electrodes (B).
Energies 16 04754 g005
Figure 6. Influence of current density on NaOCl concentration and % production of NaOCl (operating parameters: 4.5 mL/min, 0.5 cm inert spacing, 40,000 ppm salinity, and 20 min).
Energies 16 04754 g006
Figure 7. Influence of current density on cell potential.
Energies 16 04754 g007
Figure 8. Influence of salinity on NaOCl concentration and % production of NaOCl (operating parameters: 4.5 mL/min, 0.5 cm inert spacing, 3.183 mA/cm2, and 20 min).
Energies 16 04754 g008
Figure 9. Influence of electrode spacing on NaOCl concentration and % production of NaOCl (operating parameters: 4.5 mL/min, 40,000 ppm salinity, 3.183 mA/cm2, and 20 min).
Energies 16 04754 g009
Figure 10. Normal probability of standardized errors.
Energies 16 04754 g010
Figure 11. Detected % NaOCl production vs. expected % NaOCl production.
Energies 16 04754 g011
Table 1. Physical and chemical characteristics of salty wastewater.
CharacteristicsValue
pH6.4–9.8
Conductivity, mS/cm63.4
Hardness as CaCO3, ppm8475
Total dissolved solids (TDS), ppm40,000
Total alkalinity as CaCO3, ppm112
Sodium as Na+, ppm12,456
Potassium as K+, ppm294
Sulfate as SO4, ppm1276
Chloride as Cl, ppm24,607
Calcium as Ca++, ppm740
Magnesium as Mg++, ppm1576
Nitrate as NO3, ppm13.6
Manganese as Mn++, ppm0.39
Iron as Fe++, ppm0.6
Salinity, %42.8
Table 2. Sieve analysis of the graphite electrode (granules shape).
Mesh No.Screen OpeningMass Fraction Retained
12 μm0
21.4 μm2.3 × 10−3
31.0 μm0.283
4710 microns0.495
5300 microns0.195
6150 microns0.012
775 microns3.6 × 10−3
8Pan4 × 10−3
Table 3. Basic characteristics of the porous electrode.
ParameterDiameter, mmHeight, mmMass of Graphite, gSpecific GravityShape FactorSpecific Area of Graphite, (m2/m3)
Value1002004501.0890.860.86
Table 4. Summary of results for optimal processing factors to produce sodium hypochlorite.
Flow Rate
mL/min
TDS in (ppm)TDS out
(ppm)
I in
(A)
I out
(A)
V in
(v)
V out
(v)
pH inpH outSalinity (ppm)Electrode Gap (cm)NaOCl Conc.
(g/L) %
Current Density
mA/cm2
Power
Kwh
4.540,00012,000441210.36.47.2540,0000.520.632%3.1830.0137
Table 5. Values and p-values of each term coefficient.
CoefficientsValuesp-Values
bo−6.2296836920.021540278
b1−273.99492221.28663 × 10−6
b25.9545170563.57137 × 10−7
b30.0007196330.000194301
b4−4.8889914782.31529 × 10−6
b5−0.021479532.16509 × 10−5
b6−1.00524 × 10−80.001746191
Table 6. Comparison between the proposed electrochemical cell and traditional electrochemical cells.
Anode and CathodeCurrent (A)Current Density, (mA/cm2)Electrolysis Time, hNaOCl Conc. (g/L) %NaOCl Conc. (g/L)Voltage, (V)SystemRef.
Graphite granules anode using flow-by technique43.1830.3320.6328.252810.3ContinuousOur Study
Stainless steel20--5.5--Batch[42]
Titanium100--0.86---[42]
Pepcon systems 100 AMP cell titanium cathode, graphite anode30--0.1--Continuous[19]
Cathode stainless steel anode RuO on Ti7.2--10.230-Continuous[19]
Ceramic membrane (Na3Zr2Si2POC)12- 741.7926-Continuous[19]
Anode RuO on Ti cathode SS3.6--6.830-Continuous[19]
Disclaimer/Publisher’s Note: The statements, opinions and data contained in all publications are solely those of the individual author(s) and contributor(s) and not of MDPI and/or the editor(s). MDPI and/or the editor(s) disclaim responsibility for any injury to people or property resulting from any ideas, methods, instructions or products referred to in the content.

