Article

The Reliability and Exploitation Analysis Method of the ICT System Power Supply with the Use of Modelling Based on Rough Sets

1
Faculty of Transport, Warsaw University of Technology, 75 Koszykowa St., 00-662 Warsaw, Poland
2
Division of Electronic Systems Exploitations, Institute of Electronic Systems, Faculty of Electronics, Military University of Technology, 2 Gen. S. Kaliski St., 00-908 Warsaw, Poland
3
Department of Energy, Faculty of Mechanical Engineering, Technical University of Koszalin, 15–17 Raclawicka St., 75-620 Koszalin, Poland
4
Department of Mechanical Engineering, Faculty of Technology, Institute of Technology and Business in České Budějovice, Okružní 10, 370 01 České Budějovice, Czech Republic
5
Institute of Electrical Engineering, Automation, Informatics and Physics, Faculty of Engineering, Slovak University of Agriculture in Nitra, Tr. A. Hlinku 2, 949 76 Nitra, Slovakia
6
Institute of Telecommunications, Faculty of Electronics and Information Technology, Warsaw University of Technology, Nowowiejska 15/19, 00-665 Warsaw, Poland
*
Author to whom correspondence should be addressed.
Energies 2023, 16(12), 4621; https://doi.org/10.3390/en16124621
Submission received: 22 April 2023 / Revised: 16 May 2023 / Accepted: 7 June 2023 / Published: 9 June 2023

Abstract

:
The article describes a new approach to the reliability–exploitation analysis of the critical information and communications technology (ICT) system power supply. A classic approach based on statistical indicators and a new one founded on uncertainty modelling based on the rough set method is presented. The main advantage of the uncertainty modelling approach is the simplification of the calculations and the fact that, unlike statistical analysis, uncertainty modelling does not require complete information on the used data sets. An extensive study of world publications was carried out, proving that this is an entirely innovative approach to solving the problem of reliability and exploitation analysis. Calculations, analyses and syntheses are also exhibited in a specific example. A sample of the ICT system power supply was simulated, and the simulation results are shown. The simulations were prepared by one of the co-authors for the purposes of this article.

1. Introduction

The classic reliability–operational modelling process is well-established in the literature [1,2,3,4]. It can be found in many significant publications, such as [3,4], where calculations based on statistical indicators are applied. This approach has several shortcomings. First, the calculations in the classical process are based on statistics, which requires detailed data on the entire model. Secondly, the classic approach has analyses based on statistical models, and only specific statistical distributions can be used, leading to distortion with real systems. Third, the calculations for more complex models are very extensive, as seen in the following chapters. Therefore, a better approach to the reliability and operational modelling process may be a qualitative assessment method proposed by the authors based on estimating qualitative indicators using uncertainty modelling [5,6]. Instead of statistical indicators, which in the classical modelling of the reliability–exploitation process are represented as probability functions and transition rates, in the new approach, indicators based on uncertainty modelling are employed. The main advantage of this new approach is that not all information about the analysed sets is needed, as is the case with the classical approach. However, this necessitates a different way of planning the analysis. Although, usually, determining indicators based on uncertainty modelling is much simpler. Thanks to this, the modelling itself can describe much larger model structures. The new approach is also not limited by specific statistical distributions. For these reasons, this study proposes using the rough set method to estimate selected reliability and exploitation indicators. To sum up, our research aims to develop a method that will be free from the disadvantages of methods based on statistics. We present one possible solution in this article. Another possible solution is published in [5,6].
The approach to the problem presented here, proposed by one of the co-authors, has already appeared in publications [7,8] in a simplified version. However, it was a simplified approach based on a two-state logic. This study presents the rough set method to estimate selected reliability and exploitation indicators by continuous values.
The following sections cover:
  • Section 2: Research background brings up the closer problem of state-of-the-art statistics-based and uncertainty modelling methods.
  • Section 3: A classic approach to the analysis of the power supply system is presented in Figure 1.
  • Section 4: Classic modelling of the reliability and exploitation process.
  • Section 5: Analysis of the reliability and exploitation process with the use of rough set modelling.
  • Section 6: Basic definitions used in modelling with rough sets.
  • Section 7: Simulations and their results confirm the validity of the approach presented in the article.

2. State-of-the-Art

During the exploitation of the ICT system power supply, a large set of external factors affect the system in question. It results in a change in the value of exploitation indicators, and thus it is possible to transition from a state of being fit to a state of being partially fit or unfit. In order to increase the level of security of the provided ICT services, solutions are used to increase the probability of the ICT system power supply remaining in a fit state. This literature review has been divided into two parts. In the beginning, the considerations related to the reliability and exploitation of power systems are presented. The second part focuses on the issues of system analysis using rough sets.
In terms of a general overview, traditional reliability and exploitation analysis has a fairly large group of significant literature items [1,2,3,4]. Generally, different reliability structures (series, parallel and series-parallel) of the examined systems are analysed. The knowledge of the reliability structure allows for the development of a graph of transitions between the distinguished exploitation states with specific relations between them. Using Kolmogorov–Chapman equations and Laplace transforms, the calculated probabilities of the analysed system are in the distinguished exploitation states. The authors of this article will apply this approach to the reliability and exploitation analysis of the ICT system power supply.
Research findings into power system operation and design represent a large body of studies [9,10,11]. The following article [12] was devoted to the analysis of multi-energy systems (MESs), which increase the reliability of power supply to consumers compared to separate energy systems. In order to improve the MES reliability indices, a method for assessing the reliability and vulnerability of MES was developed using the energy hub (EH) model. The publications mentioned above characterise the functioning and present the consecutive stages of designing power systems. However, these are general reflections. Due to the specificity of the power supply of ICT systems and the security demands imposed on them, it is required to provide defined values of reliability and operation indicators. These are presented by the authors in other sections of this article.
Among the significant publications in the field of reliability analysis of power systems, the following monograph can be mentioned [13]. Even as the years go by, the study and models they contain are still valid and form the foundation of today’s mathematically more advanced knowledge in this area. Mathematical models in this field are also being developed, yet simulation methods constitute a fairly wide range of applications [14,15].
An important issue is the need to ensure adequate power for the proper functioning of ICT systems. One solution is to use standby power systems [16]. The authors presented static and dynamic emergency and standby power systems. Applying these solutions in practice results in the possibility of increasing the value of the power system readiness index. Research involving mobile standby power systems is presented in the following study [17].
These publications [18,19,20] further describe issues related to redundant power sources. The usage of a standby power supply results in an increase in the level of guaranteed power supply to the systems. Commonly, generating sets or, even more frequently, renewable energy sources (e.g., photovoltaic panels, wind turbines, etc.) are used as standby power sources [21,22]. They are currently very intensively implemented owing to the development of hybrid renewable energy systems (HRES). The article [23] includes a characteristic of different HRES architectures and then conducts modelling for reliability and performance optimisation. When implementing these solutions, it is necessary to use control systems (they switch from primary power to standby power supply) and power grid management and control systems [24].
As already mentioned, nowadays, renewable energy sources are becoming more and more important [25]. There are significant scientific publications in this area [26] in which authors analyse several dozen studies on power systems using photovoltaic panels. Notably, in some of these studies, reliability analysis was applied, which made it possible to determine the values of reliability–exploitation indicators characterising the power systems in question.
The use of renewable energy sources (e.g., photovoltaic panels) in power systems [27] requires the design of appropriate control systems. It applies in particular to facilities located far away from significant management centres. In the study [28], the authors analysed the control methods in this type of power system, taking into account various states of unfitness.
The following publication [29] discusses solutions used in the control and management of power systems. However, the authors focused, in particular, on ICT solutions that are designed to monitor power systems. This leads to an increase in the level of security of power systems. Due to this, it is possible to detect states of partial fitness or unfitness of individual elements of the system.
The following publication [29] discusses solutions used to control and manage power systems. However, the authors focused mainly on ICT solutions designed to monitor power systems. This leads to an increase in the level of security of power systems. Due to this, it is possible to detect states of partial fitness or unfitness of individual elements of the system.
An essential issue in guaranteeing power to ICT systems is the redundancy of power sources in the case of facilities located far from inhabited areas. Usually, there is no adequate energy infrastructure in these locations. An example of such a facility might be digital cellular telephone base stations used in rail transport traffic management. Then, a power-generating unit is most often used as a standby power source. The following article [30] presents a proposal to use as another standby source for additional photovoltaic panels. The presented study and simulations carried out (in the field of power supply reliability and taking into account economic aspects) confirm the logic of using this type of solution in these facilities.
In the case of using renewable energy sources, the storage of power is an important issue. The stored energy can be used later to power devices. It, in turn, increases the level of security of the power supply. The article [31] describes various technologies and devices that are used to store energy obtained, among others, from renewable energy sources. The following publication [32] examined similar issues whereby the most favourable solution was selected by applying the analytic hierarchy process (AHP).
Another important subject matter is the correct design of the exploitation process of energy systems. In the monograph [33], the authors characterised the impact of the financial outlay on increasing the value of reliability indices. The proposed reliability models for power systems and the adopted probability distributions of selected reliability indicators are useful in analysing real power systems. It makes it possible to evaluate current systems and develop rational measures for their maintenance.
One of the most significant factors influencing the reliability analysis of power systems is the quality of power supply. The publication [13] presents reliability indicators that can be used in the analysis of various types of power grids. An essential part of this study is the reliability and exploitation calculations of power grids. Similar issues are also presented in the article [34]. However, the authors focused here on the analysis of the lack of power supply continuity in the example of four variants of remote control on the sequence of a medium-voltage cable line. Similar reflections are included in the publication [35], which examines the impact of natural hazards on the functioning of the power system.
An important area of scientific study is also the diagnosis of the technical conditions of devices which are used in the power supply. In this field, the following article can be specified [36]. It presents the monitoring of the technical condition of the transformer with the use of the Internet of Things (IoT). The microcontroller receives data from individual sensors, and on this basis, it is possible to assess the technical condition of the device. As a result, the probability of detecting a partially fit condition increases.
Another crucial issue in the design of power systems is their optimization [37,38]. In the study [39], research models include economic aspects. This enables the rationalization of the exploitation process of power systems [40,41].
Other fields of study investigated in the literature are the ones related to the analysis of the exploitation process of power supply systems for ICT devices [8]. In this article [42], it was rightly noted that the power supply system is one of the most important, and it significantly influences arranged transport reliability. The authors presented the rationalisation of the schedule of power systems’ periodic inspections. Thanks to this, it is possible to obtain an appropriate level of guarantee of transport performance and reduce operating costs. The following publication [43] also contains a similar discussion, whereby the continuity of power supply to electric traction power supply systems was analysed.
The following article [44] also discusses issues concerning the rationalisation of the power supply exploitation process. A solution was proposed in the form of opportunistic preventive maintenance (POM) for the traction power supply system, taking into account the reliability of the devices. After conducting analyses and simulations, it was found that it is possible to shorten the time of power outages.
Powering ICT systems interact with the environment [45,46]. Individual solutions should be designed in such a way so the reliability and exploitation indicators have appropriate values depending on the type of facility (in particular, this applies to facilities classified as critical infrastructure). For this reason, the reliability and exploitation analysis of the power supply is vital. The electromagnetic compatibility of the applied electrical and electronic devices is also meaningful [47]. However, due to the breadth of this issue, it is not scrutinised. However, one should remember the negative impact of electromagnetic interference on the electronic devices used in power supply [48].
The literature review presented so far regards assessing reliability and exploiting power systems. As mentioned at the beginning of this section, the second part of the state-of-the-art is devoted to analysing power systems with the use of, inter alia, rough sets [49,50]. The study [51] introduces the use of the axiomatic fuzzy set (AFS) theory in order to facilitate the transformation of data into fuzzy sets (membership functions) and the implementation of fuzzy logic operations. This type of analysis can be applied in the assessment of the power system.
The article [52] presents an analysis of a smart electrical grid (SEG), which used data from multiple sensors to design a distributed automated power supply network. This concept uses modern ICT solutions, such as the Internet of Things (IoT), cloud computing and extensive data analysis. The vast amount of available data requires advanced processing and enables the prediction of the load on the power grid.
In the field of energy storage, analysis with the use of, among others, rough sets is also applicable. In the publication [53], different battery system technologies were characterised, and their integration into the power grid was analysed. The rough set theory was used to evaluate technological and economic properties as well as the influence on the environment and safety. The authors rightly claim that standard methods of assessing battery performance are not sufficient and clear criteria should be developed for assessing different solutions.
The rough set theory was also applied to explore data collected in big data in the field of electricity consumption in a smart power grid [54]. The authors proposed to analyse the electricity consumption behaviour by introducing a lower set of approximations and an upper set of approximations in order to maintain the data characteristics. The case study confirmed that the method is effective and improves the clustering accuracy index.
The publication [55] proposed using rough sets to reduce the number of complaints necessary to determine the location and time of the fault occurrence. The author proposed to use information from the user’s meter, telephone complaints and alarms from devices as sources of information about the fault. Using the data mentioned above, he developed a fault localisation method based on the theory of rough sets and data fusion.
Rough sets were also used to analyse the functioning of renewable energy sources [56]. The authors analysed the wind farm operation and its cooperation with other systems. The proposed approach made it possible to consider ambiguities and uncertainties, thanks to which the current exploitation status of the system can be assessed more flexibly.
Additionally, in the publication [57], the application of set theory in the analysis of energy systems was recommended. The authors applied this mathematical approach to photovoltaic panels’ energy production forecast. The presented examples verifying the method confirmed that the forecasting models using rough sets are correct and accurate.
Despite so many scientific studies both in the field of reliability and exploitation analysis of power supply systems and the application of the rough set theory in power supply analysis, there are no publications that combine both approaches, i.e., power supply reliability and exploitation analysis with the determination of specific indicators by applying rough set theory. According to the authors, this is an innovative approach and will enable a broader view of the analysed power supply of ICT systems. Subsequently, the article presents the following stages of the reliability and exploitation power supply analysis method using modelling adopting distributed sets.
The reliable operation of ICT systems requires an adequate power supply to individual subsystems that perform specific functions in data transmission [58,59,60]. Typically, a fault in a subsystem can cause the malfunctioning of the whole or part of the system [61,62,63,64,65]. For this reason, ICT systems are supplied from two independent sources. The first power source is the primary supply, and the second power source is the standby supply. In the event that the primary supply goes into a non-operational state, it automatically switches to the standby power source. When supplying ICT systems, especially in critical infrastructure facilities [66,67,68], it may not be enough [69]. Therefore, the power supply from three independent sources is then used (e.g., primary power supply and two standby power supplies, as power supply from a separate power line and the use of a power generating unit) [70,71,72,73]. A structural sketch of such a power supply solution for an ICT system containing three independent energy sources is shown in Figure 1.

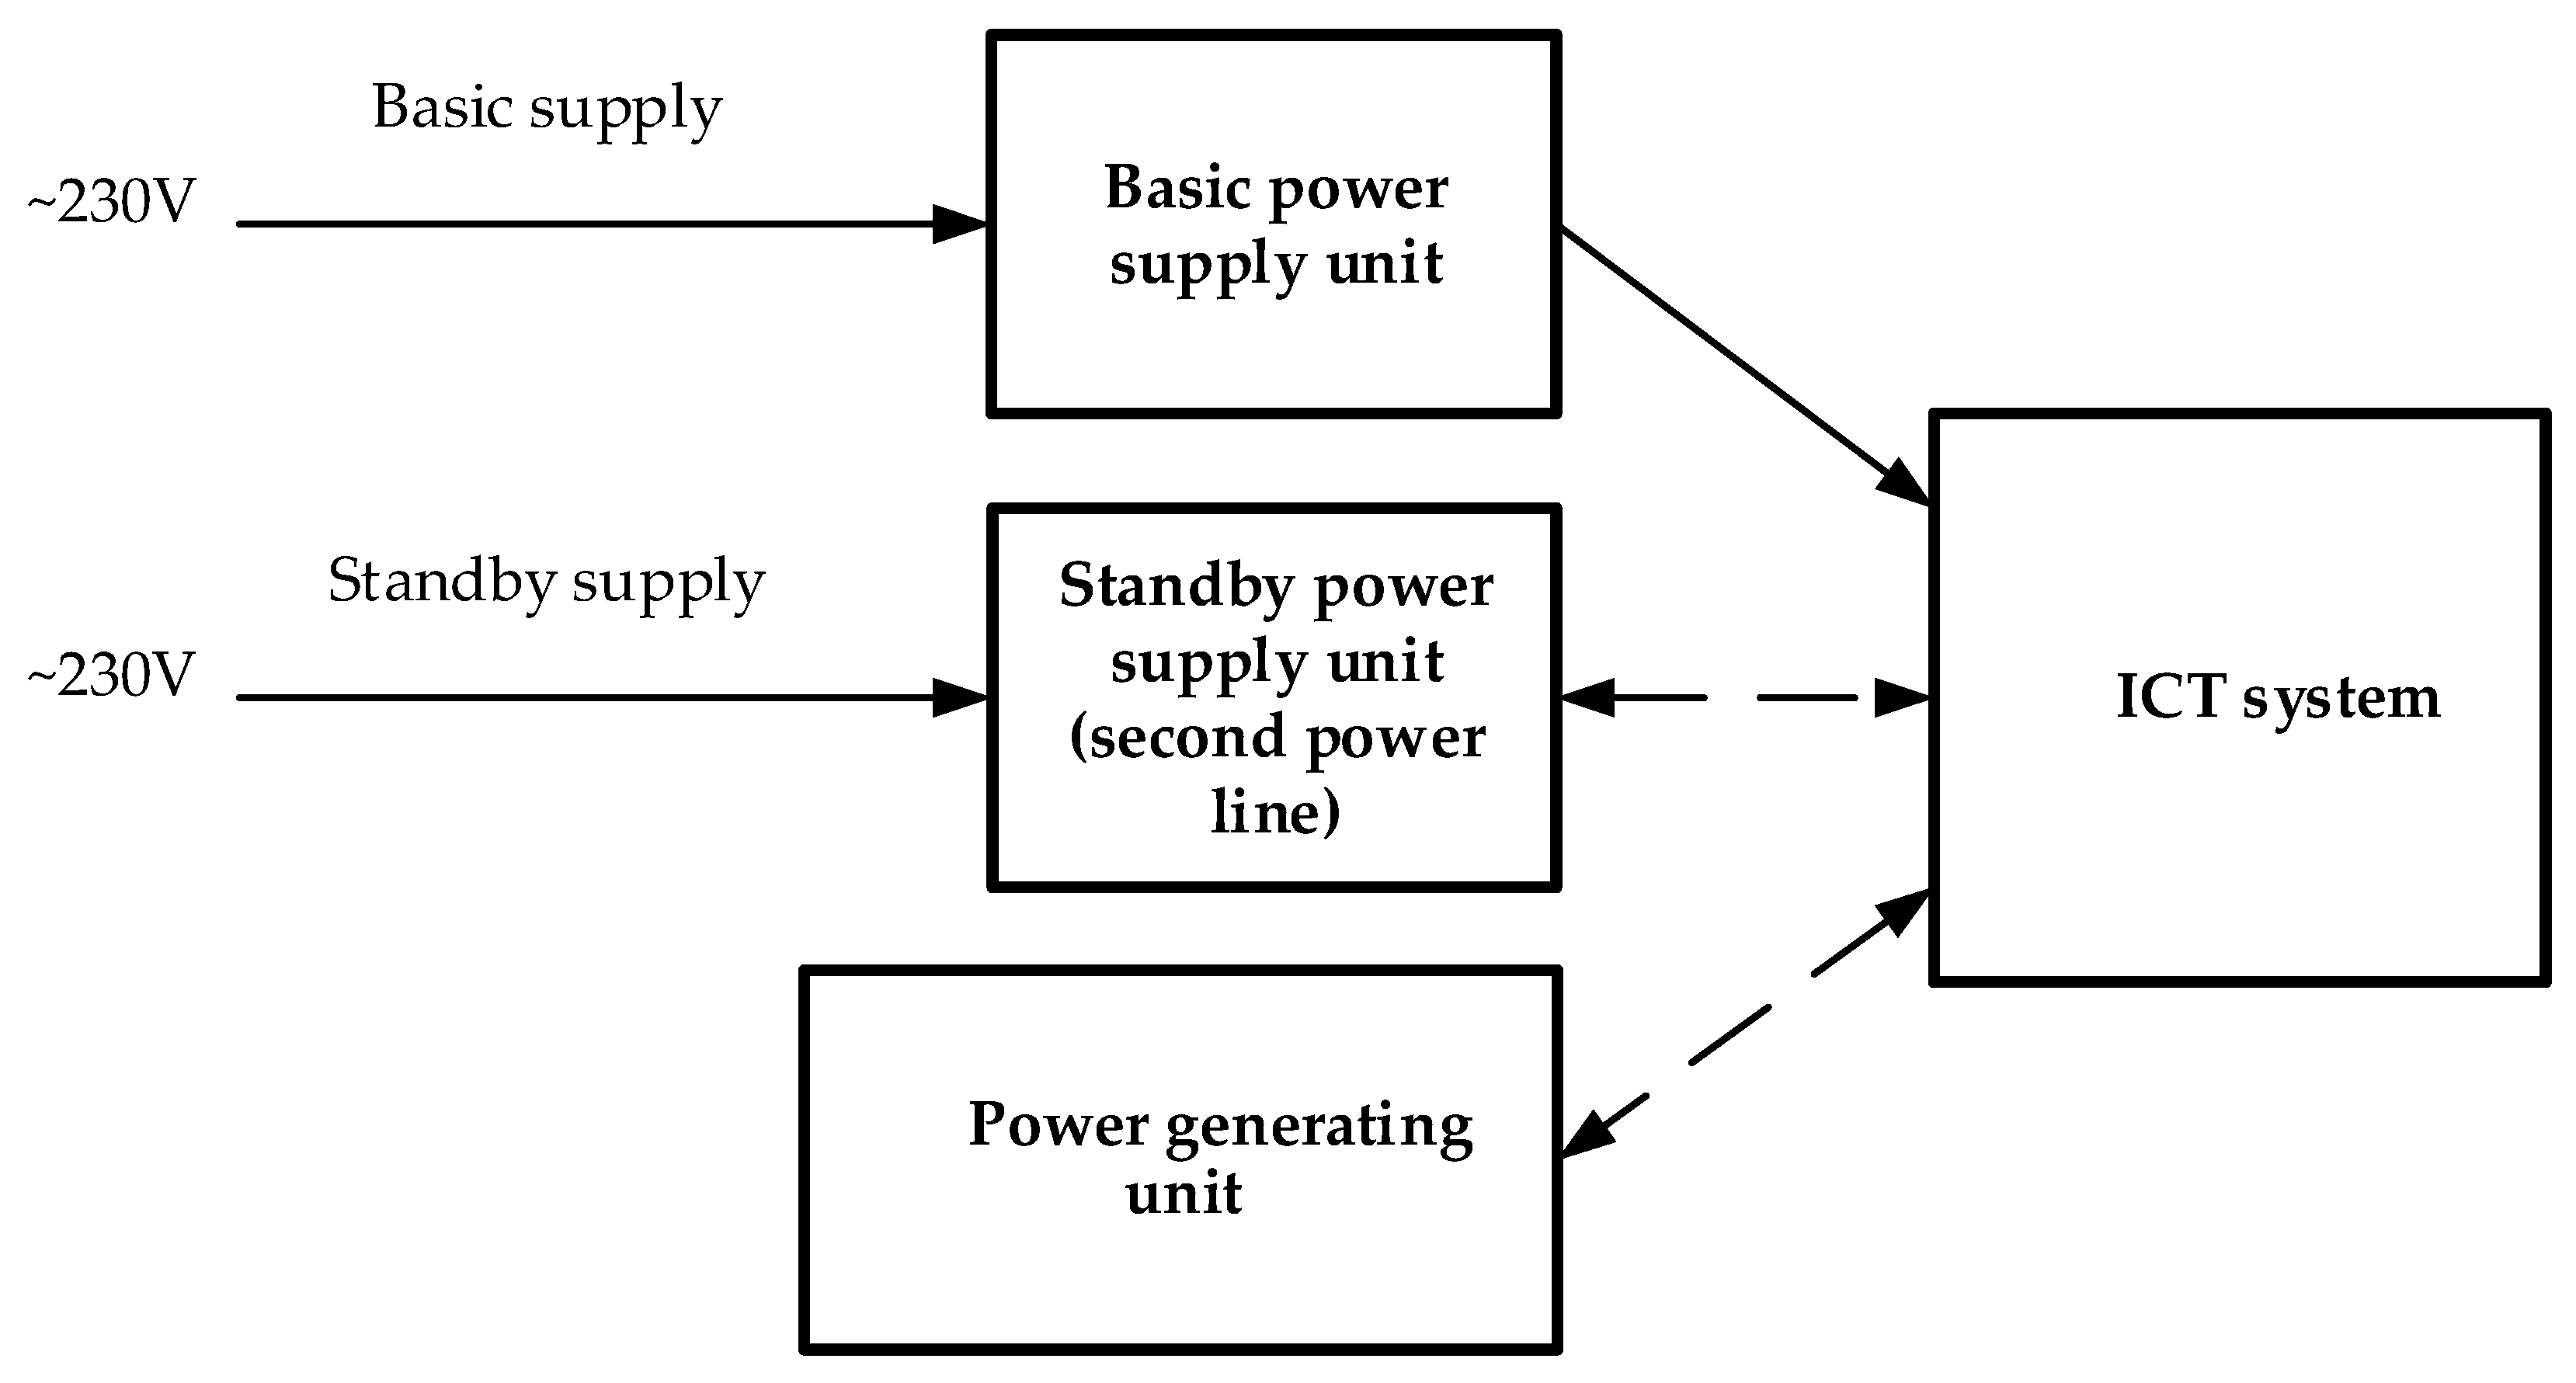
3. The Analysis of the Reliability-Exploitation Process—Classic Approach

In order to demonstrate the method introduced in the following sections of this article, a system presented simply in Figure 1 was selected. It is a block diagram of the power supply to a critical system of, for example, an ICT node [74], a hospital or a road traffic control system. In addition to the usual redundancy of power supply, the system also has an additional standby power supply connected to the critical system from another power bus, e.g., another power supplier with an independent power grid. It is a development version of the solutions presented by the co-authors in previous publications [5,6,75,76] based on other methods of uncertainty modelling.
The state of full ability SFA is the state in which all three power sources (basic and backup, i.e., power from the second power line and the power generating unit) function properly. The safety threat state SST1 is the state where the primary power supply is disabled. The safety threat state SST2 is a state in which the basic and backup power supplies (the second power line) are unfit. The safety unreliability state SU is a state in which all three power sources are unfit.
When the system is in the state of full ability SFA, in the event of the primary power supply failure, the system goes into the safety threat state SST1 with λST1 intensity rate. When the system is in a state of safety threat SST1, it is possible to go into the state of full ability SFA by taking actions consisting in restoring the state of the ability of the primary power supply.
In the event of a backup power failure (the second power line) and the system is in a state of a safety threat SST1, it goes into a safety threat state SST2 with an intensity of μU0.
Being in a state of safety threat SST1, in the event of a simultaneous failure of the backup power supply (the second power line) and the power generating unit, there is a transition to the unreliability state SU with the intensity λU1.
When the system is in a state of safety threat SST2, in the event of failure of a power generating unit, it goes into the unreliability state SU with the intensity of λU2.
When the system is in a state of full ability SFA, in the event of a simultaneous failure of the primary power supply and the standby power supply (the second power line), the system enters the safety threat state SST2 with the λST2 intensity rate. When the system is in a state of safety threat SST2, it is possible to transition to the state of full ability SFA by undertaking measures to restore the ability state of both unfit power supplies.
When the system is in the state of safety unreliability SU, it is possible to switch to the state of full ability SFA by taking actions consisting in restoring the state of ability to all three unfit power supplies.
Symbols in Figure 2 stand for:
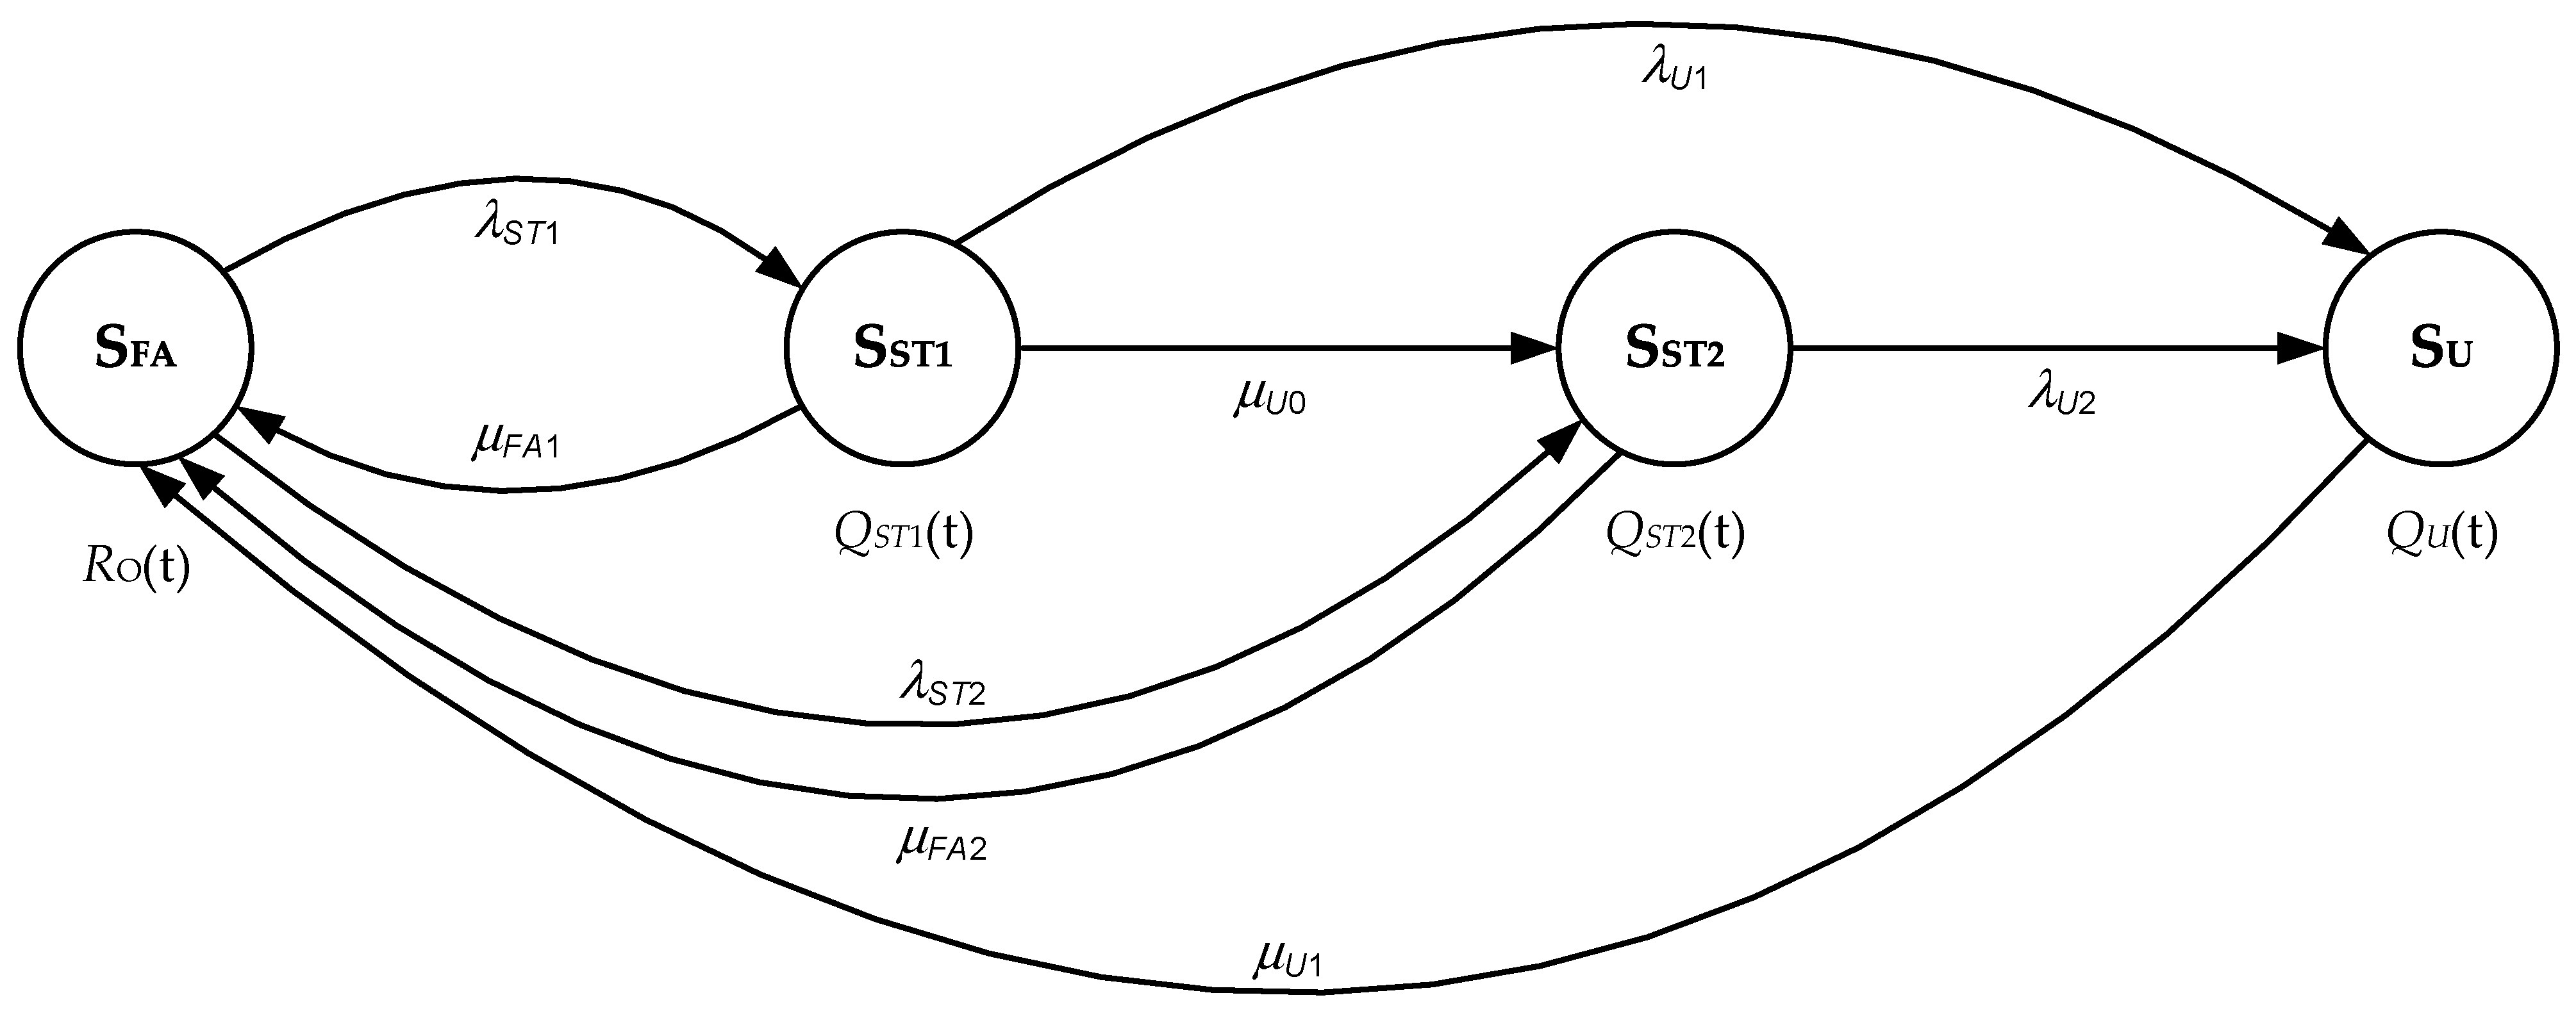
  • RO(t)—probability function of the system occurring in full ability state SFA,
  • QST1(t)—probability function of the system occurring in safety threat state SST1,
  • QST2(t)—probability function of the system occurring in safety threat state SST2,
  • QU(t)—probability function of the system occurring in the unreliability of safety state SU,
  • λST1—transitions rate from full ability state SFA to safety threat state I SST1,
  • λST2—transitions rate from full ability state SFA to safety threat state II SST2,
  • μFA1—transitions rate from safety threat state I SST1 to full ability state SFA,
  • μFA2—transitions rate from safety threat state II SST2 to full ability state SFA,
  • μU0—transitions rate from safety threat state I SST1 to safety threat state II SST2,
  • μU1—transitions rate from the unreliability of safety state SU to full ability state SFA,
  • λU1—transitions rate from safety threat state I SST1 to unreliability of safety state SU,
  • λU2—transitions rate from full ability state II SFA2 to unreliability of safety state SU.
The system presented in Figure 2 can be described with the following Chapman–Kolmogorov equations:
R 0 t = λ S T 1 R 0 t + μ F A 1 Q S T 1 t λ S T 2 R 0 t + μ F A 2 Q S T 2 t + μ U 1 Q U t , Q S T 1 t = λ S T 1 R 0 t μ F A 1 Q S T 1 t λ U 1 Q S T 1 t μ U 0 Q S T 1 t , Q S T 2 t = λ S T 2 R 0 t μ F A 2 Q S T 2 t λ U 2 Q S t 2 t + μ U 0 Q S T 1 t , Q U t = λ U 1 Q S T 1 t + λ U 2 Q S T 2 t μ U 1 Q U t .
Applying the following initial conditions:
R 0 ( 0 ) = 1 , Q S T 1 ( 0 ) = Q S T 2 ( 0 ) = Q U ( 0 ) = 0 ,
and employing the Laplace transform yields the following system of linear equations:
s R 0 ( s ) 1 = λ S T 1 R 0 ( s ) + μ F A 1 Q S T 1 ( s ) λ S T 2 R 0 ( s ) + μ F A 2 Q S T 2 ( s ) + μ U 1 Q U ( s ) s Q S T 1 ( s ) = λ S T 1 R 0 ( s ) μ F A 1 Q S T 1 ( s ) λ U 1 Q S T 1 ( s ) μ U 0 Q S T 1 ( s ) s Q S T 2 ( s ) = λ S T 2 R 0 ( s ) μ F A 2 Q S T 2 ( s ) λ U 2 Q S T 2 ( s ) + μ U 0 Q S T 1 ( s ) s Q U ( s ) = λ U 1 Q S T 1 ( s ) + λ U 2 Q S T 2 ( s ) μ U 1 Q U ( s )
By transforming it, we receive a schematic notation:
R 0 ( s ) = b 1 b 2 c b 2 c λ S T 1 μ F A 1 a b 1 b 2 c + b 1 c λ S T 2 μ F A 2 + b 2 λ U 1 μ U 1 λ S T 1 + b 1 λ U 2 μ U 1 λ S T 2 + c μ U 0 λ S T 1 μ F A 2 + μ U 0 λ U 2 μ U 1 λ S T 1 , Q S T 1 s = b 2 c λ S T 1 b 2 c λ S T 1 μ F A 1 a b 1 b 2 c + b 1 c λ S T 2 μ F A 2 + b 2 λ U 1 μ U 1 λ S T 1 + b 1 λ U 2 μ U 1 λ S T 2 + c μ U 0 λ S T 1 μ F A 2 + μ U 0 λ U 2 μ U 1 λ S T 1 , Q S T 2 s = b 1 c λ S T 2 + c μ U 0 λ S T 1 b 2 c λ S T 1 μ F A 1 a b 1 b 2 c + b 1 c λ S T 2 μ F A 2 + b 2 λ U 1 μ U 1 λ S T 1 + b 1 λ U 2 μ U 1 λ S T 2 + c μ U 0 λ S T 1 μ F A 2 + μ U 0 λ U 2 μ U 1 λ S T 1 , Q U s = b 2 λ B 1 λ S T 1 + b 1 λ U 2 λ S T 2 + μ U 0 λ U 2 λ S T 1 b 2 c λ S T 1 μ F A 1 a b 1 b 2 c + b 1 c λ S T 2 μ F A 2 + b 2 λ U 1 μ U 1 λ S T 1 + b 1 λ U 2 μ U 1 λ S T 2 + c μ U 0 λ S T 1 μ F A 2 + μ U 0 λ U 2 μ U 1 λ S T 1 ,
where:
  • a = s + λ S T 1 + λ S T 2 ,
  • b 1 = s + μ F A 1 + λ U 1 + μ U 0 ,
  • b 2 = s + μ F A 2 + λ U 2 ,
  • c = s + μ U 1 .
Further mathematical analysis is required to obtain dependencies that allow us to determine the probabilities of the entire system being in the following states: full ability, safety threat SST1 and SST2 and unreliability SU.

4. Reliability Exploitation Process Modelling—A Classic Approach

Computer simulation methods [77] and tests allow for a relatively quick determination of the impact of changes in the reliability and exploitation indicators of individual elements on the reliability of the entire system.
Computers help carry out calculations that enable the determination of the probability value of the system remaining in the state of full ability RO. Such a procedure is presented in the example below.

Example

The following values are selected to describe the analysed system:
  • Test duration—1 year (the value of this time is given in units of hours [h]):
t = 8760 [ h ]
2.
Transition rate from full ability state to safety threat state I λST1:
λ S T 1 = 0.000001
3.
Transition rate from full ability state to safety threat state II λST2:
λ S T 2 = 0.0000001
4.
Transition rate from safety threat state I to the unreliability of safety threat λU1:
λ U 1 = 0.0000001
5.
Transition rate from safety state II to unreliability of safety threat λU2:
λ U 2 = 0.000001
6.
Transition rate from safety threat state I to safety threat state II μU0:
μ U 0 = 0.00000001
7.
Transition rate from the unreliability of safety state to full ability state μU1:
μ U 1 = 0.01
8.
Transition rate from safety threat state I to full ability state μFA1:
μ F A 1 = 0.1
9.
Transition rate from safety threat state II to full ability state μFA2:
μ F A 2 = 0.2
Employing Equation (4) and the above input values yields:
R 0 s = 5.450045 1 0 13 s + 5 1 0 13 μ F A 1 + 4.5 1 0 12 μ F A 2 + 5 1 0 21 s 2 μ F A 1 + 5 1 0 21 s 2 μ F A 2 + 5.000545 1 0 19 s 2 + 5 1 0 21 s 3 + 5.0005 1 0 19 s μ F A 1 + 5.000045 1 0 19 s μ F A 2 + 5 1 0 19 μ F A 1 μ F A 2 + 5 1 0 21 s μ F A 1 μ F A 2 + 4.5 1 0 6 5.4450495 1 0 7 s 1 1 0 6 μ F A 2 + 5.00055 1 0 19 s 2 μ F A 1 + 5.000545 1 0 19 s 2 μ F A 2 + 5 1 0 21 s 3 μ F A 1 + 5 1 0 21 s 3 μ F A 2 + 1.09506445 1 0 14 s 2 + 5.001095 1 0 19 s 3 + 5 1 0 21 s 4 + 5.50005 1 0 13 s μ F A 1 + 5.45004 1 0 13 s μ F A 2 + 5 1 0 19 s μ F A 1 μ F A 2 + 5 1 0 21 s 2 μ F A 1 μ F A 2 1 ,
and transformations give the following result:
R 0 ( t ) = 1.63738549 1 0 10 e 0.01 t + 5.000041183 1 0 7 e 0.2000011 t + 0.00000999986 e 0.10000108 t + 0.99998949996 e 1.99997719 1 0 13 t
The end result is: R 0 = 0.9999895 .

5. Basic Definition of Rough Set

Using the method of rough sets [78,79,80,81] (due to the different definitions of rough sets, the author used the one from the publications of Prof. Zdzisław Pawlak), one can define the lower approximations (5) and upper approximations (6) for a set of objects.
B * X = x U : B ( x ) X ,
where:
  • U—universe (non-empty set of finite objects, set of datagrams from the analysed example),
  • X—set, a non-empty subset of the universe,
  • x—object of set X,
  • B(x)—abstract class containing object x from full relation (B-elementary set),
  • B * X —lower approximation of set X,
  • B * X —upper approximation of set X.
The following formula describes the difference between the upper and lower approximation (7).
B N B X = B * X B * X .
B N B X = only when upper and lower approximations are equal. Then, the set is an exact set. In another case, as in the one considered here, the set is an approximate set or a B-rough set, to be exact.
Using Equation (8), a quantitative measure of approximation can be determined.
α B X = B * ( X ) B * ( X ) ,
where:
  • α B X —approximation accuracy coefficient,
  • B * ( X ) —the lower approximation number of elements,
  • B * ( X ) —the upper approximation number of elements.
When B N B X = , the approximation accuracy coefficient is of value 1, as exemplified above, then we are dealing with an exact set. This coefficient, in the present case, enables supporting a decision regarding the exploitation state of supply of the ICT system.

6. The Analysis of Reliability and Exploitation Process with the Use of Modelling Based on a Rough Set

A simple way to implement modelling with distributed sets is the application of a binary approach. Such a solution to the problem is presented in Table 1 as an example of the methods in [7]. Another method may be a binary approach including reliability levels. This approach is presented in Table 2, which was compiled based on the publication [8,82].
The approach proposed in this article is based on multi-level indicators of the state of the object. For this purpose, selected values from the range [0–1] expressed as a percentage were introduced into decision tables. In the case of the presented example, these will be states of partial fitness when the main power source fails.
If we use the definitions from the previous section, two conclusions can be reached, which lead to the calculation of the approximation accuracy coefficient for the exploitation process indicators. We can also assume (based on the theory of rough sets [77,78]) that the sum of these indicators does not have to equal 1. Therefore, we imply that the universe U is a set of events. The subsets of this universe Xs and Xn denote a subset for an efficient and inefficient system, respectively. The abstraction class B(X) has been described by dependencies in the decision table presented in Table 1, Table 2 and Table 3. As this class describes the universe, it will apply both to the efficient and the inefficient system, which is described by subsets Xs and Xn of the same universe U.
The following Equation (9) can be used to determine the values of the indicators mentioned at the beginning of this article:
A = α B ( X s ) 1 α B ( X n ) .
The above equation enables the determination of coefficient A, which can be treated as an indicator of the system’s reliability.
Based on Table 3 and the dependencies described in the previous section, the following modelling can be performed.
In the absence of failure, the approximate set will be:
  • No failure of the lower approximation appears only for object 1, i.e.:
B * ( X s )   = { obj 1 } .
2.
No failure of the upper approximation appears only for objects 1 to 7, i.e.:
B * ( X s )   = { obj 1 ,   obj 2 ,   obj 3 ,   obj 4 ,   obj 5 ,   obj 6 ,   obj 7 } .
In case of failure, the approximate set will be:
  • Failure of the lower approximation appears for objects 8 to 14, i.e.:
B * ( X n )   =   { obj 8 ,   obj 9 ,   obj 10 ,   obj 11 ,   obj 12 ,   obj 13 ,   obj 14 } .
2.
Failure of the upper approximation appears for objects 1 to 14, i.e.:
B * ( X n )   = { obj 1 ,   obj 2 ,   obj 3 ,   obj 4 ,   obj 5 ,   obj 6 ,   obj 7 ,   obj 8 ,   obj 9 ,   obj 10 ,   obj 11 ,   obj 12 ,   obj 13 ,   obj 14 } .
A = α B ( X s ) 1 α B ( X n ) = B * ( X s ) B * ( X s ) 1 + B * ( X n ) B * ( X n ) = 1 7 1 + 7 14 0.0952 .
The next step is to assign object coefficients to each item in Table 3. In the place of “YES”, a coefficient from 0 to 1 is entered and in the place of “NO”, the value 0 is entered. As a result, Table 4 was created. Based on the publications [18,19,20,82,83], the values of the observation coefficients for each state were selected as follows:
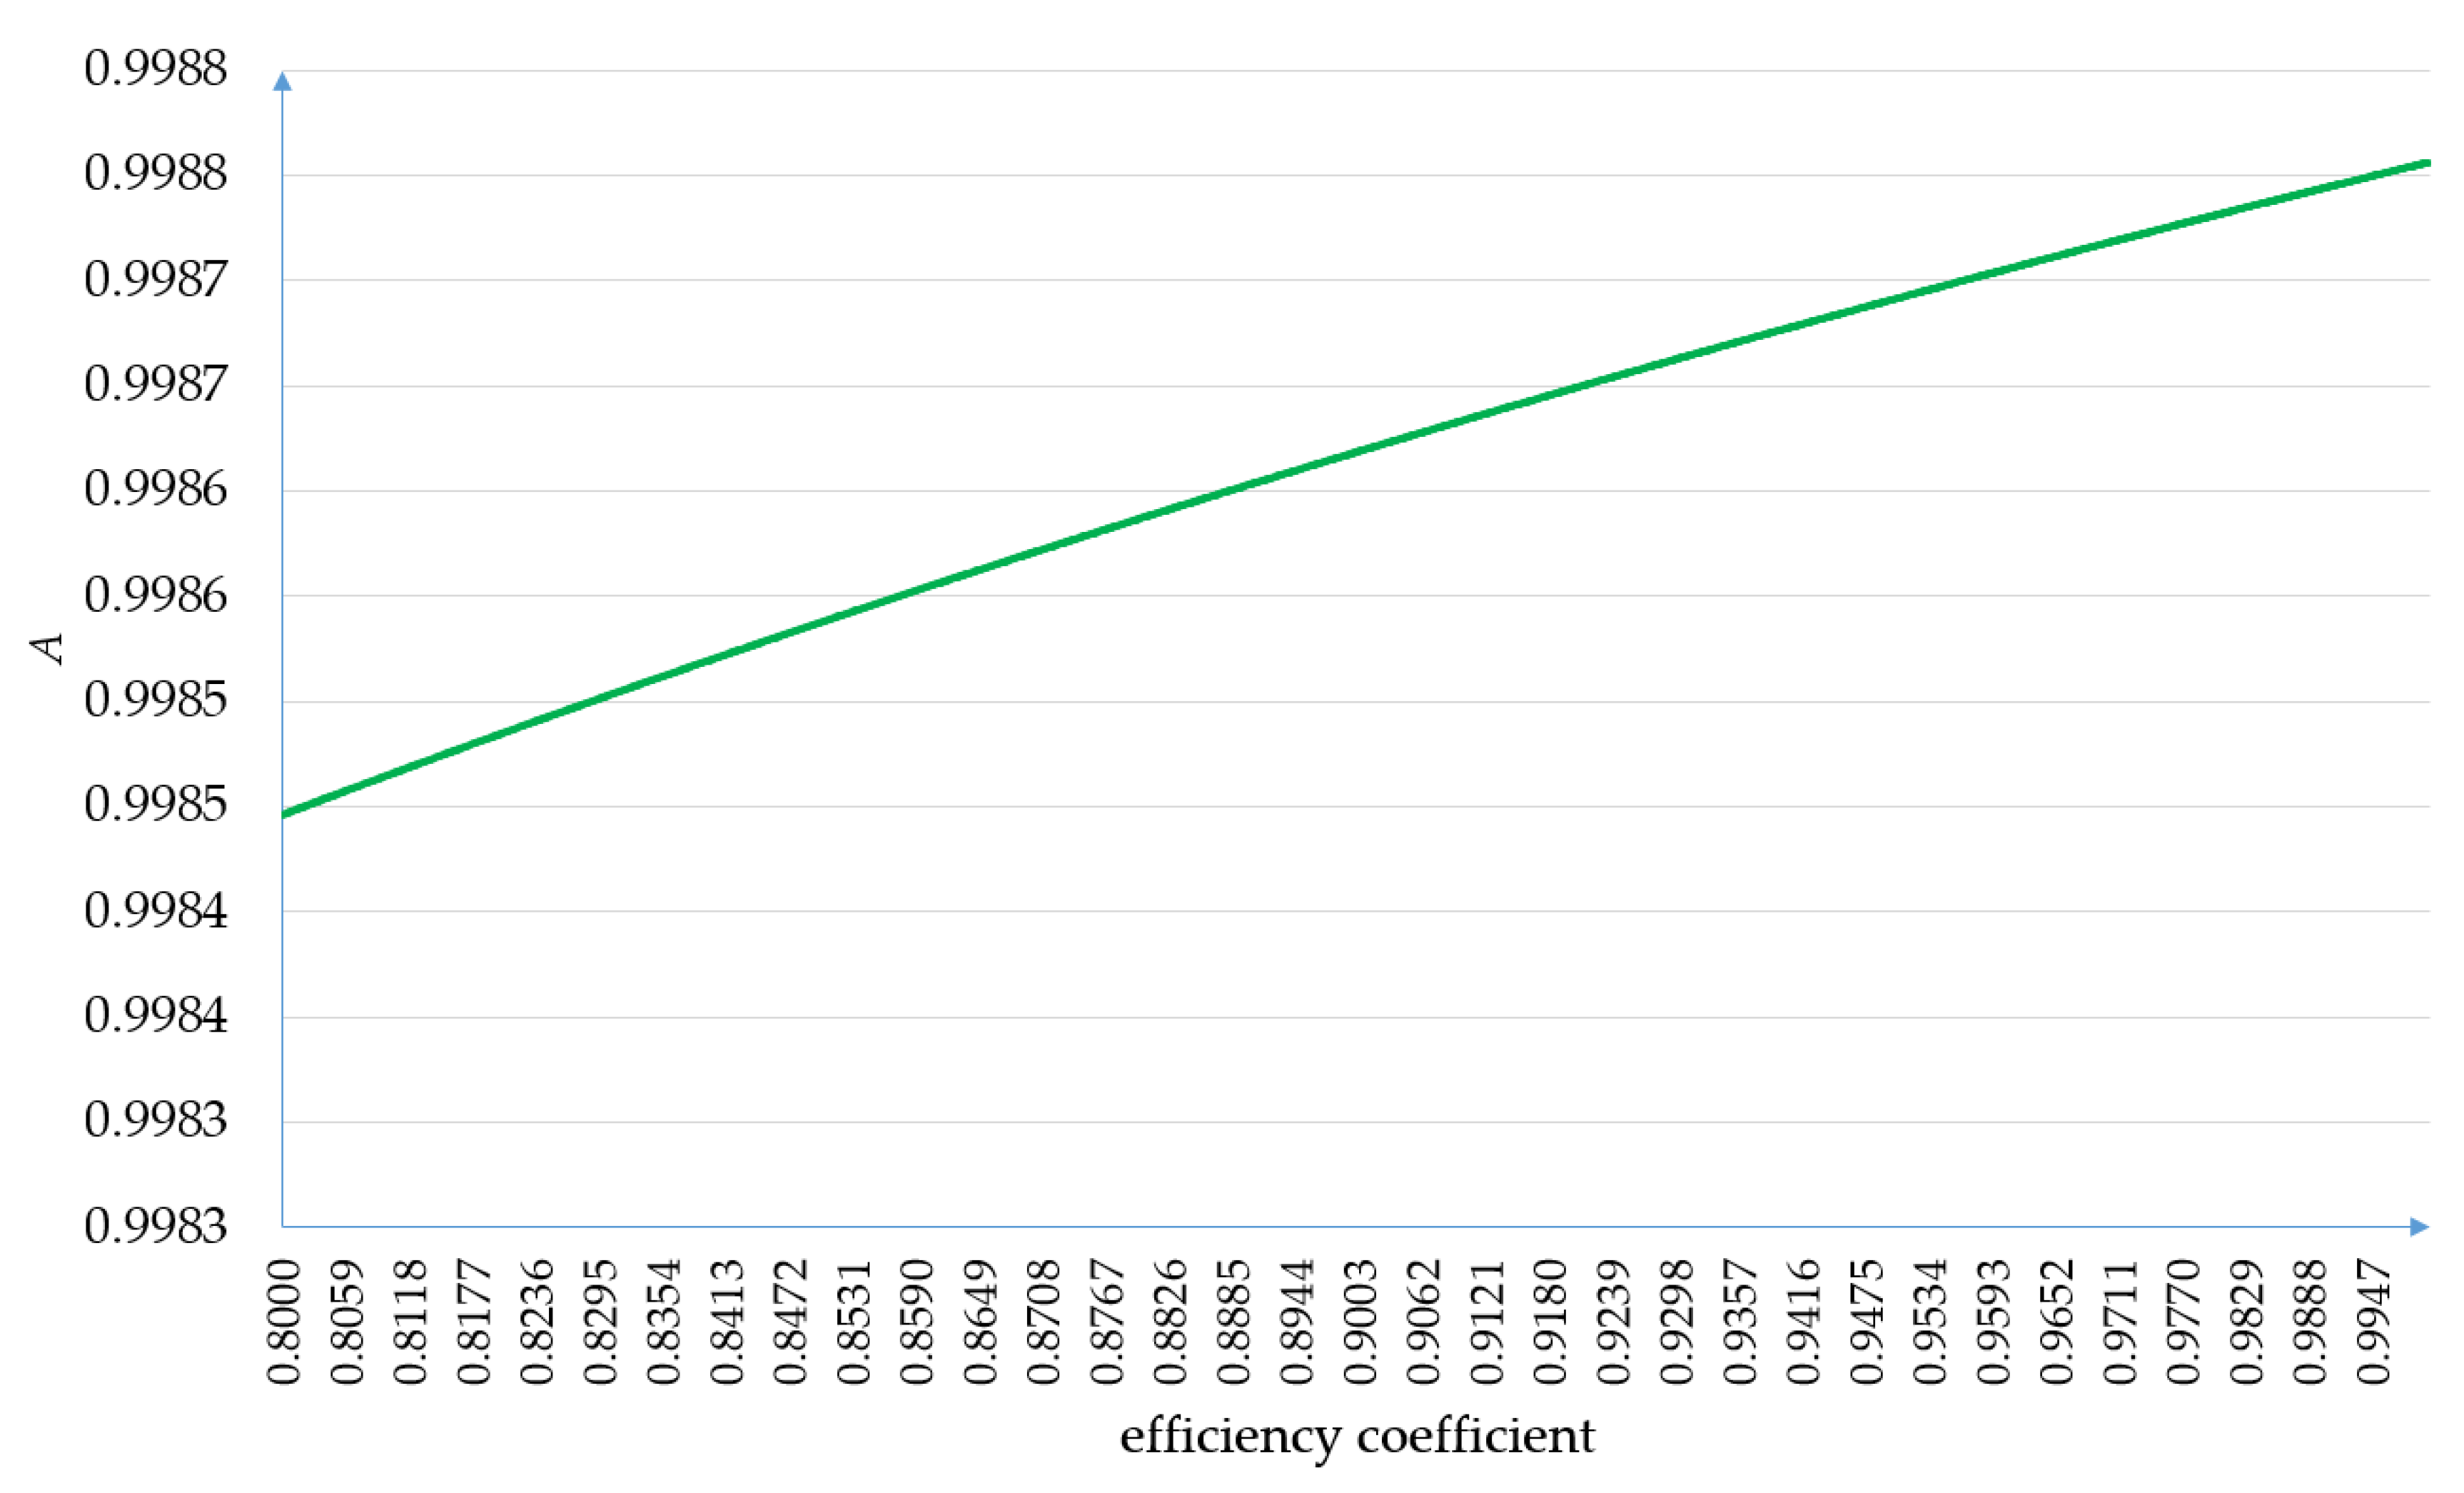
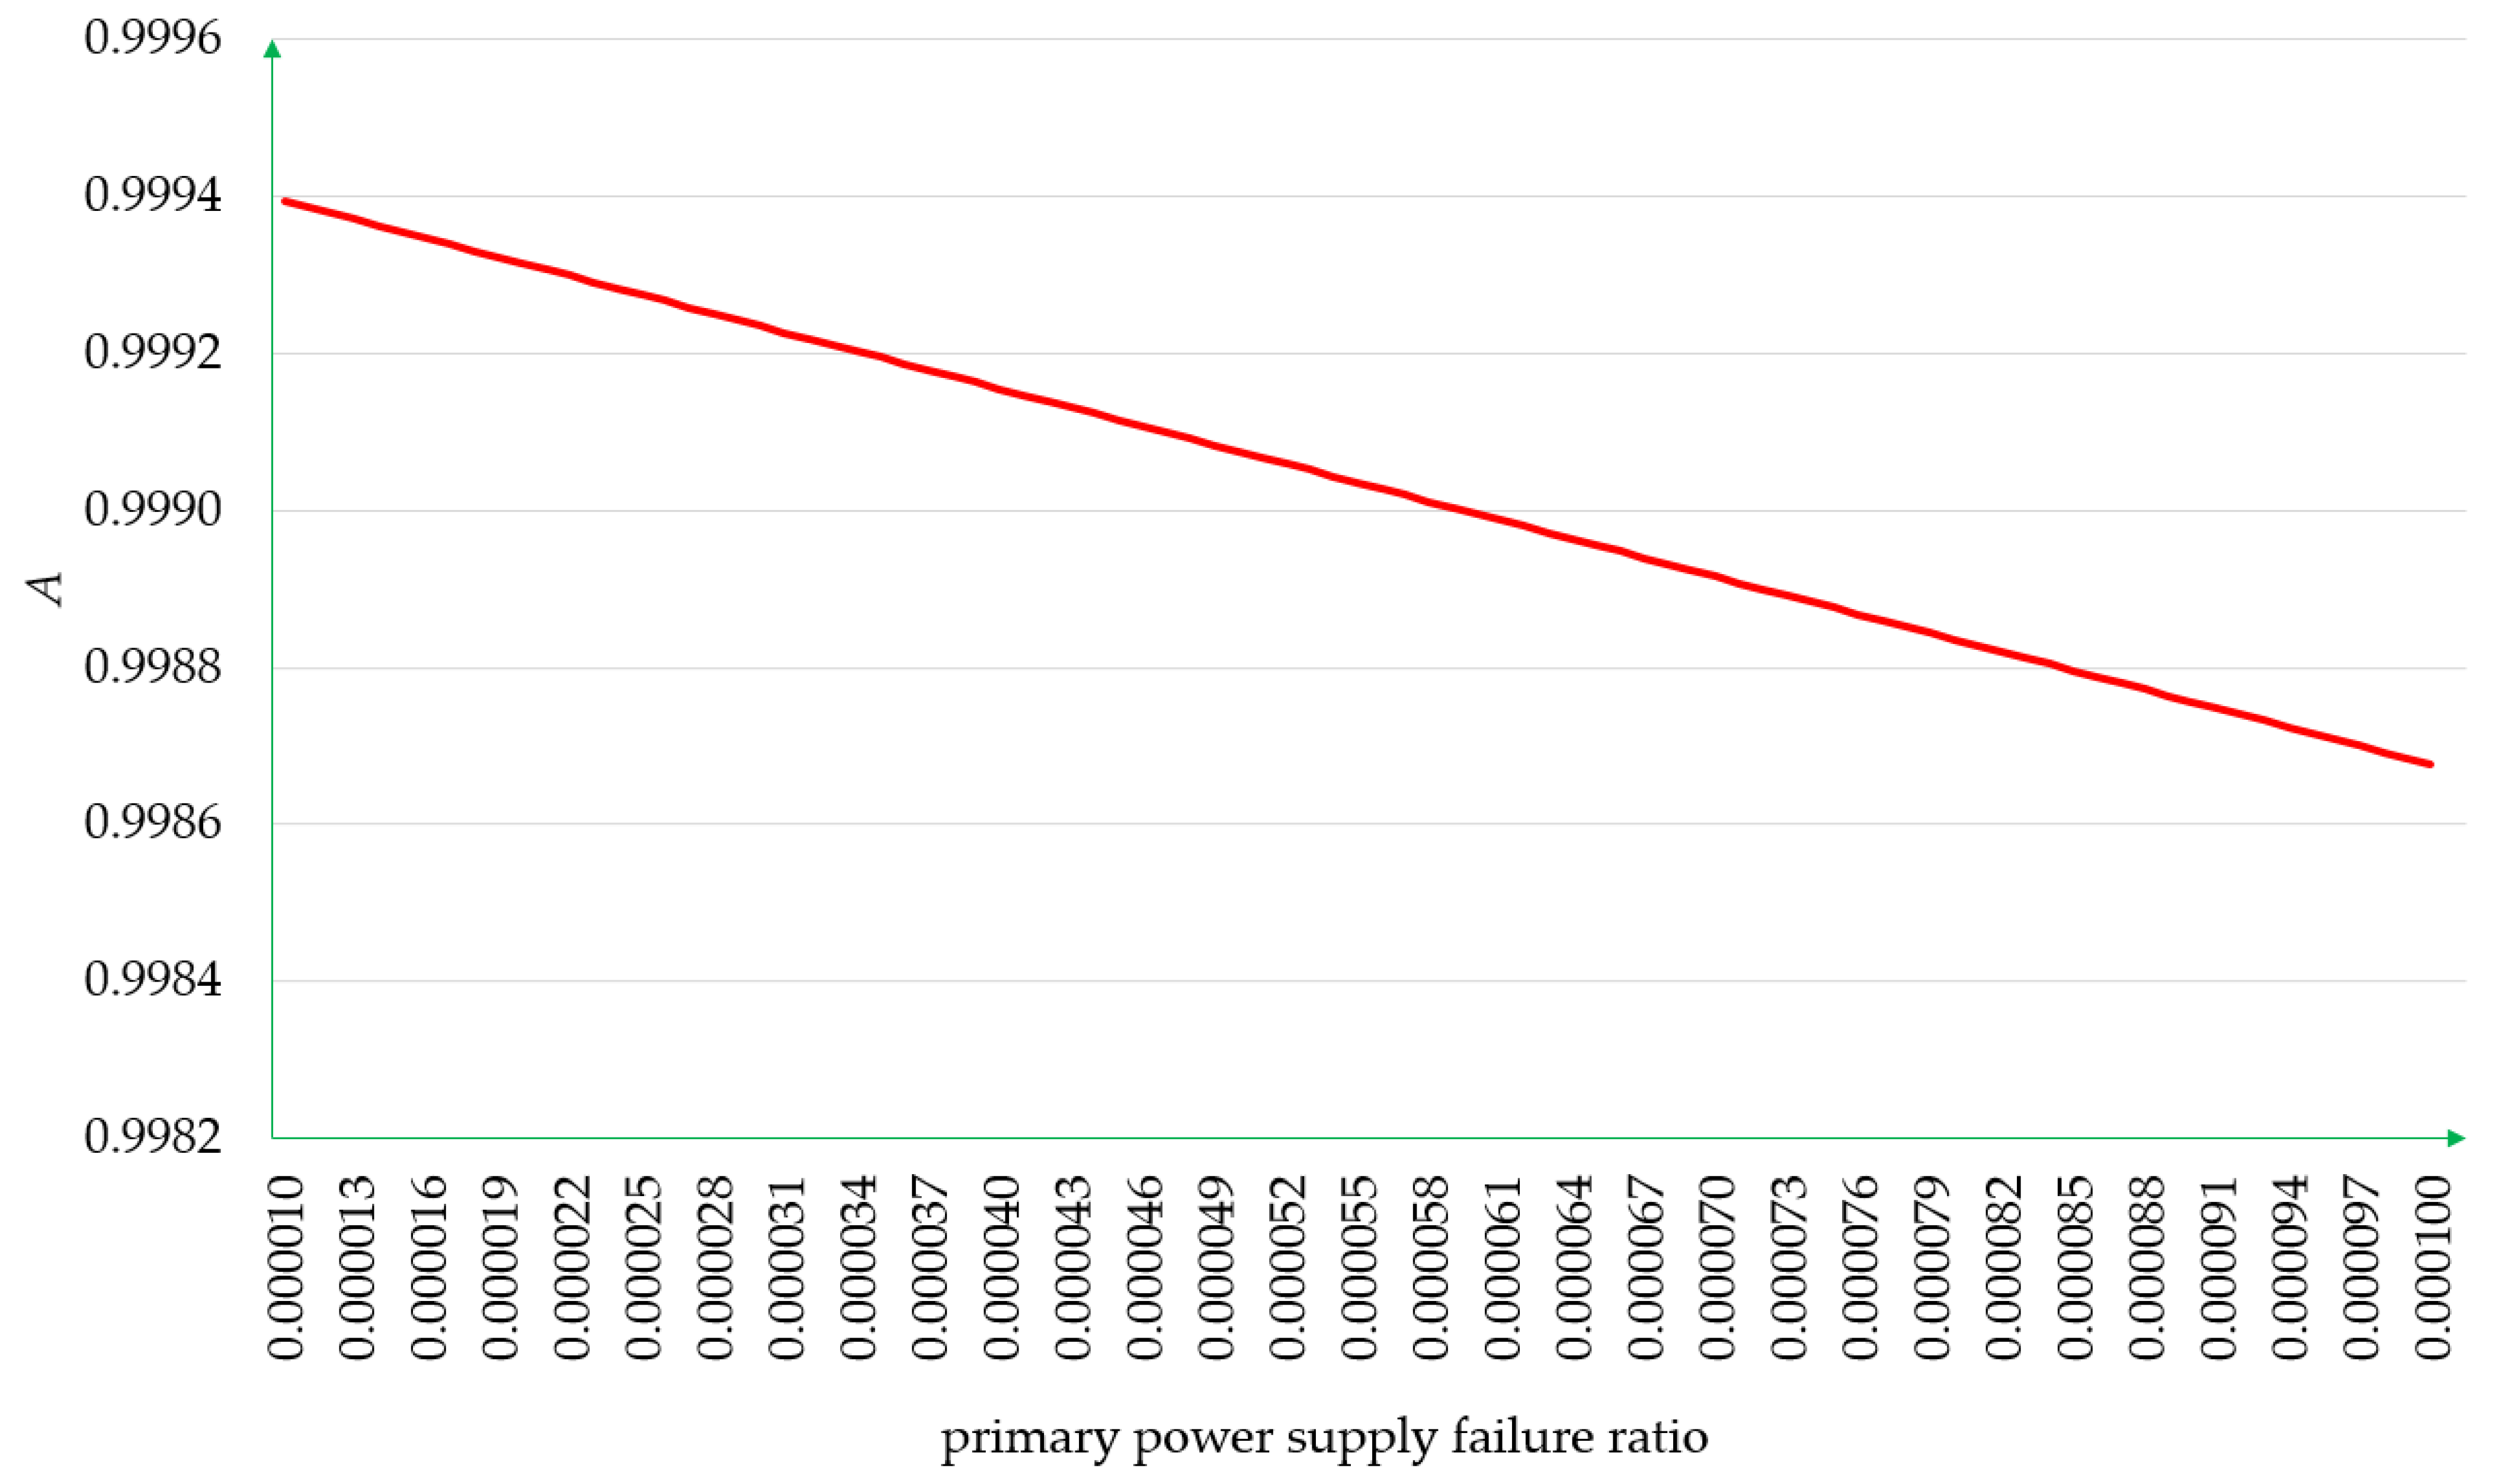
  • Full fitness was observed with a coefficient of 0.9999;
  • The non-operational primary power supply was observed with a coefficient of 0.00009;
  • The non-operational backup power supply was observed with a coefficient of 0.000008;
  • The non-operational standby power supply was observed with a coefficient of 0.00001.
Although the proposed method enables the use of different values of the coefficients for different observation objects, the authors did not decide to do so because they wanted to present the idea of the new approach in the simplest way.
Based on the values in Table 4 and the dependencies described above, the approximations B ( X ) will assume the values.
In the absence of failure, the approximate set will be:
  • No failure of the lower approximation appears only for object 1, i.e.:
B * ( X s ) = 0.9999 .
2.
No failure of the upper approximation appears only for objects 1 to 7, i.e.:
B * ( X s ) = 1.000224 .
In case of failure, the approximate set will be:
  • Failure of the lower approximation appears for objects 8 to 14, i.e.:
B * ( X n ) = 0.000922 .
2.
Failure of the upper approximation appears only for objects 1 to 14, i.e.:
B * ( X n ) = 1.001146 .
The final value of the coefficient is:
A = 0.9999 1.000224 1 + 0.000922 1.001146 0.9988 .
The operation on sets makes possible the use of any values on each item in Table 4. Therefore, the calculations of the coefficients of successive objects do not have to assume the same values for each of the states. There are also no restrictions that force the application of statistics (in this case: values greater than one are possible). Another advantage of the proposed method is the possibility of considering the states of the system, which the proposed classic approach, described in Section 4, does not take into account. Such a state is, for example, object 6 in Table 3, which indicates a failure of the primary and standby power supply. In the classic approach, such an exemplary state can be considered, although adding further states to the model leads to a significant complication in modelling and calculations.

7. Simulation and Its Results

In order to present the influence of key variables on the final value of coefficient A, a simulation was proposed for various values of the input parameters. The first graph shown in Figure 3 was generated from the values in Table 4, except that the value of the efficiency coefficient varied from 0.8 to 0.9999.
Another dependency worth demonstrating is the value of indicator A as a function of the coefficient of the non-operational primary power supply. Such a dependency is presented in Figure 4. It was generated on the basis of the values in Table 4, except that the value of the non-operational primary power supply coefficient varied from 0.00001 to 0.0001.
It is worth noting that the graph in Figure 3 is non-linear and will trend toward a specific value, which aligns with the expectations because, after reaching this value, the system will never malfunction.

8. Summary

The article describes a new method of reliability and exploitation analysis based on uncertainty modelling. This uncertainty modelling derives from the rough set method [7,8,75,78,84]. The paper presents a classic approach to reliability and exploitation analysis and the above-mentioned innovative approach to this analysis. The exhibited uncertainty modelling based on rough sets considers not only binary approaches but also multi-level approaches ranging from 0 to 1. The example provided clearly demonstrates the utility of the novel method and its advantages. The main advantage of the new method is its independence from statistical analysis, which in most cases leads to complications in calculations and, consequently, in modelling. The above study presents an example based on a model of the power supply system to critical devices (hospital equipment, ICT systems in transport, etc.) equipped with not only a standby power source but also a redundant power source that supplies electricity from a separate external circuit (e.g., from a separate electricity grid of another energy supplier). The classic approach to the reliability and exploitation analysis, as well as the presented innovative approach to this analysis, provides similar results. The final sections of the study show the simulation of the new method and its results. The simulation was performed using a program written specifically for this study by one of the co-authors.
In the next stage of the studies on the new reliability–exploitation analysis method described in this article, the authors plan to use this new method to manage and monitor the reliability of power supply systems in order to determine the coefficients, enabling the estimation of the continuity quality of power supply (CQoPS) coefficient elaborated in [5,6].

Author Contributions

Conceptualisation, M.S. and A.R.; methodology, M.S., K.P. and A.R.; software, M.S.; validation, M.S., J.P., S.D. and M.H.; formal analysis, M.S. and M.H.; investigation, M.S. and A.R.; resources, M.S. and J.P.; data curation, M.S.; writing—original draft preparation, M.S., A.R. and S.D.; writing—review and editing, M.S. and M.H.; visualisation, M.S. and J.P.; supervision, A.R. and K.P.; project administration, M.S. and K.P.; funding acquisition, M.S. and K.P. All authors have read and agreed to the published version of the manuscript.

Funding

This research was funded by the Warsaw University of Technology within the Excellence Initiative: Research University (IDUB) programme. Project No 1820.342.Z01.POB2.2021.

Data Availability Statement

Not applicable.

Acknowledgments

The research was funded by the Warsaw University of Technology within the Excellence Initiative: Research University (IDUB) programme.

Conflicts of Interest

The authors declare no conflict of interest.

References

  1. Epstein, B.; Weissman, I. Mathematical Models for Systems Reliability; CRC Press: Boca Raton, FL, USA; Taylor & Francis Group: London, UK, 2008. [Google Scholar]
  2. Jin, T. Reliability Engineering and Service; John Wiley & Sons: Hoboken, NJ, USA, 2019. [Google Scholar]
  3. Verma, A.K.; Ajit, S.; Karanki, D.R. Reliability and Safety Engineering; Springer: London, UK, 2010. [Google Scholar] [CrossRef]
  4. Kołowrocki, K.; Soszyńska-Budny, J. Reliability and Safety of Complex Technical Systems and Processes; Springer: London, UK, 2011. [Google Scholar]
  5. Stawowy, M.; Rosiński, A.; Paś, J.; Klimczak, T. Method of Estimating Uncertainty as a Way to Evaluate Continuity Quality of Power Supply in Hospital Devices. Energies 2021, 14, 486. [Google Scholar] [CrossRef]
  6. Stawowy, M.; Rosiński, A.; Siergiejczyk, M.; Perlicki, K. Quality and Reliability-Exploitation Modeling of Power Supply Systems. Energies 2021, 14, 2727. [Google Scholar] [CrossRef]
  7. Stawowy, M. Identifying status of an ICT system using rough sets. Arch. Transp. Syst. Telemat. 2014, 7, 1. [Google Scholar]
  8. Stawowy, M.; Kasprzyk, Z. Identifying and simulation of status of an ICT system using rough sets. In Theory and Engineering of Complex Systems and Dependability Proceedings of the Tenth International Conference on Dependability and Complex Systems DepCoS-RELCOMEX, Advances in Intelligent Systems and Computing, Brunów, Poland, 29 June–3 July 2015; Springer International Publishing: Berlin/Heidelberg, Germany, 2015; Volume 365. [Google Scholar] [CrossRef]
  9. Corsi, S. Voltage Control and Protection in Electrical Power Systems; Springer: Berlin/Heidelberg, Germany, 2015. [Google Scholar] [CrossRef]
  10. Sarma, J.D.G.M.S.; Overbye, T. Power System Analysis and Design; Thomson: Toronto, ON, Canada, 2008. [Google Scholar]
  11. Sumper, A.; Baggini, A. Electrical Energy Efficiency: Technologies and Applications; John Wiley & Sons Ltd.: Hoboken, NJ, USA, 2012. [Google Scholar]
  12. Huang, W.; Du, E.; Capuder, T.; Zhang, X.; Zhang, N.; Strbac, G.; Kang, C. Reliability and Vulnerability Assessment of Multi-Energy Systems: An Energy Hub Based Method. IEEE Trans. Power Syst. 2021, 36, 5. [Google Scholar] [CrossRef]
  13. Sozański, J. Niezawodność i Jakość Pracy Systemu Elektroenergetycznego; WNT: Warszawa, Poland, 1990. [Google Scholar]
  14. Xiong, F.; Ji, X.; Wei, D.; Li, G. Reliability Assessment of Micro Grid Power Supply System Based on D-Vine Copula Model. In Proceedings of the Advanced Manufacturing and Automation X. IWAMA 2020, Lecture Notes in Electrical Engineering. Zhanjiang, China, 12–13 October 2020; Springer: Singapore, 2021; Volume 737. [Google Scholar] [CrossRef]
  15. Wu, X.; Zhao, W.; Wang, X.; Li, H. An MILP-Based Planning Model of a Photovoltaic/Diesel/Battery Stand-Alone Microgrid Considering the Reliability. IEEE Trans. Smart Grid 2021, 12, 5. [Google Scholar] [CrossRef]
  16. Baggini, A. (Ed.) Handbook of Power Quality; John Wiley & Sons: Hoboken, NJ, USA, 2008. [Google Scholar]
  17. Wang, Y.; Nie, L.; Dang, Y.; Deng, G.; Li, J.; Li, P.; Wang, P.; Luo, H.; Qin, Z.; Chen, S. Fault Prediction of Power Electronic Devices in Mobile UPS System. In Proceedings of the 2021 IEEE 16th Conference on Industrial Electronics and Applications (ICIEA), Chengdu, China, 1–4 August 2021. [Google Scholar] [CrossRef]
  18. Keyhani, A.; Marwali, M. Smart Power Grids; Springer: Berlin/Heidelberg, Germany, 2011. [Google Scholar] [CrossRef]
  19. BLobov, N.; Kolpakhch’yan, P.G.; Belokopytov, S.A.; Madzhid, A.D.R.A. A choice of the structure of the photovoltaic system for power supply. Russ. Electr. Eng. 2015, 86, 7. [Google Scholar] [CrossRef]
  20. MMahmoud, S.; AL-Sunni, F.M. Control and Optimization of Distributed Generation Systems; Springer International Publishing: Berlin/Heidelberg, Germany, 2015. [Google Scholar] [CrossRef]
  21. Azaza, M.; Eriksson, D.; Wallin, F. A study on the viability of an on-site combined heat- and power supply system with and without electricity storage for office building. Energy Convers. Manag. 2020, 213, 112807. [Google Scholar] [CrossRef]
  22. Liu, J.; Chen, X.; Cao, S.; Yang, H. Overview on hybrid solar photovoltaic-electrical energy storage technologies for power supply to buildings. Energy Convers. Manag. 2019, 187, 103–121. [Google Scholar] [CrossRef]
  23. Banik, R.; Das, P. A Review on Architecture, Performance and Reliability of Hybrid Power System. J. Inst. Eng. India Ser. B 2020, 101, 527–539. [Google Scholar] [CrossRef]
  24. Wang, L. (Ed.) Modeling and Control of Sustainable Power Systems; Springer: Berlin/Heidelberg, Germany, 2012. [Google Scholar] [CrossRef]
  25. Krzykowski, M.; Krzykowska, K. Will the European Commission’s policy hinder gas supplies to Central and Eastern European countries? OPAL case decision. Energy Policy 2017, 110, 534–541. [Google Scholar] [CrossRef]
  26. Shinde, K.D.; Mane, P.B. Augmenting rooftop solar energy penetration ratio with secondary distribution network using smart inverter for maximum power transfer capacity for subordinate grid—A review. Energy Sources Part A Recover. Util. Environ. Eff. 2019, 41, 6. [Google Scholar] [CrossRef]
  27. Xu, X.; Hu, W.; Liu, W.; Du, Y.; Huang, R.; Huang, Q.; Chen, Z. Risk management strategy for a renewable power supply system in commercial buildings considering thermal comfort and stochastic electric vehicle behaviors. Energy Convers. Manag. 2021, 230, 113831. [Google Scholar] [CrossRef]
  28. Nagaraja, Y.; Kumar, M.V.; Raju, T.D. Analysis and design of a robust controller for a grid-connected photovoltaic power plant. Int. J. Ambient Energy 2018, 41, 326–333. [Google Scholar] [CrossRef]
  29. Stasiuk, O.I.; Grishchuk, R.V.; Goncharova, L.L. Mathematical differential models and methods for assessing the cybersecurity of intelligent computer networks for control of technological processes of railway power supply. Cybern. Syst. Anal. 2018, 54, 4. [Google Scholar] [CrossRef]
  30. Jahid, A.; Monju, M.K.H.; Hossain, M.S.; Hossain, M.F. Hybrid power supply solutions for off-grid green wireless networks. Int. J. Green Energy 2019, 16, 1. [Google Scholar] [CrossRef]
  31. Popel’, O.S.; Tarasenko, A.B. Hybrid electric energy storages: Their specific features and application (review). Therm. Eng. 2018, 65, 5. [Google Scholar] [CrossRef]
  32. Liaqat, M.; Khan, M.G.; Fazal, M.R.; Ghadi, Y.; Adnan, M. Multi-Criteria Storage Selection Model for Grid-Connected Photovoltaics Systems. IEEE Access 2021, 9, 115506–115522. [Google Scholar] [CrossRef]
  33. Billinton, R.; Allan, R.N. Reliability Evaluation of Power Systems; Plenum Press: New York, NY, USA, 1996. [Google Scholar]
  34. Kozyra, J.; Łukasik, Z.; Kuśmińska-Fijałkowska, A.; Kaszuba, P. The impact of selected variants of remote control on power supply reliability indexes of distribution networks. Electr. Eng. 2021, 104, 1255–1264. [Google Scholar] [CrossRef]
  35. Ghorani, R.; Fattaheian-Dehkordi, S.; Farrokhi, M.; Fotuhi-Firuzabad, M.; Lehtonen, M. Modeling and Quantification of Power System Resilience to Natural Hazards: A Case of Landslide. IEEE Access 2021, 9, 80300–80309. [Google Scholar] [CrossRef]
  36. Kalpana, S.; Saranya, N.; Saundariya, K. An IoT Based Real-Time Monitoring and Controlling of Sub-Station Equipment. In Proceedings of the 2021 International Conference on System, Computation, Automation and Networking (ICSCAN), Puducherry, India, 30–31 July 2021. [Google Scholar] [CrossRef]
  37. Zhou, K.; Wei, S.; Yang, S. Time-of-use pricing model based on power supply chain for user-side microgrid. Appl. Energy 2019, 248, 35–43. [Google Scholar] [CrossRef]
  38. Zhu, Q.; Xu, S.; Sun, J.; Li, X.; Zhou, D. Energy efficiency evaluation of power supply system: A data-driven approach based on shared resources. Appl. Energy 2022, 312, 118683. [Google Scholar] [CrossRef]
  39. SSoliman, A.; Mantawy, A.H. Modern Optimization Techniques with Applications in Electric Power Systems; Springer Science + Business Media: Berlin, Germany, 2012. [Google Scholar] [CrossRef]
  40. Borlase, S. (Ed.) Smart Grids: Infrastructure, Technology, and Solutions; Taylor & Francis Group: London, UK, 2012. [Google Scholar]
  41. Buchholz, B.M.; Styczynski, Z. Smart Grids–Fundamentals and Technologies in Electricity Networks; Springer: Berlin/Heidelberg, Germany, 2014. [Google Scholar] [CrossRef]
  42. Chen, S.; Ho, T.; Mao, B. Maintenance schedule optimisation for a railway power supply system. Int. J. Prod. Res. 2013, 51, 4896–4910. [Google Scholar] [CrossRef]
  43. Konč, M.; Doleček, R.; Černý, O.; Dobeš, I. The effects of faults at the distribution systems on the traction power supply systems. In Proceedings of the 26th International Conference Radioelektronika (RADIOELEKTRONIKA 2016), Kosice, Slovakia, 19–20 April 2016. [Google Scholar] [CrossRef]
  44. Lin, S.; Li, N.; Feng, D.; Guo, X.; Pan, W.; Wang, J.; Yang, C. A preventive opportunistic maintenance method for railway traction power supply system based on equipment reliability. Railw. Eng. Sci. 2020, 28, 199–211. [Google Scholar] [CrossRef]
  45. Paś, J.; Siergiejczyk, M. Interference impact on the electronic safety system with a parallel structure. Diagnostyka 2016, 17, 1. [Google Scholar]
  46. Gao, D.; Li, G.; Yu, J. Does digitization improve green total factor energy efficiency? Evidence from Chinese 213 cities. Energy 2022, 247, 123395. [Google Scholar] [CrossRef]
  47. Liu, X.; Nielsen, P.S. A hybrid ICT-solution for smart meter data analytics. Energy 2016, 115, 1710–1722. [Google Scholar] [CrossRef] [Green Version]
  48. Paś, J.; Rosiński, A. Selected issues regarding the reliability-operational assessment of electronic transport systems with regard to electromagnetic interference. Eksploat. I Niezawodn.-Maint. Reliab. 2017, 19, 375–381. [Google Scholar] [CrossRef]
  49. He, Y.; Liang, X.-D.; Deng, F.-M.; Li, Z. Emergency Supply Chain Management Based on Rough Set—House of Quality. Int. J. Autom. Comput. 2019, 16, 297–309. [Google Scholar] [CrossRef]
  50. Zhu, Z.; Li, H.; Dai, G.; Abraham, A.; Yang, W. A rough set multi-knowledge extraction algorithm and its formal concept analysis. In Proceedings of the 2014 14th International Conference on Intelligent Systems Design and Applications, Okinawa, Japan, 28–30 November 2014. [Google Scholar] [CrossRef]
  51. Liu, X.; Jia, W.; Wang, Y.; Guo, H.; Ren, Y.; Li, Z. Knowledge discovery and semantic learning in the framework of axiomatic fuzzy set theory. WIREs Data Min. Knowl. Discov. 2018, 8, e1268. [Google Scholar] [CrossRef]
  52. Rabie, A.H.; Saleh, A.I.; Ali, H.A. Smart electrical grids based on cloud, IoT, and big data technologies: State of the art. J. Ambient. Intell. Humaniz. Comput. 2021, 12, 9449–9480. [Google Scholar] [CrossRef]
  53. Xie, Z.; Du, L.; Lv, X.; Wang, Q.; Huang, J.; Fu, T.; Li, S. Evaluation and Analysis of Battery Technologies Applied to Grid-Level Energy Storage Systems Based on Rough Set Theory. Trans. Tianjin Univ. 2020, 26, 228–235. [Google Scholar] [CrossRef] [Green Version]
  54. Xie, H.; Hu, X.; Peng, Z.; Yao, X.; Chen, Y. A Method of Electricity Consumption Behavior Analysis Based on Rough Set Fuzzy Clustering. In Proceedings of the 2nd IEEE Conference on Energy Internet and Energy System Integration (EI2), Beijing, China, 20–22 October 2018. [Google Scholar] [CrossRef]
  55. Hu, C.H. Distribution Network Fault Location Based on Rough Set and Data Fusion. In Proceedings of the 2019 IEEE 4th Advanced Information Technology, Electronic and Automation Control Conference (IAEAC), Chengdu, China, 20–22 December 2019. [Google Scholar] [CrossRef]
  56. Liu, X.; Zhao, X.; Jin, P.; Lu, T. Optimization Strategy for New Energy Consumption Based on Intuitionistic Fuzzy Rough Set Theory. In Proceedings of the 39th Chinese Control Conference (CCC), Shenyang, China, 27–29 July 2020. [Google Scholar] [CrossRef]
  57. Li, Y.; Ren, X.; Niu, J. Application of rough sets theory in forecast of power generation for grid-connected photovoltaic system. In Proceedings of the 27th Chinese Control and Decision Conference (2015 CCDC), Qingdao, China, 23–25 May 2015. [Google Scholar] [CrossRef]
  58. Lewczuk, K.; Siedlecka-Wójcikowska, T.; Zabielska, A. Selected aspects of modelling RFID systems in supply chains. J. Konbin 2022, 52, 77–88. [Google Scholar] [CrossRef]
  59. Bednarek, M.; Dąbrowski, T.; Olchowik, W. Selected practical aspects of communication diagnosis in the industrial network. J. Konbin 2019, 49, 383–404. [Google Scholar] [CrossRef] [Green Version]
  60. Krzykowska-Piotrowska, K.; Siergiejczyk, M. On the Navigation, Positioning and Wireless Communication of the Companion Robot in Outdoor Conditions. Energies 2022, 15, 4936. [Google Scholar] [CrossRef]
  61. Duer, S. Applications of an artificial intelligence for servicing of a technical object. Neural Comput. Appl. 2013, 22, 955–968. [Google Scholar] [CrossRef]
  62. Duer, S.; Scaticailov, S.; Paś, J.; Duer, R.; Bernatowicz, D. Taking decisions in the diagnostic intelligent systems on the basis information from an artificial neural network. MATEC Web Conf. 2018, 178, 07003. [Google Scholar] [CrossRef]
  63. Szkopiński, J.; Kochan, A. Maximization of Energy Efficiency by Synchronizing the Speed of Trains on a Moving Block System. Energies 2023, 16, 1764. [Google Scholar] [CrossRef]
  64. Kuznetsov, V.; Kardas-Cinal, E.; Gołębiowski, P.; Liubarskyi, B.; Gasanov, M.; Riabov, I.; Kondratieva, L.; Opala, M. Method of Selecting Energy-Efficient Parameters of an Electric Asynchronous Traction Motor for Diesel Shunting Locomotives—Case Study on the Example of a Locomotive Series ChME3 (ЧMЭ3, ČME3, ČKD S200). Energies 2022, 15, 317. [Google Scholar] [CrossRef]
  65. Celiński, I.; Burdzik, R.; Młyńczak, J.; Kłaczyński, M. Research on the Applicability of Vibration Signals for Real-Time Train and Track Condition Monitoring. Sensors 2022, 22, 2368. [Google Scholar] [CrossRef]
  66. Paś, J.; Klimczak, T. Selected issues of the reliability and operational assessment of a fire alarm system. Ekspolatacja I Niezawodn.-Maint. Reliab. 2019, 21, 553–561. [Google Scholar] [CrossRef]
  67. Kwasiborska, A.; Skorupski, J. Assessment of the Method of Merging Landing Aircraft Streams in the Context of Fuel Consumption in the Airspace. Sustainability 2021, 13, 12859. [Google Scholar] [CrossRef]
  68. Kwasiborska, A.; Skorupski, J. Analysis of the Process of Merging Air Traffic Streams. Case Study of TMA Warsaw. In Management Perspective for Transport Telematics; Jerzy, M., Ed.; Communications in Computer and Information Science; Springer: Switzerland, Poland, 2018; pp. 320–334. [Google Scholar] [CrossRef]
  69. Łukasiak, J.; Wiśnios, M.; Rosiński, A. Method for Evaluating the Effectiveness of Electrical Circuit Protection with Miniature Fuse-Links. Energies 2023, 16, 960. [Google Scholar] [CrossRef]
  70. Siergiejczyk, M.; Kasprzyk, Z.; Rychlicki, M.; Szmigiel, P. Analysis and Assessment of Railway CCTV System Operating Reliability. Energies 2022, 15, 1701. [Google Scholar] [CrossRef]
  71. Kornaszewski, M. Modelling of exploitation process of the railway traffic control device. WUT J. Transp. Eng. 2019, 124, 53–63. [Google Scholar] [CrossRef]
  72. Jacyna, M.; Szczepański, E.; Izdebski, M.; Jasiński, S.; Maciejewski, M. Characteristics of event recorders in Automatic Train Control systems. Arch. Transp. 2018, 46, 61–70. [Google Scholar] [CrossRef]
  73. Karolak, J.; Daszczuk, W.B.; Grabski, W.; Kochan, A. Temporal Verification of Relay-Based Railway Traffic Control Systems Using the Integrated Model of Distributed Systems. Energies 2022, 15, 9041. [Google Scholar] [CrossRef]
  74. Dai, Q.; Shi, L.; Ni, Y. Risk Assessment for Cyberattack in Active Distribution Systems Considering the Role of Feeder Automation. IEEE Trans. Power Syst. 2019, 34, 3230–3240. [Google Scholar] [CrossRef]
  75. Siergiejczyk, M.; Stawowy, M. Modelling of uncertainty for continuity quality of power supply. In Proceedings of the Risk, Reliability and Safety: Innovating Theory and Practice, Glasgow, Scotland, 25–29 September 2016; CRC Press/Balkema: Boca Raton, FL, USA, 2017. [Google Scholar]
  76. Li, H.; Chen, M.; Yang, B.; Blaabjerg, F.; Xu, D. Fast Fault Protection Based on Direction of Fault Current for the High-Surety Power-Supply System. IEEE Trans. Power Electron. 2019, 34, 6. [Google Scholar] [CrossRef] [Green Version]
  77. Fuhg, J.N.; Böhm, C.; Bouklas, N.; Fau, A.; Wriggers, P.; Marino, M. Model-data-driven constitutive responses: Application to a multiscale computational framework. Int. J. Eng. Sci. 2022, 167, 103522. [Google Scholar] [CrossRef]
  78. Pawlak, Z. Rough Sets; Research Report PAS 431; Institute of Computer Science, Polish Academy of Sciences: Warsaw, Poland, 1981. [Google Scholar]
  79. Pawlak, Z. Rough Sets—A New Mathematical Method of Data Analysis; Institute of Computer Science, Polish Academy of Sciences: Warsaw, Poland, 1995. [Google Scholar]
  80. Hou, Z.; Lian, Z.; Yao, Y.; Yuan, X. Cooling-load prediction by the combination of rough set theory and an artificial neural-network based on data-fusion technique. Appl. Energy 2006, 83, 9. [Google Scholar] [CrossRef]
  81. de Mello Oliveira, A.B.; Moreno, R.L.; Ribeiro, E.R. Short-Circuit Fault Diagnosis Based on Rough Sets Theory for a Single-Phase Inverter. IEEE Trans. Power Electron. 2019, 34, 4747–4764. [Google Scholar] [CrossRef]
  82. Wiatr, J. Generating Sets in Building Emergency Power Systems; MEDIUM Publishing House: Warsaw, Poland, 2009. [Google Scholar]
  83. Wiatr, J.; Miegoń, M. UPS Power Supplies and Accumulator Batteries in Emergency Power Systems; MEDIUM Publishing House: Warsaw, Poland, 2008. [Google Scholar]
  84. Stawowy, M.; Targosiński, T. The use of rough set to estimate the quality of objects recognition and localization. In Proceedings of the Risk, Reliability and Safety: Innovating Theory and Practice: Proceedings of ESREL 2016, Glasgow, Scotland, 25–29 September 2016; CRC Press/Balkema: Boca Raton, FL, USA, 2016. [Google Scholar]
Figure 1. The power supply of the ICT system comes from three sources of supply.
Energies 16 04621 g001
Figure 2. Relations in the power supply of ICT system from three sources of supply.
Energies 16 04621 g002
Figure 3. Dependence graph of the system reliability indicator as a function of the efficiency coefficient of this system.
Energies 16 04621 g003
Figure 4. Dependence graph of the system reliability indicator as a function of the non-operational primary power supply coefficient of this system.
Energies 16 04621 g004
Table 1. Exemplary, Binary Decision Table for Transition to Repair State (Failure).
ObjectFull FitnessServiceFailure
1YESNONO
2NONONO
3NOYESNO
4NOYESNO
5NONOYES
6NOYESYES
7NOYESYES
8NONOYES
Table 2. Exemplary, Binary Decision Table for Transition to Repair State (Failure), Including Levels of Failure.
ObjectFull FitnessLevel of Fitness Below 50%Level of Fitness Below 75%Failure
1YESNONONO
2NOYESYESNO
3NONOYESNO
4NOYESYESYES
5NONOYESYES
6NONONOYES
Table 3. Exemplary, Binary Table for Transition to Repair State (Failure).
ObjectFull FitnessNon-Operational Primary Power SupplyNon-Operational Backup Power SupplyNon-Operational Standby Power SupplyFailure
1YESNONONONO
2NOYESNONONO
3NONOYESNONO
4NOYESYESNONO
5NONONOYESNO
6NOYESNOYESNO
7NONOYESYESNO
8NOYESYESYESYES
9NOYESNONOYES
10NONOYESNOYES
11NOYESYESNOYES
12NONONOYESYES
13NOYESNOYESYES
14NONOYESYESYES
Table 4. Decision Table for Transition to Repair (failure) State Using Failure Level.
ObjectFull FitnessNon-Operational Primary Power SupplyNon-Operational Backup Power SupplyNon-Operational Standby Power SupplyFailure
10.99990000
200.00009000
3000.00000800
400.000090.00000800
50000.000010
600.0000900.000010
7000.0000080.000010
800.000090.0000080.000010.00007
900.00009000.00007
10000.00000800.00007
1100.000090.00000800.00007
120000.000010.00007
1300.0000900.000010.00007
14000.0000080.000010.00007
Disclaimer/Publisher’s Note: The statements, opinions and data contained in all publications are solely those of the individual author(s) and contributor(s) and not of MDPI and/or the editor(s). MDPI and/or the editor(s) disclaim responsibility for any injury to people or property resulting from any ideas, methods, instructions or products referred to in the content.

