Article

Performance Analysis of Variable Cross-Section TEGs under Constant Heat Flux Conditions

1
Hubei Key Laboratory of Theory and Application of Advanced Materials Mechanics, Wuhan University of Technology, Wuhan 430070, China
2
State Key Laboratory of Advanced Technology for Materials Synthesis and Processing, Wuhan University of Technology, Wuhan 430070, China
*
Author to whom correspondence should be addressed.
Energies 2023, 16(11), 4473; https://doi.org/10.3390/en16114473
Submission received: 26 April 2023 / Revised: 20 May 2023 / Accepted: 24 May 2023 / Published: 1 June 2023
(This article belongs to the Special Issue Advances in Thermal Energy Storage and Applications)

Abstract

:
In this paper, five shapes of thermoelectric generator (TEG) models (cylindrical, barrel shaped, hourglass shaped, cup shaped, and inverse cup shaped) are built under the boundary conditions of heat flux at the hot end and convection at the cold end of the TEGs. Based on the numerical simulation results, the configuration of the variable cross-section can effectively boost the performance of TEGs. Remarkably, the hourglass-shaped TEG generated the maximum output power and efficiency, which were 69.62% and 70.96% higher than that of the conventional cylindrical TEG, respectively. The results indicate that the hourglass shape is beneficial to enlarge the temperature difference between the two ends of the TEG, which results in performance improvement. In addition, the effects of heat flux and convection on the performance of TEGs are explored and discussed. After choosing the appropriate boundary conditions, the relationships between the maximum output power and efficiency and the shape factor of the hourglass-shaped TEG are obtained according to the fitting results. Finally, some conclusions are drawn to provide guidance for TEG applications.

1. Introduction

Over the past decades, the massive increase in fossil fuel consumption has led to a severe energy crisis and a series of environmental problems. As a promising energy converter, thermoelectric generators (TEGs) have received the extensive attention of scientists. Due to their outstanding advantages such as direct energy conversion, no moving parts, no working fluid inside the device, no pollution and long lifespan [1], TEGs are readily adopted in a variety of fields, such as recovering power from a semiconductor circuit [2] and converting the wasted heat from exhaust system [3,4]. However, the TEGs are hampered in achieving wider application due to their low conversion efficiency and power density.
Hence, improving the output performance of the TEG has become the key point for the development of TEGs. Nowadays, researchers mainly focus on two directions to boost the performance of TEGs. One is to improve the figure of merit of the thermoelectric (TE) material, Z T = S 2 σ k T [5], where s , σ , k and T are the Seebeck coefficient, electrical conductivity, thermal conductivity, and temperature of TE material, respectively. Besides the TE materials, geometry modification of the legs also leads to a significant effect on the performance of TEGs [6].
Although notable progress has been made on TE materials in recent years, the geometry optimization of TEGs still needs more effort. Generally, the legs of the TEG are designed with a rectangular cross-section, and the cross-sectional area is constant along the leg. A few studies were carried out to propose some novel leg shapes to enhance the performance of TEGs [7,8,9]. Ugur et al. [7] compared the output performance of four shapes of TEGs with rectangular-, cylindrical-, trapezoidal-, or octagonal-shaped legs. They found that the deviations in output power for the four shapes of TEGs were very small. Ahmet et al. [8] mainly focused on the TEGs with trapezoid legs. Compared to the original rectangular cross-section TEG. the TEGs with trapezoid legs performed better in efficiency but worse in output power. Furthermore, the differences in output power and efficiency among TEGs with the original cylindrical leg, rotated leg, and coaxial leg were also explored [9]. It was concluded that both the output power and the efficiency of coaxial leg model were slightly higher than that of the original leg model, and the rotated leg model presented no performance enhancement. With an attempt at an unconventional shape design, Alkhadher et al. [10] found that the TEGs with an I leg, X leg, trap leg, and Y leg cannot obtain greater performance than the conventional rectangular TEG. In addition, the TEGs with different shapes of hollow structures were compared by Li et al. [11]. A valuable conclusion was gained that the TEG with triangular hollow legs could improve the output power. Taking modifying the cross-section of the TEG as the design idea, some researchers discovered some untraditional TEGs with fine performance [12,13,14]. Liu et al. [12] proposed a shape factor, m, to characterize the variable cross-section leg, and the analysis results revealed that the variable legs always boosted the efficiency. Dhruv et al. [13] studied an asymmetrical TEG having an N-type leg with exponential area. The result showed that the shape change of the N-type leg had a strong influence on the power and efficiency. Ya et al. [14] combined optimization algorithms with the commercial software COMSOL to determine the optimal shape of a TEG with variable cross-section legs. The output power of the optimized TEGs increased with a significant change in thermal resistance and internal resistance. Wang et al. [15] specified the leg shape with a quadratic function and put forward an analytical model to calculate the performance of TEGs with varied leg cross-sections. They found that the shape variation had little enhancement on the performance of the TEG when the volume was fixed. Though it is tough to fabricate a TEG with an unconventional structure through traditional manufacturing approaches, the remarkable development of 3D printing technology provides the possibility to fulfill the fabrication of TEGs with a complex structure [16,17,18]. Therefore, it is meaningful to design a TEG with nontraditional shapes, and a good design of TEG is a prerequisite for high performance.
The thermal boundary condition also needs consideration for the design of TEGs. The constant-temperature boundary condition is frequently adopted in the simulations of TEGs [19,20,21]. However, the constant-temperature boundary condition is not applicable to all working scenarios of TEGs. In a solar TE generation system, the heat flux boundary condition is more reasonable as the hot-side boundary condition [22]. Natural convection is also more suitable for some wearable TEGs [23]. In addition, water cooling or air cooling can only be imitated by implementing the convection at the cold side [24]. Different boundary conditions will result in different conclusions about TEGs. Sisik et al. [25] studied the performance of a group of legs with different shapes under different boundary conditions, the results revealed that the influence of the structure parameters on the performance of TEGs displayed diversity under different boundary conditions. Zhu et al. [26] discovered that reduced thickness, a bigger angle, and longer length would enhance both the output power and the efficiency of annular TEG when the heat flux was set at the hot side. However, when it came to the condition of constant temperature on both ends, an increase in the angle would lead to increased output power and decreased efficiency, while longer length resulted in a declined output power and incremental efficiency. Moreover, the thickness had little influence on both the output power and the efficiency. Ghada et al. [27] discussed the discrepancy in the output power of TEGs under the pulsed heat flux and steady-state heat flux boundary conditions. The output power under periodic heating could be increased by a maximum of 8.6 times compared to the case of steady-state heating. Therefore, a full investigation on the performance of TEGs under various boundary conditions is essential for the design of TEGs.
To identify a TEG with a new shape to obtain better performance, this paper proposes different shapes of TEGs with a variable cross-section, namely, barrel-shaped, cup-shaped, inverse cup-shaped, and hourglass-shaped TEGs. All TEGs maintain the same volume and length to better present the effect of the shape on the performance. The boundary conditions of heat flux at the hot end and convection at the cold end are adopted to imitate the real situation. In addition, the effects of the heat flux and the convection coefficient on the performance of different shapes of TEGs are investigated and compared. The TEG with the best performance is chosen for further exploration under appropriate boundary conditions. The results from this study will hopefully provide a new design approach for improving the performance of TEGs.

2. Materials and Methods
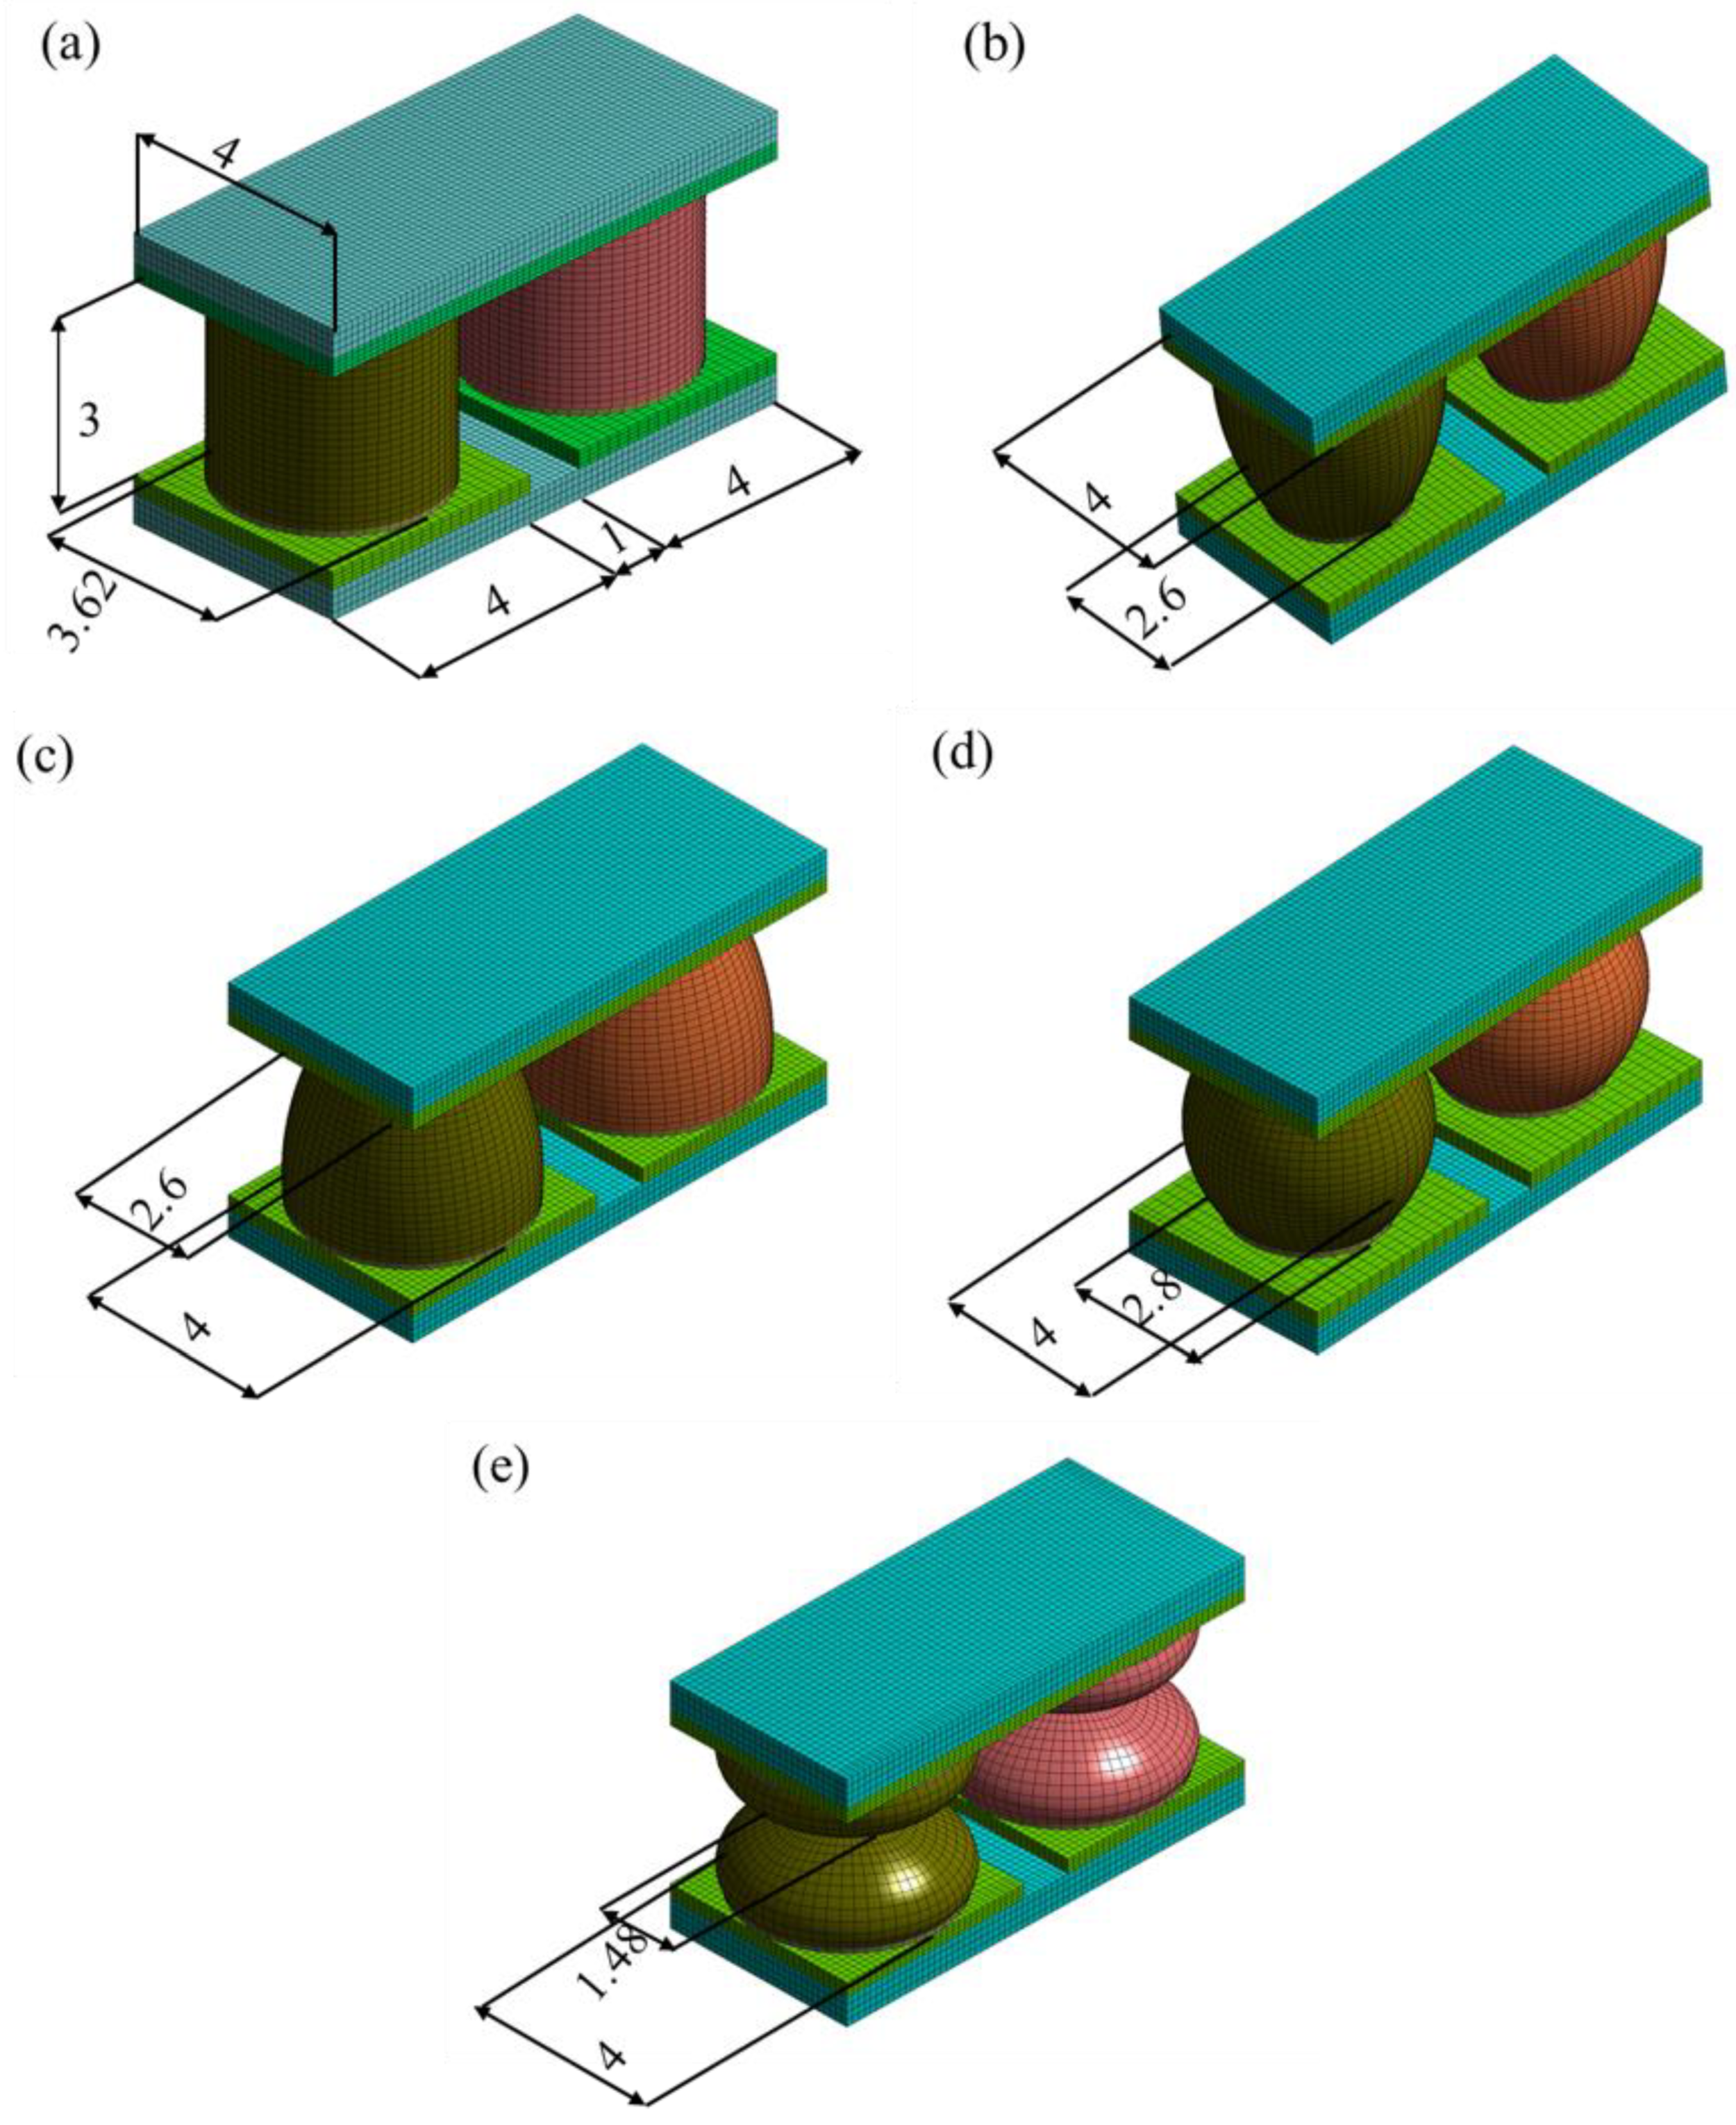
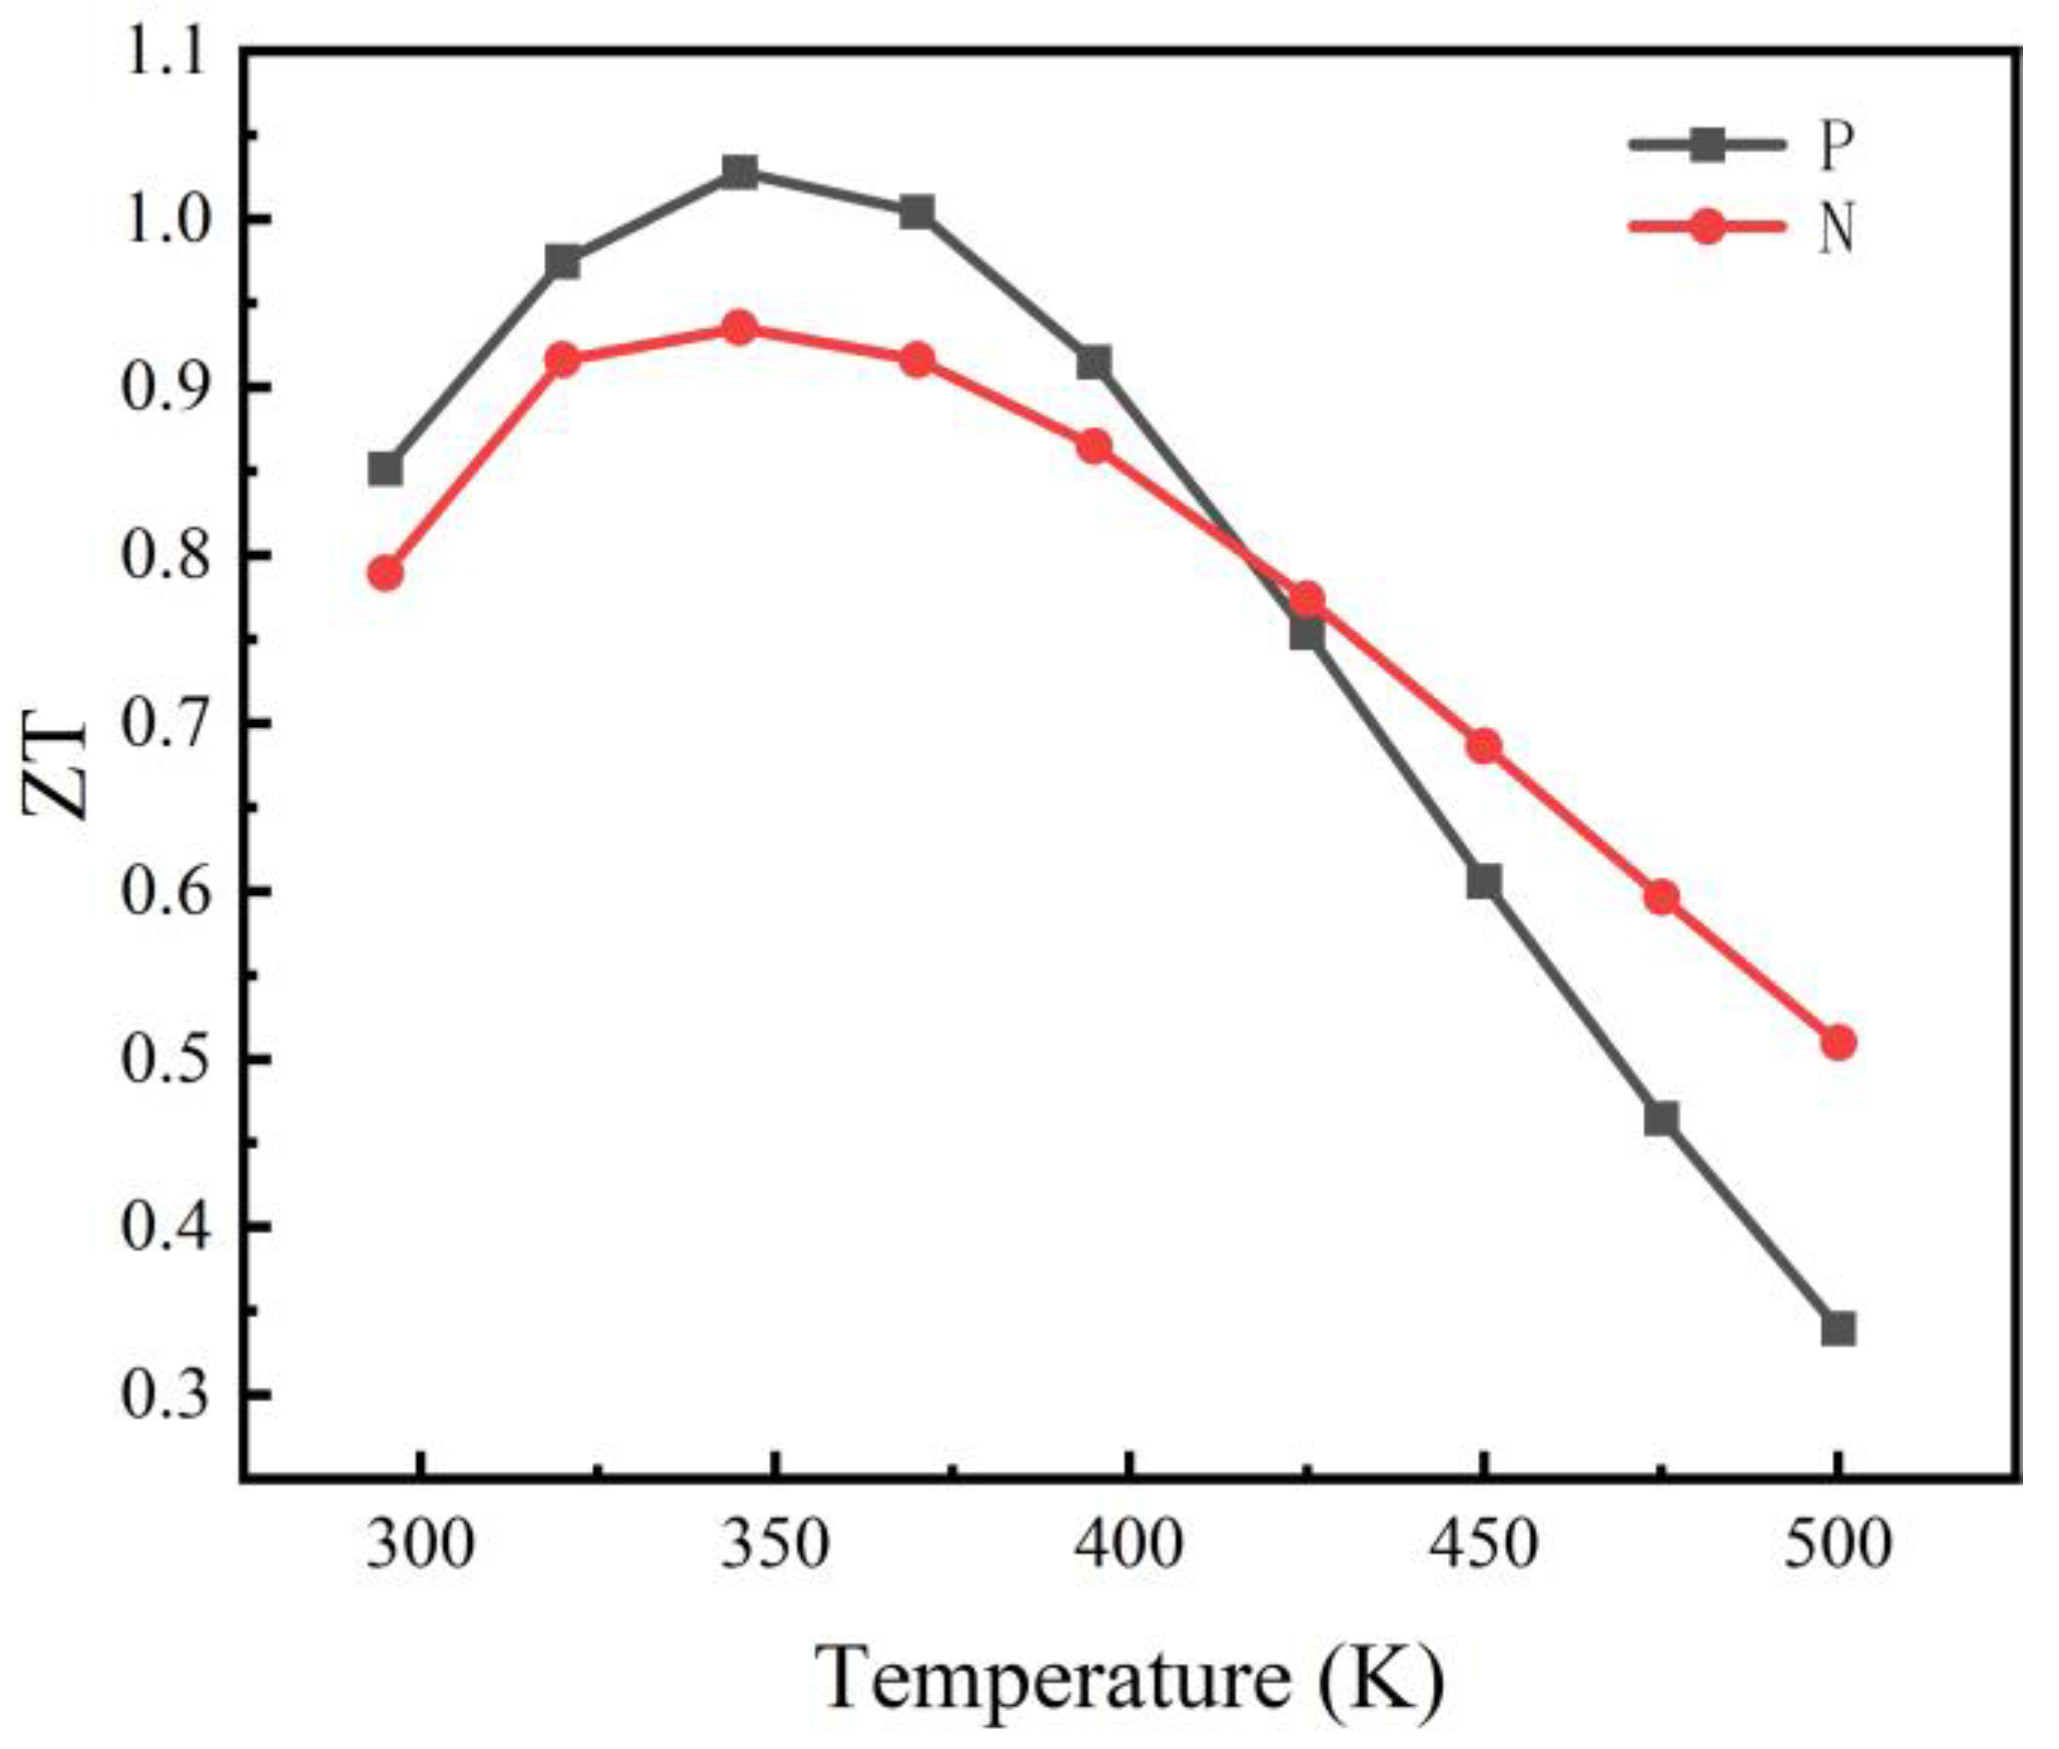
2.1. Physical Model

A typical TE couple consists of a couple of P- and N-type TE legs, ceramic plates, copper electrodes, and the welding layers. Ceramic plates are excellent electrical insulation and thermal conduction materials, aiming to impede electrical conduction while facilitating heat conduction. The welding layer can fix the TE legs. In this work, the volume and length of all legs stayed the same and the welding layers connected to the P- and N-type legs were cylindrical with the same radius of joining surface. The thickness of all welding layers was 0.1 mm. The geometric parameters of the ceramic plates and copper electrodes were 0.6   mm × 9   mm × 4   mm and 0.3   mm × 9   mm × 4   m m , respectively.
To build the TEGs with variable cross-section legs, the radius of the legs was taken as a polynomial function r ξ written as [15] follows:
r ξ = r 0 + a 1 ξ + a 2 ξ 2
where r 0 is the initial radius set as 2 mm, a 1   and   a 2   are two constant values, and ξ is the length along the TE leg. The equation for the volume of the legs can be calculated from the following:
V 0 = π L 0 1 r ξ 2 d ξ
By substituting Equation (2) into Equation (1), the parameter a1 can be expressed as follows:
a 1 = 1 4 6 r 0 3 a 2 + 36 r 0 2 + 4 r 0 a 2 3 a 2 2 / 5
Therefore, by changing the variable a 2 , a series of different legs with variable cross-section can be obtained. The dimension parameters of the legs are shown in Table 1, and the TEGs with these variable cross-section legs are depicted in Figure 1.
Because Bi2Te3-based TE materials are widely utilized in low temperatures (300 K–500 K) with excellent material performance, Bi2Te3-based TE materials were chosen as the main components of the TEG. In this study, the temperature dependence of the material properties is considered. The material properties used in this study are given in Table 2.
The ZT values of Bi2Te3 considered in this study are shown in Figure 2, the maximum ZT value of the P and N legs can reach 1.028 and 0.935, respectively.

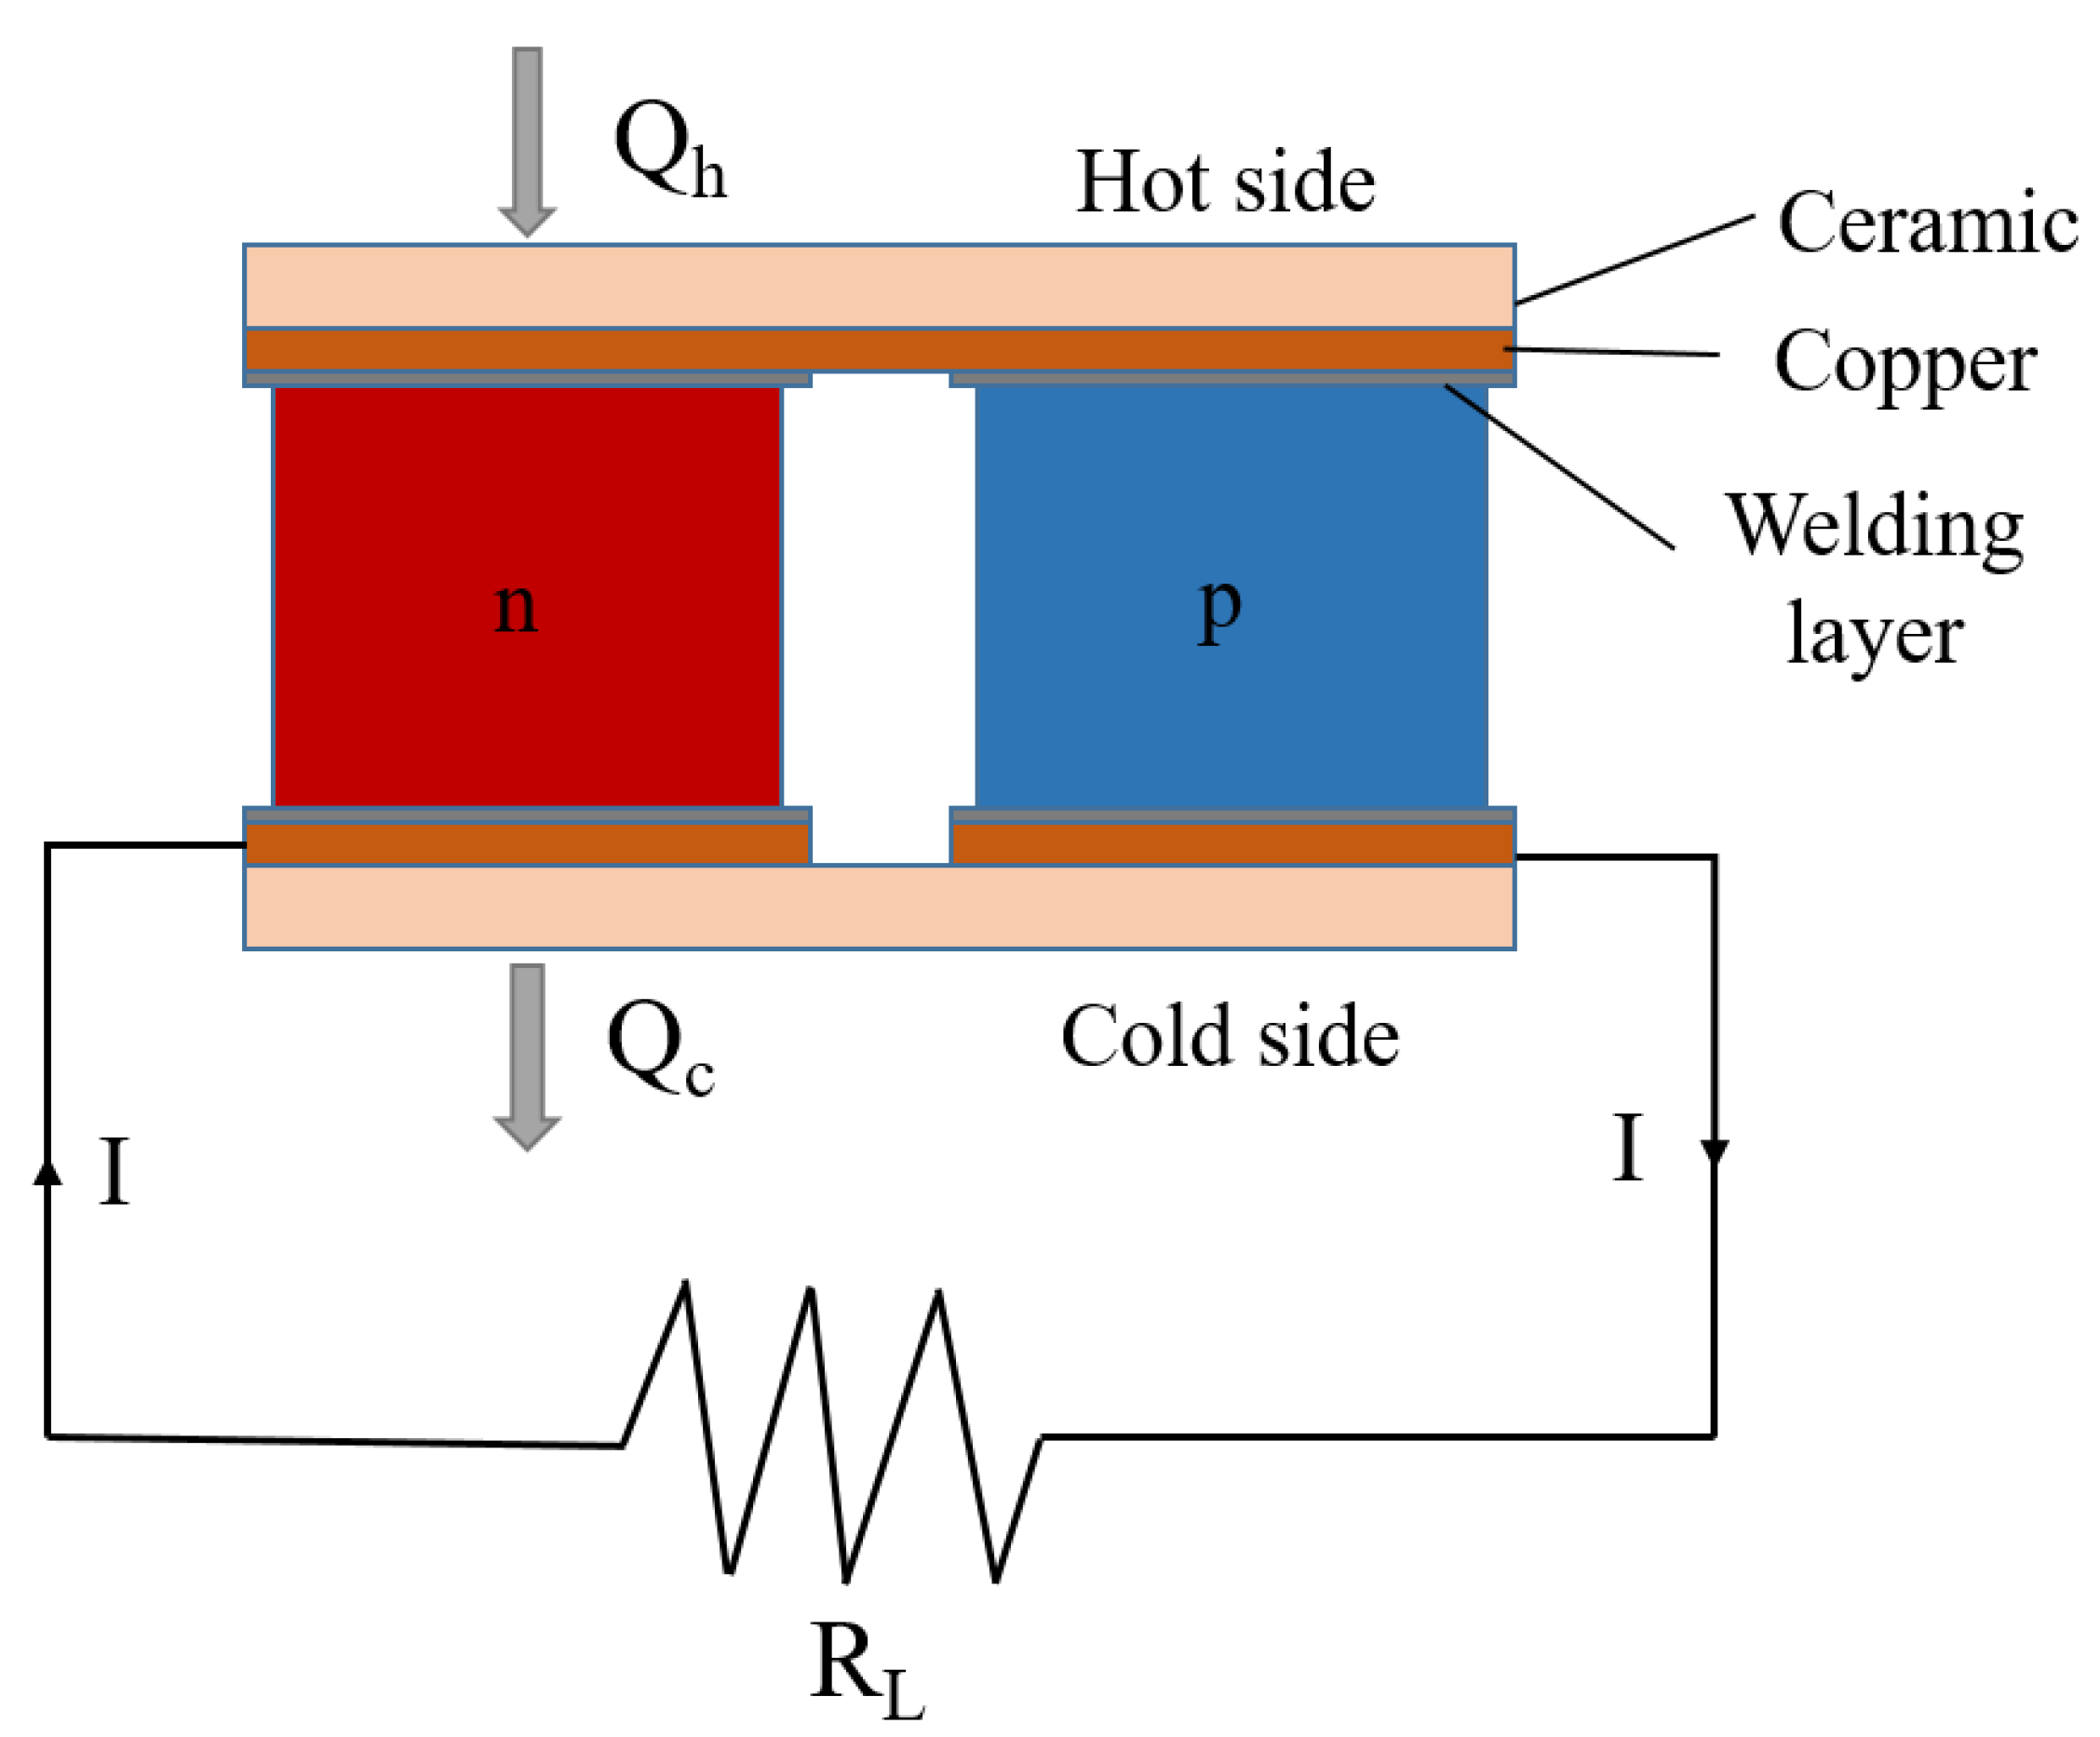
2.2. Boundary Conditions

Herein, the constant heat flux boundary condition was implemented at the hot end and the convection boundary condition was adopted at the cold end as shown in Figure 3. The environmental temperature around the cold side was set as room temperature (300.15 K). Except for the top and bottom surfaces, the other surfaces were thermally insulated. The contact thermal resistance and the contact electric resistance were ignored. In terms of the electrical setting, the lower-left copper block was coupled with the external resistance and the lower-right copper block was grounded. Moreover, it was assumed that good electrical and thermal contacts existed at all interfaces of the TEG [30].

2.3. Governing Equations

To obtain the TE behavior of the different shapes of TEGs, TE analyses were carried out through the software ANSYS Workbench. The referred coupled equation of heat transfer and electric current density can be expressed as [31] follows:
  · q = Q
  · J = 0
where q , Q , and J denote the heat flux vector, the joule heating energy, and the current density vector, respectively. The left of the Equation (4) represents the thermal energy transferred by conducting. Q and q can be rewritten as follows:
Q = J · E
q = k T + P J
E = V
where P is the Peltier coefficient and the E is the electric field, which can be obtained by the scalar electric potential V . In Equation (7), the first term represents the Fourier heat conduction, and the second term describes the Peltier effect.
P = α T
J = σ E α T
In Equation (10), the first term describes Ohms law, while the second term describes the Seebeck effect. When a temperature difference exists in the legs of the TEG, an open-circuit voltage is produced through the Seebeck effect. The voltage equation is given as
V oc = α Δ T
where V oc is the open-circuit voltage, and the Δ T is the temperature difference between the hot side and the cold side of the TEGs. When a load resistance is connected to the TEG to form a circuit, the electrical output power, P out , is generated and is defined as follows:
P out = Q h Q c = I 2 R L
where   Q h stands for the input heat absorbed form the hot side of the TEG and Q c represents the heat dissipated from the cold side. R L   is the external resistance, and I is the load current which can be written as follows:
I = α Δ T R L + R I
where R I is the internal resistance, so Equation ( 7 ) can rewrite as follows:
P out = α Δ T 2 ( R L + R I ) 2 R L
From the above equations, it is recognized that the maximum output power appears when R L = R I , that is,
P max = α Δ T 2 4 R L
The input heat power Q h is given as follows:
Q h = q · A h
where A h is the area of hot side. The TEG’s efficiency can be defined as the ratio of the output power, P out , to the input heat power ,   Q h :
η = P out Q h

3. Results and Discussion

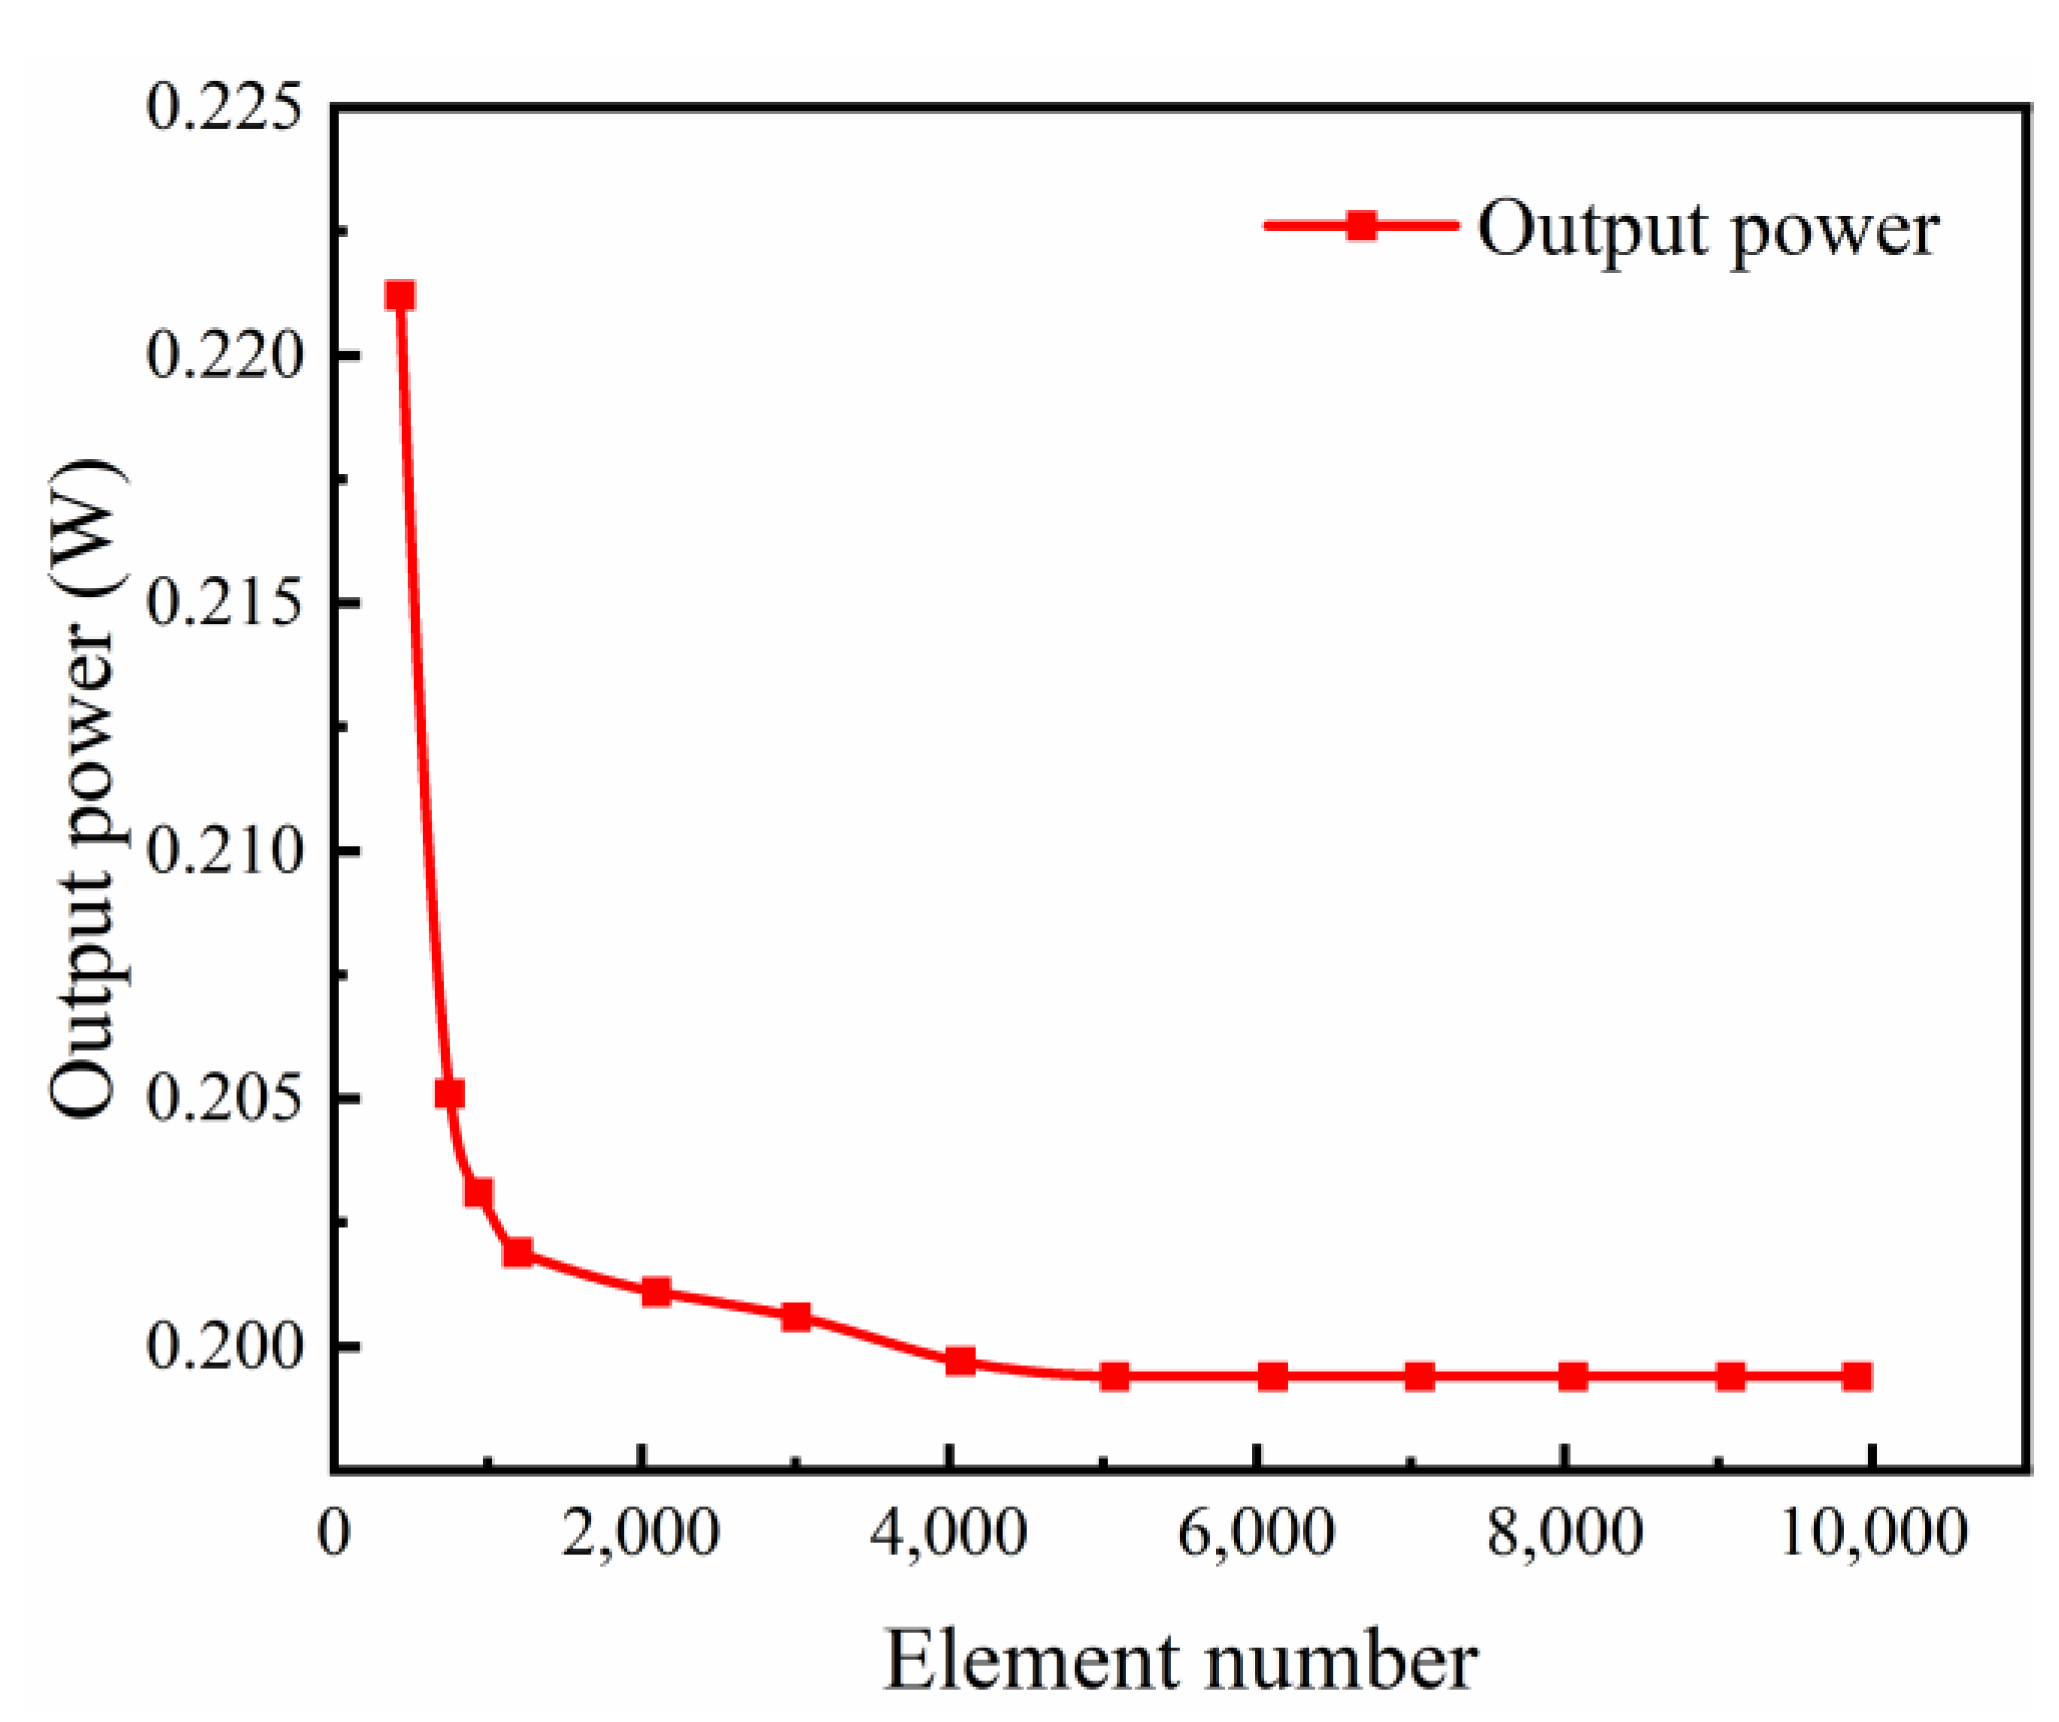
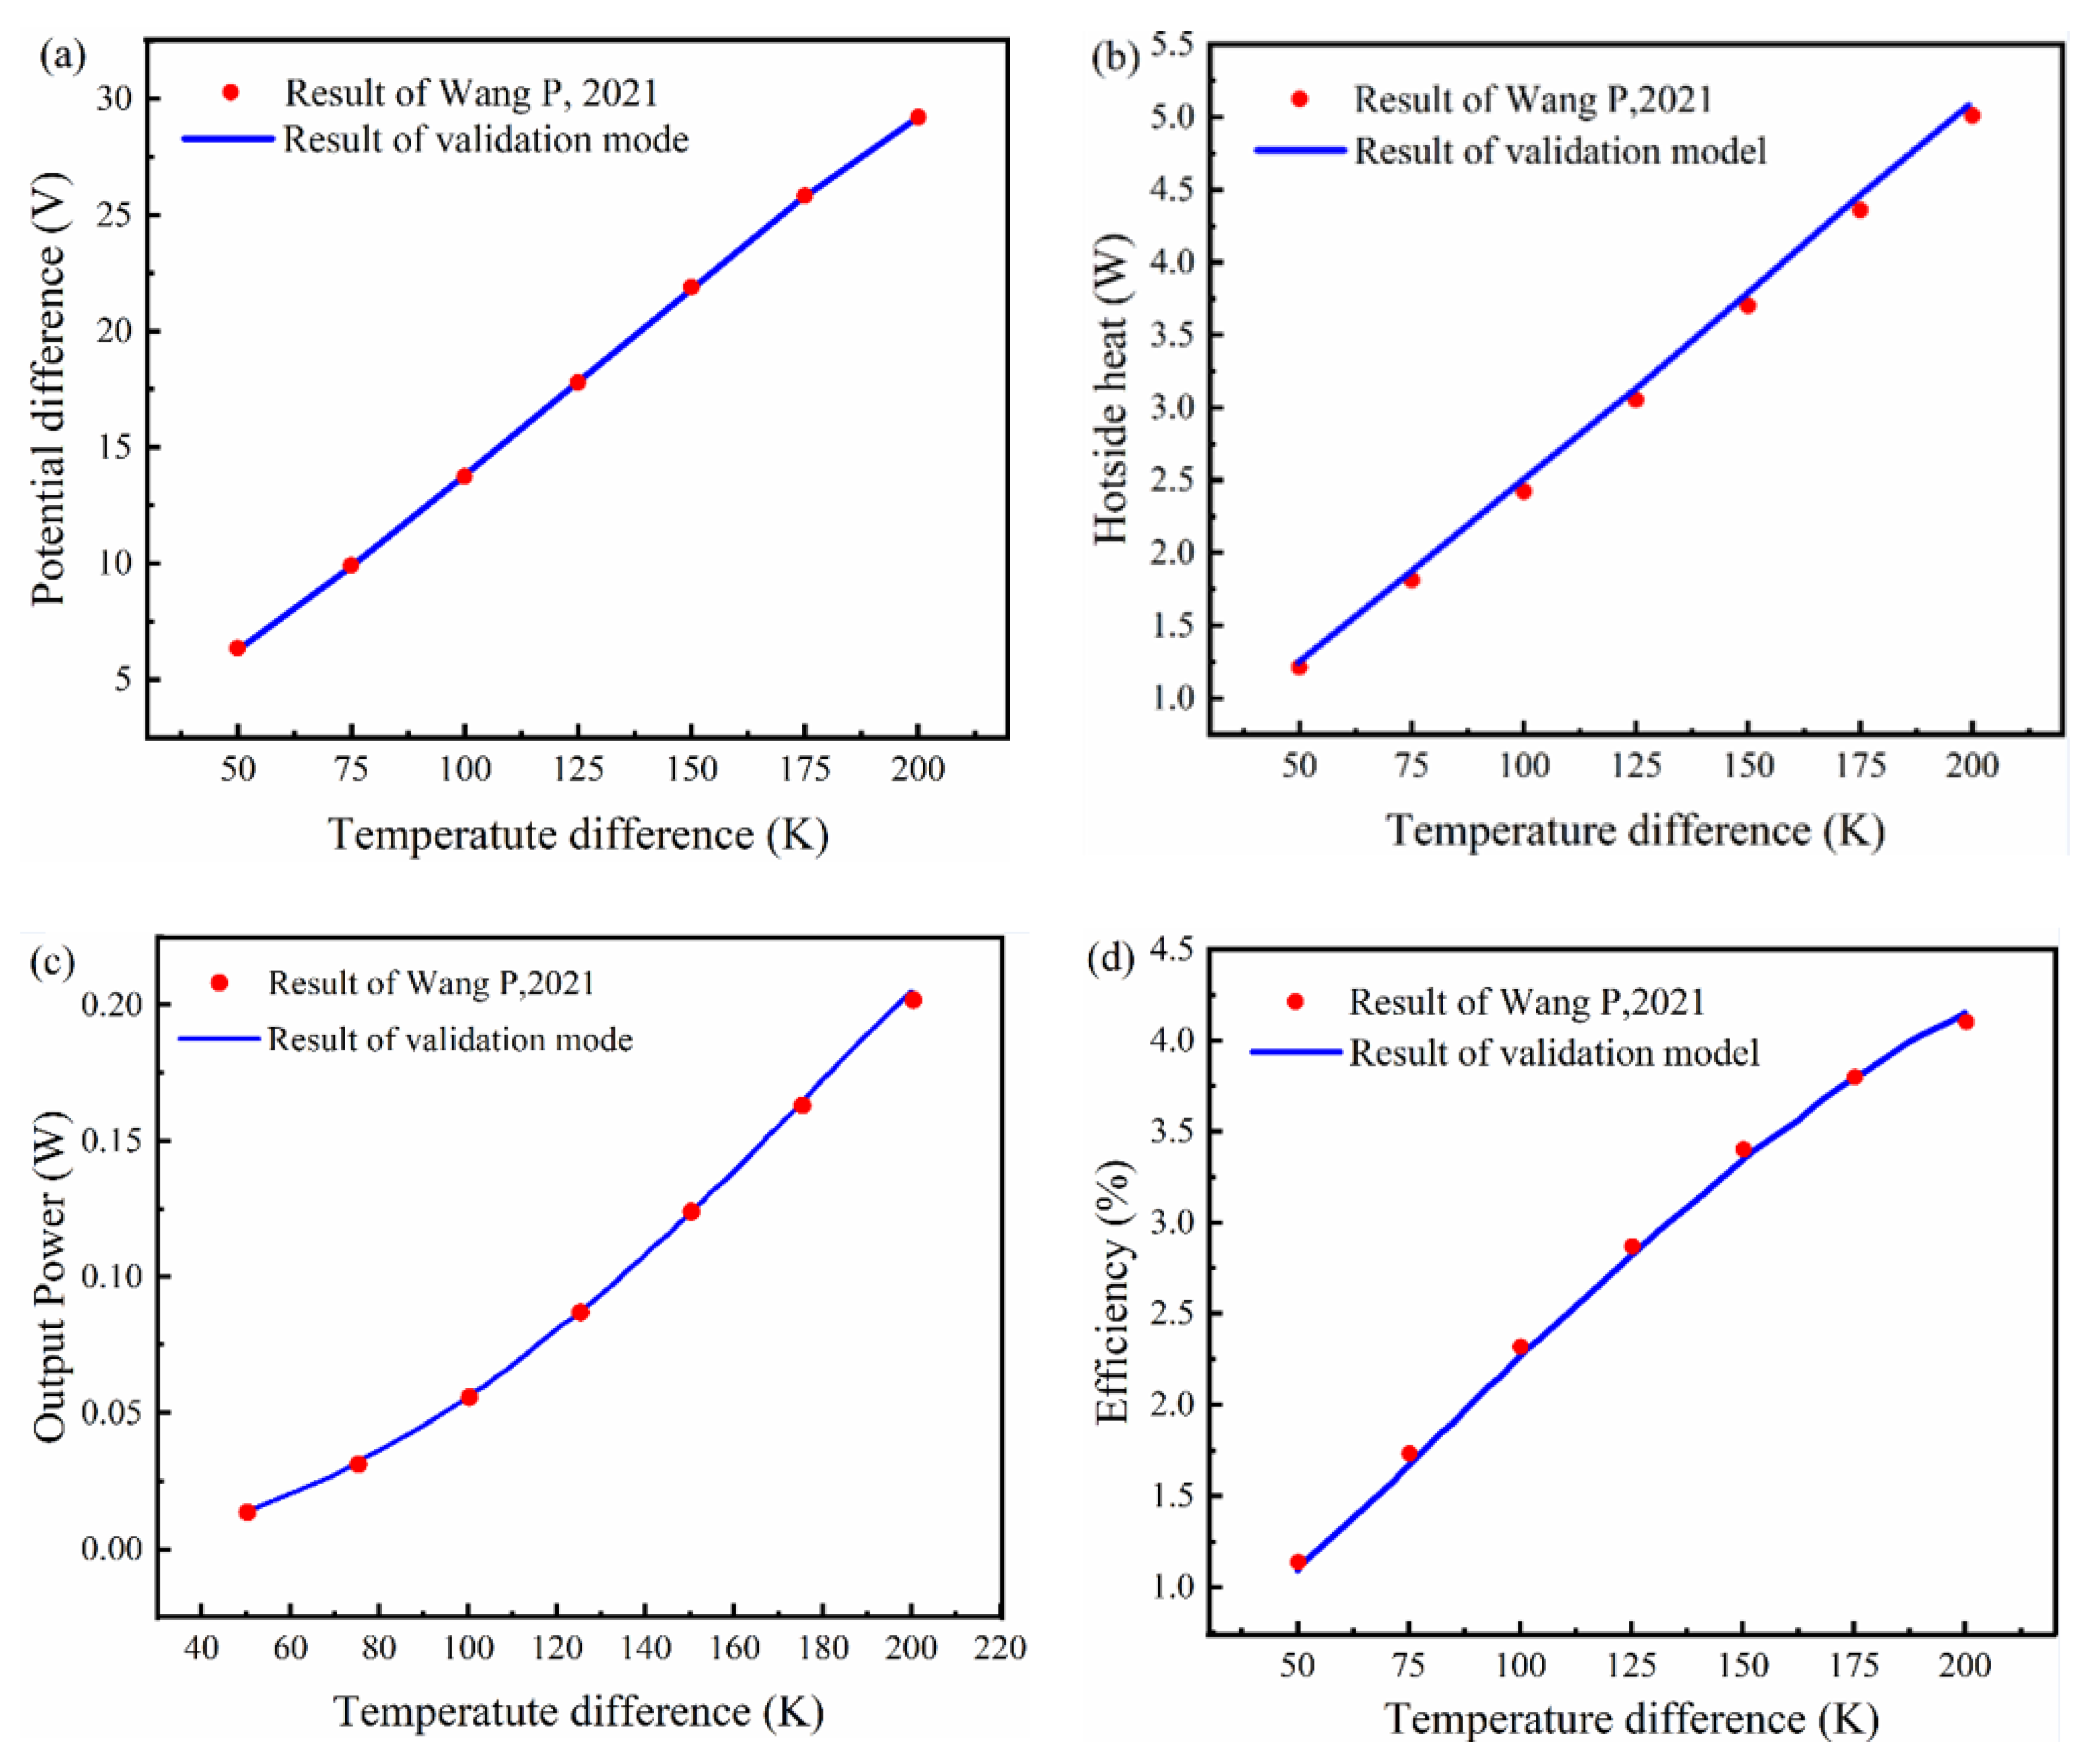
3.1. Model Validation

In this section, the commercial software ANSYS Workbench is used to verify the built model. A single, cone-shape leg was chosen as the validation model, with the top and bottom radius respectively selected as 2.5 mm and 5 mm, and the leg length was 5 mm. The model was meshed with hexahedral elements by sweep meshing, and the material properties and boundary conditions were set the same as Ref. [15] (temperature difference between the two sides varied from 50 K to 200 K with the cold side fixed at 300 K). The grid independence test was carried out, and the results are shown in Figure 4. As seen from Figure 4, the output power of the TE leg became stable when the element number exceeded 5000. Therefore, the grid with 5000 elements was selected to reduce the computation time. The comparisons of results between the simulation and the reference are given in Figure 5. The simulation results for the potential difference, hot-side heat, output power, and efficiency all had excellent agreement with the results presented in Ref. [15], which means the model built in this paper is acceptable for the numerical simulations.

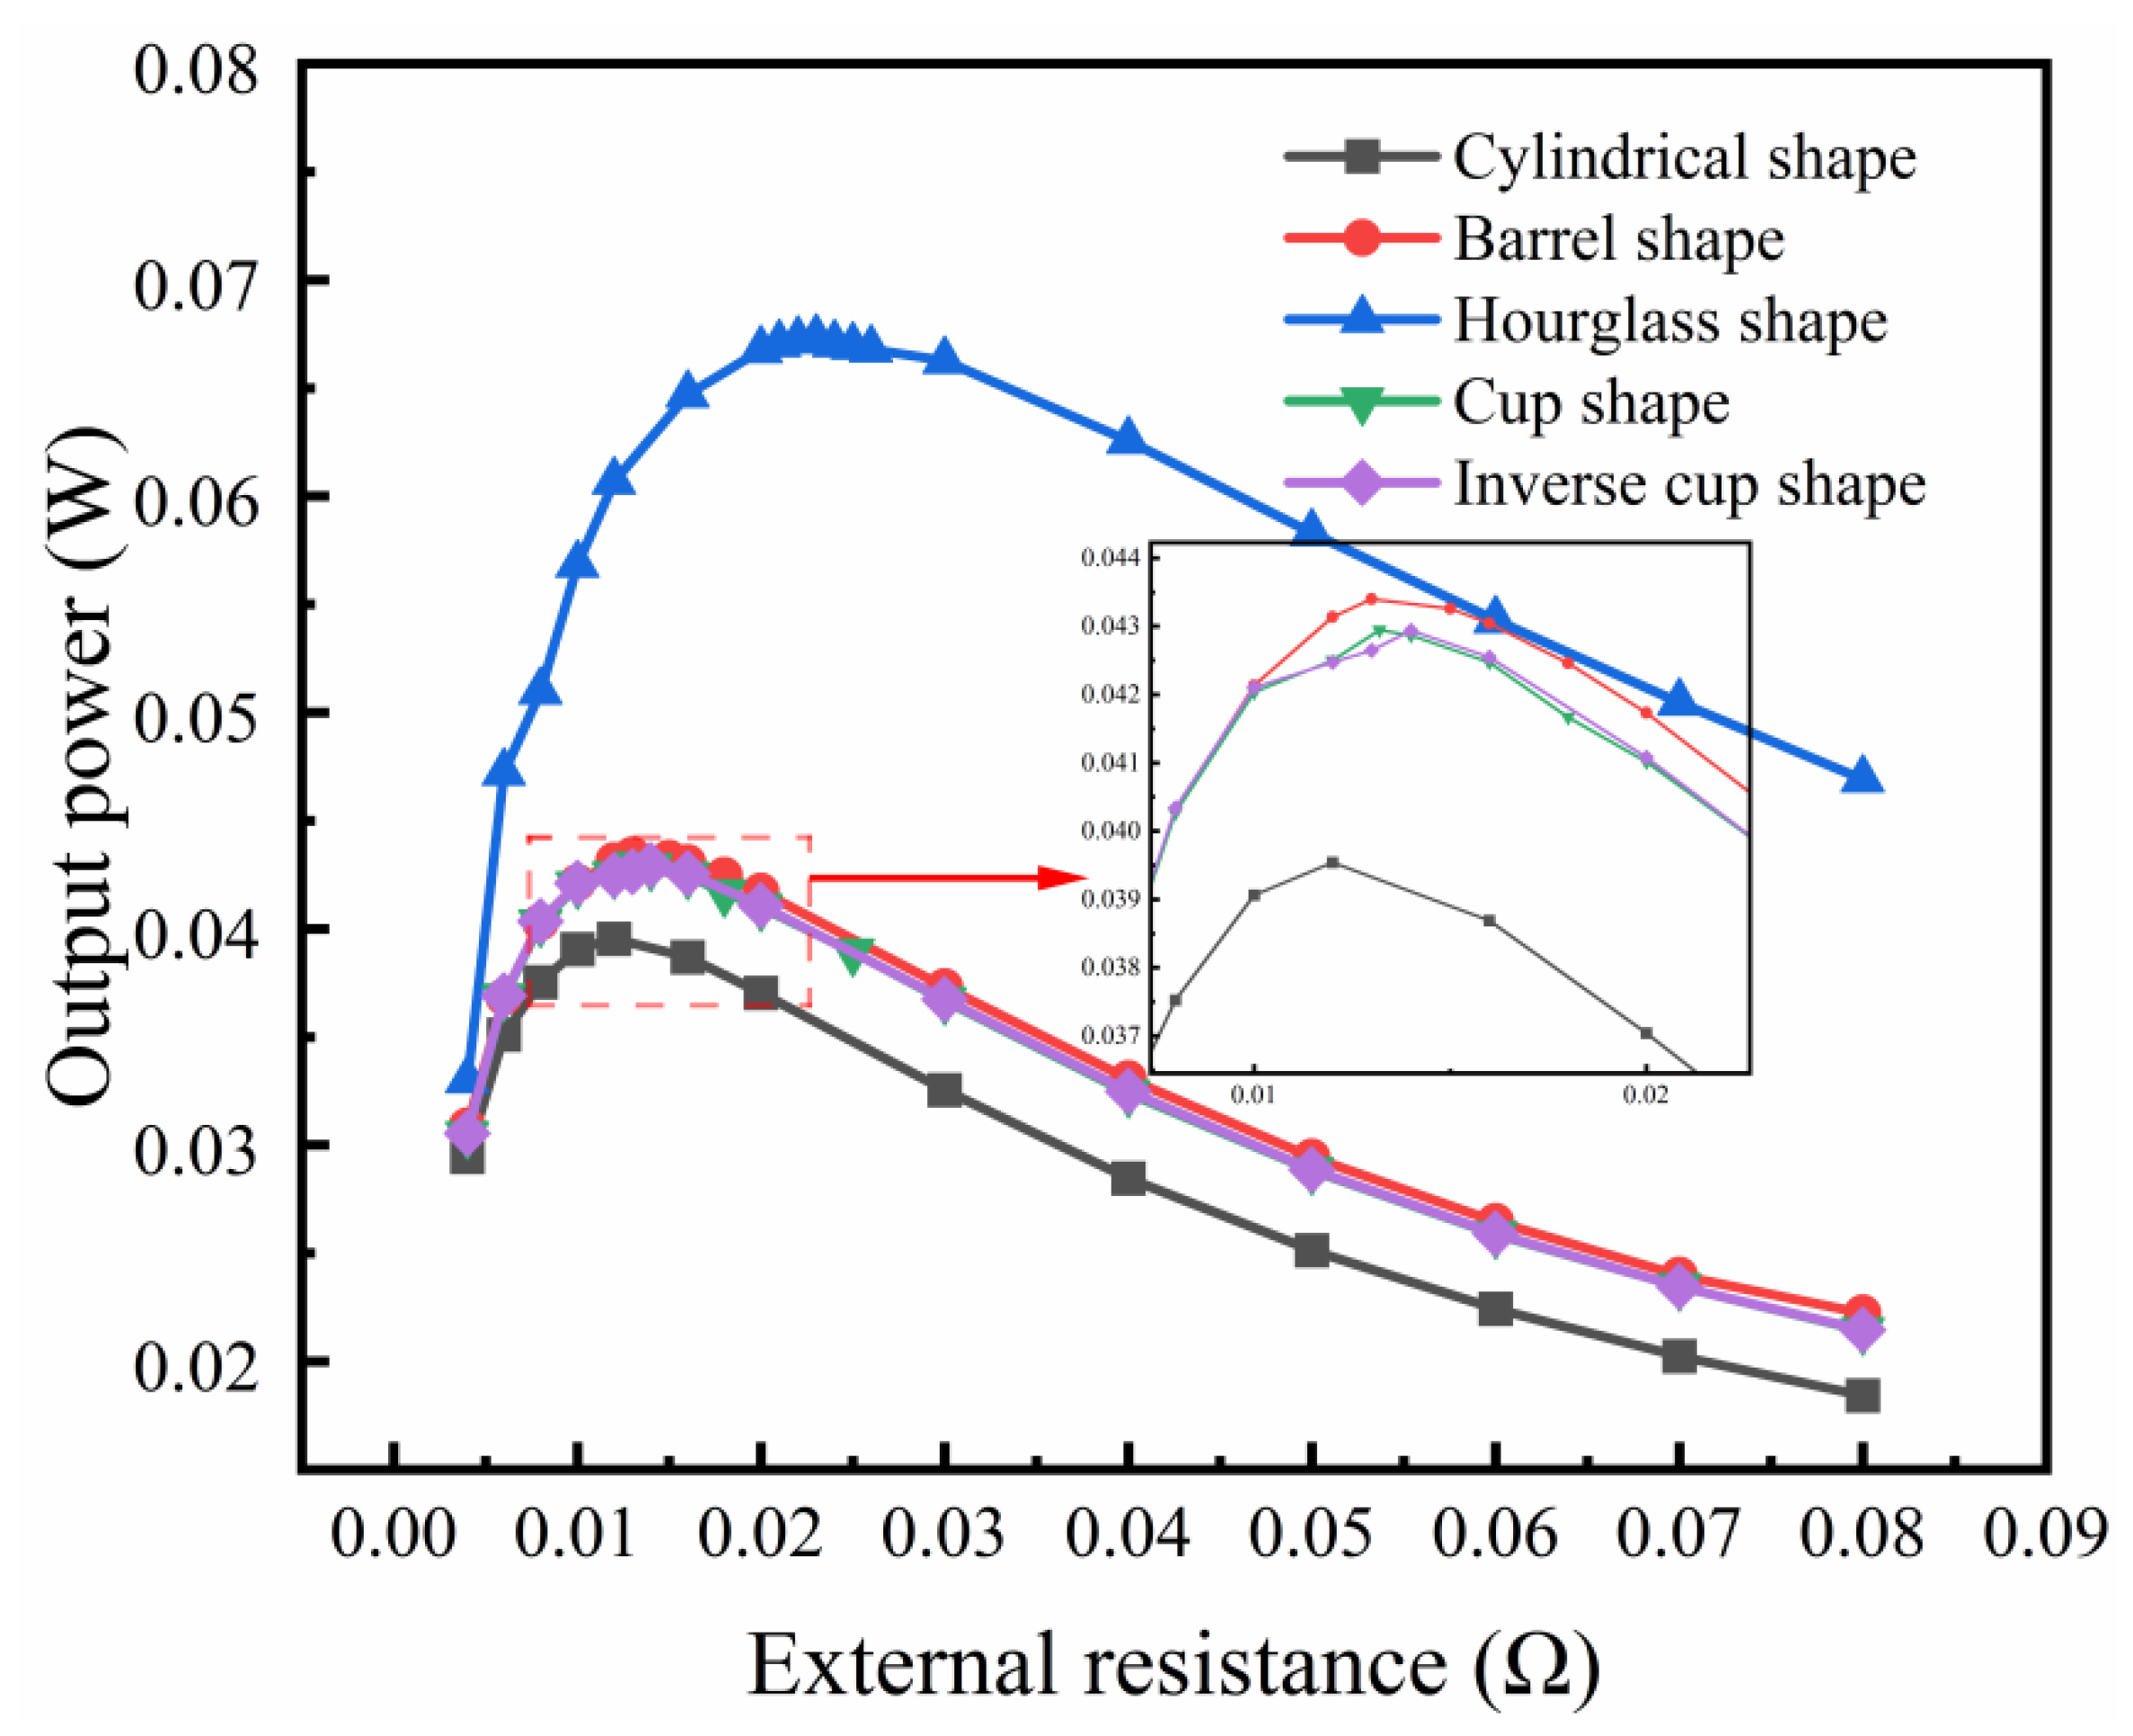
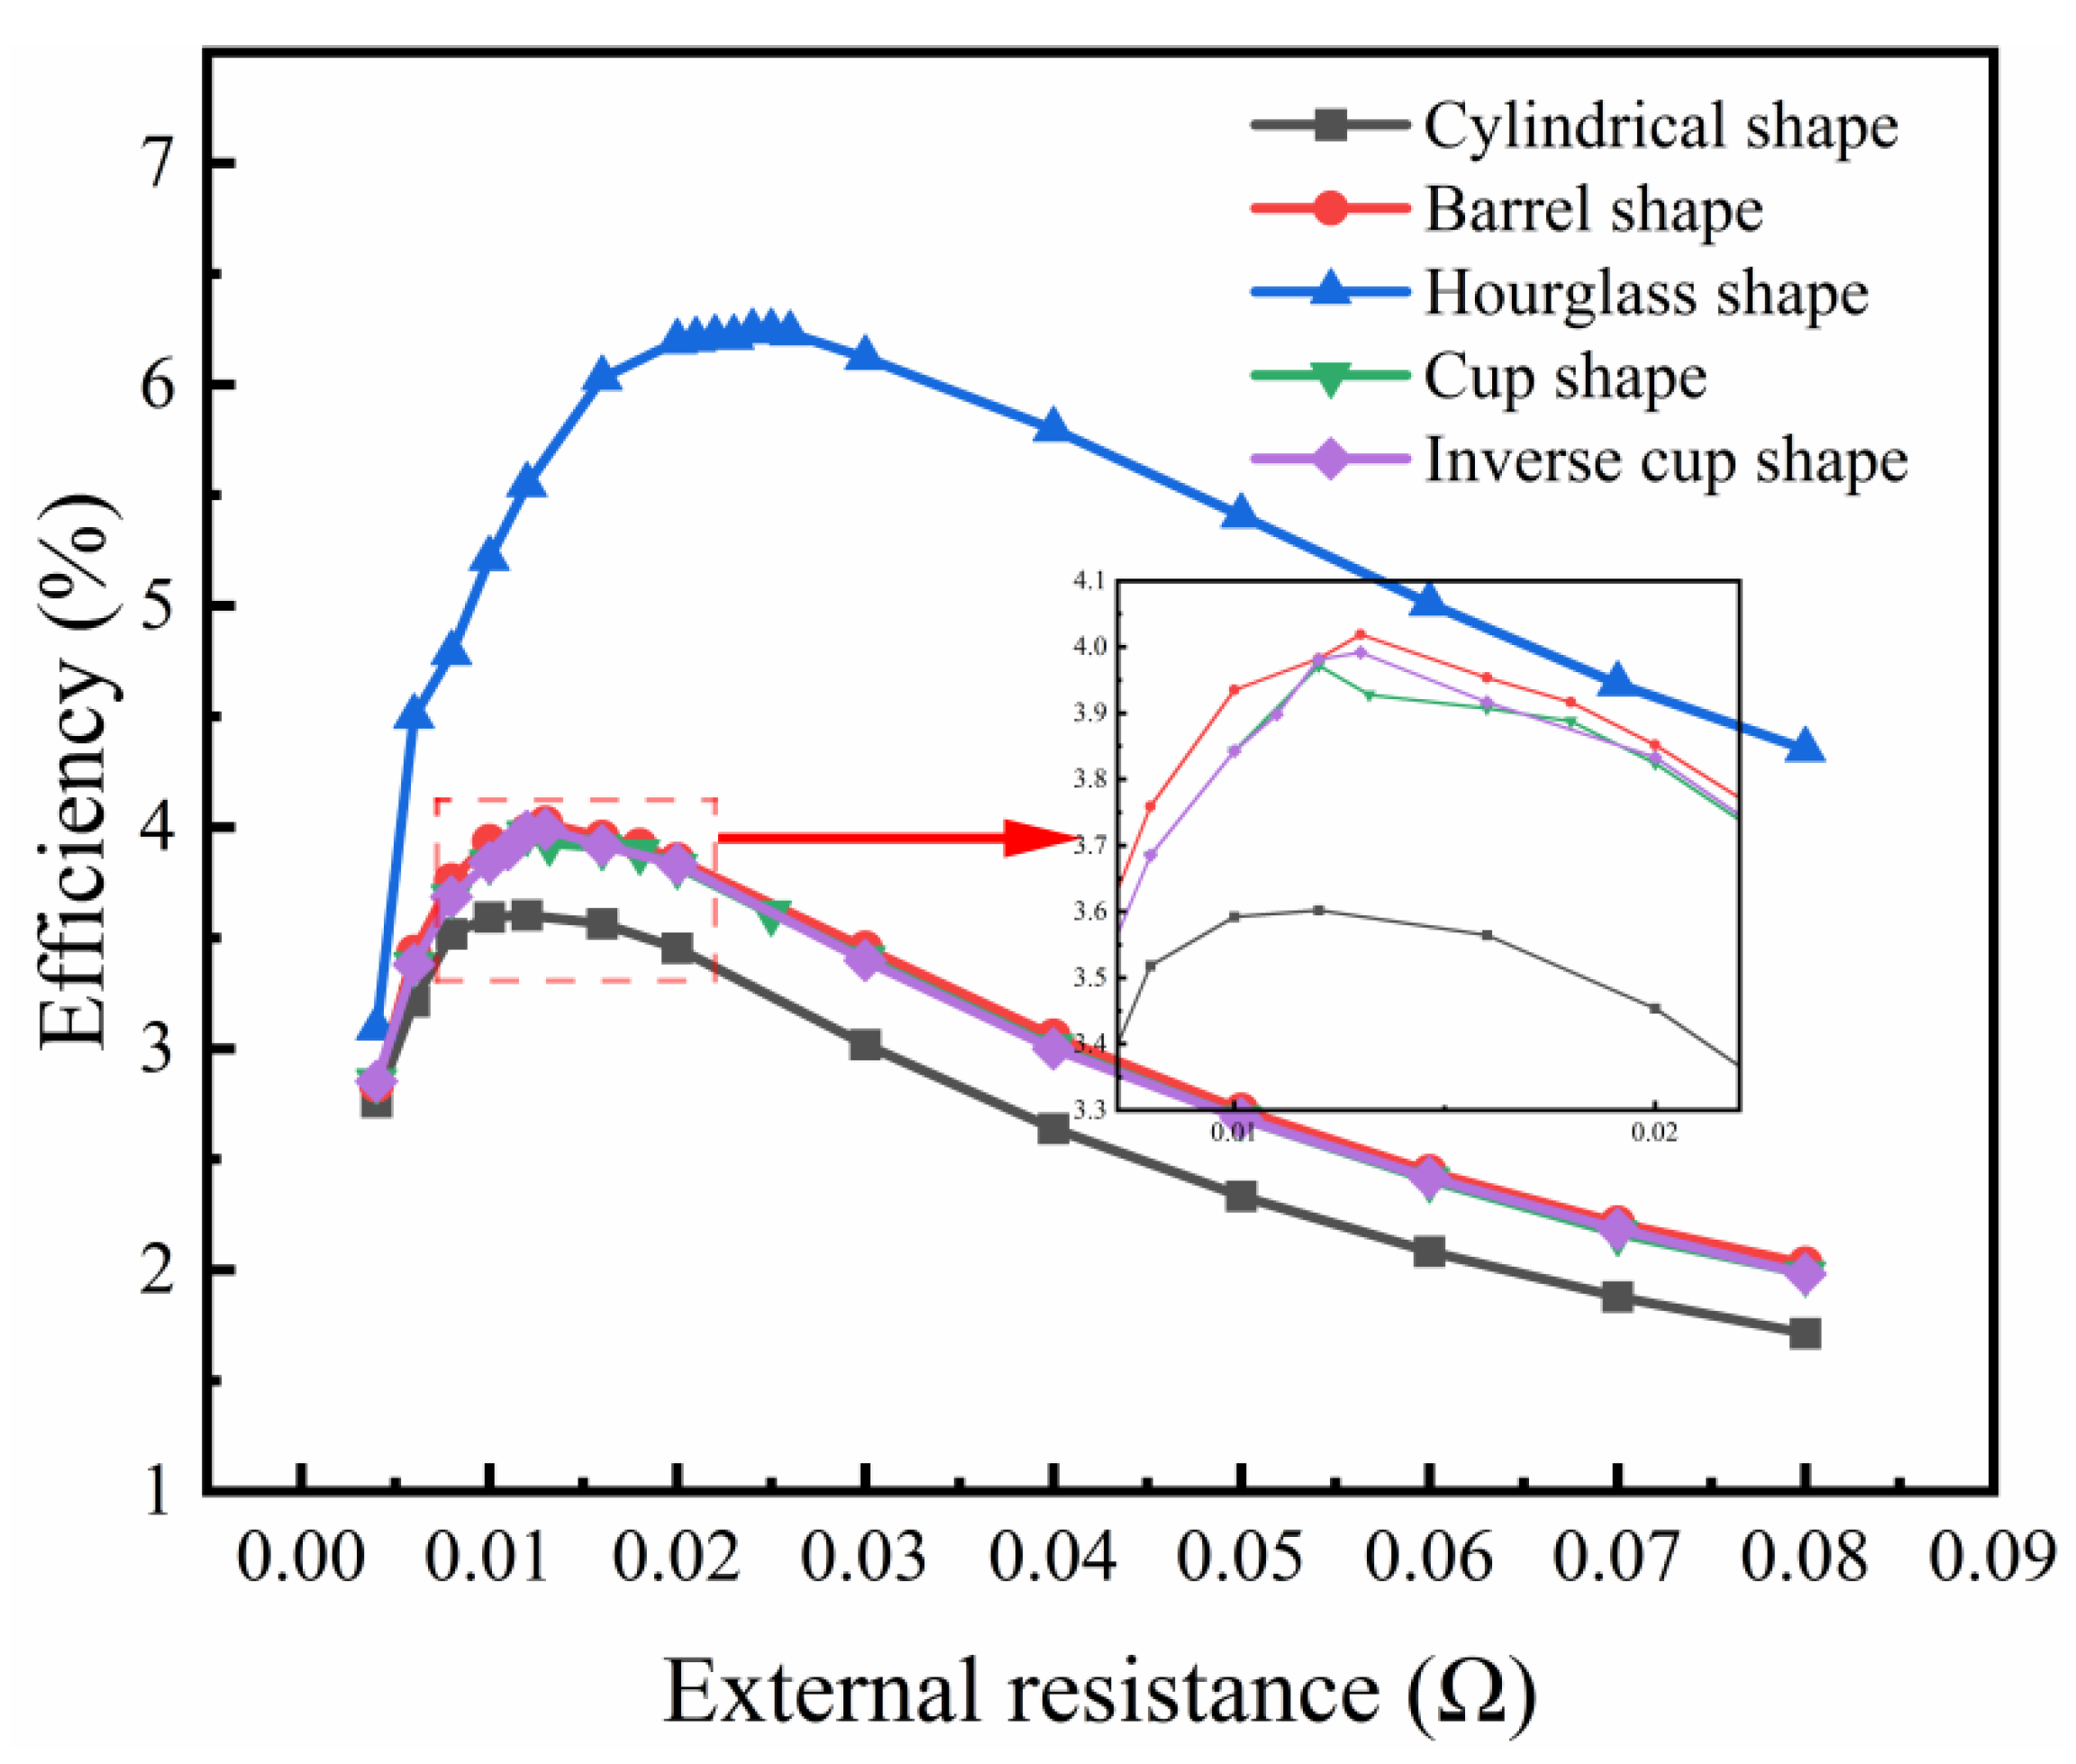
3.2. Effect of External Resistance on the Performance of Variable Cross-Section TEGs

To investigate the effect of external resistance on the output performance, five shapes of TEGs, depicted in Figure 2, were compared with varying external resistances from 0.004 Ω to 0.8   Ω . The geometric parameters of all the TEGs maintained the default values. In addition, the constant heat flux of 30,000 W/m2 was applied to the hot side and the forced convection of 1200 W/(m2∙K) was fixed at the cold side. The simulated results of output power and efficiency of five shapes of TEGs are illustrated in Figure 6 and Figure 7, respectively.
As exhibited in Figure 6, the variation in output power for all the TEGs showed a similar tendency. The output power firstly went up to the maximum value and then decreased gradually with the rising external resistance. The curves show that the cylindrical TEG generated the lowest maximum output power of 0.0395 W among the five shapes of the TEGs. Notably, the hourglass-shaped TEG had a significant enhancement in power of 0.067 W, which is 69.62% higher than that of the conventional TEG. The barrel-shaped, cup-shaped, and inverse cup-shaped TEGs had less improvement in output power than the hourglass-shaped TEG. The barrel-shaped TEG had a maximum output power of 0.0431 W. Though the cross-sections of the cup-shaped and inverse cup-shaped TEGs had a contrary variation trend, these two types of TEGs output the same power of 0.0429 W. Furthermore, the external resistances corresponding to the maximum output power also displayed the diversity among these TEGs. The optimal external resistance of the cylindrical-shaped TEG presented the lowest value of 0.012 Ω for the maximum output power, and the hourglass-shaped TEG presented the highest value of 0.023 Ω , which results from the sharply declined cross-section area in the middle part of the hourglass-shaped TEG.
The output performance was severely affected by the temperature difference between the hot end and the cold end of the TEG. The generated temperature differences of different shapes of TEGs under the same boundary conditions are listed in Table 3. Compared to the temperature difference of 75.76 K yielded by the cylindrical TEG, the TEGs with variable cross-section exhibited evident growth in the temperature difference. The cup-shaped and inverse cup-shaped TEGs had the smallest improvement with a temperature difference of about 83.2 K. The barrel-shaped TEG had slightly higher temperature difference than the cup-shaped and inverse cup-shaped TEGs, which led to its mildly higher output power as depicted in Figure 6. Remarkably, the hourglass-shaped TEG displayed a predominant boost in the temperature difference from 75.76 K to 150.60 K.
As the hot surfaces of the five shapes of TEGs were identical, the heat input, Q h ,   of every model remained the same. Therefore, the efficiency of the five shapes of TEGs in Figure 7 displayed variation tendencies that were similar to that of the output power. It was observed that the cylindrical TEG had the lowest efficiency of 3.65%, and the hourglass-shaped TEG showed the best performance in efficiency with a value of 6.24%, which improved by 70.96% compared to the cylindrical TEG. The barrel-shaped, cup-shaped, and inverse cup-shaped TEGs obtained an efficiency of 4.01%, 3.91%, and 3.98%, respectively.

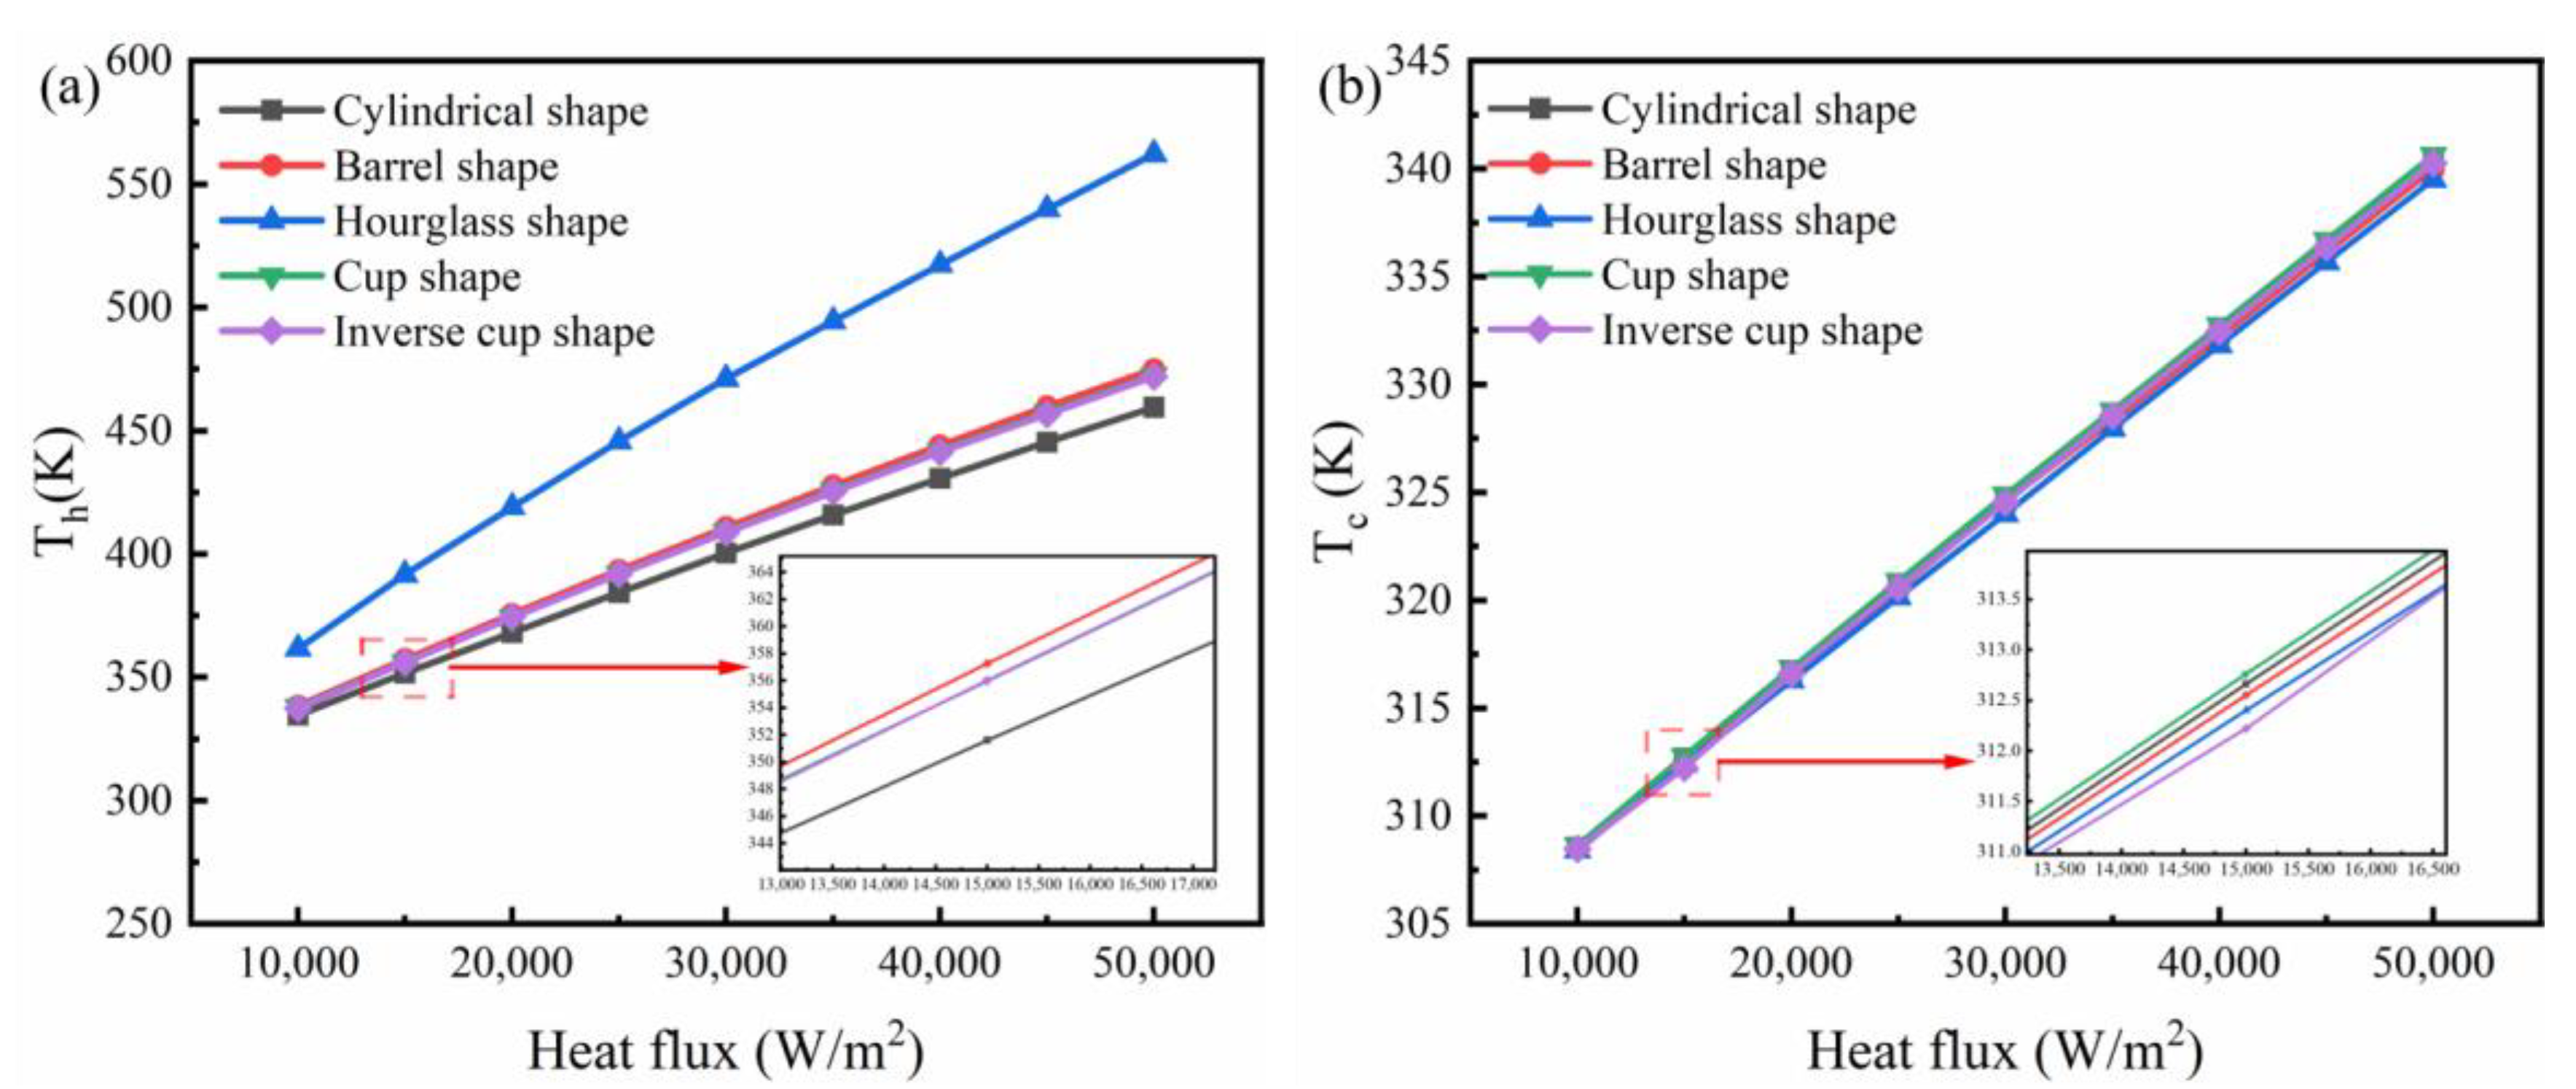
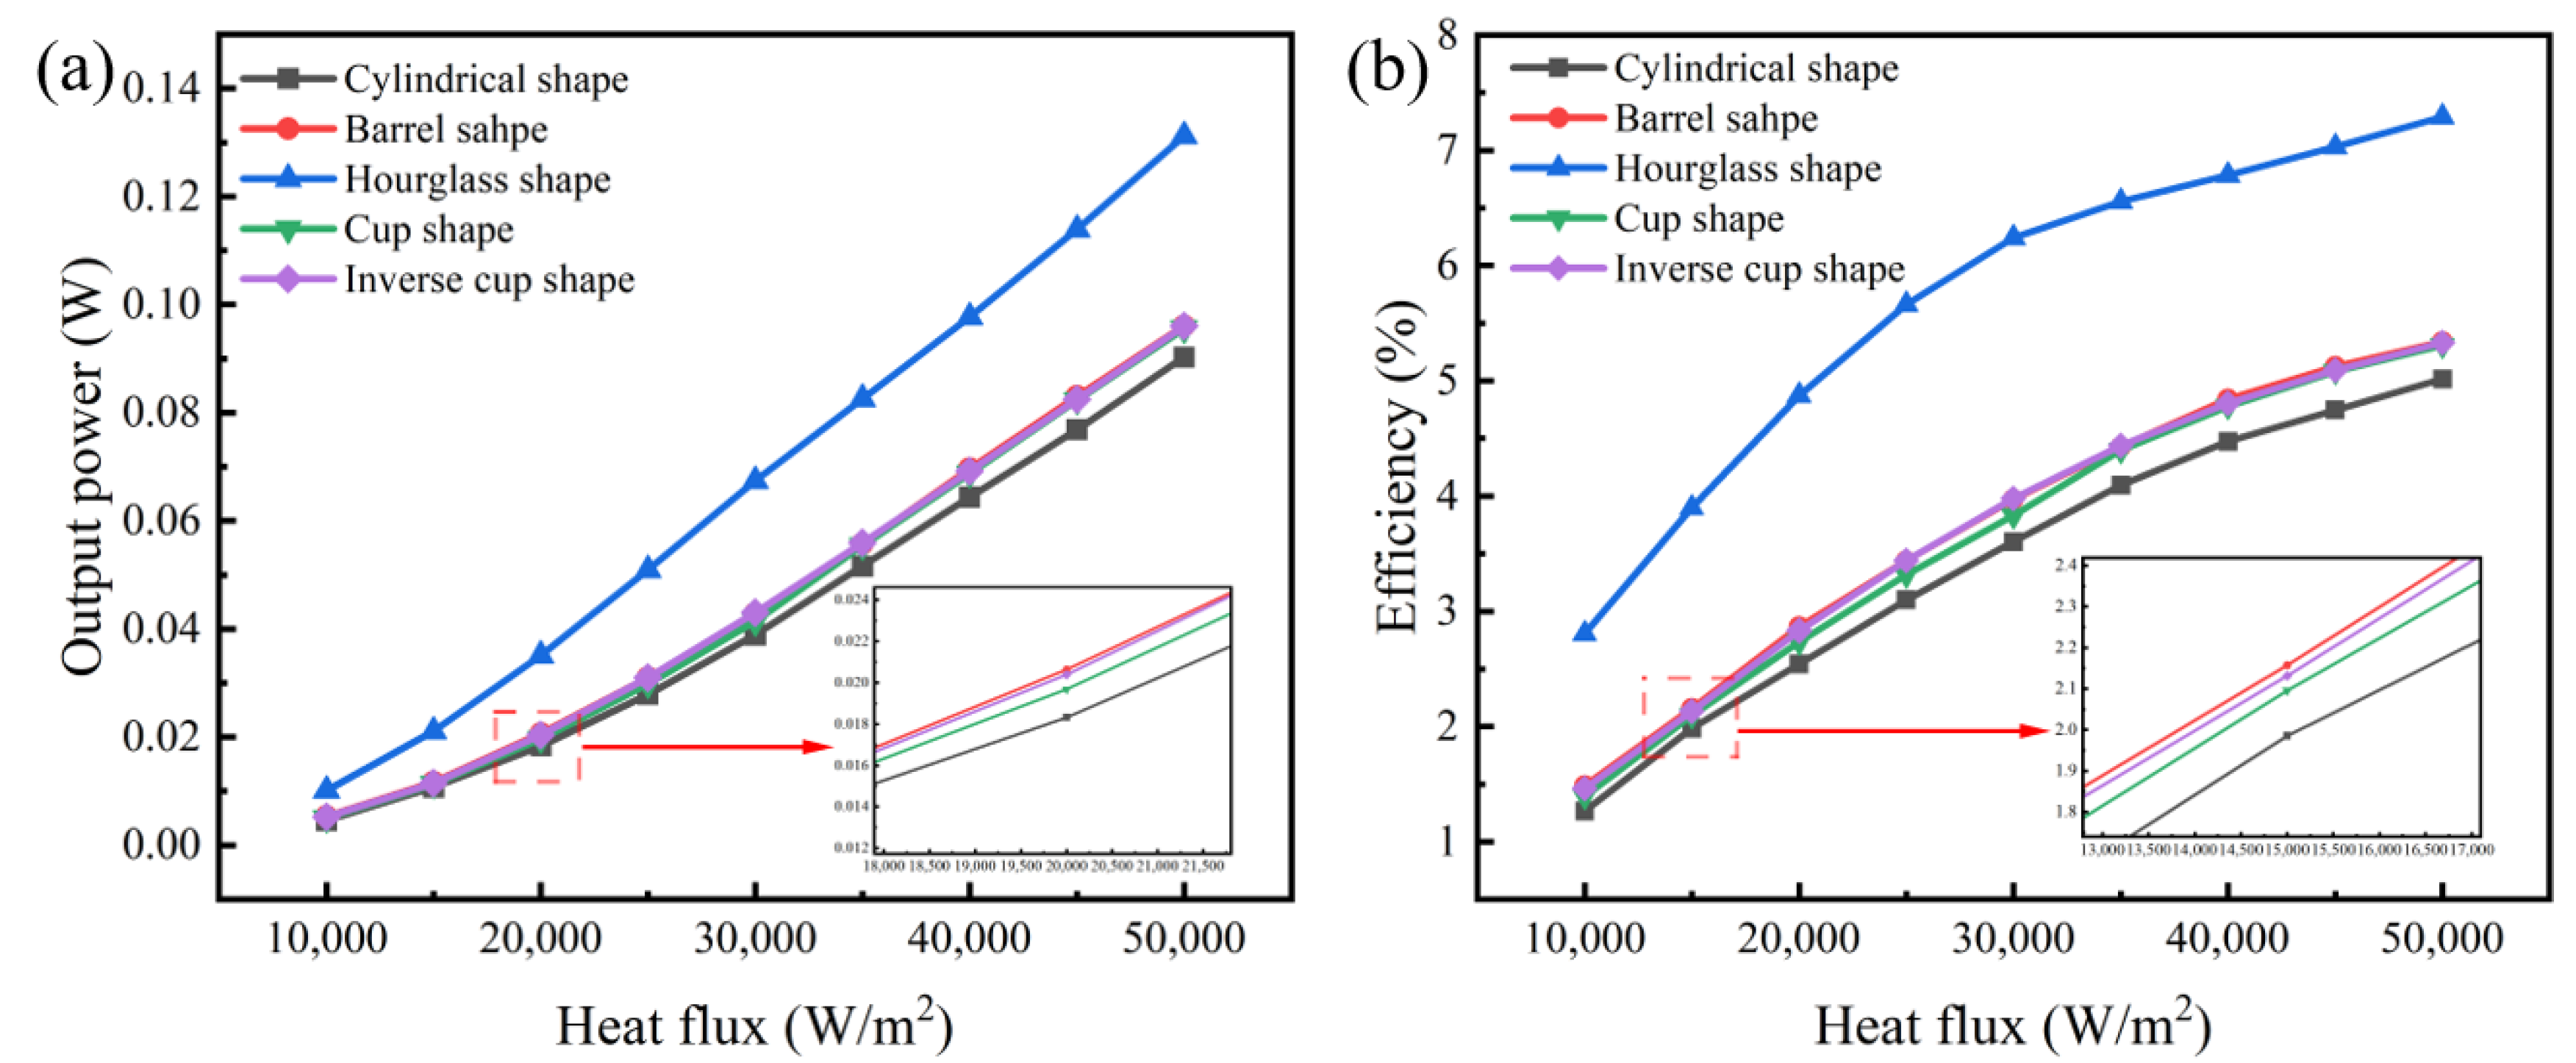
3.3. The Effect of Heat Flux on the Performance of Variable Cross-Section TEGs

The effect of heat flux fixed at the hot end on the performance of TEGs is investigated in this section. The induced temperatures at the hot side and the cold side of five shapes of TEGs are illustrated in Figure 8, with the heat flux varying from 10,000 W/m2 to 50,000 W/m2. The cold-side boundary condition maintained a convection coefficient of 1000 W/(m2∙K) under all cases. The temperatures of the hot end and the cold end both presented an incremental trend with the growing heat flux. However, there was distinct diversity in the hot-end temperatures while little difference appeared in the cold-end temperatures among the five shapes of TEGs. As seen from Figure 8a, the hourglass-shaped TEG held the highest hot-end temperature under all the conditions. The difference in hot-end temperature between the hourglass-shaped TEG and the other four TEGs reached up to 60 K when the heat flux increased to 30,000 W/m2. The generated hot-end temperature of the inverse cup-shaped TEG was approximately equal to the cylindrical TEG, and the hot-end temperatures of the cup-shaped and barrel-shaped TEGs were several Kelvin higher than the two aforementioned TEGs. When it comes to the cold end temperatures, they also go up with the incremental heat flux. The small difference among the five shapes of TEGs indicates that the shape of TEG has mild impact on the cold end temperature. Only when the heat flux rises to a relative value, the cold end temperature of hourglass-shaped TEG is obviously lower than the other four shapes of TEGs.
The evident enhancement in the hot-end temperature of the hourglass-shaped TEG results in a great boost in output power. The clear superiority in output power of the hourglass-shaped TEG can be seen from Figure 9a. With the growing heat flux, the output power of the hourglass-shaped TEG increased from 0.0101 W to 0.131 W. The barrel-shaped, cup-shaped, and inverse cup-shaped TEGs exhibited an obvious output power improvement only when the heat flux at the hot end exceeded 30,000 W/m2. The efficiencies of the five shapes of TEGs illustrated in Figure 9b all increased with the growing heat flux; nevertheless, the increment rates went down as heat flux went up. Surely, the hourglass-shaped TEG always had the highest efficiency among the five shaped of TEGs and the efficiency was promoted to 7.28% from the 5.01% of the cylindrical TEG. The barrel-shaped, cup-shaped, and inverse cup-shaped TEGs achieved around a 0.5% enhancement in efficiency when the heat flux was larger than 25,000 W/m2.

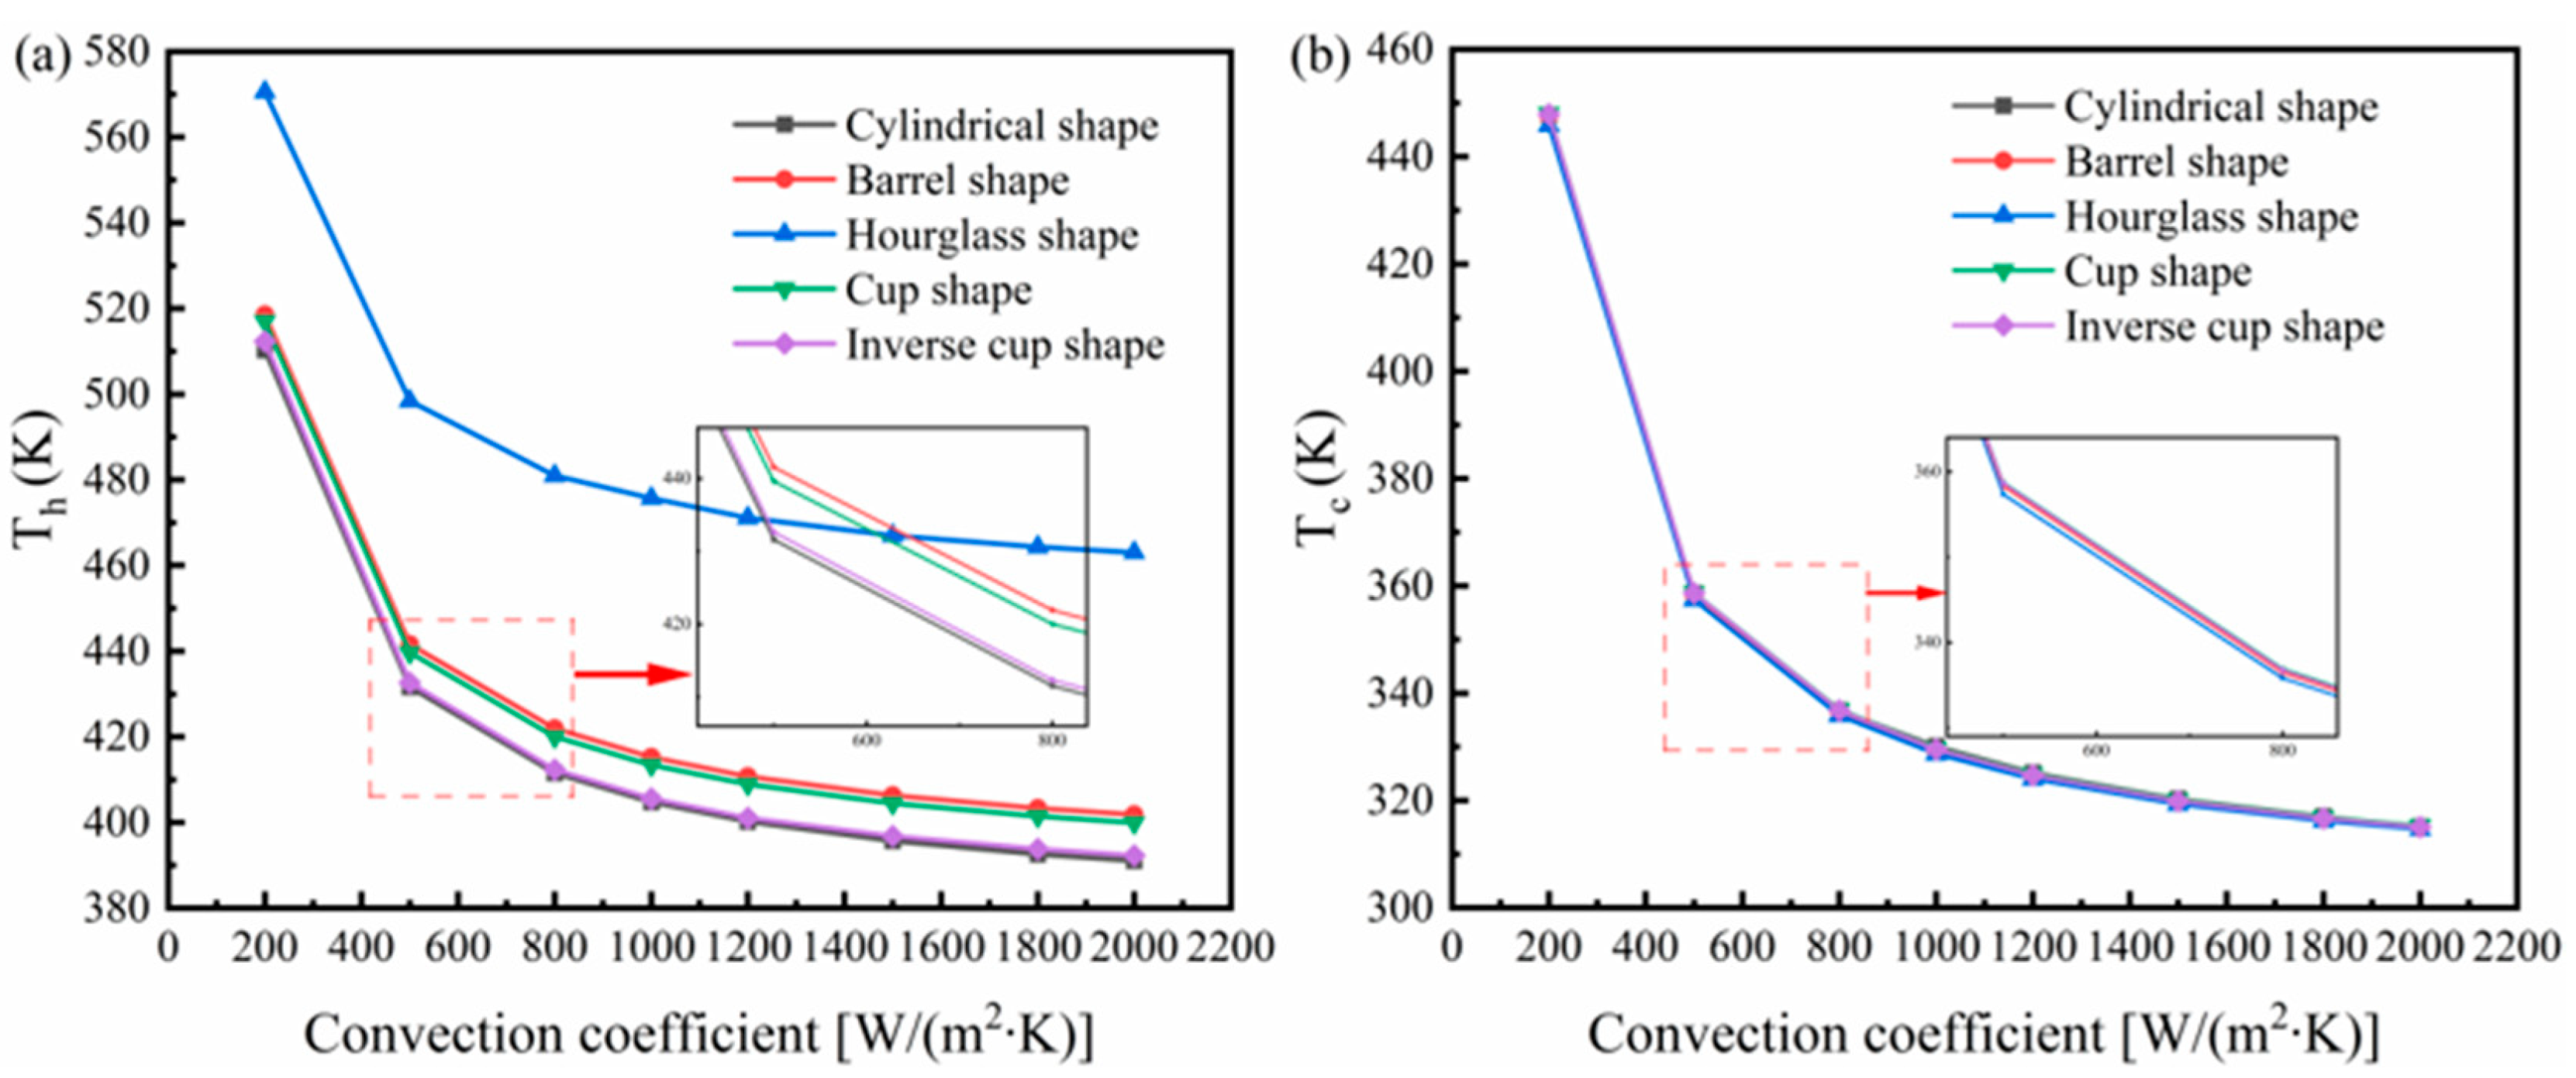
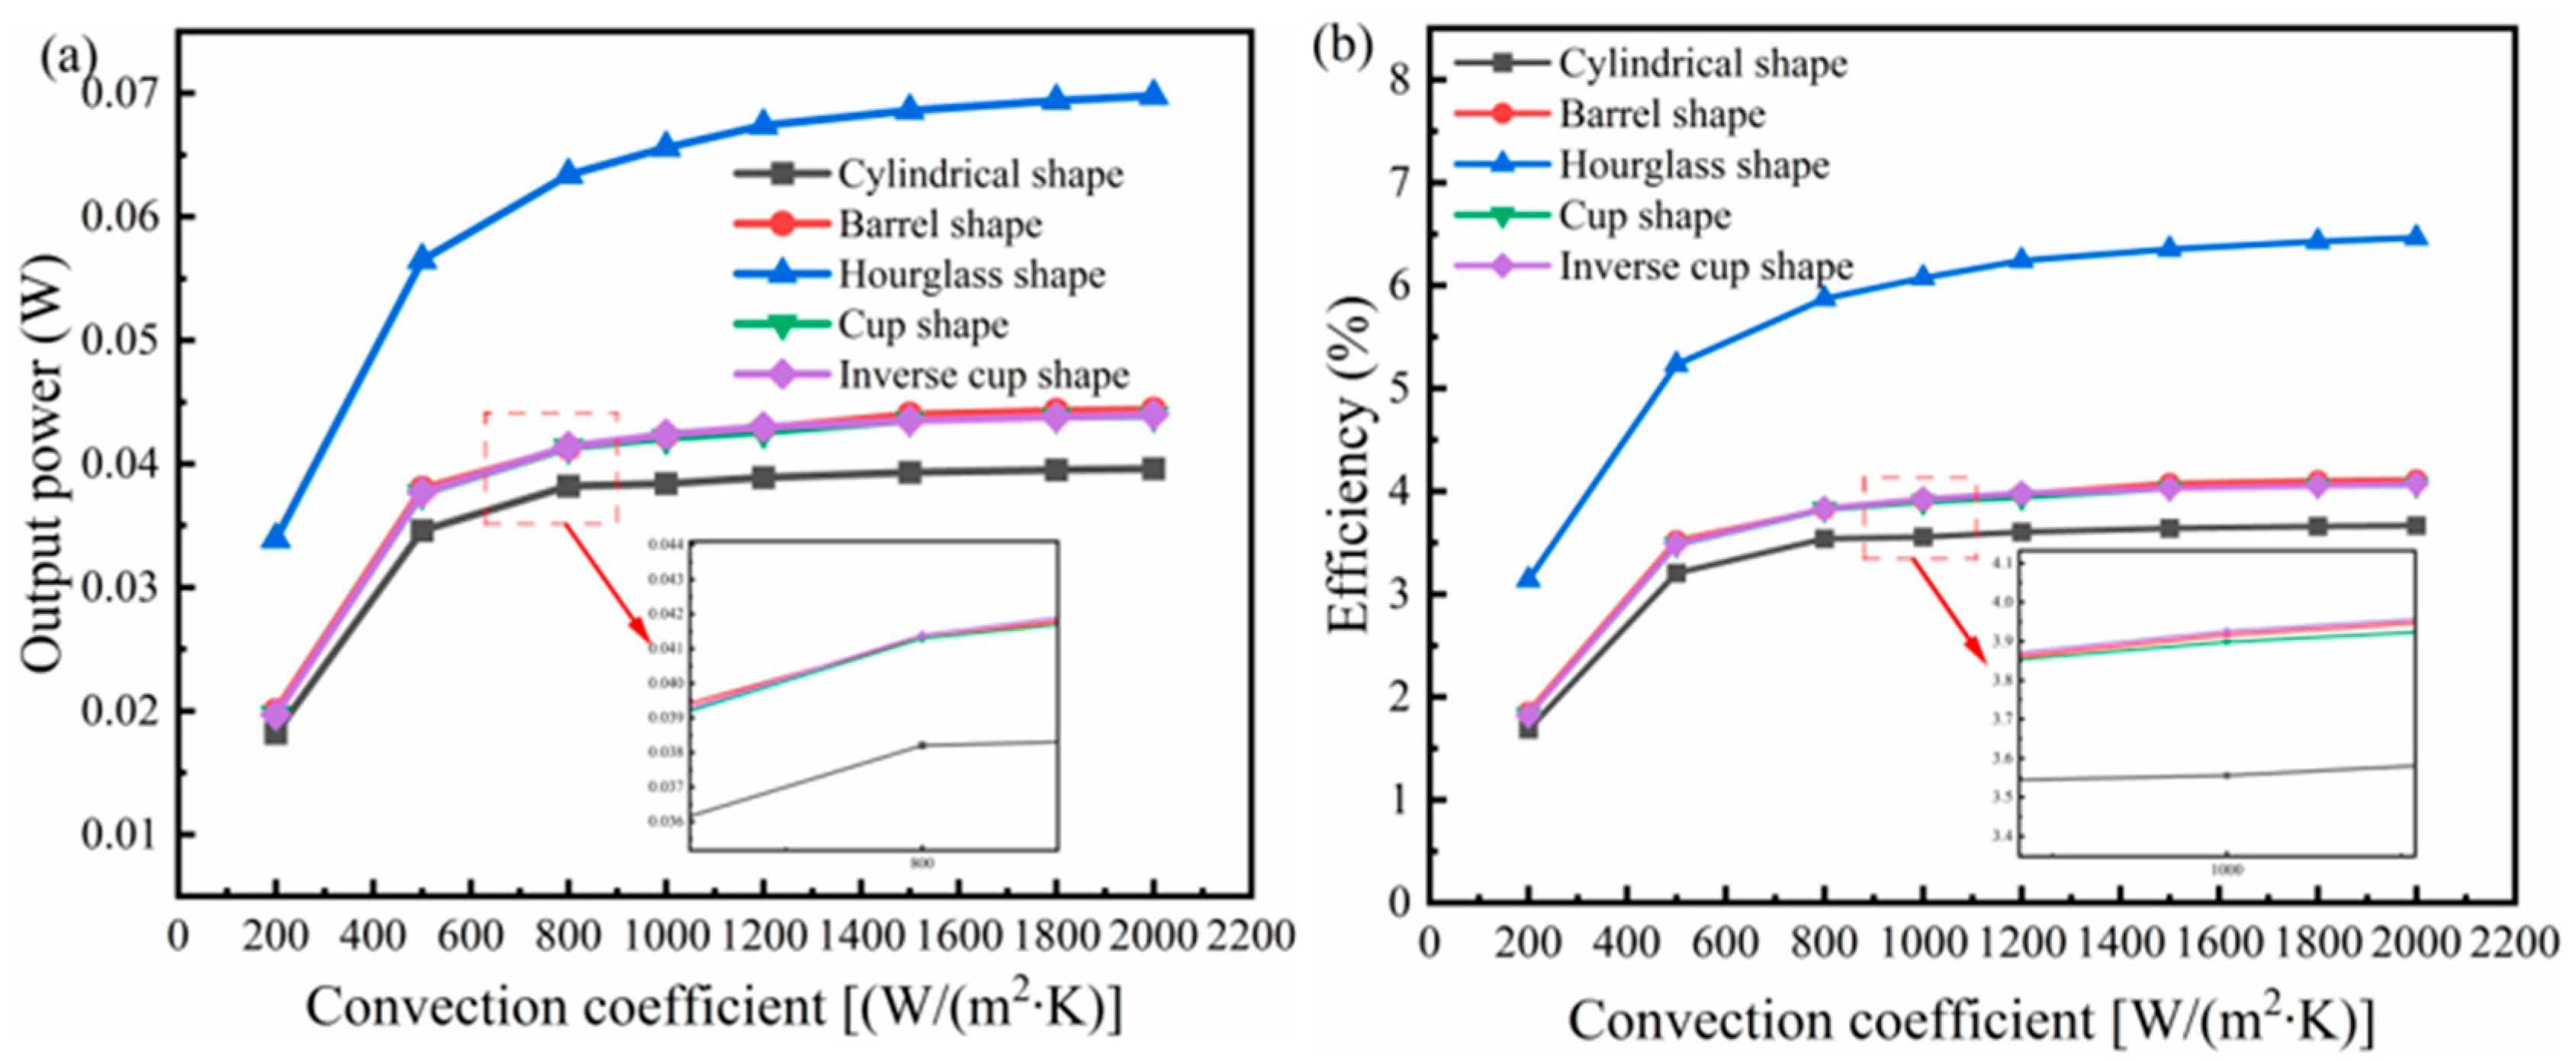
3.4. The Effect of the Convection Coefficient on the Performance of Variable Cross-Section TEGs

To explore the influence of the convection coefficient on the performance of the TEGs, a series of cases were implemented under the heat flux of 30,000 W/m2 with the convection coefficient varying from 200 W/(m2∙K) to 2000 W/(m2∙K). The impact of the convection coefficient on the temperatures of the hot end and cold end are presented in Figure 10. Both the hot-end and cold-end temperatures declined as the convection coefficient increased. Figure 10 clearly depicts that the hot-end temperatures of all five shapes of TEGs all had a sharp decrease when the convection coefficient increased from 200 W/(m2∙K) to 500 W/(m2∙K) and the decline speed became slow when the convection coefficient was larger than 500 W/(m2∙K). Significantly, the hot-end temperature of the hourglass-shaped TEG remained approximate 60 K higher than the temperatures of the other four TEGs, which resulted in the extraordinary behavior of the hourglass-shaped TEG in output performance. A similar tendency for the cold-end temperature can be viewed based on the variation in cold-end temperature with the increment in convection coefficient as shown in Figure 10b. The cold-end temperatures of the five shapes of TEGs went down slowly when the convection coefficient went up. Moreover, the effect of shape on the cold temperature of the TEGs under the current situation can be ignored. The growing convection coefficient at the cold end of the TEG indicates that more heat can be dissipated at the cold side. A greater temperature difference can be induced between the two ends of the TEG. However, the temperature difference becomes stable owing to the slight change in hot-end and cold-end temperatures when the convection coefficient is larger than 1400 W/(m2∙K).
The output power and efficiency of five shapes of TEGs under varying convection coefficients are shown in Figure 11. As seen from Figure 11, the conventional cylindrical TEG had the lowest output power and efficiency under all conditions. The barrel-shaped, cup-shaped, and inverse cup-shaped TEGs had a small enhancement in output power and efficiency compared to the cylindrical TEG. The great preponderance of the hourglass-shaped TEG in the output power and efficiency is still present in Figure 11a,b. The output power of the hourglass-shaped TEG was nearly twice as much as the output power of the cylindrical TEG, and the efficiency enhancement of the hourglass-shaped TEG reached about 3%. Furthermore, it should be emphasized that the impact of the convection coefficient on the performance of the TEGs becomes mild when the convection coefficient is higher than 1400 W/(m2∙K). Hence, the forced convection coefficient of less than 1400 W/(m2∙K) is more appropriate for the TEG application with the consideration of real cost.

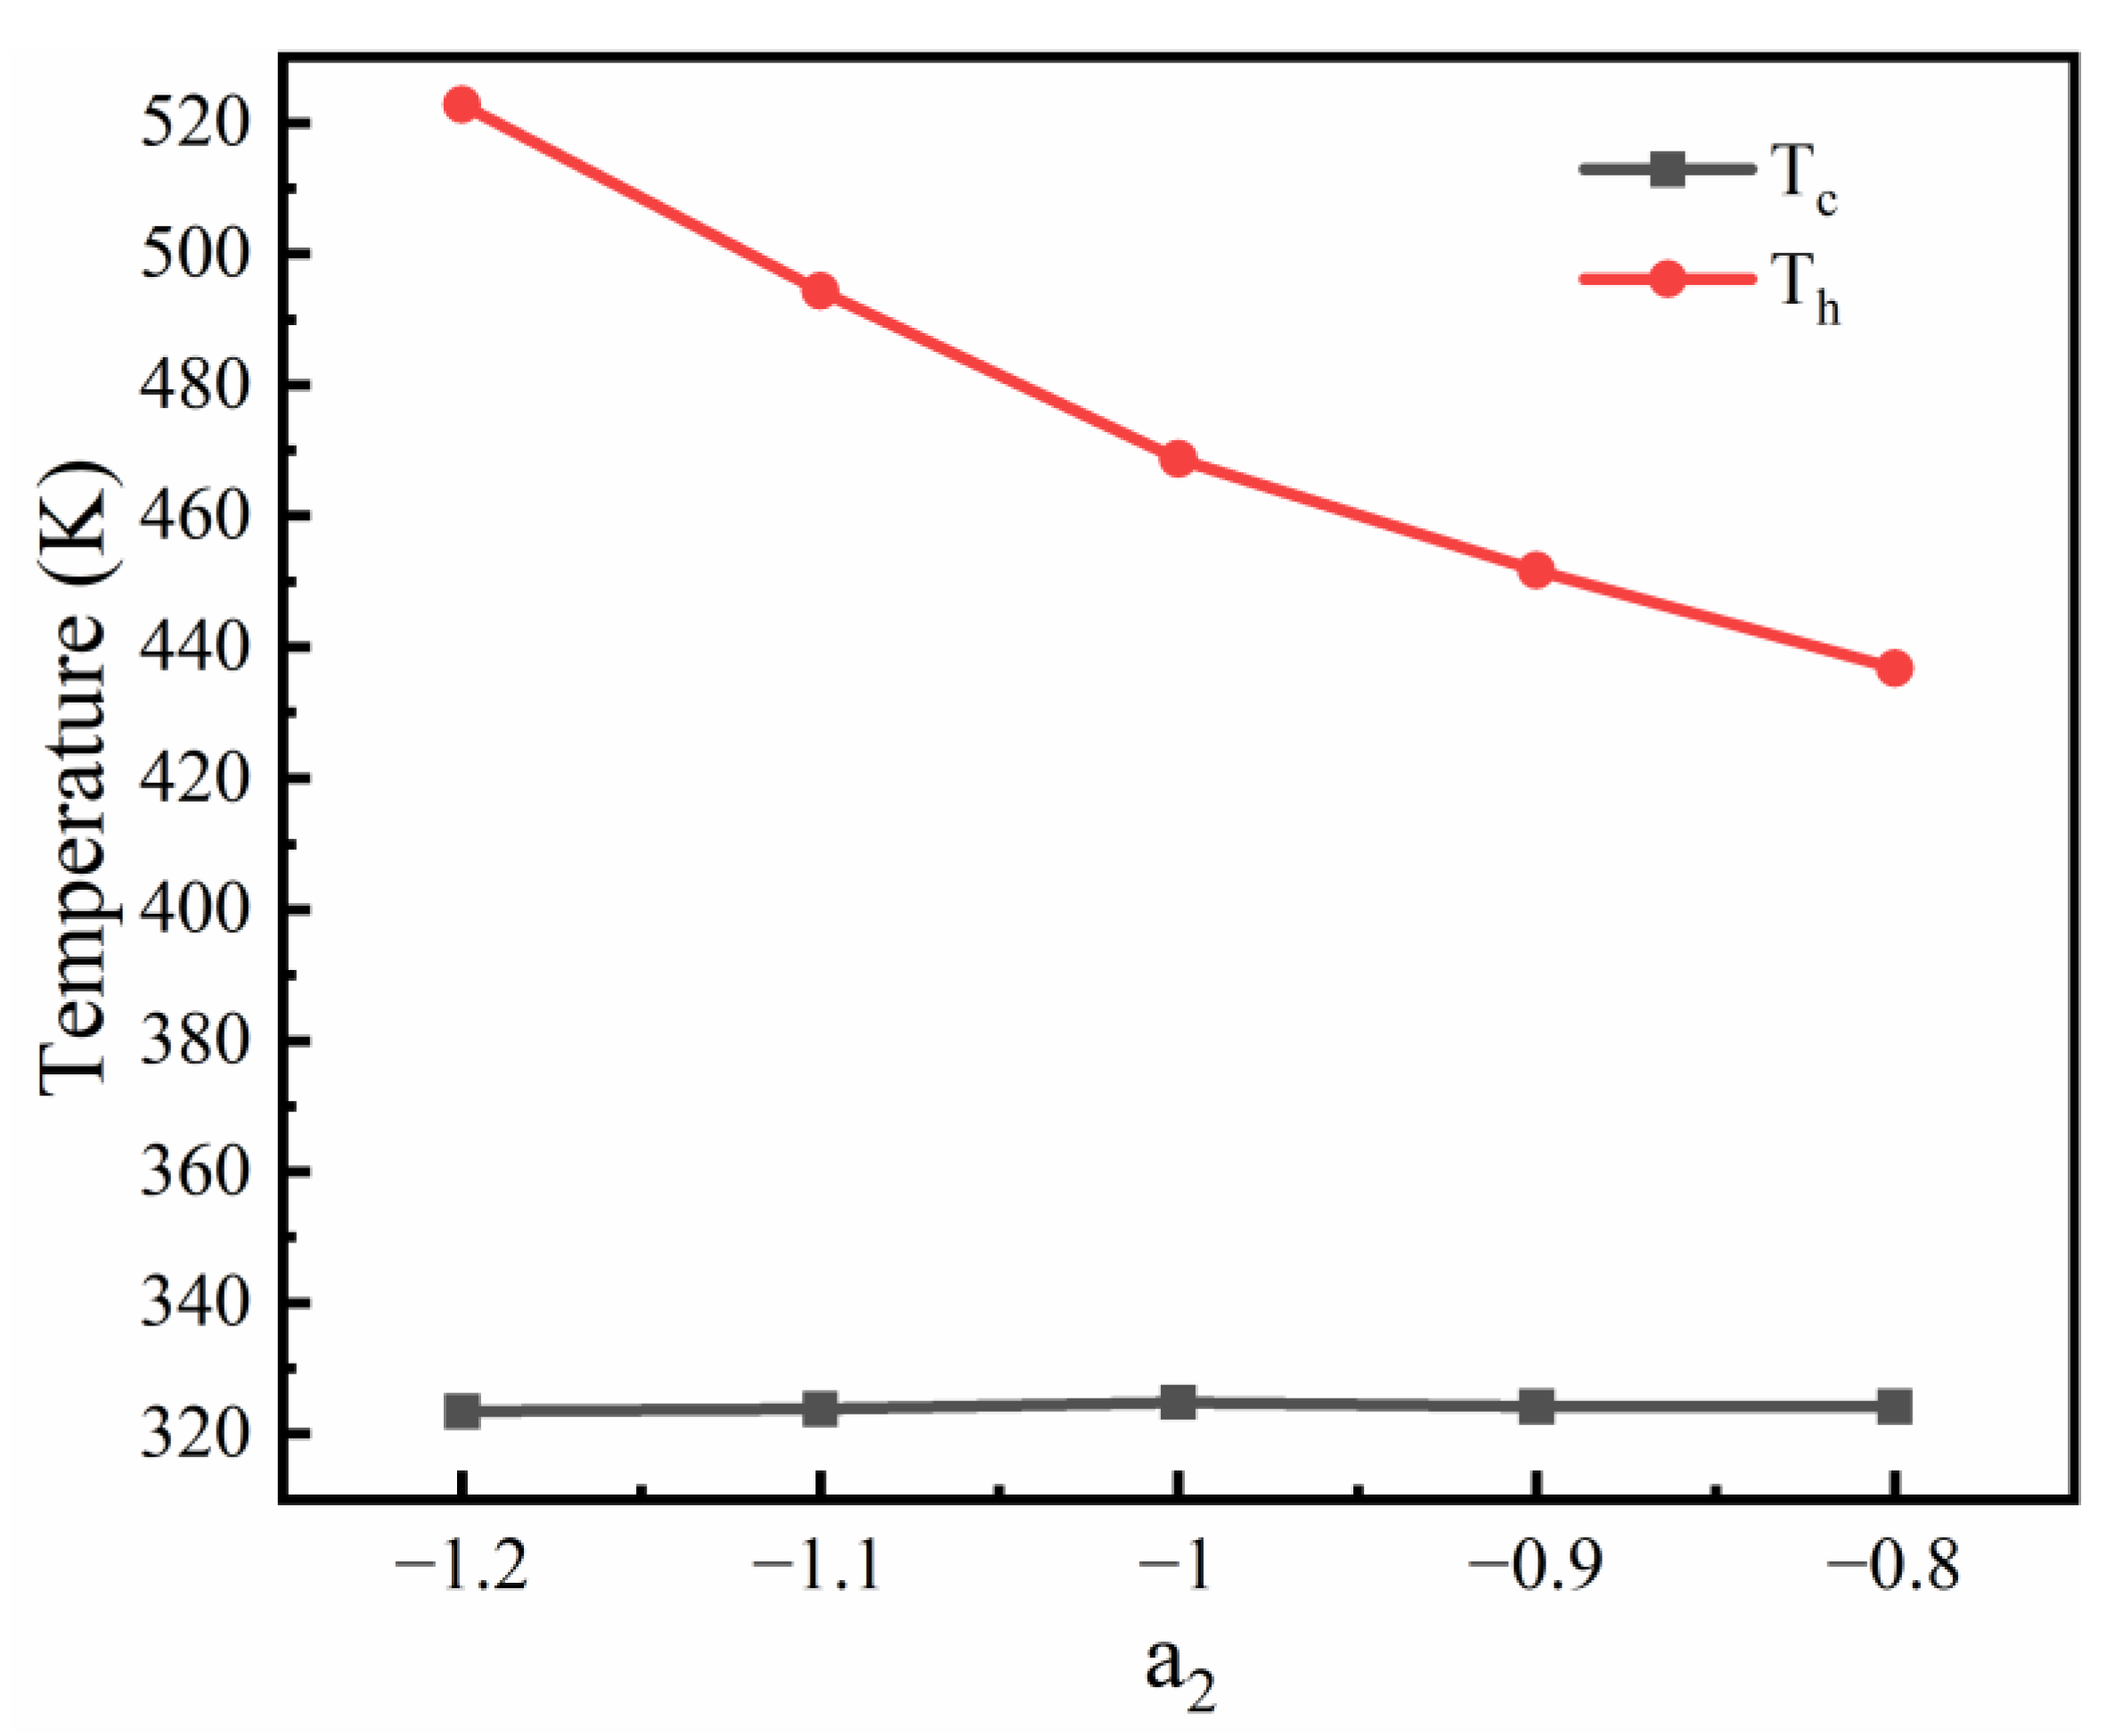
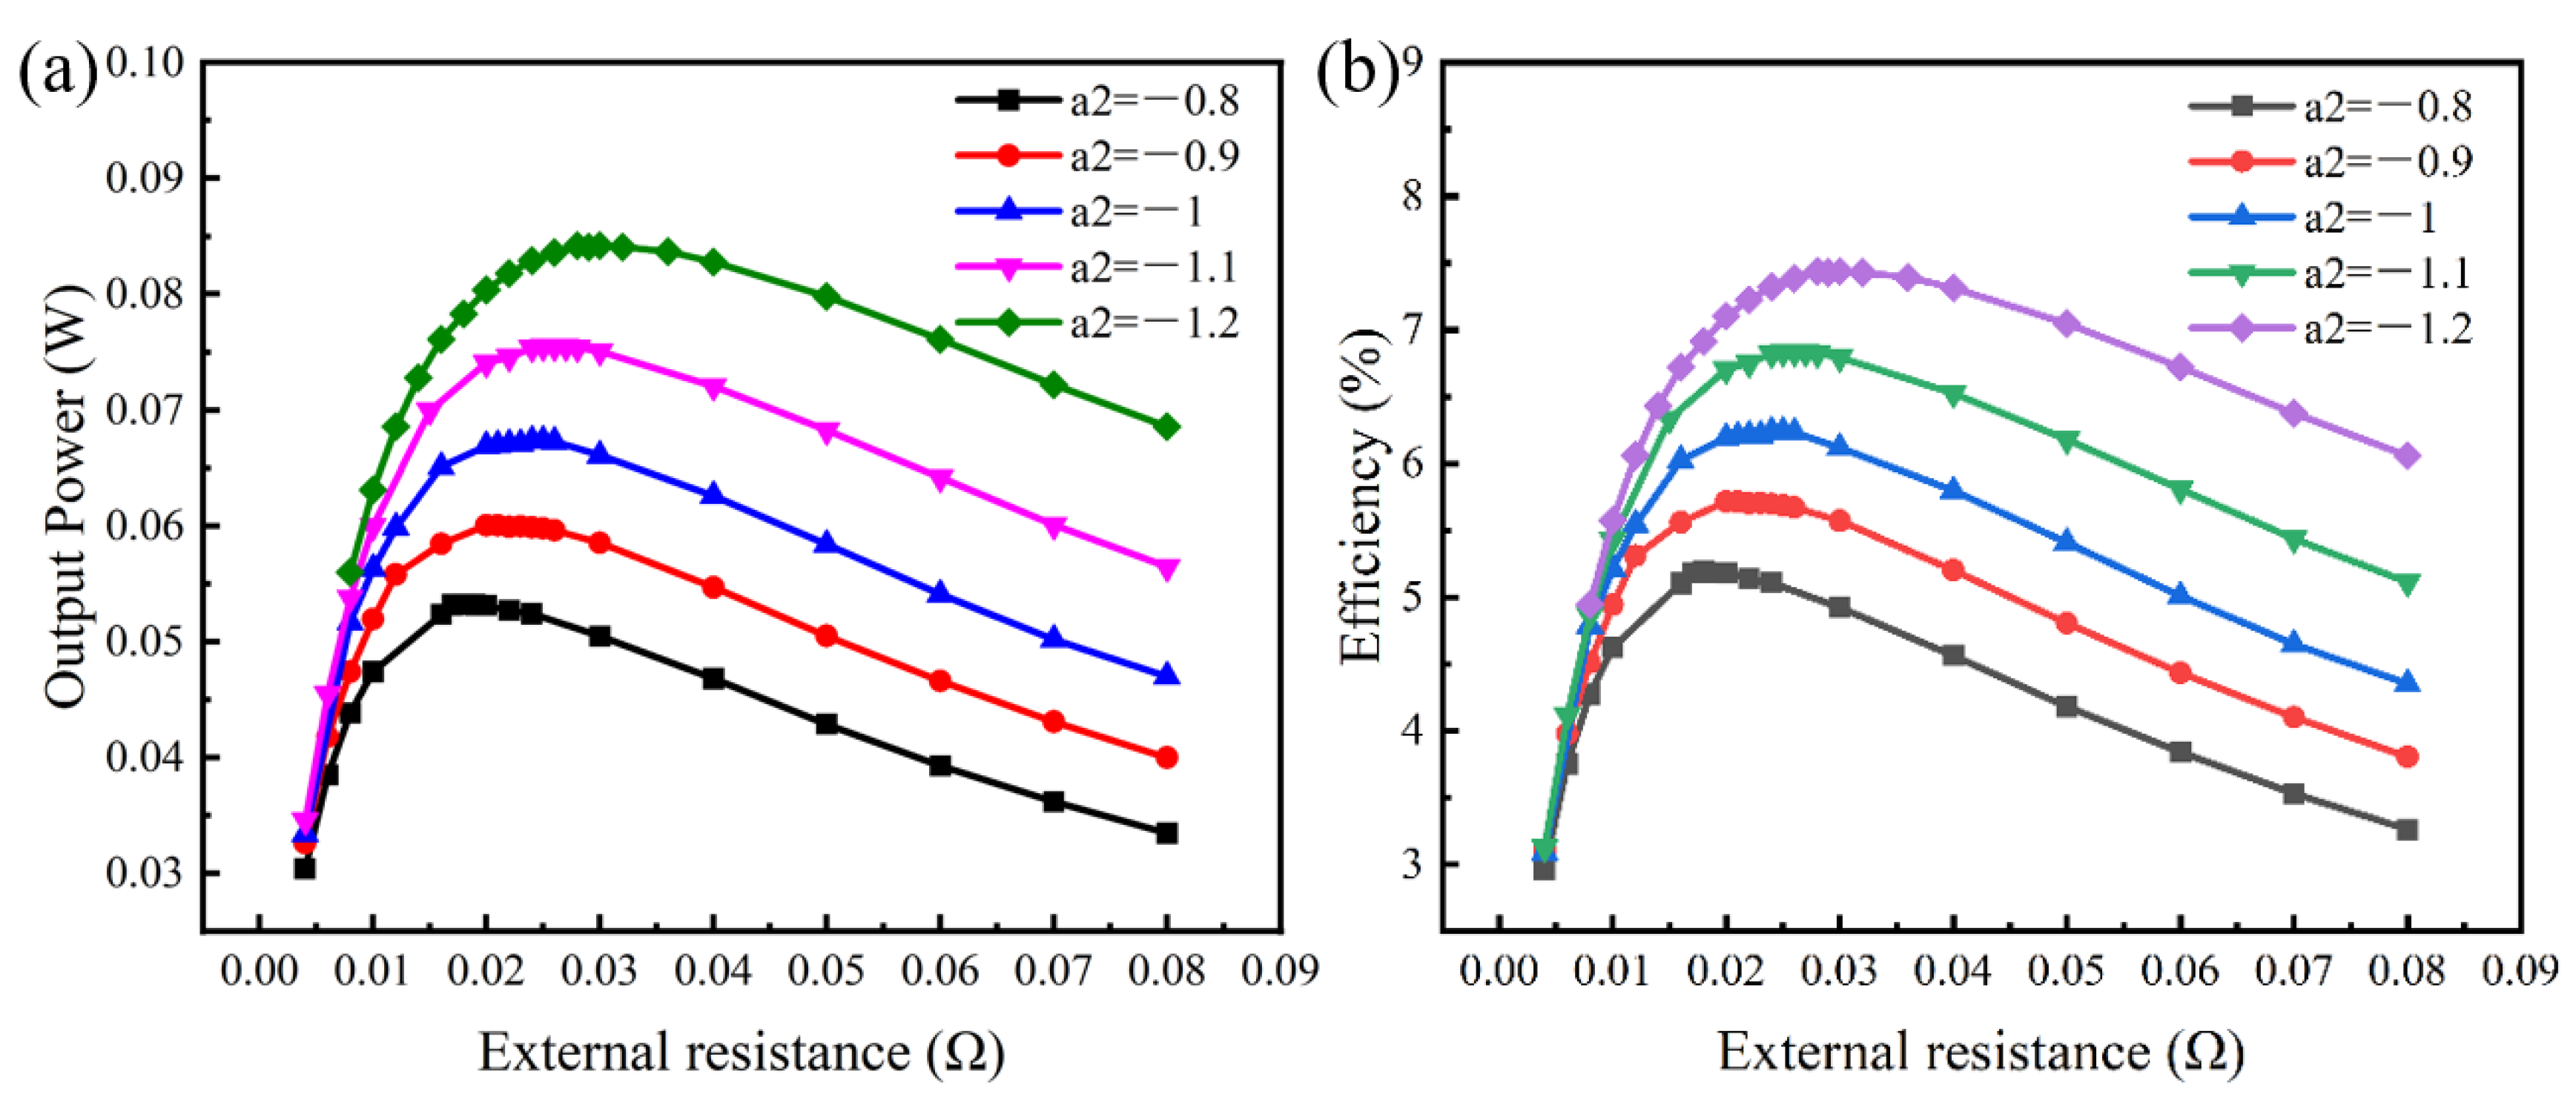
3.5. Performance Analysis of the Hourglass-Shaped TEG

As the results show in Figure 12, it is observed that the shape change of the hourglass-shaped TEGs greatly affected the temperature of the hot end, the influence of temperature on the cold end was slight. When the a2 decreases, the temperature difference of hot and cold ends increases, which is beneficial to the enhancement of the output power and efficiency of the TEGs. The comparisons of the output power and efficiency of the hourglass-shaped TEGs are given in Figure 13a and Figure 13b, respectively. The effect of a2 is obvious on both the output power and efficiency. For the output power, the hourglass-shaped TEG with bigger a2 had a higher value. When a2 was set as −1.2, the maximum output power of the hourglass-shaped TEG increased to 0.084 W. The external resistance corresponding to the maximum output power also increased with growing a2. Similar to the output power, the efficiency of the hourglass-shaped TEG was greater when a2 was bigger. The hourglass-shaped TEG gained the maximum efficiency of around 7.5% when a2 = −1.2 and RL = 0.03 Ω .
To better explain the relationship between the performance and shape of the hourglass-shaped TEG, a shape factor, m, was introduced and defined as follows:
m = A e   A m m 1
where A e is the cross-section area of the hot end and A m is the cross-section area at the middle location of the TE leg. The factor m describes the deformation degree of the hourglass-shaped TEG. A larger m means a smaller cross-section area at the middle location of the leg. The minimum value of m is 1, which is the case for the cylindrical TEG. Figure 14a and Figure 14b, respectively, exhibit the fitting curves of the maximum output power and maximum efficiency of the hourglass-shaped TEGs with changeable m. Both the maximum output power and the maximum efficiency are proportional to the shape factor m. As a consequence, the relationship between the maximum output power and m is given as follows:
P m ax = 0.01726 m + 0.02245   m 1
And the relationship between the maximum efficiency and shape factor m is obtained as follows:
η max = 1.12591 m + 2.71105   m 1
In the previous results of the simulation, the output power and efficiency of the cylindrical TEG were obtained as 0.0395 W and 3.657%, respectively. From the fitting curves, when m = 1 , the output power and efficiency can be 0.03971 W and 3.837%. Compared to the results of simulation, the error reached 0.43% and 4.91%; the small deviation shows the validity of the fitting curves. The fitting equations can give valid predictions on the maximum output power and maximum efficiency. However, the shape factor, m, cannot be too big since the cross-section area of the middle plane will gradually converge to zero when the shape factor, m, grows, which is not acceptable for the real application of TEGs.

4. Conclusions

Based on the numerical simulations, TEGs with variable cross-sections were built and compared with the cylindrical TEG. The effects of the boundary conditions of heat flux and convection coefficient on the performance of TEGs were explored and analyzed. Some conclusions are obtained from the comparison of results among the five shapes of TEGs and are listed as follows:
  • The configuration with variable cross-section can effectively enhance the output power and efficiency of the TEG. The hourglass-shaped TEG had the most outstanding behavior among the five shapes of TEGs.
  • The hourglass-shape raised the maximum output power and efficiency to 0.067 W and 6.24%, which were 69.62% and 70.96% higher than the conventional cylindrical TEG, respectively.
  • Higher heat flux is beneficial to the performance improvement of TEGs, and the convection coefficient of 1400 W/(m2∙K) is recommended because there was little enhancement on the performance when the convection coefficient was over 1400 W/(m2∙K).
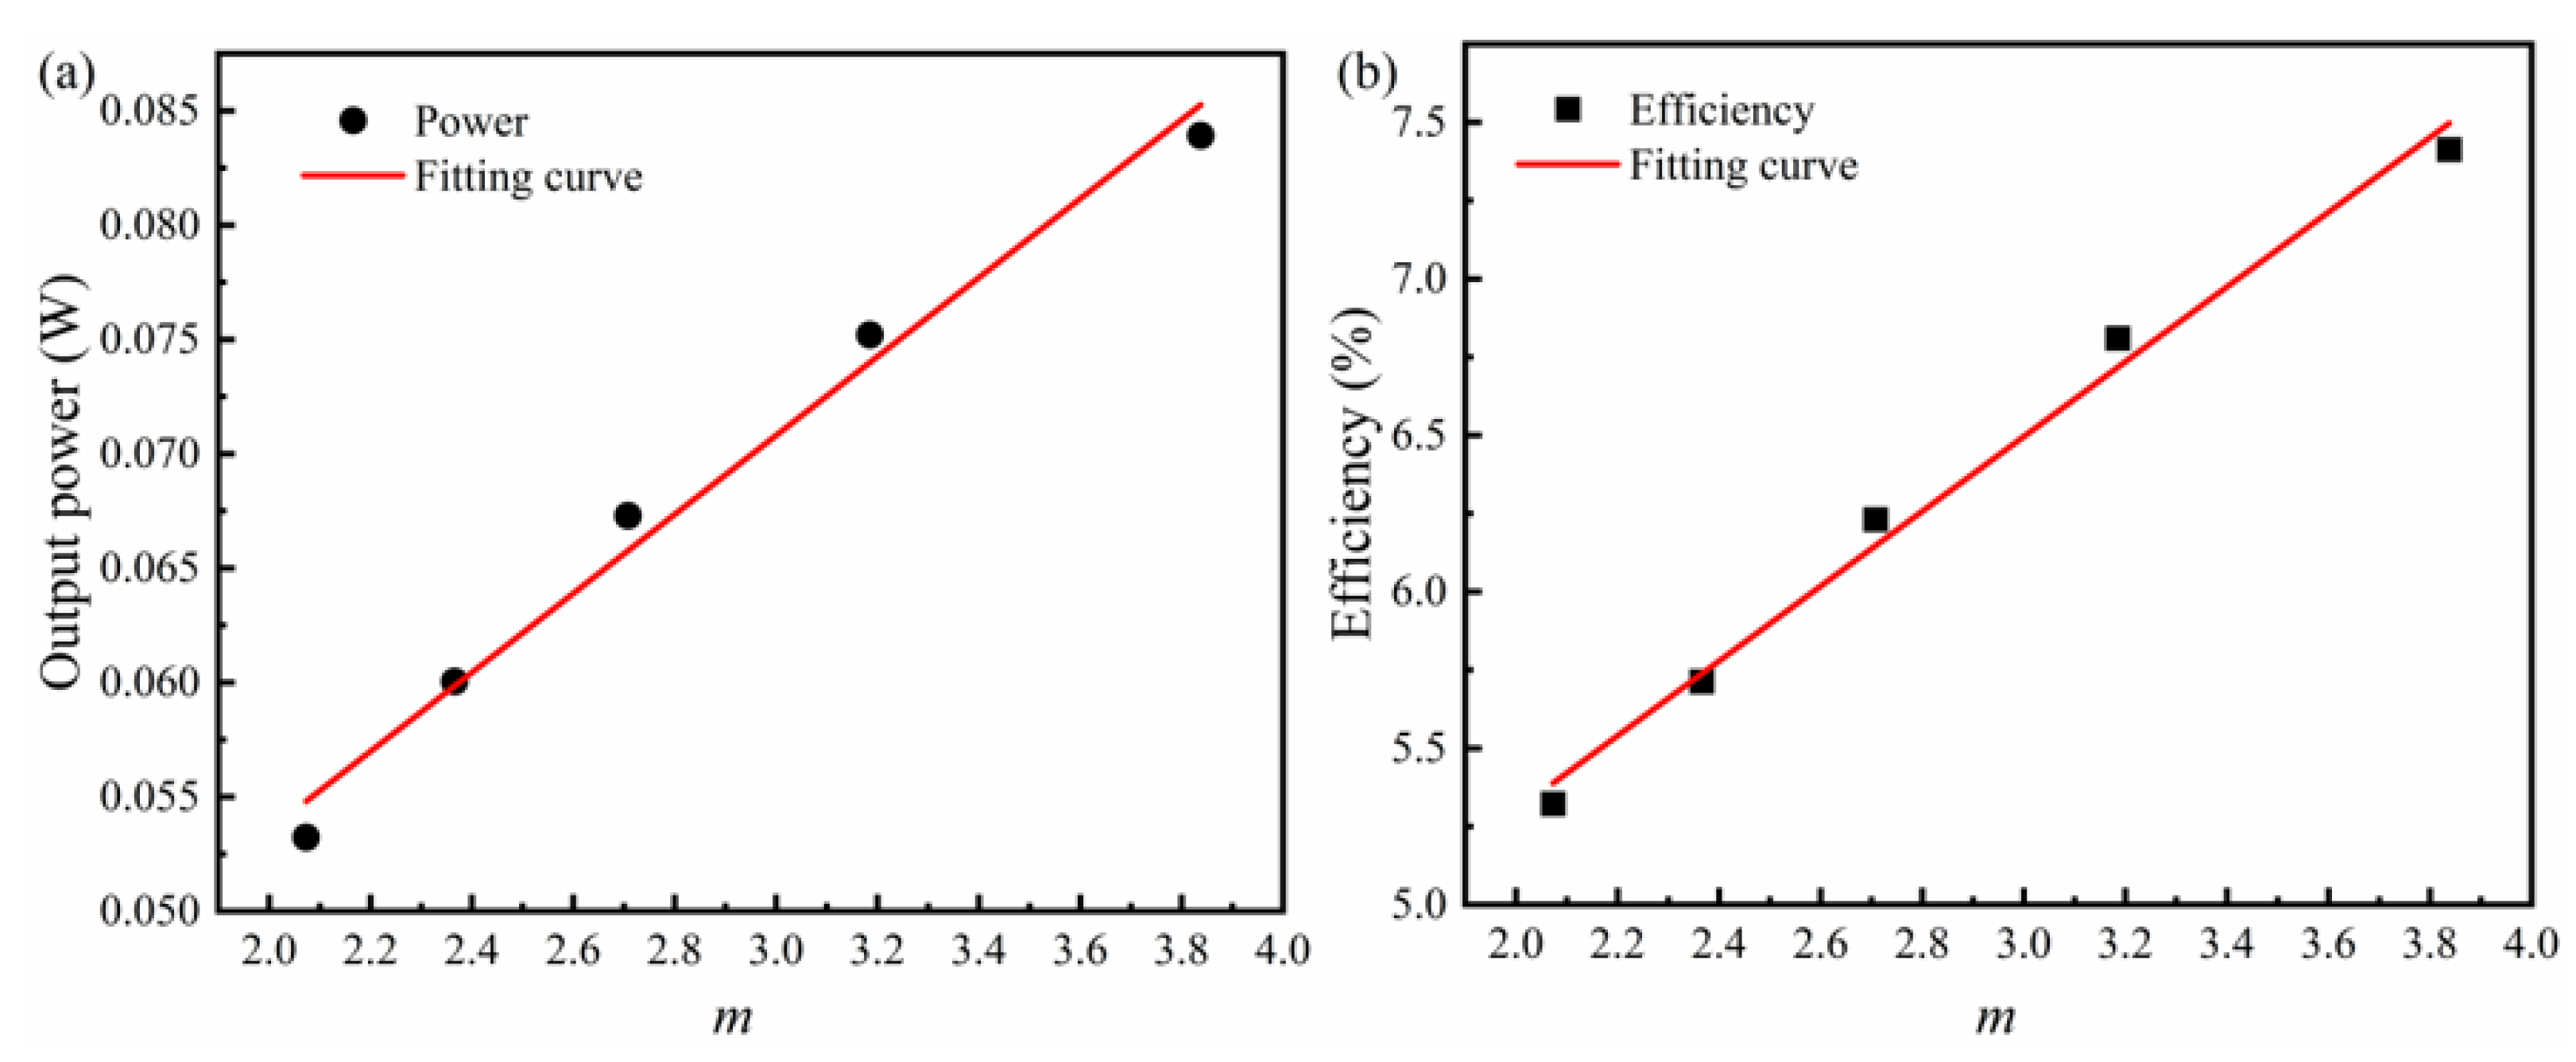
  • The relationships between the maximum output power and efficiency and the shape factor, m, of the hourglass-shaped TEG were obtained according to the fitting results. A larger m will lead to better performance of the hourglass-shaped TEG while the m cannot be too big with consideration of the real situation.

Author Contributions

Investigation, J.L. and Y.S.; methodology, J.L.; writing—original draft, J.L.; software, J.L.; data curation, J.L.; formal analysis, J.L. and Y.S.; writing—reviewing and editing, Y.S.; supervision, G.C. and P.Z.; funding acquisition, G.C. and P.Z. All authors have read and agreed to the published version of the manuscript.

Funding

This research was supported by the National Natural Science Foundation of China (92163215, 92163119, and 52171220).

Conflicts of Interest

The authors declare that they have no known competing financial interests or personal relationships that could have appeared to influence the work reported in this paper. The funder had no role in the design of the study or the manuscript or in the decision to publish the results.

Nomenclature

Aarea [mm2]ZTfigure of merit
Llength [mm]Greek letters
Vvolume [mm3]
V0initial volume [mm3]αSeebeck coefficient [V K−1]
Q heat power [W]κthermal conductivity [W m−1 K−1]
r 0 initial radius [mm]ηefficiency
r radius [mm]σelectrical conductivity [S m−1]
Poutput power [W] Δ difference
Iload current [A]
Ttemperature [K]
Vvoltage [V]Subscripts
Eelectric flied [V m−1]ccold side
Jelectric current flux [A m−2]hhot side
mshape factorininput
P Peltier coefficientIinternal
q heat flux [W m−2]outoutput
Q joule heating energy [W m−3]Lload
ocopen-circuit
legthermoelectric leg
Abbreviationseend
BiTebismuth telluridemmiddle
TEthermoelectric
TEGthermoelectric generator

References

  1. Champier, D. Thermoelectric generators: A review of applications. Energy Convers. Manag. 2017, 140, 167–181. [Google Scholar] [CrossRef]
  2. Zhou, Y.; Paul, S.; Bhunia, S. In Harvesting Wasted Heat in a Microprocessor Using Thermoelectric Generators: Modeling, Analysis and Measurement. In Proceedings of the Design, Automation and Test in Europe Conference and Exhibition, Munich, Germany, 10–14 March 2008; p. 96. [Google Scholar]
  3. Crane, D.T.; Lagrandeur, J.W. Progress Report on BSST-Led US Department of Energy Automotive Waste Heat Recovery Program. J. Electron. Mater. 2010, 39, 2142–2148. [Google Scholar] [CrossRef]
  4. Crane, D.; LaGrandeur, J.; Jovovic, V.; Ranalli, M.; Adldinger, M.; Poliquin, E.; Dean, J.; Kossakovski, D.; Mazar, B.; Maranville, C. TEG On-Vehicle Performance and Model Validation and what it Means for Further TEG Development. J. Electron. Mater. 2013, 42, 1582–1591. [Google Scholar] [CrossRef]
  5. Chen, Y.; Hou, X.N.; Ma, C.Y.; Dou, Y.K.; Wu, W.T. Review of Development Status of Bi2Te3-Based Semiconductor Thermoelectric Power Generation. Adv. Mater. Sci. Eng. 2018, 2018, 1210562. [Google Scholar] [CrossRef]
  6. Al-Merbati, A.S.; Yilbas, B.S.; Sahin, A.Z. Thermodynamics and thermal stress analysis of thermoelectric power generator: Influence of pin geometry on device performance. Appl. Therm. Eng. 2013, 50, 683–692. [Google Scholar] [CrossRef]
  7. Erturun, U.; Erermis, K.; Mossi, K. Effect of various leg geometries on thermo-mechanical and power generation performance of thermoelectric devices. Appl. Therm. Eng. 2014, 73, 128–141. [Google Scholar] [CrossRef]
  8. Sahin, A.Z.; Yilbas, B.S. The thermoelement as thermoelectric power generator: Effect of leg geometry on the efficiency and power generation. Energy Convers. Manag. 2013, 65, 26–32. [Google Scholar] [CrossRef]
  9. Erturun, U.; Mossi, K. Thermoelectric devices with rotated and coaxial leg configurations: Numerical analysis of performance. Appl. Therm. Eng. 2015, 85, 304–312. [Google Scholar] [CrossRef]
  10. Khalil, A.; Elhassnaoui, A.; Yadir, S.; Abdellatif, O.; Errami, Y.; Sahnoun, S. Performance comparison of TEGs for diverse variable leg geometry with the same leg volume. Energy 2021, 224, 119967. [Google Scholar] [CrossRef]
  11. Li, M.; Dizaji, H.S.; Asaadi, S.; Jarad, F.; Anqi, A.E.; Wae-hayee, M. Thermo-economic, exergetic and mechanical analysis of thermoelectric generator with hollow leg structure; impact of leg cross-section shape and hollow-to-filled area ratio. Case Stud. Therm. Eng. 2021, 27, 101314. [Google Scholar] [CrossRef]
  12. Liu, H.B.; Wang, S.L.; Yang, Y.R.; Chen, W.H.; Wang, X.D. Theoretical analysis of performance of variable cross-section thermoelectric generators: Effects of shape factor and thermal boundary conditions. Energy 2020, 201, 117660. [Google Scholar] [CrossRef]
  13. Karana, D.R.; Sahoo, R.R. Influence of geometric parameter on the performance of a new asymmetrical and segmented thermoelectric generator. Energy 2019, 179, 90–99. [Google Scholar] [CrossRef]
  14. Ge, Y.; He, K.; Xiao, L.H.; Yuan, W.Z.; Huang, S.M. Geometric optimization for the thermoelectric generator with variable cross-section legs by coupling finite element method and optimization algorithm. Renew. Energy 2022, 183, 294–303. [Google Scholar] [CrossRef]
  15. Wang, P.; Wang, B.L.; Wang, K.F.; Gao, R.X.; Xi, L. An analytical model for performance prediction and optimization of thermoelectric generators with varied leg cross-sections. Int. J. Heat Mass Transf. 2021, 174, 121292. [Google Scholar] [CrossRef]
  16. Hossain, M.S.; Li, T.Z.; Yu, Y.; Yong, J.; Bahk, J.H.; Skafidas, S. Recent advances in printable thermoelectric devices: Materials, printing techniques, and applications. RSC Adv. 2020, 10, 8421–8434. [Google Scholar] [CrossRef]
  17. Orrill, M.; LeBlanc, S. Printed thermoelectric materials and devices: Fabrication techniques, advantages, and challenges. J. Appl. Polym. Sci. 2017, 134, 44256. [Google Scholar] [CrossRef]
  18. Bian, M.X.; Xu, Z.H.; Meng, C.F.; Zhao, H.Y.; Tang, X.B. Novel geometric design of thermoelectric leg based on 3D printing for radioisotope thermoelectric generator. Appl. Therm. Eng. 2022, 212, 118514. [Google Scholar] [CrossRef]
  19. Ibeagwu, O.I. Modelling and comprehensive analysis of TEGs with diverse variable leg geometry. Energy 2019, 180, 90–106. [Google Scholar] [CrossRef]
  20. Jia, X.D.; Guo, Q.T. Design study of Bismuth-Telluride-based thermoelectric generators based on thermoelectric and mechanical performance. Energy 2020, 190, 116226. [Google Scholar] [CrossRef]
  21. Shittu, S.; Li, G.; Zhao, X.; Ma, X.; Akhlaghi, Y.G.; Ayodele, E. High performance and thermal stress analysis of a segmented annular thermoelectric generator. Energy Convers. Manag. 2019, 184, 180–193. [Google Scholar] [CrossRef]
  22. Date, A.; Date, A.; Dixon, C.; Akbarzadeh, A. Theoretical and experimental study on heat pipe cooled thermoelectric generators with water heating using concentrated solar thermal energy. Sol. Energy 2014, 105, 656–668. [Google Scholar] [CrossRef]
  23. Settaluri, K.T.; Lo, H.Y.; Ram, R.J. Thin Thermoelectric Generator System for Body Energy Harvesting. J. Electron. Mater. 2012, 41, 984–988. [Google Scholar] [CrossRef]
  24. Chen, W.H.; Wang, C.C.; Hung, C.I.; Yang, C.C.; Juang, R.C. Modeling and simulation for the design of thermal-concentrated solar thermoelectric generator. Energy 2014, 64, 287–297. [Google Scholar] [CrossRef]
  25. Sisik, B.; LeBlanc, S. The Influence of Leg Shape on Thermoelectric Performance Under Constant Temperature and Heat Flux Boundary Conditions. Front. Mater. 2020, 7, 595955. [Google Scholar] [CrossRef]
  26. Zhu, W.C.; Weng, Z.B.; Li, Y.; Zhang, L.Q.; Zhao, B.; Xie, C.J.; Shi, Y.; Huang, L.; Yan, Y.G. Theoretical analysis of shape factor on performance of annular thermoelectric generators under different thermal boundary conditions. Energy 2022, 239, 122285. [Google Scholar] [CrossRef]
  27. Ben Abdallah, G.; Besbes, S.; Ben Aissia, H.; Jay, J. Analysis of the effect of a pulsed heat flux on the performance improvements of a thermoelectric generator. Appl. Therm. Eng. 2019, 158, 113728. [Google Scholar] [CrossRef]
  28. Li, G.Q.; Zhao, X.D.; Jin, Y.; Chen, X.; Ji, J.; Shittu, S. Performance Analysis and Discussion on the Thermoelectric Element Footprint for PV-TE Maximum Power Generation. J. Electron. Mater. 2018, 47, 5344–5351. [Google Scholar] [CrossRef]
  29. Suzuki, R.O.; Ito, K.O.; Oki, S. Analysis of the Performance of Thermoelectric Modules Under Concentrated Radiation Heat Flux. J. Electron. Mater. 2016, 45, 1827–1835. [Google Scholar] [CrossRef]
  30. Ferreira-Teixeira, S.; Pereira, A.M. Geometrical optimization of a thermoelectric device: Numerical simulations. Energy Convers. Manag. 2018, 169, 217–227. [Google Scholar] [CrossRef]
  31. Ge, Y.; Liu, Z.C.; Sun, H.N.; Liu, W. Optimal design of a segmented thermoelectric generator based on three-dimensional numerical simulation and multi-objective genetic algorithm. Energy 2018, 147, 1060–1069. [Google Scholar] [CrossRef]
Figure 1. Schematics of TEG models with (a) cylindrical legs, (b) cup-shaped legs, (c) inverse cup-shaped legs, (d) barrel-shaped legs, and (e) hourglass-shaped legs.
Energies 16 04473 g001
Figure 2. The ZT value of TE materials.
Energies 16 04473 g002
Figure 3. Schematic of TEG with loop circuit.
Energies 16 04473 g003
Figure 4. Grid independence test.
Energies 16 04473 g004
Figure 5. Validation results of (a) potential difference, (b) hot-side heat, (c) output power, and (d) efficiency with Ref. [15] under different temperature differences.
Energies 16 04473 g005
Figure 6. Variation in output power of five shapes of TEGs with different external resistances.
Energies 16 04473 g006
Figure 7. Variation in efficiency of five shapes of TEGs with different external resistances.
Energies 16 04473 g007
Figure 8. The temperatures of the (a) hot end and (b) cold end of five shapes of TEGs under different constant heat fluxes.
Energies 16 04473 g008
Figure 9. The (a) output power and (b) efficiency of five shapes of TEGs under different heat fluxes.
Energies 16 04473 g009
Figure 10. The temperatures of the (a) hot end and (b) cold end of five shapes of TEGs under different convection coefficients.
Energies 16 04473 g010
Figure 11. The (a) output power and (b) efficiency of five shapes of TEGs under different convection coefficients.
Energies 16 04473 g011
Figure 12. The temperature of the cold and hot ends of five hourglass-shaped TEGs at best output power.
Energies 16 04473 g012
Figure 13. Variation in (a) output power and (b) efficiency of five hourglass-shaped TEGs with different external resistances.
Energies 16 04473 g013
Figure 14. The fitting results of (a) output power and (b) efficiency with different shape factors, m, of hourglass-shaped TEGs.
Energies 16 04473 g014
Table 1. The dimension parameters of TE legs.
Shapes a 1 a 2   Volume (mm3)Length (mm)
Cylindrical leg0030.963
Cup leg0.06658−0.130.963
Inverse cup leg0.06658−0.130.963
Barrel leg0−0.266730.963
Hourglass leg0.65903−130.963
Table 2. Material properties used in simulations (T is the temperature) [28,29].
Propertiesp-Type Bi2Te3n-Type Bi2Te3CeramicCopperWelding Layer
Seebeck coefficient: α(T) [V K−1](−0.003638095 × T2 + 2.74380952 × T − 296.214286) × 10−6(0.00153073 × T2 − 1.08058874 × T2 − 28.338095) × 10−6
Electrical conductivity:
σ(T) [s m−1]
(0.015601732 × T2 − 15.708052 × T + 4466.38095 × 102(0.01057143 × T2 − 10.16048 × T + 3113.714229) × 102 5.814 × 1037.299 × 103
Thermal conductivity:
κ(T) [W m−1 K−1]
0.0000361558 × T2 − 0.026351342 × T + 6.221620.0000334545 × T2 − 0.023350303 × T + 5.6063332740037.8
Table 3. Temperature difference of the five shapes of TEGs.
ModelTemperature Difference (K)
Cylindrical75.76
Barrel shaped86.08
Cup shaped83.26
Inverse cup shaped83.20
Hourglass shaped150.60
Disclaimer/Publisher’s Note: The statements, opinions and data contained in all publications are solely those of the individual author(s) and contributor(s) and not of MDPI and/or the editor(s). MDPI and/or the editor(s) disclaim responsibility for any injury to people or property resulting from any ideas, methods, instructions or products referred to in the content.

