
Investigation of Thermo-Hydraulic Performances of Artificial Ribs Mounted in a Rectangular Duct
 , , and
Abstract
:1. Introduction
2. Experimental Procedure
- (i)
- a rectangular duct divided into three sections,
- (ii)
- a heating plate,
- (iii)
- digital thermocouples,
- (iv)
- a U-tube manometer,
- (v)
- an inclined manometer.
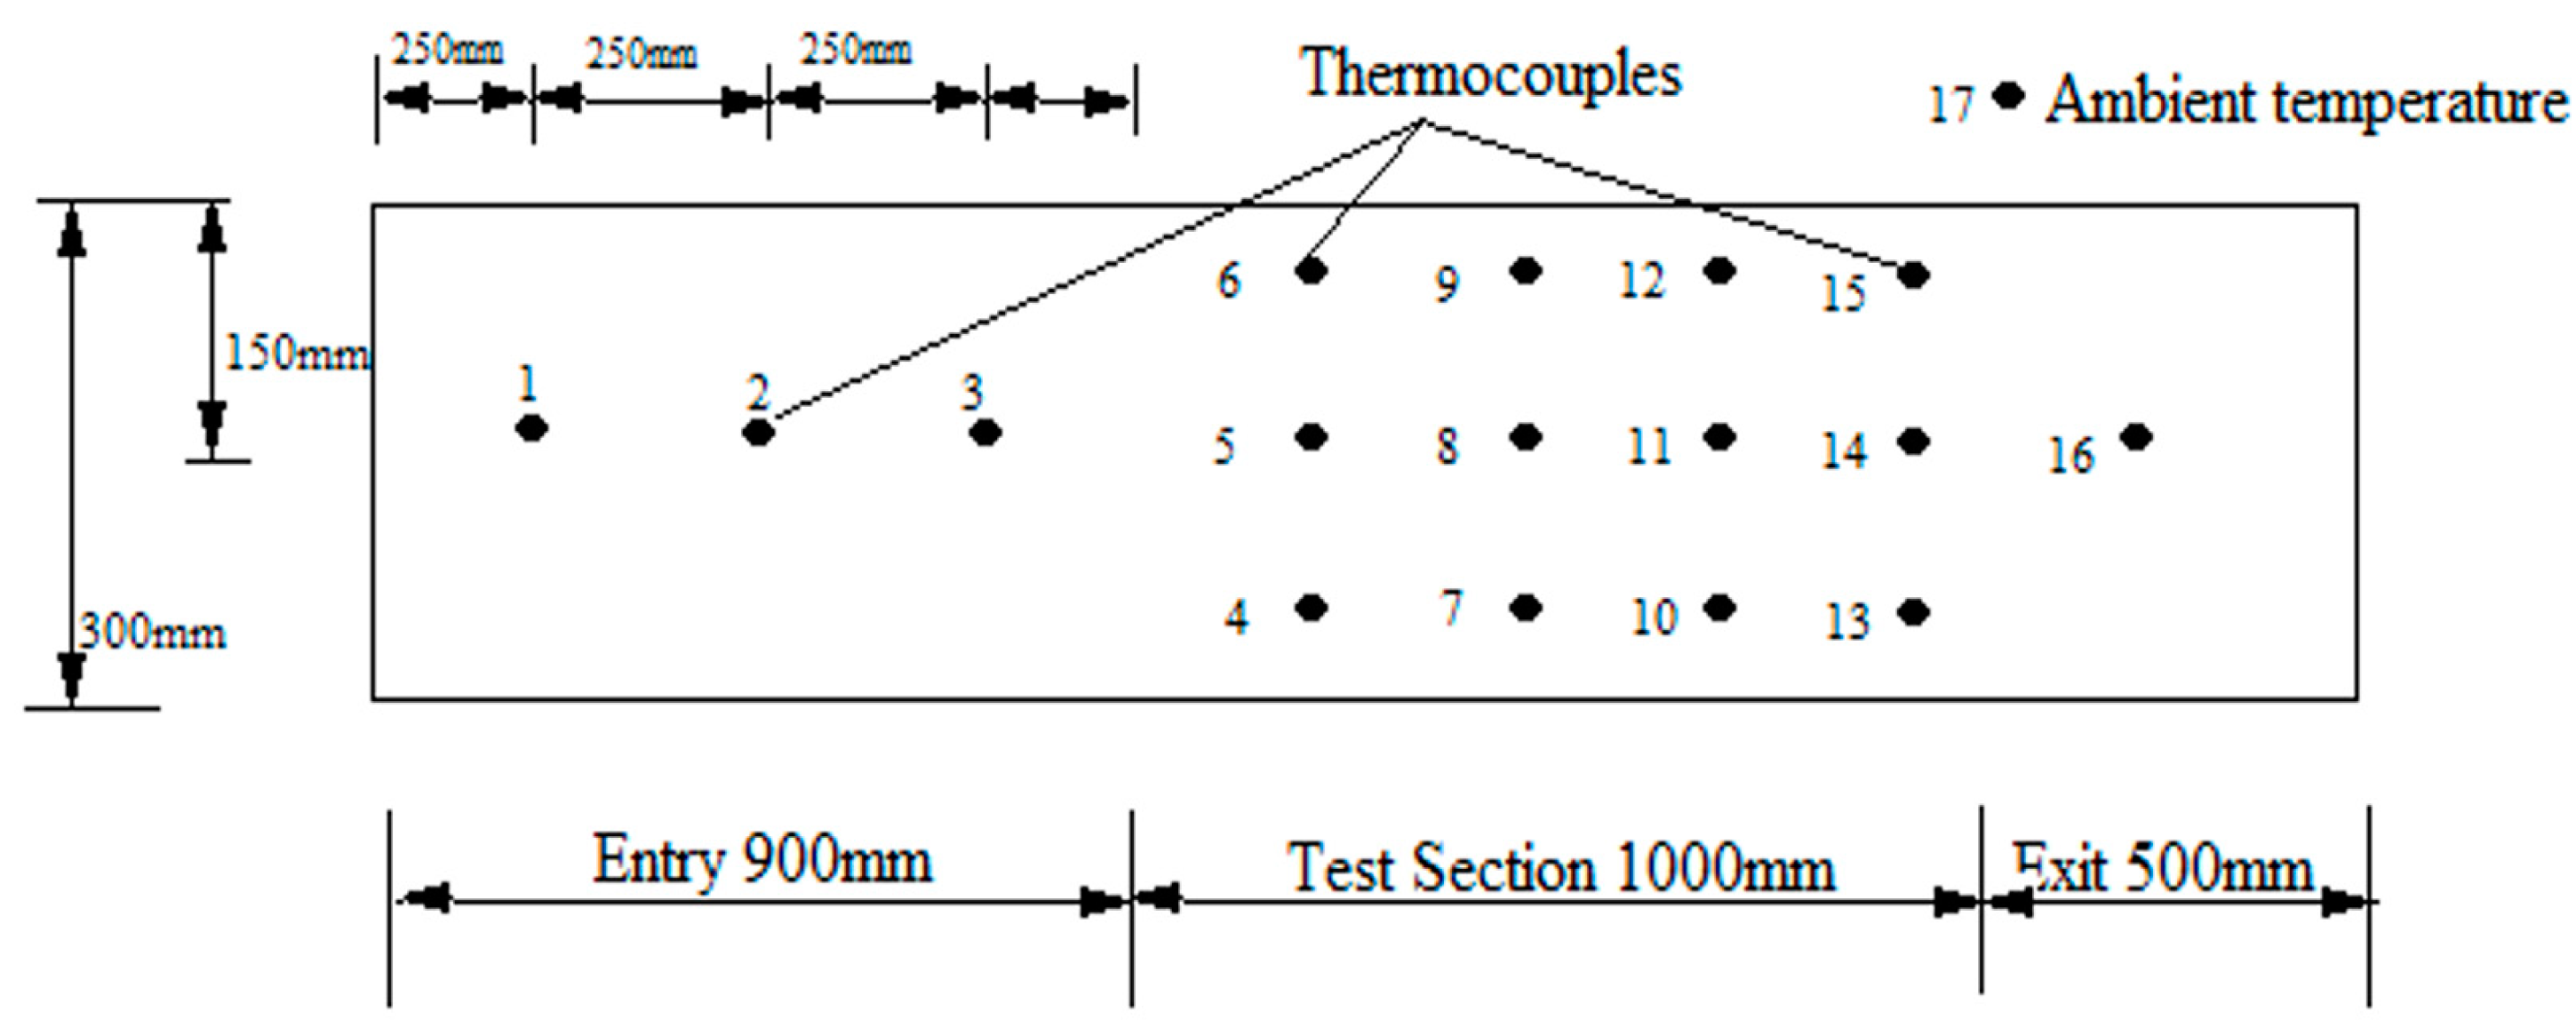
2.1. Test Section
2.2. Absorber Plate
2.3. Measuring Instruments
2.4. Working Procedure
- (a)
- In total, 12 different temperatures recorded in the test section (tp), inlet (ti), outlet (to), and ambient temperature (ta) were measured for analysis
- (b)
- Pressure drop readings were observed at the exit section of the duct (∆p).
- (c)
- ƒ was measured by the pressure drop across the test section(∆po).
2.5. Uncertainties Analysis
3. Numerical Setup
3.1. Governing Equation
- i.
- Mass conservation or continuity equation:
- ii.
- Momentum conservation or Navier–Stokes equation:
- iii.
- Energy conservation equation:
- iv.
- Reynolds number
- v.
- Nusselt number
- vi.
- Friction factor
- vii.
- Thermo-hydraulic performances parameter
- viii.
- Dittus–Boelter equation [24]:
- ix.
- Blasius equation:
3.2. Validation of Turbulent Model
- (a)
- The standard k-ε model,
- (b)
- The renormalization k-ε model,
- (c)
- The realizable k-ε model,
- (d)
- The standard k-ω model,
- (e)
- The SST k-ω model.
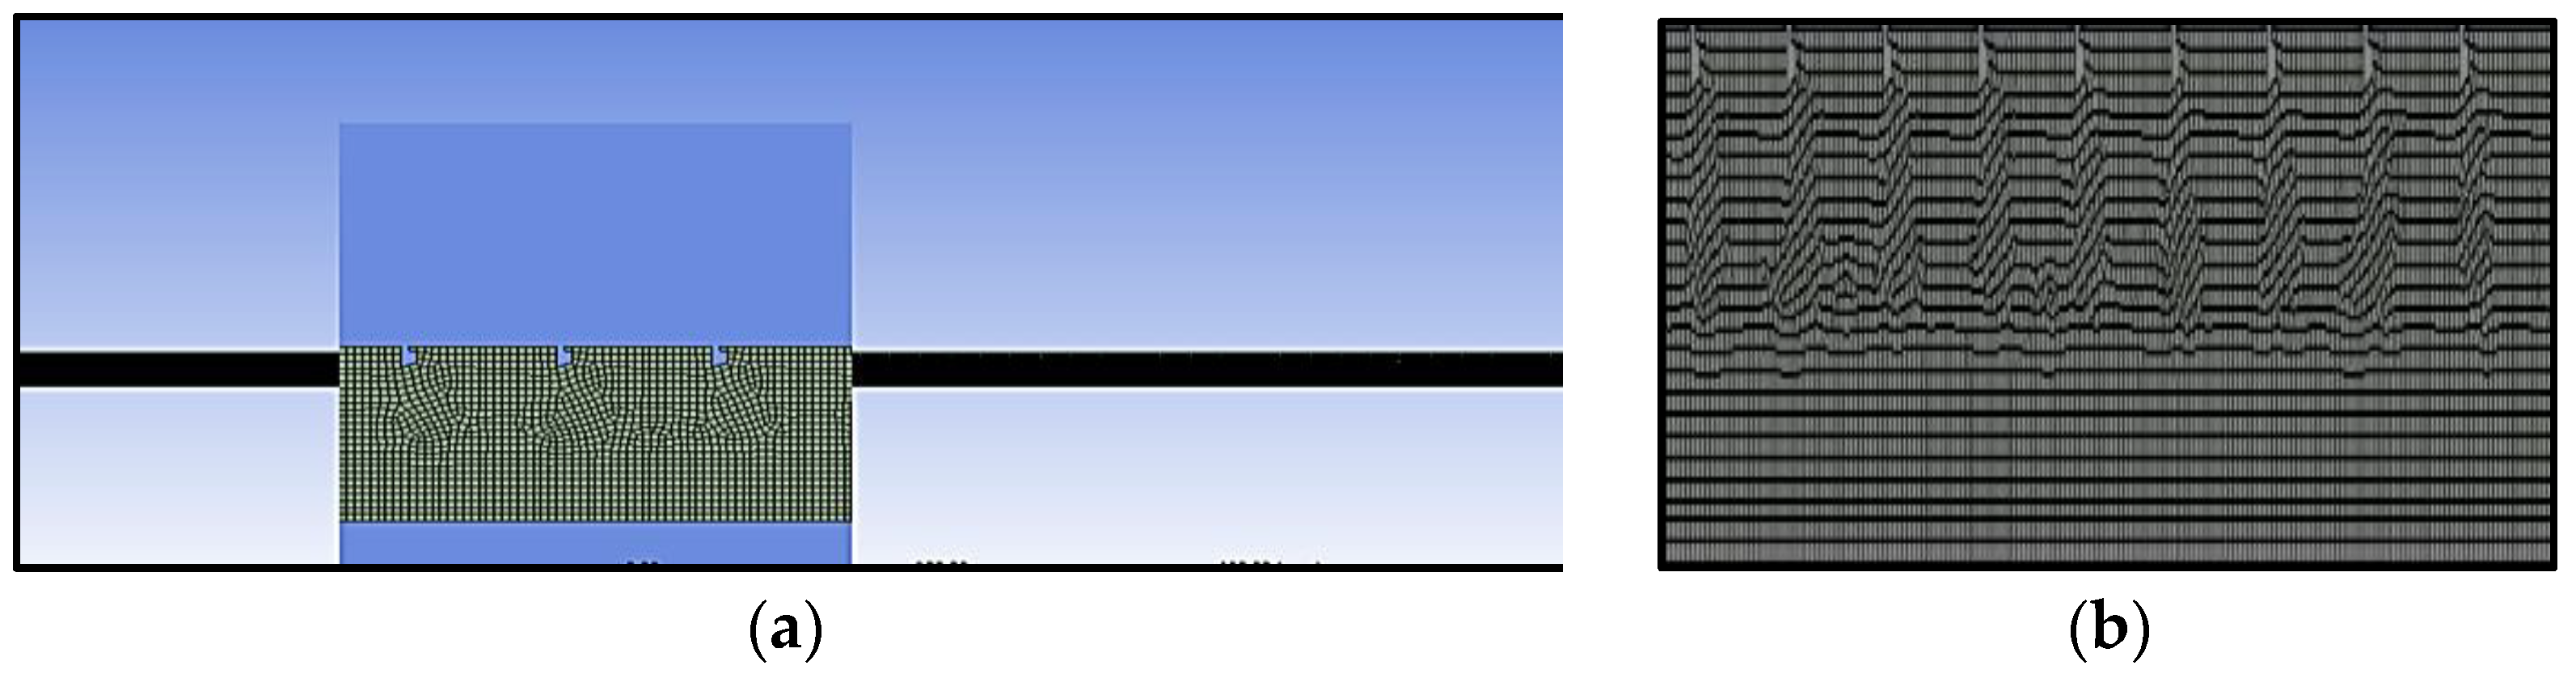
3.3. Solution Procedure
4. Result and Discussion
4.1. Experimental Results
4.1.1. Nusselt Number Characterization
4.1.2. Friction Factor Characterization
4.1.3. Thermo Hydraulic Performance (THP)
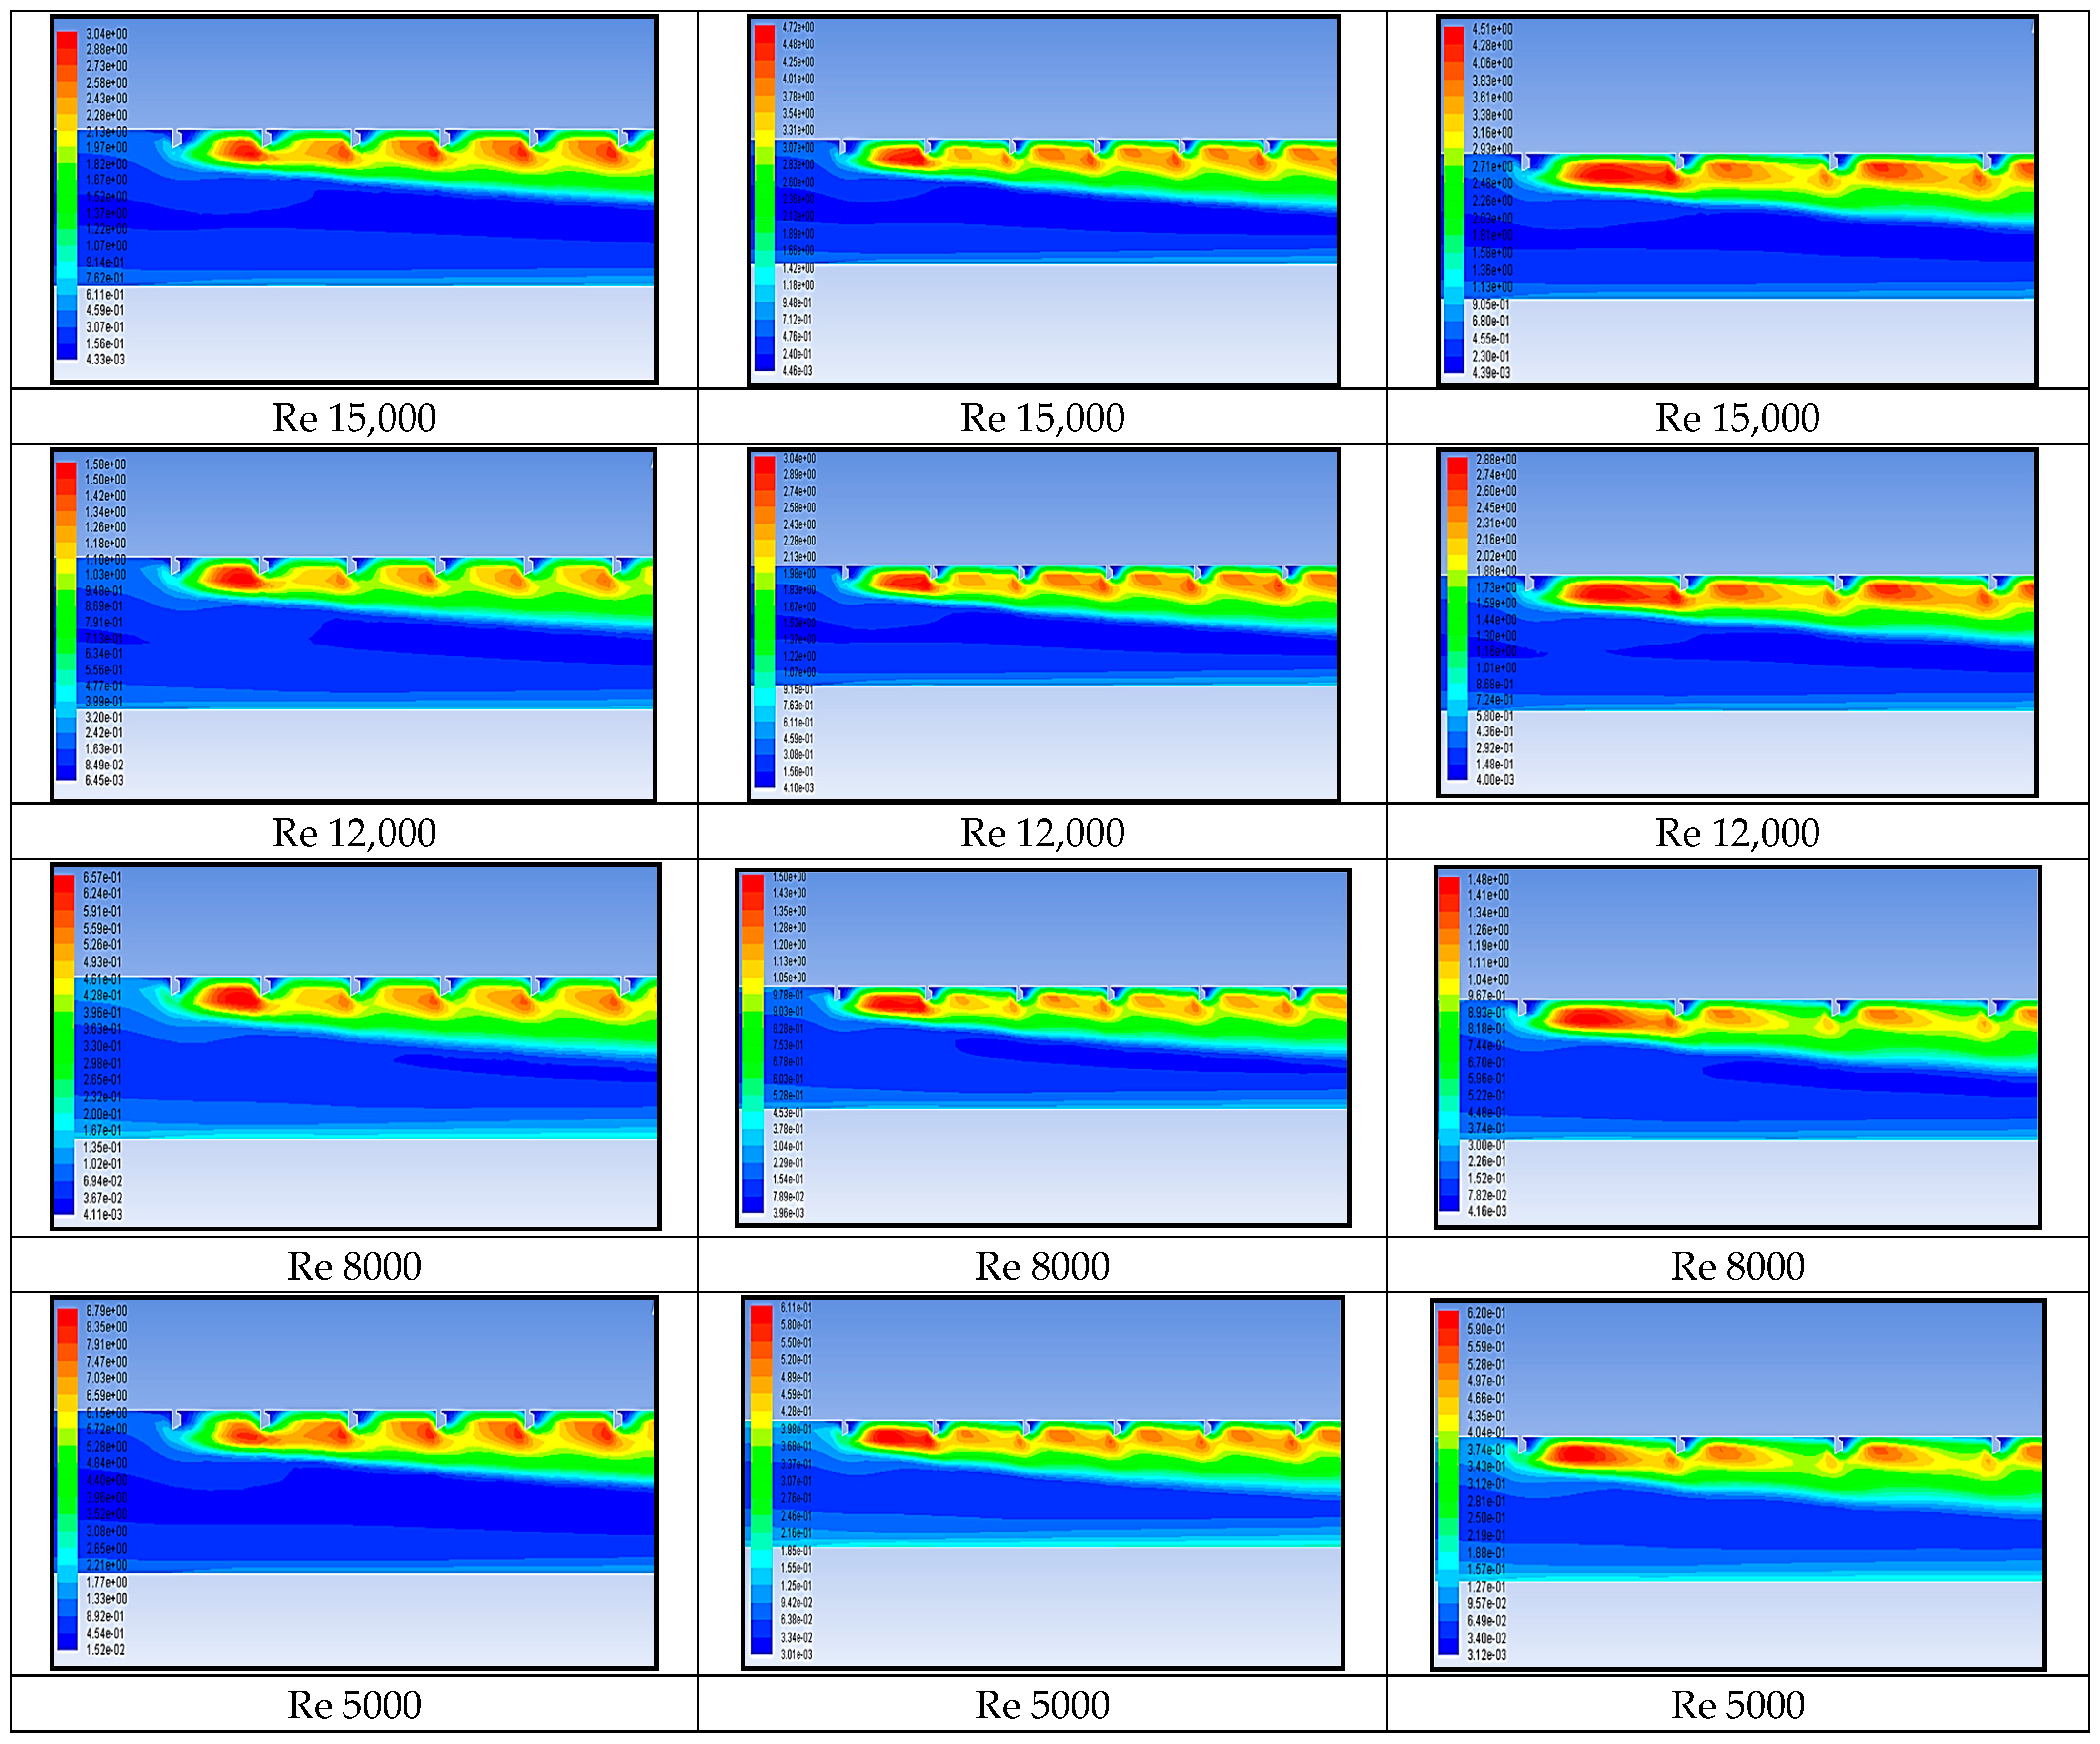
4.2. Numerical Results
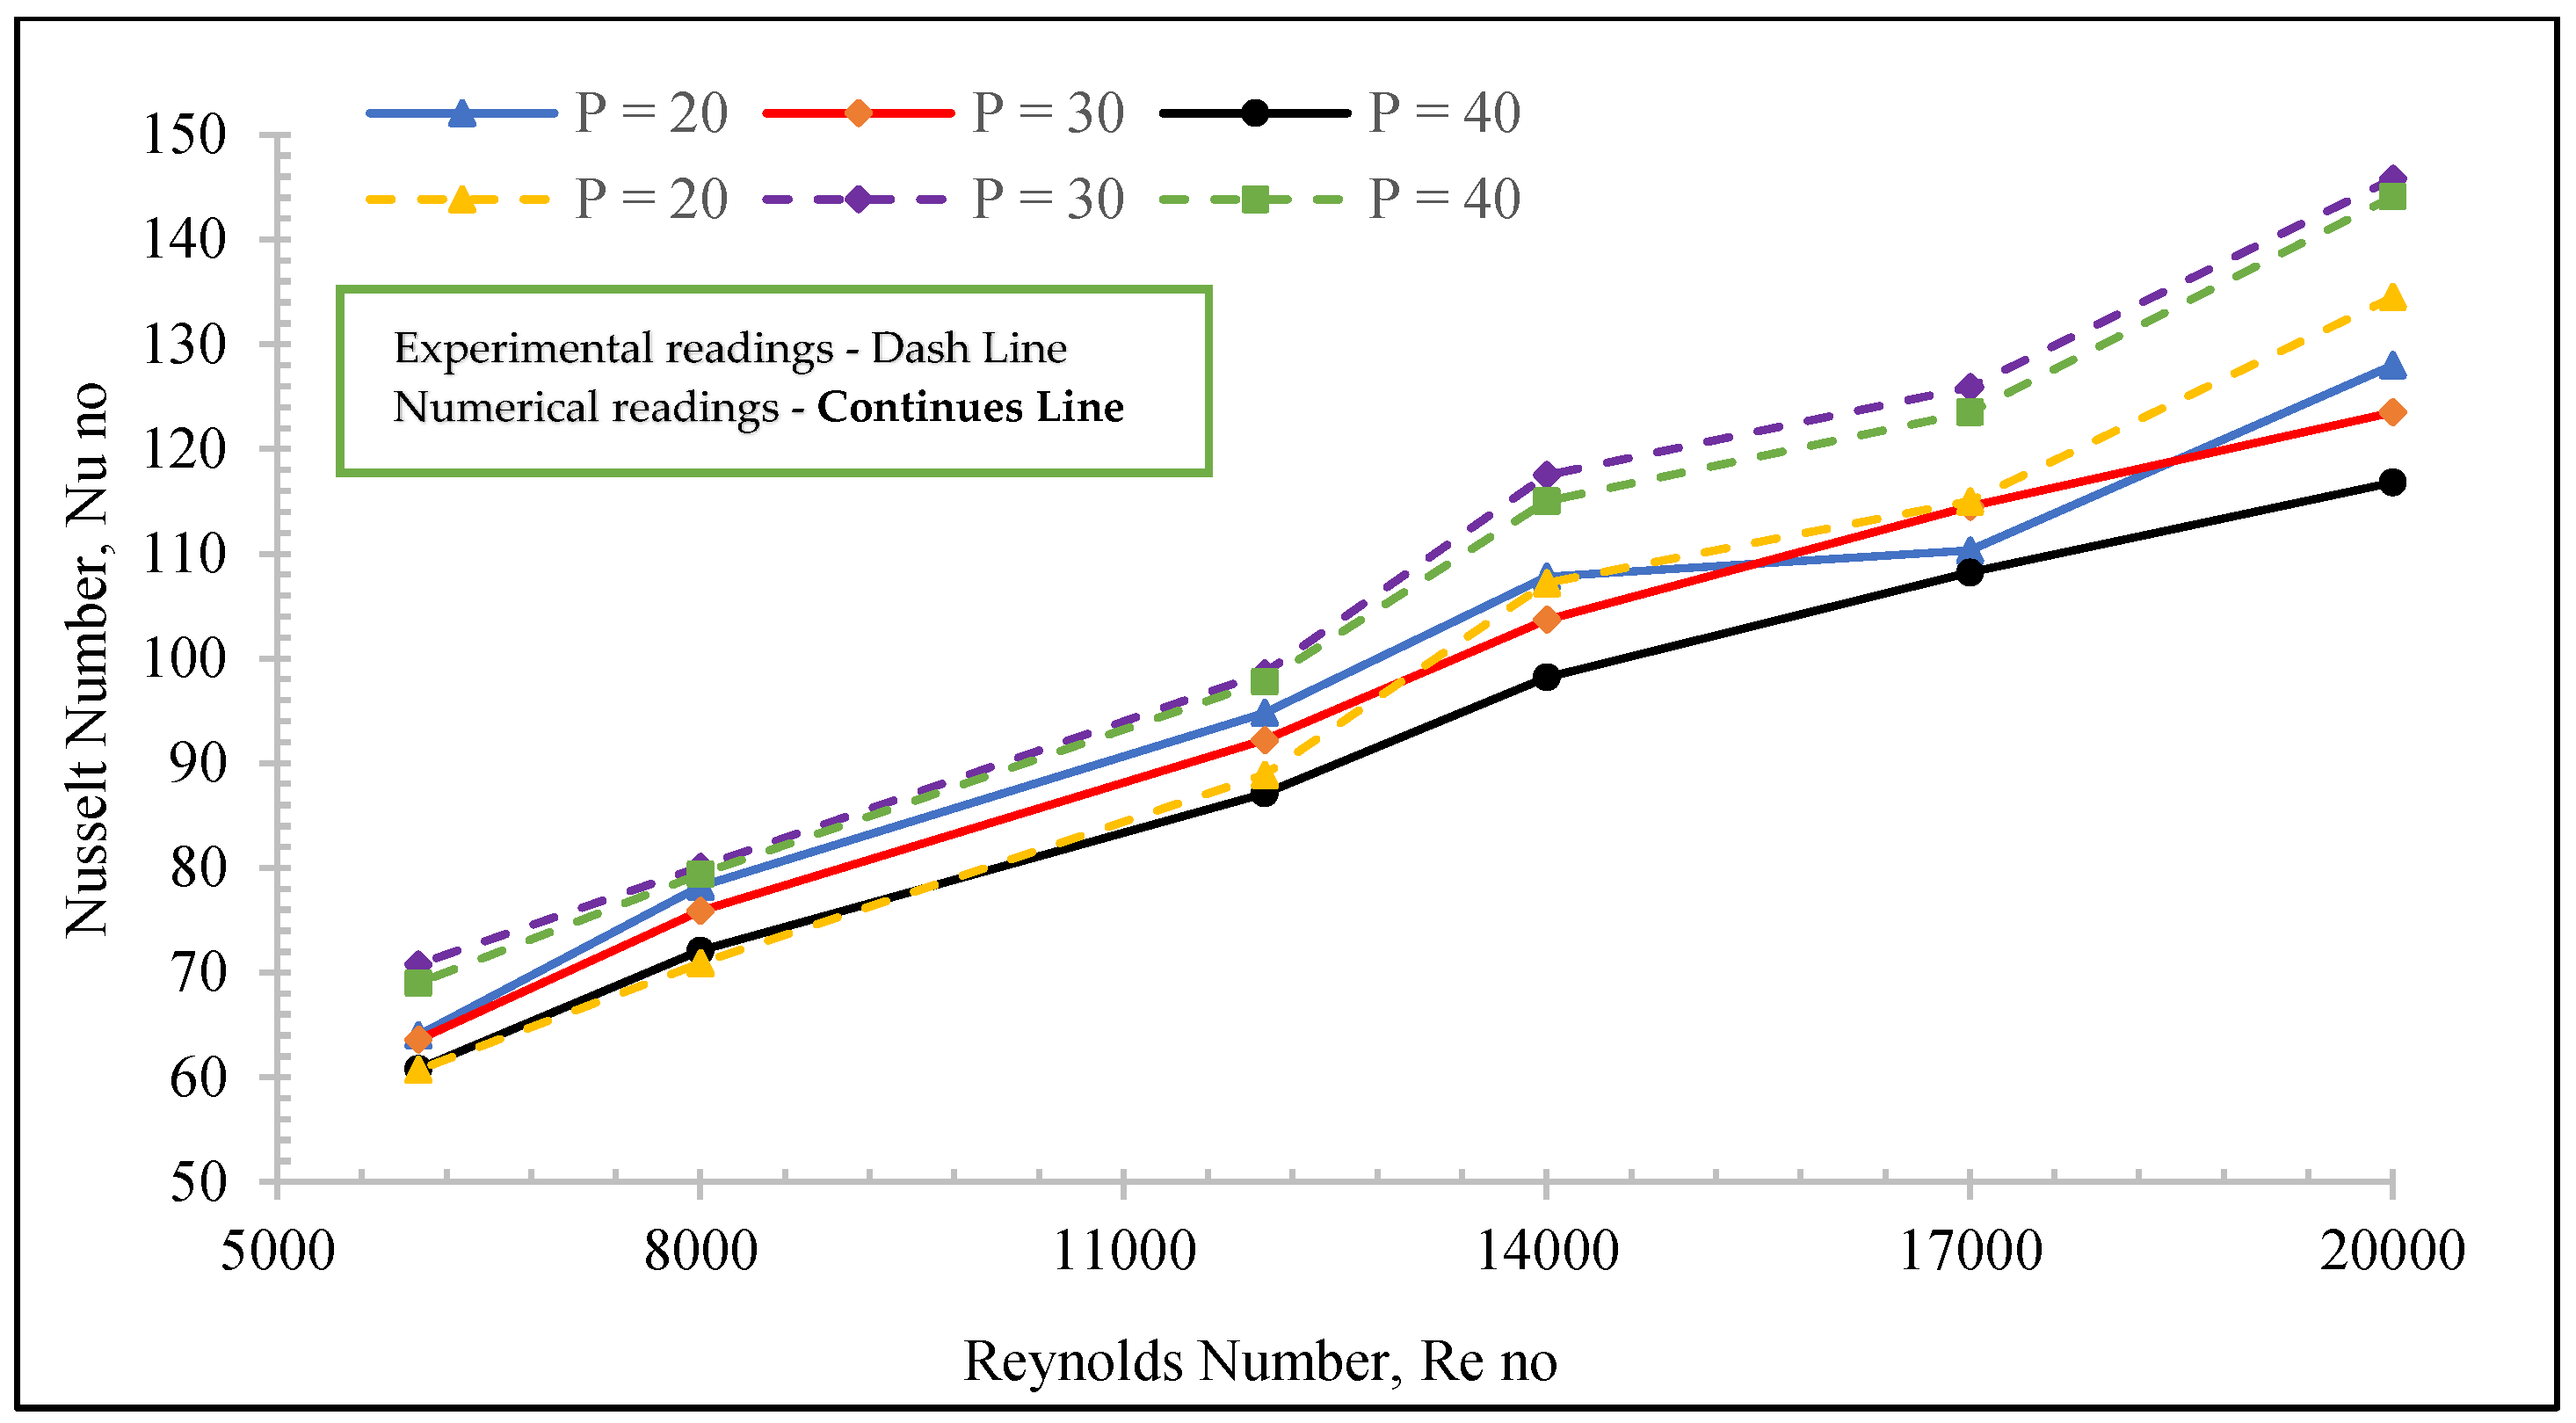
4.2.1. Nusselt Number
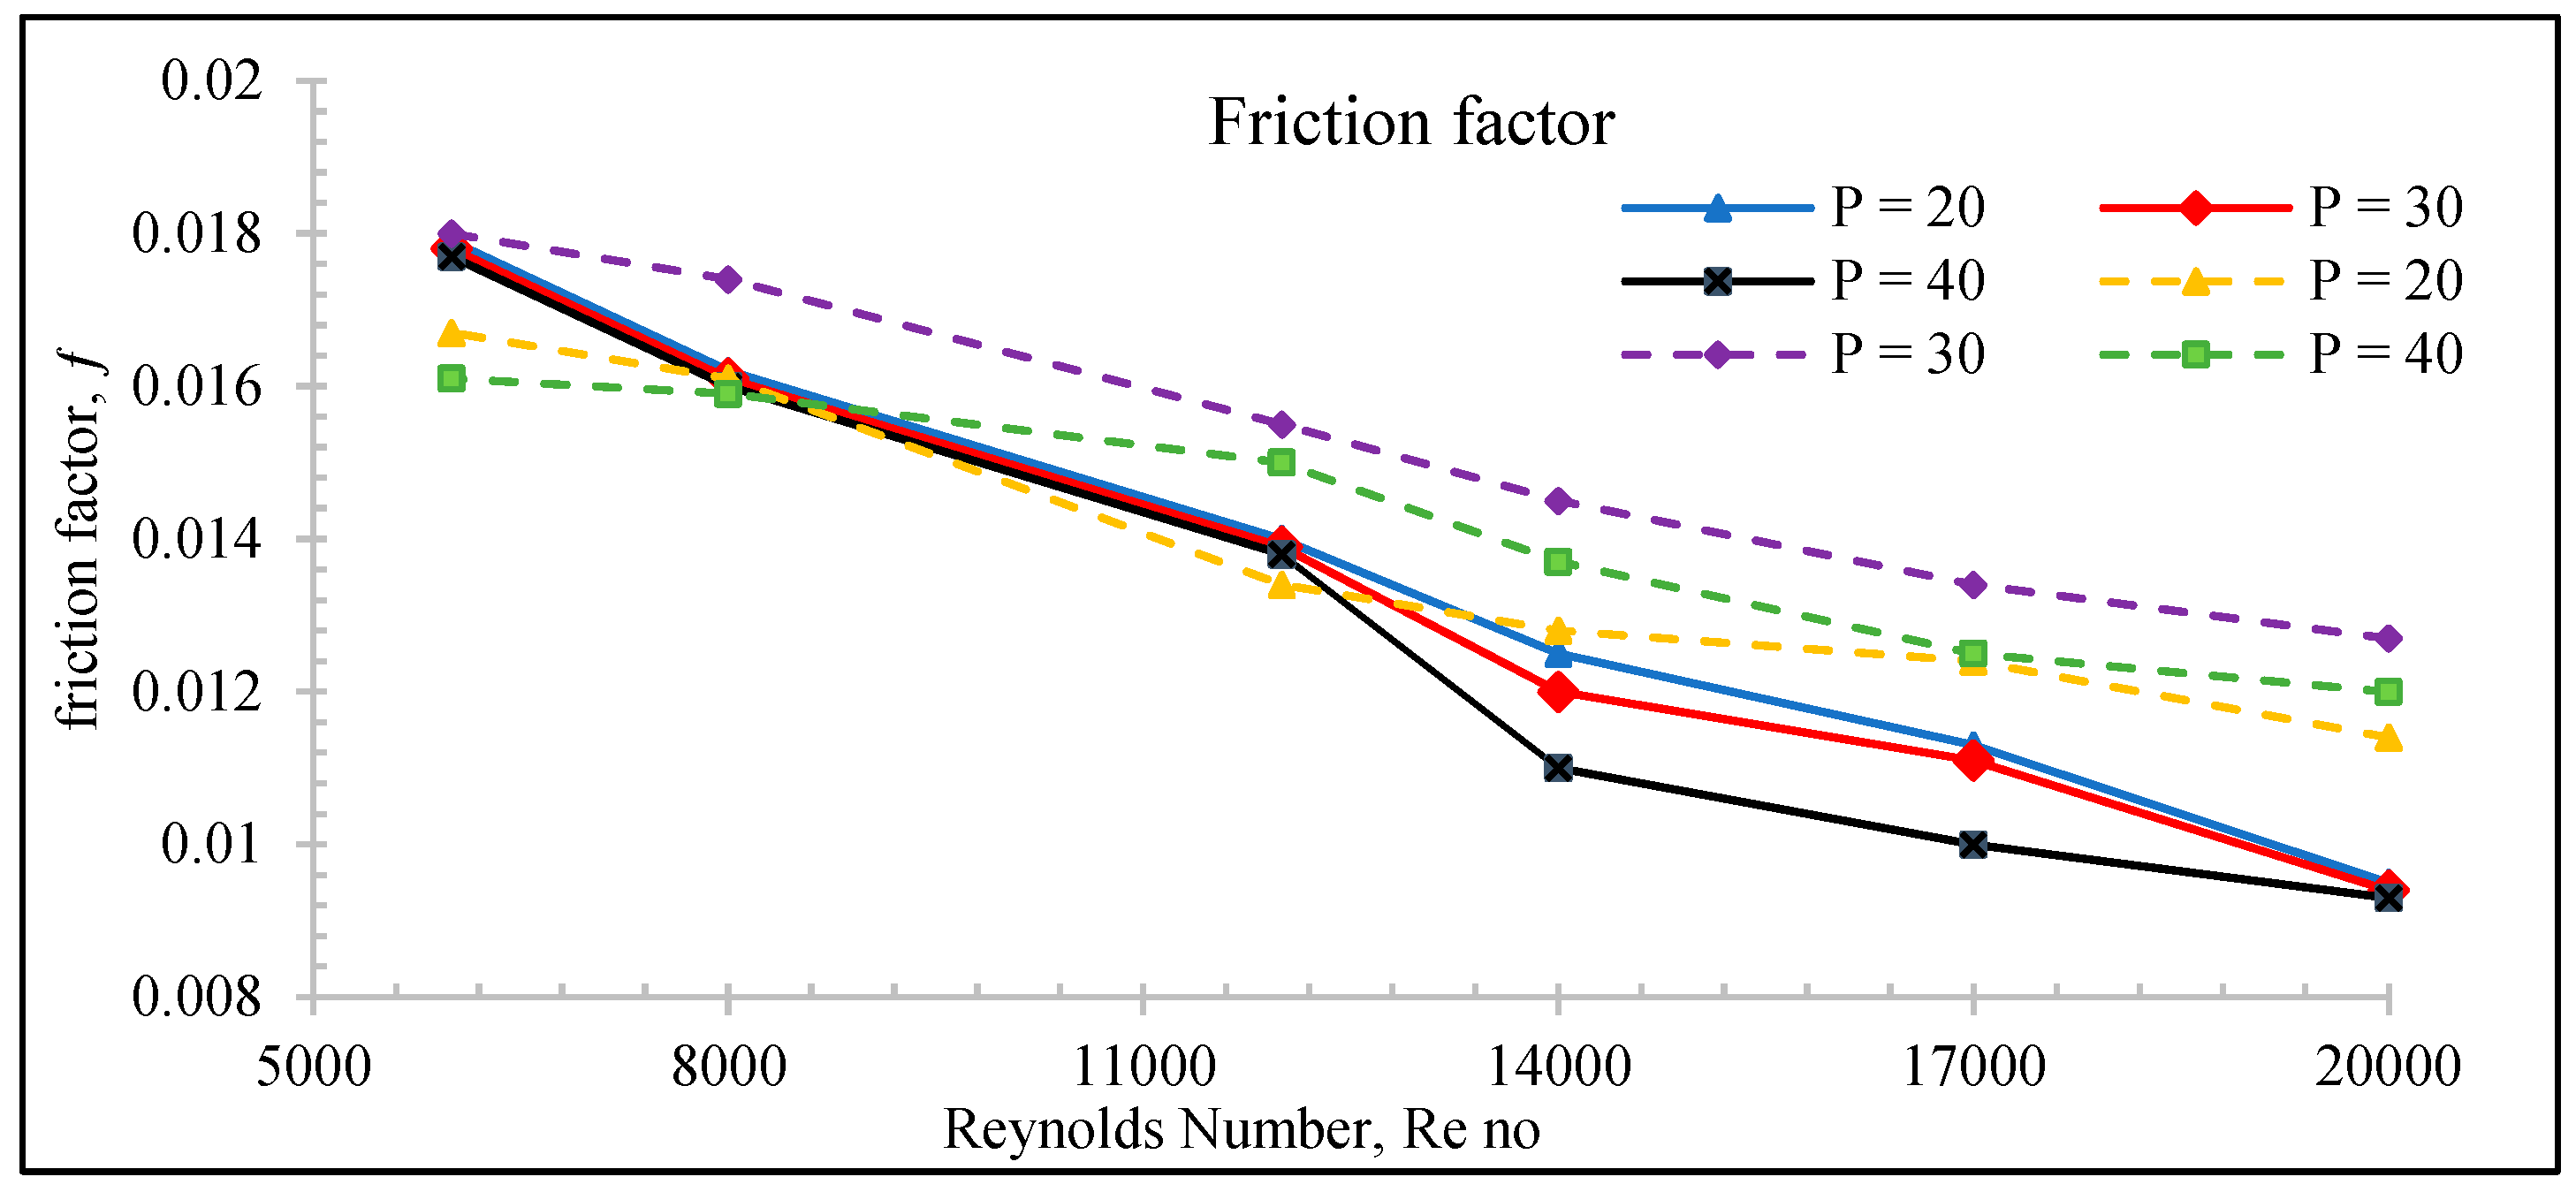
4.2.2. Friction Factor
5. Correlations Developed for Nusselt Number and Friction Factor
- Friction factor decreases with increasing Reynolds number Re.
- Friction factor increases with relative pitch distance, p/e.
6. Conclusions
- Implementing artificial roughness in the absorber plate significantly improved the Nusselt number (Nu) compared to a smooth surface, at all Reynolds numbers.
- The RNG renormalized group k-ε model predicts very close results (±3%) to the Dittus–Boelter empirical values in the numerical and experimental work.
- The polygonal-shaped rib, with p = 20 mm (numerical) and p = 30 mm (experimental), recorded the highest average Nusselt number at Reynolds number 20,000 compared with other rib shapes, indicating that it can effectively enhance heat transfer in the SAH.
- The minimum friction factor (f) of 0.01 at pitch distance of p = 20 in experimental work and 0.0093 at p = 40 mm in numerical work was attained at Reynolds number Re 20,000.
- The thermo-hydraulic performance (THP) of the proposed shapes achieved the highest values of 2.95 in the polygonal rib at p/e = 10 and Reynolds number 4000.
- An empirical correlation was developed for Nusselt number Nu and friction factor ƒ from the experimental values in (Equation (10) and (11)), which showed maximum accuracy of ±8% between experimental and calculated values.
Author Contributions
Funding
Data Availability Statement
Conflicts of Interest
Nomenclature
| A | cross-sectional area of the duct, [A = WH], m2 |
| Ac | surface area of collector plate, m2 |
| Cd | coefficient of discharge for orifice meter |
| Cp | specific heat of air at constant pressure, kJ/(kg K) |
| D h, d | equivalent diameter of the air passage, [D = 4A/[2(W + H)], m |
| I | turbulence intensity/intensity of solar radiation, W/m2 |
| e | roughness height, mm |
| e/d | relative roughness height |
| H | height of air channel, m |
| h | heat transfer coefficient, W m−2 K−1 |
| k | thermal conductivity of air, W m−1 K−1 |
| L | duct length, m |
| L1 | inlet length of duct, mm |
| L2 | test length of duct, mm |
| L3 | outlet length of duct, mm |
| m | mass flow rate of air, kg/s |
| p | roughness pitch, m |
| Dimensionless parameters | |
| f | friction factor |
| fr | friction factor for rough surface |
| fs | friction factor for a smooth surface |
| fexp | friction factor experimental |
| Nu | Nusselt number |
| Nus | Nusselt number for rough duct |
| Nur | Nusselt number for smooth duct |
| Nu exp | Nusselt number experimental |
| Pr | Prandtl number |
| P/e | relative roughness pitch |
| Re | Reynolds number |
| W/H | duct aspect ratio |
| Greek symbols | |
| µ | dynamic viscosity, Ns/m2 |
| µt | turbulent viscosity, Ns/m2 |
| ρ | density of air, kg/m3 |
| α | angle of attack, degree |
| ε | dissipation rate |
| ω | specific dissipation rate |
| δ | transition sub-layer thickness, m |
| k | turbulence kinetic energy, m |
| Γ | molecular thermal diffusivity |
| Γt | turbulent thermal diffusivity |
References
- Saha, S.K.; Islam, M.S.; Saha, S.K.; Alam, M.M. Experimental study of heat transfer and friction characteristics of rectangular duct with ribbed walls. Int. J. Heat Mass Transf. 2013, 60, 559–567. [Google Scholar]
- Kim, K.H.; Kim, K.Y.; Ha, M.Y. Heat transfer and pressure drop characteristics of a rectangular duct with perforated ribs. Int. J. Heat Mass Transf. 2014, 71, 283–291. [Google Scholar]
- Kefayati, G.R.; Safaei, M.R.; Esfahani, J.A. Numerical study on the heat transfer and pressure drop in a rectangular duct with longitudinal rib turbulators. Appl. Therm. Eng. 2018, 138, 621–632. [Google Scholar]
- Ji, H.; Luo, L.; Yan, X.; Zhang, B. Numerical investigation on heat transfer and fluid flow characteristics in rectangular ducts with twisted tape inserts. Appl. Therm. Eng. 2020, 169, 114919. [Google Scholar]
- Balakrishnan, A.R.; Khader, M.A. Numerical investigation of heat transfer augmentation in a rectangular duct using discrete multiple V-ribs. Int. J. Heat Mass Transf. 2015, 91, 421–430. [Google Scholar]
- Narayanan, R.; Bhaskaran, R. Numerical analysis of turbulent flow and heat transfer in a rectangular duct with multiple ribs of varying geometry. J. Therm. Anal. Calorim. 2019, 137, 431–446. [Google Scholar]
- Li, H.; Li, J.; Li, J.; Li, Q. Experimental study on turbulent heat transfer enhancement in a rectangular duct with staggered sawtooth ribs. Exp. Therm. Fluid Sci. 2021, 124, 111210. [Google Scholar]
- Wen, D.; He, Y.L.; Tang, G.H. Numerical investigation of heat transfer and flow characteristics in a rectangular duct with elliptical dimples. Int. J. Heat Mass Transf. 2019, 132, 9–19. [Google Scholar]
- Wang, W.; He, Y.L.; Tao, W.Q. Numerical investigation of heat transfer and fluid flow characteristics in a rectangular duct with multiple dimple-shaped ribs. Int. J. Heat Mass Transf. 2021, 181, 121458. [Google Scholar]
- Karwa, R.; Solanki, S.C.; Saini, J.S. Thermo-hydraulic performance of solar air heaters having integral chamfered rib roughness on absorber plates. Energy 2001, 26, 161–176. [Google Scholar] [CrossRef]
- Ahmed, A.E.; Ahmed, N.M.; Ahmed, M.S. Experimental and numerical investigation of heat transfer enhancement in a rectangular duct using wavy and perforated ribs. J. Therm. Anal. Calorim. 2020, 139, 465–483. [Google Scholar]
- Sahiti, N.; Cao, B.Y. Experimental and numerical investigation of heat transfer enhancement in a rectangular duct with a novel serrated twisted tape. Exp. Therm. Fluid Sci. 2017, 81, 77–89. [Google Scholar]
- Siddiqui, M.F.; Kim, M.H. Experimental and numerical investigation of flow and heat transfer in a rectangular duct with multiple V-shaped ribs. Int. J. Heat Mass Transf. 2018, 117, 689–702. [Google Scholar]
- Islam, M.S.; Alim, M.A. Numerical study on thermal-hydraulic characteristics of turbulent flow in a rectangular duct with novel converging/diverging rib arrangements. Appl. Therm. Eng. 2021, 188, 116680. [Google Scholar]
- Lee, H.J.; Kang, B.H. Heat transfer and fluid flow characteristics in a rectangular duct with multi-vortex generator. Int. J. Heat Mass Transf. 2020, 160, 120221. [Google Scholar]
- Seo, J.; Kim, Y. Experimental study of heat transfer and friction factor characteristics in a rectangular duct with novel compound turbulator. Appl. Therm. Eng. 2021, 194, 113098. [Google Scholar]
- Karthikeyan, K.; Kannan, S. Numerical study of fluid flow and heat transfer in a rectangular duct with discrete vortex generator. Appl. Therm. Eng. 2021, 187, 116438. [Google Scholar]
- Verma, S.; Prasad, B. Investigation for the optimal thermo-hydraulic performance of artificially roughened solar air heaters, Renewable. Energy 2000, 20, 19–36. [Google Scholar]
- Saini, R.P.; Saini, S.K. Development of correlations for Nusselt number and friction factor for solar air heater with roughened duct having arc-shaped wire as artificial roughness. Sol. Energy 2008, 82, 1118–1130. [Google Scholar] [CrossRef]
- Bopche, S.B.; Tandale, M.S. Experimental investigations on heat transfer and frictional characteristics of a turbulator roughened solar air heater duct. Int. Commun. Heat Mass Transf. 2009, 52, 2834–2848. [Google Scholar] [CrossRef]
- Saini, R.P.; Verma, J. Heat transfer and friction factor correlations for a duct having dimple shape artificial roughness for solar air heaters. Energy 2008, 33, 1277–1287. [Google Scholar] [CrossRef]
- Kumar, A.; Bhagoria, J.L.; Sarviya, R.M. Heat transfer and friction correlations for artificially roughened solar air heater duct with discrete W-shaped ribs. Energy Conversat. Manag. 2009, 50, 2106–2117. [Google Scholar] [CrossRef]
- Kumar, B.V.; Manikandan, G.; Kanna, P.R. Enhancement of heat transfer in SAH with polygonal and trapezoidal shape of the rib using CFD. Energy 2021, 234, 121154. [Google Scholar] [CrossRef]
- Kumar, B.V.; Manikandan, G.; Kanna, P.R. Performances of solar air heater using polygonal and trapezoidal rib absorber plate for augmentation of heat transfer. Tierärztliche Prax. 2020, 40, 888–903. [Google Scholar]
- Varun Kumar, B.; Manikandan, G.; Kanna, P.R.; Taler, D.; Taler, J.; Nowak-Ocłoń, M.; Mzyk, K.; Toh, H.T. A Performance Evaluation of a Solar Air Heater Using Different Shaped Ribs Mounted on the Absorber Plate—A Review. Energies 2018, 11, 3104. [Google Scholar] [CrossRef]
- ASHRAE Standard 93; Method of Testing to Determine the Thermal Performance of Solar Collectors. 30329. American Society of Heating, Refrigeration and Air Conditioning Engineers: Atlanta, GA, USA, 2003.
- Holman, J.P. Experimental Methods for Engineers; Tata McGraw-Hill Publishing Company Limited: New Delhi, India, 2007. [Google Scholar]
- Joint Committee for Guides in Metrology. JCGM 100: Evaluation of Measurement Data—Guide to the Expression of Uncertainty in Measurement; JCGM. 2008. (Also Known as GUM). Available online: https://www.bipm.org/documents/20126/2071204/JCGM_100_2008_E.pdf/cb0ef43f-baa5-11cf-3f85-4dcd86f77bd6 (accessed on 26 May 2023).
- Kline, S.J.; McClintock, F.A. Policy on reporting uncertainties in experimental measurements and results. ASME J. Heat Transf. 2000, 122, 411–413. [Google Scholar]
- Duffie, J.A.; Beckman, W.A. Solar Engineering of Thermal Processes; Wiley: New York, NY, USA, 1980. [Google Scholar]
- McAdams, W.H. Heat Transmission; McGraw-Hil: New York, NY, USA, 1942. [Google Scholar]
- Webb, R.L.; Eckert, E.R.G. Application of rough surface to heat exchanger design. Int. J. Heat Mass Transf. 1972, 15, 1647–1658. [Google Scholar] [CrossRef]
- Taler, D.; Taler, J. Simple heat transfer correlations for turbulent tube flow. E3S Web Conf. 2017, 13, 02008. [Google Scholar] [CrossRef]


| S. No | Parameter | Attained Values in SAH | Uncertainties | Relative Error (%) |
|---|---|---|---|---|
| 1 | Temperature differences (°C) | 16 | ±0.17 | 0.67 |
| 2 | Heat flux (W/m2) | 1000 | ±7 | 0.71 |
| 3 | Thermal efficiency (%) | 77.9 | ±0.02 | 0.027 |
| 4 | Connective heat transfer (W/m2 °C) | 47.9 | ±0.71 | 1.71 |
| 5 | Useful heat gained by SAH (W) | 872.8 | ±8.1 | 1.57 |
| S. No | Property | Air | Aluminum |
|---|---|---|---|
| 1 | Density, ρ (kg m−3) | 1.117 | 2719 |
| 2 | Specific heat, Cp (J kg−1 K−1) | 1007 | 871 |
| 3 | Thermal conductivity k (W m−1 K−1) | 0.0262 | 202.4 |
| 4 | Viscosity µ (N m−2) | 1.857 × 10⁻⁵ | - |
| 5 | Prandl number, Pr. | 0.71 | - |
| S. No | Re No | Smooth | Polygonal p/e = 6.7 | Polygonal p/e = 10 | Polygonal p/e = 13.4 | Trapezoidal p/e = 6.7 | Trapezoidal p/e = 10 | Trapezoidal p/e = 13.4 |
|---|---|---|---|---|---|---|---|---|
| 1 | 2000 | 10.1 | 16.1 | 20.5 | 19.2 | 15.2 | 18.5 | 17.9 |
| 2 | 4000 | 14.2 | 38.4 | 48.2 | 46 | 36.7 | 47.5 | 45.9 |
| 3 | 6000 | 23.2 | 60.7 | 70.8 | 69 | 57.6 | 68.1 | 67 |
| 4 | 8000 | 26.5 | 70.9 | 80.1 | 79.4 | 67.1 | 77.6 | 75.7 |
| 5 | 10,000 | 32.2 | 76.9 | 86.4 | 85 | 70.8 | 81.6 | 80.2 |
| 6 | 12,000 | 39.1 | 88.9 | 98.6 | 97.8 | 85.5 | 95.7 | 94.2 |
| 7 | 14,000 | 44.5 | 107.2 | 117.5 | 115 | 103.2 | 113.9 | 112.5 |
| 8 | 17,000 | 52.7 | 115.0 | 125.9 | 123.5 | 109.7 | 120.1 | 119 |
| 9 | 20,000 | 59.1 | 134.5 | 145.8 | 144.1 | 124.1 | 139.9 | 137 |
| S. No | Re No | Smooth | Polygonal p/e = 6.7 | Polygonal p/e = 10 | Polygonal p/e = 13.4 | Trapezoidal p/e = 6.7 | Trapezoidal p/e = 10 | Trapezoidal p/e = 13.4 |
|---|---|---|---|---|---|---|---|---|
| 1 | 2000 | 0.0161 | 0.018 | 0.021 | 0.02 | 0.0174 | 0.02 | 0.019 |
| 2 | 4000 | 0.0124 | 0.0171 | 0.019 | 0.018 | 0.0167 | 0.0185 | 0.0179 |
| 3 | 6000 | 0.0103 | 0.0167 | 0.018 | 0.0175 | 0.0161 | 0.0171 | 0.0165 |
| 4 | 8000 | 0.0096 | 0.0161 | 0.0174 | 0.0169 | 0.0153 | 0.0163 | 0.0157 |
| 5 | 10,000 | 0.00901 | 0.0145 | 0.0165 | 0.0159 | 0.0141 | 0.0155 | 0.015 |
| 6 | 12,000 | 0.0087 | 0.0134 | 0.0155 | 0.015 | 0.0129 | 0.0141 | 0.0135 |
| 7 | 14,000 | 0.00841 | 0.0128 | 0.0145 | 0.0137 | 0.0122 | 0.0134 | 0.013 |
| 8 | 17,000 | 0.0079 | 0.0124 | 0.0134 | 0.0125 | 0.0119 | 0.0125 | 0.0115 |
| 9 | 20,000 | 0.0071 | 0.0114 | 0.0127 | 0.012 | 0.011 | 0.0115 | 0.01 |
| S. No | Shape | p/e | 2000 | 4000 | 6000 | 8000 | 10,000 | 12,000 | 14,000 | 17,000 | 20,000 |
|---|---|---|---|---|---|---|---|---|---|---|---|
| 1 | Polygonal | 6.7 | 1.54 | 2.43 | 2.23 | 2.26 | 2.04 | 1.97 | 2.10 | 1.88 | 1.95 |
| 2 | 10 | 1.86 | 2.95 | 2.54 | 2.48 | 2.20 | 2.08 | 2.21 | 2.01 | 2.04 | |
| 3 | 13.4 | 1.77 | 2.86 | 2.50 | 2.49 | 2.19 | 2.09 | 2.20 | 2.01 | 2.05 | |
| 4 | Trapezoidal | 6.7 | 1.47 | 2.34 | 2.14 | 2.17 | 1.90 | 1.92 | 2.05 | 1.82 | 1.82 |
| 5 | 10 | 1.71 | 2.93 | 2.48 | 2.46 | 2.12 | 2.09 | 2.19 | 1.96 | 2.02 | |
| 6 | 13.4 | 1.68 | 2.86 | 2.47 | 2.43 | 2.11 | 2.08 | 2.19 | 1.99 | 2.07 |
| S. No | Re | Numerical | Experimental | ||||
|---|---|---|---|---|---|---|---|
| p = 20 | p = 30 | p = 40 | p = 20 | p = 30 | p = 40 | ||
| 1 | 20,000 | 128 | 123.5 | 116.8 | 134.5 | 145.8 | 144.1 |
| 2 | 17,000 | 110.3 | 114.5 | 108.2 | 115 | 125.9 | 123.5 |
| 3 | 14,000 | 107.8 | 103.7 | 98.2 | 107.2 | 117.5 | 115 |
| 4 | 12,000 | 94.8 | 92.2 | 87.1 | 88.9 | 98.6 | 97.8 |
| 5 | 8000 | 78.23 | 75.9 | 72.1 | 70.9 | 80.1 | 79.4 |
| 6 | 6000 | 64.01 | 63.6 | 60.8 | 60.7 | 70.8 | 69 |
| S. No | Re | Numerical | Experimental | ||||
|---|---|---|---|---|---|---|---|
| p = 20 | p = 30 | p = 40 | p = 20 | p = 30 | p = 40 | ||
| 1 | 20,000 | 0.0095 | 0.0094 | 0.0093 | 0.0114 | 0.0127 | 0.012 |
| 2 | 17,000 | 0.0113 | 0.0111 | 0.01 | 0.0124 | 0.0134 | 0.0125 |
| 3 | 14,000 | 0.0125 | 0.012 | 0.011 | 0.0128 | 0.0145 | 0.0137 |
| 4 | 12,000 | 0.014 | 0.0139 | 0.0138 | 0.0134 | 0.0155 | 0.015 |
| 5 | 8000 | 0.0162 | 0.0161 | 0.016 | 0.0161 | 0.0174 | 0.0159 |
| 6 | 6000 | 0.0179 | 0.0178 | 0.0177 | 0.0167 | 0.018 | 0.0161 |
Disclaimer/Publisher’s Note: The statements, opinions and data contained in all publications are solely those of the individual author(s) and contributor(s) and not of MDPI and/or the editor(s). MDPI and/or the editor(s) disclaim responsibility for any injury to people or property resulting from any ideas, methods, instructions or products referred to in the content. |
© 2023 by the authors. Licensee MDPI, Basel, Switzerland. This article is an open access article distributed under the terms and conditions of the Creative Commons Attribution (CC BY) license (https://creativecommons.org/licenses/by/4.0/).
Share and Cite
Kumar, B.V.; Kanna, P.R.; Manikandan, G.; Taler, D.; Taler, J.; Sobota, T.; Nowak-Ocłoń, M. Investigation of Thermo-Hydraulic Performances of Artificial Ribs Mounted in a Rectangular Duct. Energies 2023, 16, 4404. https://doi.org/10.3390/en16114404
Kumar BV, Kanna PR, Manikandan G, Taler D, Taler J, Sobota T, Nowak-Ocłoń M. Investigation of Thermo-Hydraulic Performances of Artificial Ribs Mounted in a Rectangular Duct. Energies. 2023; 16(11):4404. https://doi.org/10.3390/en16114404
Chicago/Turabian StyleKumar, B. Varun, P. Rajesh Kanna, G. Manikandan, Dawid Taler, Jan Taler, Tomasz Sobota, and Marzena Nowak-Ocłoń. 2023. "Investigation of Thermo-Hydraulic Performances of Artificial Ribs Mounted in a Rectangular Duct" Energies 16, no. 11: 4404. https://doi.org/10.3390/en16114404