
Design of IOT-Based Framework for Evaluation of Energy Efficiency in Power Transformers

Department of Electric Power Systems, Kaunas University of Technology, Studentu Str. 48, LT-51367 Kaunas, Lithuania
*
Author to whom correspondence should be addressed.
Energies 2023, 16(11), 4358; https://doi.org/10.3390/en16114358
Submission received: 12 April 2023
/
Revised: 21 May 2023
/
Accepted: 25 May 2023
/
Published: 26 May 2023
(This article belongs to the Topic Energy Saving and Energy Efficiency Technologies)
Abstract
:Two prototypes with energy efficiency calculations have been developed to enable real-time efficiency assessment and data collection. The results of the experiment demonstrate that the use of microprocessor technology and the Internet of Things can significantly improve the efficiency and accuracy of energy audits in power transformers. The prototypes developed in this study provide real-time efficiency assessment and data collection, enabling more effective energy management and cost savings for industrial users. During the experiment, it was found that resonance can cause the same losses as a poor power factor of the system, highlighting the importance of addressing energy quality issues in addition to energy efficiency. These findings have important implications for energy efficiency policies and practices in the context of climate change mitigation and rising energy prices.
1. Introduction
Europe is currently setting ambitious targets for reducing CO2 emissions in the world so that global average temperatures do not rise by more than 2 degrees by the end of the 21st century [1]. After achieving this goal, Lithuania plans to be able to limit the temperature increase to 4 degrees in summer and 2.5 degrees in winter, and 30% more rainfall should occur in winter compared with today, when summers will become slightly drier [2]. Increasing energy efficiency is one way to reduce CO2 emissions [3]. As a result of improving energy efficiency, less energy is required to perform the same amount of work, which can reduce overall energy consumption and, consequently, reduce the emissions of greenhouse gases such as CO2 [4]. This is because a significant portion of the energy used in various applications comes from burning fossil fuels, which releases CO2 and other pollutants into the atmosphere. Energy efficiency is usually measured in terms of primary and final energy intensity, which refers to the amount of energy consumed to produce a particular amount of goods and services in a country (the ratio of the energy consumption of a country’s economy to the Gross Domestic Product (GDP)). It is, therefore, important to provide energy efficiency solutions in industry and to exploit the potential for energy savings to reduce energy losses and costs [5]. The goal of increasing energy efficiency is to provide the same number of services with less energy consumption. In the industrial sector in Lithuania, energy consumption in terms of product cost remains 20% higher than the EU average, so more efficient and modern technologies and energy management measures are needed to reduce energy costs and increase the competitiveness of businesses [6]. The problem is also exacerbated by rising energy prices. The price of electricity rose 6.8 times comparing average prices of 2020 and 2022 [7]. For companies that use electricity intensively, the rise in electricity prices has made it even more difficult to be competitive in the market [8]. Energy management is an effective organizational, technical, and developmental action to minimize energy costs in a cost-effective manner. Energy management pays structural attention to energy use to continuously reduce energy consumption and create improvements, as depicted in the running circle of the Deming cycle [9]. The Deming cycle shown in Figure 1 works according to the Plan–Do–Study–Act method and can be used as a plan to increase energy efficiency because this is not a one-time task [10]; rather it is needed to continuously control regular improvements.
An essential step in improving energy efficiency is to carry out an energy audit [11]. An energy audit is a procedure that helps to analyze the energy use of a company/building. Energy audits can assess energy efficiency, identify energy-saving opportunities, and draw up an implementation plan for energy-saving projects [12]. The processing time can be reduced by using the Internet of Things (IoT) to collect data on the energy consumption of each electrical appliance and to store the data in an electronic energy audit information system to analyze the energy consumption of the facility [13]. Monitoring and recording real-time energy consumption data can help find significant energy losses in a plant and implement a variety of energy-saving strategies. According to an article published in 2020 [14], there is a potential to increase energy efficiency by 8%. However, there is a lack of trained staff in industrial companies to carry out energy audits, efficiency/optimization, and overall energy management in production [15]. Furthermore, with a large enterprise’s infrastructure, the amount of data received is huge, which takes a significant amount of time to analyze and see the potential for savings. Various data collection systems are available for energy audits, but adequate data analysis systems are lacking [16]. The most accurate estimate would be to measure the efficiency of the device by measuring its input power and output power, but this is expensive, and the case of power transformers is complicated because of high or medium voltage. The equipment becomes more expensive, and for short-term measurements it is not possible to install them without switching off the power transformer. Therefore, it is more cost effective to analyze performance based on low-voltage side measurements. The great potential of modern microprocessor technology allows it to be used for automatic energy efficiency determination [16]. As energy savings and consumption reduction improve, an accurate model for calculating additional losses due to efficiency-reducing factors, such as power quality, incorrect modes, etc., has great practical importance [17]. Such a methodology is important not only for the derating of power transformers [18] but also for the payback of harmonic reduction devices [19]. Based on the available literature, the commonly adopted approach involves solely considering the preconfigured input data when computing the losses incurred by the transformer [20,21,22]. This is favorable for design, but is not accurate because the transformers operate in different modes, and the spectrum of their voltage and current harmonics may change [23]. In articles [24,25], authentic data from utility meters were utilized for calculations of the losses. However, it should be noted that utility meters do not measure the distortion levels, and the data are subjected to hourly averaging. This approach is inadequate for accurately assessing efficiency. The reason behind this insufficiency lies in the power electronic [26] and renewable energy systems’ [27] escalating presence, which contributes to heightened harmonic levels and has a significant impact on the efficiency of transformers and electrical motors [28]. Additionally, average hourly values are not acceptable because the transformer losses are not linear [29]. In article [30], simulations were performed with the measured 24 h data, but usage of this scenario in industrial cases is unlikely due to the complexity and usage of simulation software. The current methods for energy efficiency evaluation are static and offline, causing a delay in the evaluation process [31]. To address this issue, there is a need for dynamic and real-time evaluation methods. For this reason, it was decided to create a prototype that can calculate efficiency in real time and already processed data can be sent to energy management systems for analysis. Because the levels of harmonics are changing rapidly, the monitoring of efficiency must be long term, at least on a yearly basis, to see the effect of seasons, and data must be achieved in real time to take actions and to see the effect. [32] highlights the importance of making energy quality impact calculations using an easy-to-understand visualization.
2. Energy-Saving Opportunities
The focus on energy efficiency in this section is on power transformers and electrical motors. Transformers are electrical devices that work constantly; for this reason any deviation from their highest efficiency results in relatively high energy losses compared to other devices [33]. According to article [34], electric motors account for 70% of total industrial energy consumption. Therefore, even the smallest efficiency improvements in this category can achieve significant reductions in energy usage.
2.1. Efficiency Class
Transformer power losses consist of variable (load) losses and idle losses. The magnitude of the variable loss depends on the transformer load, and the amount of losses depends on the efficiency class, and according to article [35], it can save up to 1% of all generated electricity. High-performance motors can achieve operating efficiency by up to 10% when compared to regular motors, depending on the nominal power [36]. Motors that have been rewound, on the other hand, show a 3–4% drop in efficiency [37] when compared to the original motor. Knowing that energy costs more than 60–100 times [36] a motor’s life cycle cost, investing in a more expensive but more efficient motor can quickly be very lucrative.
2.2. Oversizing
The total idle losses of 110 kV and 35 kV transformers are around 69 GWh per year and account for about 0.6 percentage points of electricity losses in the distribution network per year in Lithuania [38]. It is worth mentioning that 70% of transformers are working underloaded [38]. In the past, designers tended to install overpowered motors to ensure an adequate safety margin and eliminate the risk of failure, even in conditions that were not likely to occur [39]. Studies show that at least a third of engines are oversized and operate at less than 50% load [39]. Article [40] states that one of the biggest problems with the energy efficiency of motors is when directly connected motors do not run at nominal loads. The efficiency of motors is often increased using variable frequency drives (VFDs), but VFDs are nonlinear loads based on power electronics, which harms energy quality.
2.3. Power Factor
Reactive power, is a quantity that describes the load on an electrical installation due to the oscillations of the energy of an electromagnetic field in an alternating current circuit. Angle φ is the angle between voltage and current, also called the displacement factor, so it is only affected by the reactive component. The effect of poor displacement power factor on energy efficiency is increased current. As an example, reducing the cable current by more than 10% will reduce the loss by almost 20% [41]. Reducing the current will reduce the voltage drop at the end of the line, thus improving the efficiency of the equipment at the end of the line. The poor power factor has a similar effect on the power transformer as on the cable. Increased currents also increase the copper loss of the power transformer, reducing its ability to transmit active power, and this adds an additional voltage drop.
In case an induction motor is supplied with 10 percent less voltage than rated, it will experience problems as reported in [42]:
- 19% torque loss;
- 23% increased slip;
- 0.2–1% reduced speed;
- 5–10% increased current at full load;
- 10–15% increase in temperature;
- 1–3% loss of efficiency at full load.
2.4. Power Quality
The growth of renewable energy sources and power electronics in use affects the quality of electricity. The most significant negative consequences of the deterioration of electricity quality are increased energy losses, reduction in the service life of electrical insulation, and malfunctions of relay protection and automation [43]. The total distortion of harmonics is the ratio between the fundamental harmonic and the higher-order harmonics. The total harmonic distortion is calculated according to Equation (1).
where THDI is the total current harmonic distortion in percent, I1 is the current of fundamental harmonic in A, and Ix is the current in higher harmonics of order x.
The distortion power factor (D) is relative to total harmonic distortion. The distortion power factor is calculated according to Equation (2).
According to [19], when D = 0.7, the RMS current increases by 40% compared to D = 1 to transmit the same active power. This causes more transmission losses as well as higher voltage drops. Nonlinear loads in the network generate nonsinusoidal currents [44]. Even if the consumer uses only linear loads, the current harmonics in the resonance conditions can flow through power transformer from other users [45], thus causing increased energy loss in the transformer. Both distribution system operators and end users should be concerned about the quality of electric power [46]. Most power transformers are designed to supply power to linear loads, so they cannot operate at their rated load with significant distortion. The electrical loss in the power transformer increases due to the increased current. The current increase is calculated according to Equation (3).
where Ip.u. is the current, in p.u., hmax is the highest order harmonic, h is harmonic order, Ih is the RMS value of h-order current harmonic, and Ih,p.u. is the current of h harmonic, in p.u.
The direct connection motor is also affected by the quality of the network [47]; the motor efficiency factor decreases if the motor is supplied with an incorrect voltage level or if there is voltage asymmetry or distortion [48]. In a concrete article [49], it is observed that losses due to voltage imbalance and harmonic distortions are higher in motors of a higher efficiency class.
According to [50], with a 10% harmonic distortion of a fifth-order harmonic, a power transformer can increase the loss by 10% compared to the absence of current harmonics. The IEEE [51] has proposed a recommended practice for estimating the loss of oil-filled transformers due to current harmonics. In the example given in the methodology, the harmonic currents had the highest relative effect on the eddy currents and increased them more than seven times.
3. Real-Time Loss Accounting Algorithm Methodology
In Lithuania, the average age of distribution power transformers is 29 years. For this reason, usually, it is hard to obtain information about factory test values. The main reachable information is listed on the power transformer nameplate, which usually includes:
- Rated power (SN);
- Rated voltage of primary winding (U1N);
- Rated voltage of secondary winding (U2N);
- Idle losses (P0);
- Load losses (PLL).
Rated values of power transformers are needed for further calculations.
To develop a real-time algorithm for evaluating power transformer efficiency, it becomes imperative to possess knowledge of the fundamental parameters specified in the manufacturer’s passport for the power transformer. In industrial companies, due to the old age of power transformers and changes in personnel, it is hardly achievable to find the factory test reports and passports of the power transformer. For this reason, the first step must be achieved to calculate nominal power transformer values. Rated calculations differ due to the type of power transformer connection. Table 1 presents an example of a Y/Y-n connection group of a power transformer.
Equivalent short-circuit parameters are calculated according to the equations listed in Table 2.
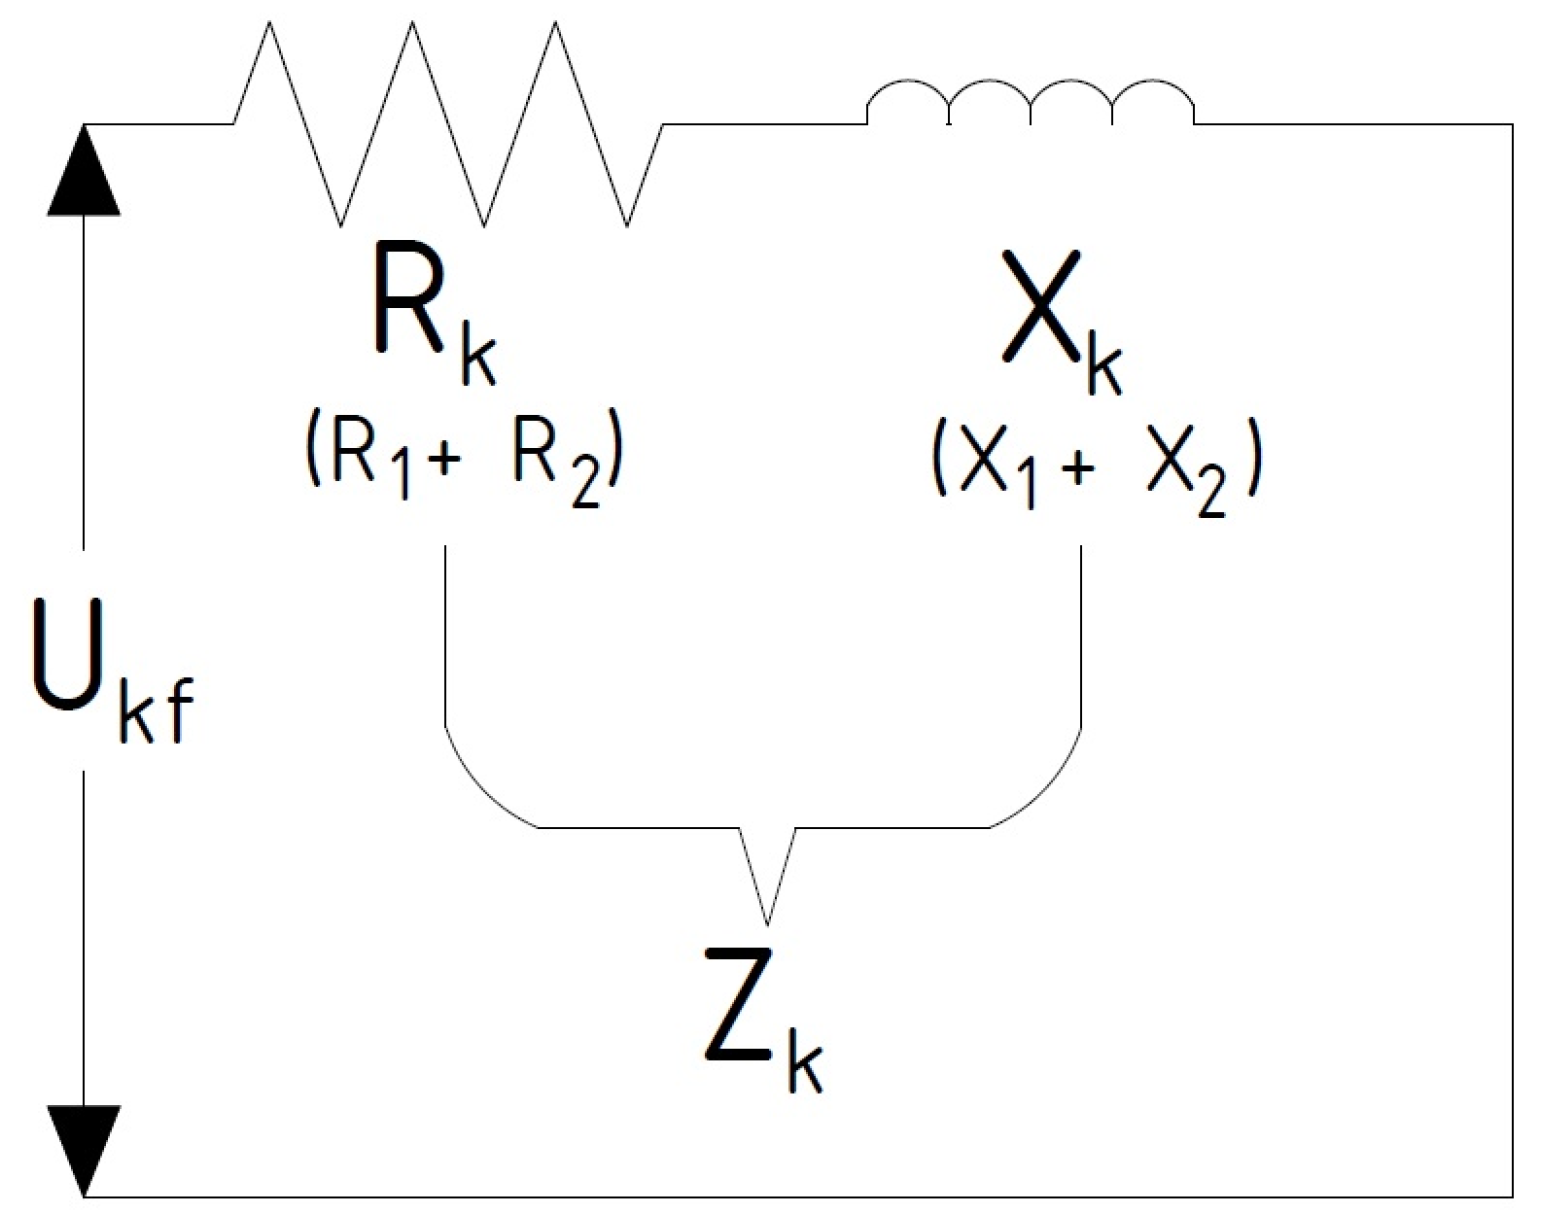
An equivalent short-circuit scheme of the power transformer is created and displayed in Figure 2.
After the resistances of the elements of the equivalent circuit are calculated, it is possible to calculate the resistance of each winding according to the equations listed in Table 3.
Transformer losses are divided into two types [53]:
- Idle loss (P0);
- Load loss (PLL).
Load losses are divided into two parts:
- Copper loss (PI2R);
- Stray Loss (PTSL).
Stray losses include:
- Eddy current losses (PEC);
- Other Stray losses (POSL).
Summarizing the transformer losses can be described by Equation (4):
Copper losses are calculated according to Equation (5):
where K is the constant coefficient (for a single-phase transformer, K equals 1; for a three-phase transformer, K equals 1.5) [54].
The nominal total Stray loss PTSL-N is calculated according to Equation (6):
The nominal losses of the eddy currents PEC-N are calculated according to Equation (7) [53]:
Table 4 contains data from standard [51] about the ratio of the total Stray loss distribution and the values of PEC-LV and PEC-HV in oil-filled transformers.
Other stray losses rated are calculated according to Equation (8):
The eddy loss factor FHL-STR is calculated according to Equation (9) [51]:
where FHL is the eddy currents loss factor, h is harmonic sequence, hmax is the highest order harmonic, Ih is the RMS value of h-sequence harmonic current, and I1 is the RMS value of the first harmonic current.
Other stray losses are FHL-STR calculated according to Equation (10) [51]:
where FHL-STR is the coefficient of other stray losses and h is the harmonic sequence.
The total current increase in system units is calculated according to Equation (11):
where is the current, in p.u., and is the current of h harmonic, in p.u.
Transformer losses after estimating the effect of harmonics and transformer load are calculated according to Equation (12) [52]:
where is the loading of the transformer, in kVA.
4. Testing of the Developed Algorithm and Prototype
The programmable logic controller (PLC) TM251MESE from Schneider Electric was used to test the prototype. The reason PLC was used in this experiment is flexibility on industrial protocols, easy access to the variables during the experiment, and in case of mistakes in code, the possibility to change it online. This model was used because it could obtain data by using the two most-used industrial protocols, Modbus RTU and Modbus TCP/IP.
Two different subnets were available. The first subnet was used to connect devices through Modbus TCP/IP, and the controller acted as a client in that subnet. The second subnet was used to enable data storage and presentation in Supervisory control and data acquisition (SCADA) or energy management (EMS) systems, and the PLC worked as a server in that subnet.
The transformer data were entered before the test. When the test started, the code implemented in PLC worked in the following cycle:
- PLC started to read measurements from the power analyzer.
- According to Equation (9), the eddy current loss factor is calculated.
- According to Equation (10), the other stray loss factor is calculated.
- Power losses are calculated according to Equation (12).
- The summation of calculated power loss and the measurement of load.
- Result of summation and measured power of medium voltage values with a timestamp are sent to the database.
The algorithm’s block diagram can be found in Figure 3.
An analyzer installed on the 10 kV side compared the calculated data and actual measures. Measurements were accumulated at a sampling frequency of 1 s.
A TM-1000/10 (Y/Y-n) power transformer manufactured in 1987 was used during the test. The test was performed in a real industrial environment; consequently, there was no possibility of changing the loading of a power transformer. The only factor that was allowed to change was the reactive power.
Transformer data from the label are listed in Table 5.
In low voltage distribution, the switchboard fixed power factor correction unit (FPFCU) was installed. The nominal reactive power of FPFCU was 80 kVAr, and during measurements, it was obtained that the real power was around 60 kVAr. It was not possible to control the FPFCU externally; for this reason, it was switched off manually, and the exact time of disconnection was obtained from the graph of measurements. The experiment was performed in two modes:
- FPFCU is ON;
- FPFCU is OFF.
To determine the accuracy of the measurement, indirect loss measurement was used. The equation is defined in Equation (13).
where Ploss is losses of the power transformer, Pin is input power from the medium voltage side, and Pout is output power from the low voltage side.
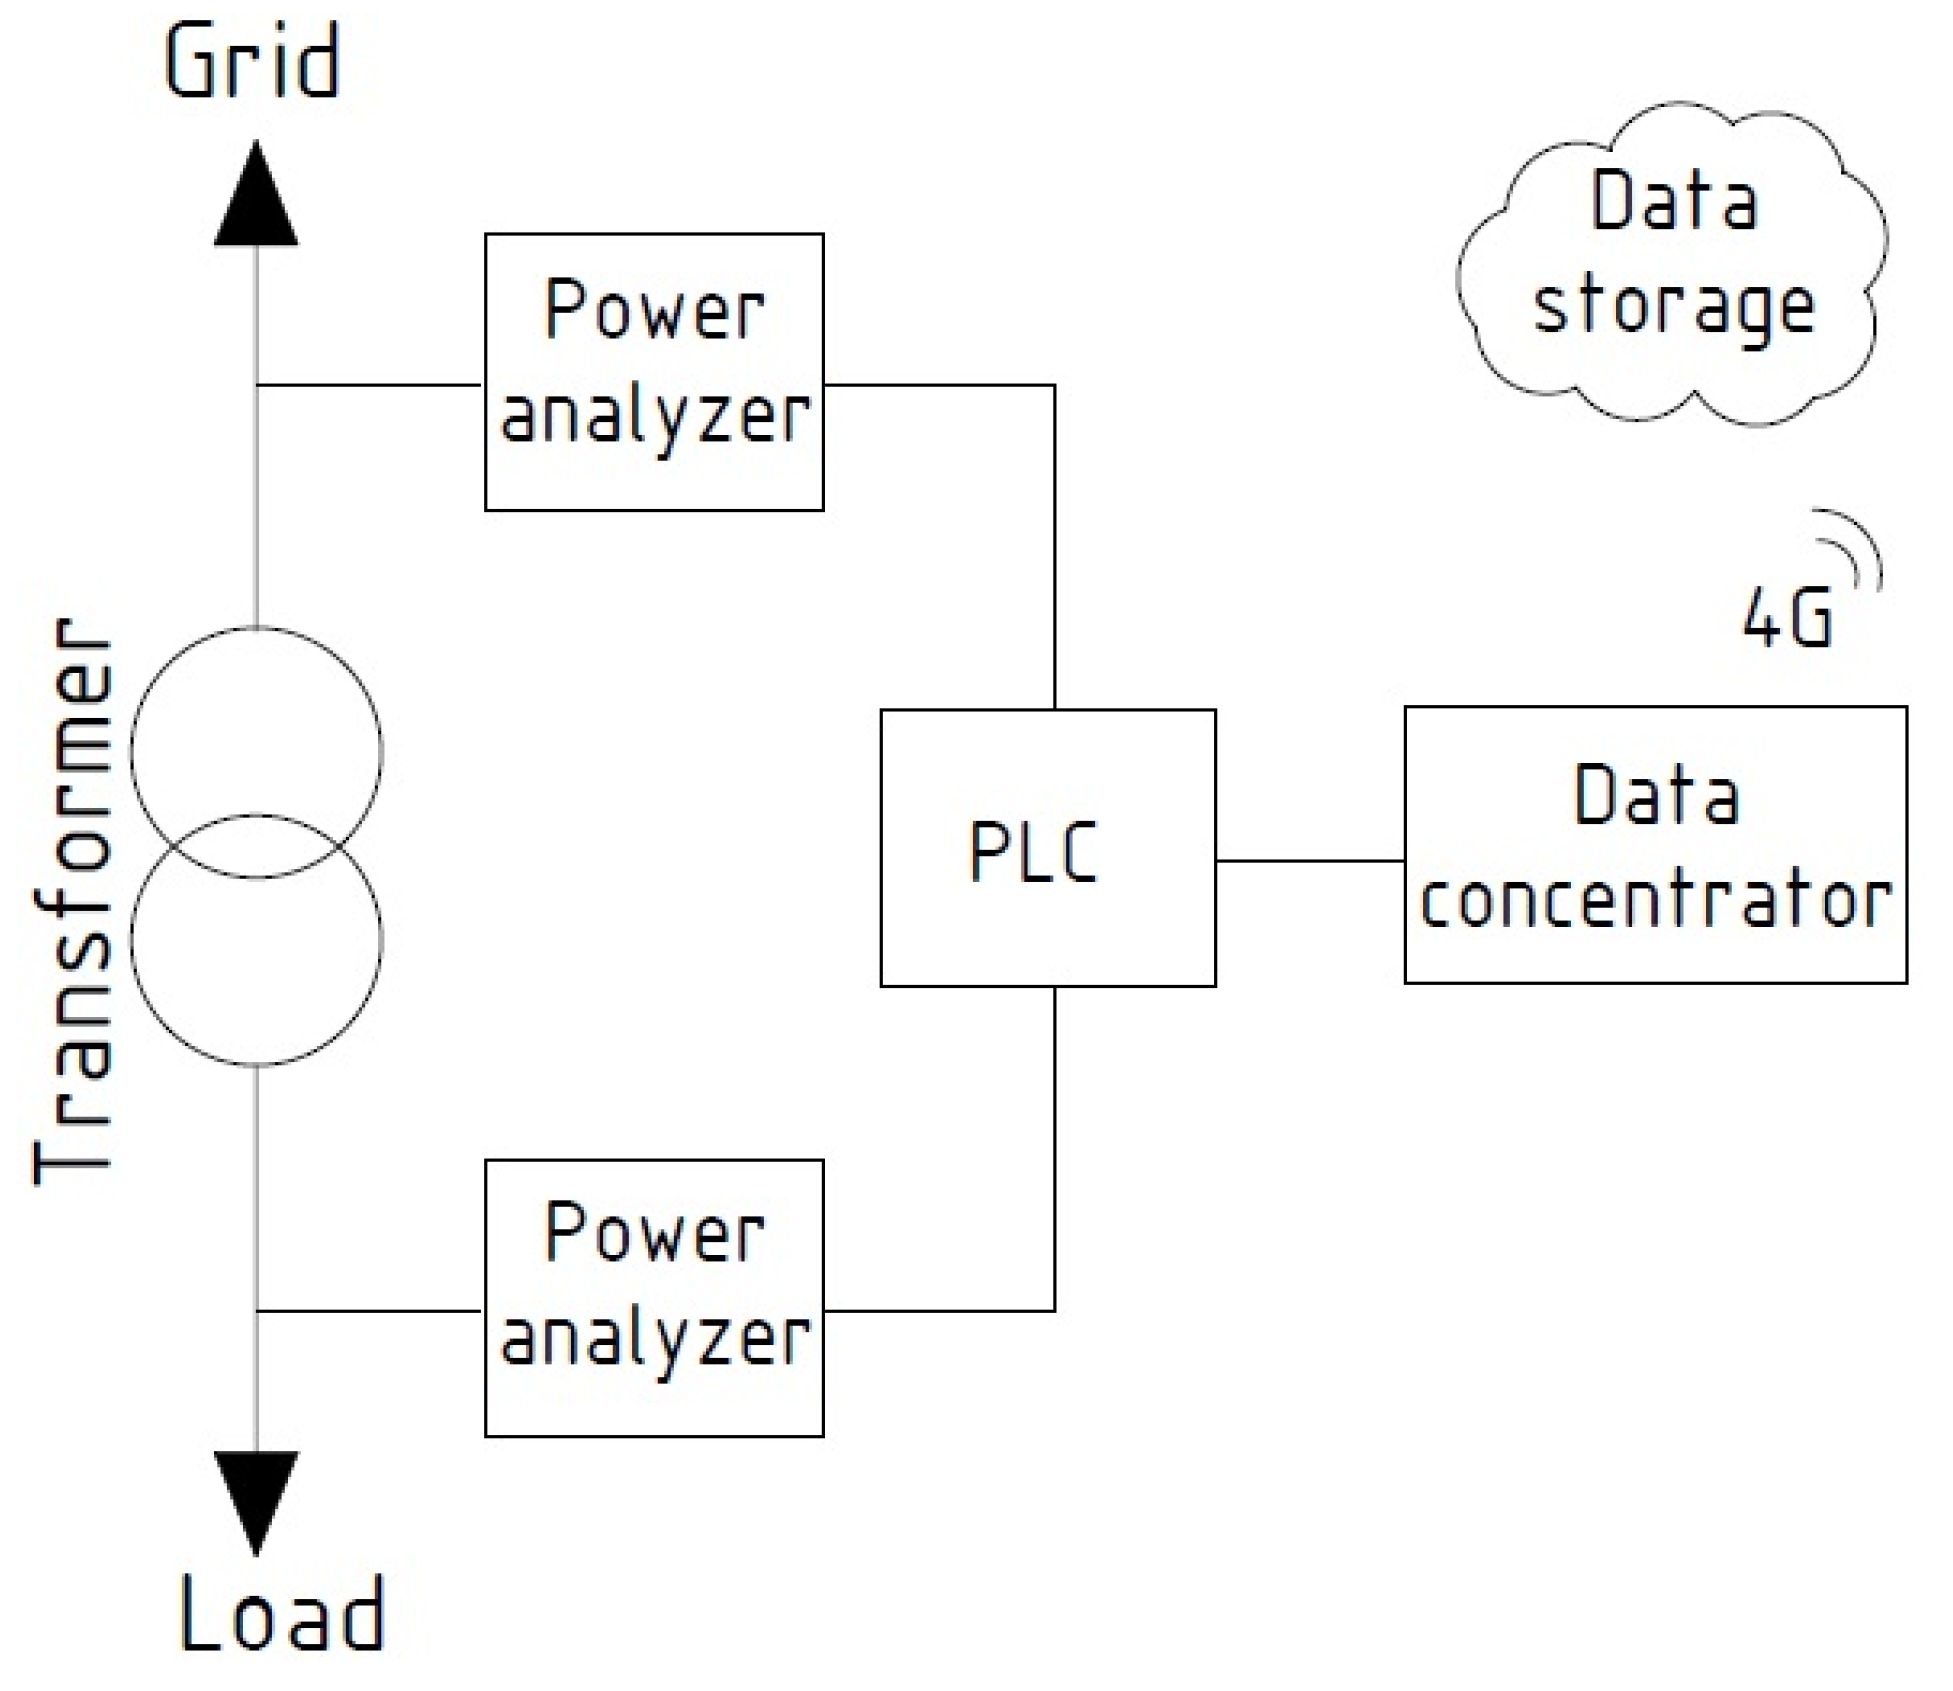
The principle scheme of the experiment is shown in Figure 3. Two power analyzers were used to measure the transformer’s power at medium and low voltages in order to verify the computational algorithm. The most important parameters (current, voltage, power, displacement power factor (DPF), and so on) were measured. In addition, additional parameters such as true power factor (TPF), total harmonic distortion of current (THDI), total harmonic distortion of voltage (THDU), and individual harmonics of current and voltage up to 15 V were measured. Data from a medium-voltage power meter was transferred to a PLC and then to the cloud. The data from the power meter mounted on the low voltage side were analyzed by the PLC and sent to data storage. The data acquisition principle is depicted in Figure 4.
5. Results
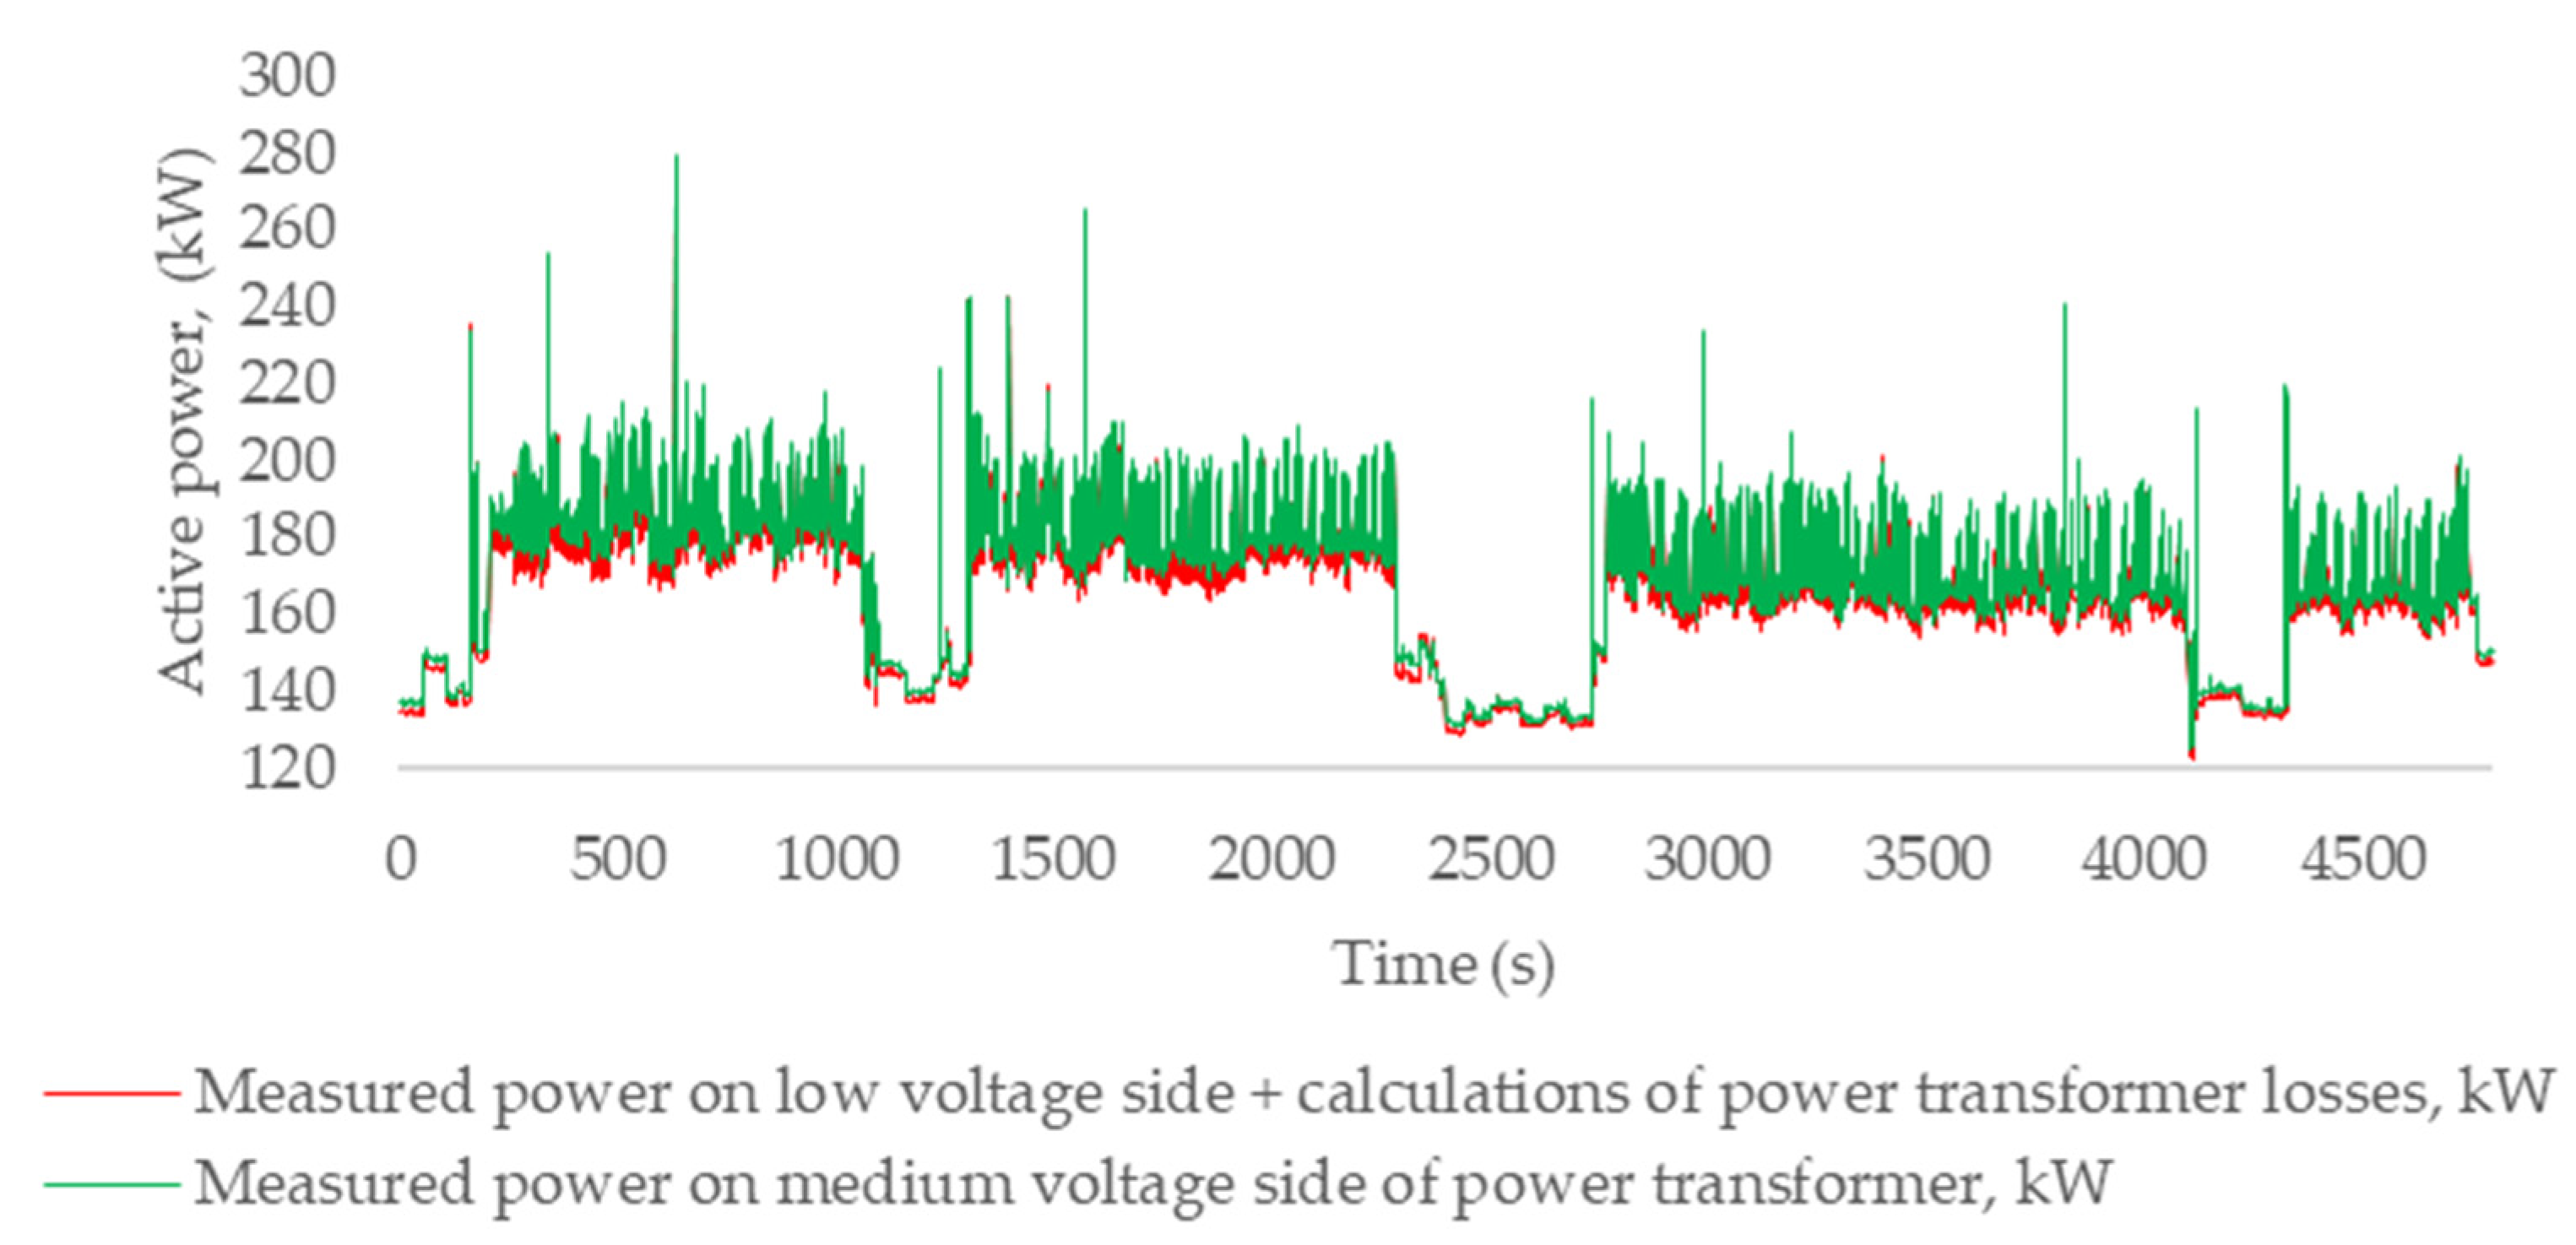
Before the experiment, it was known that the power transformer was not operating at full capacity, so it was decided to disconnect the fixed power factor correction unit (FPFCU) in the middle of the experiment to increase apparent power. The calculated active power on the 10 kV side was compared with the measured active power, and the results are provided in Figure 5. The average relative error of the calculations was 0.7%.
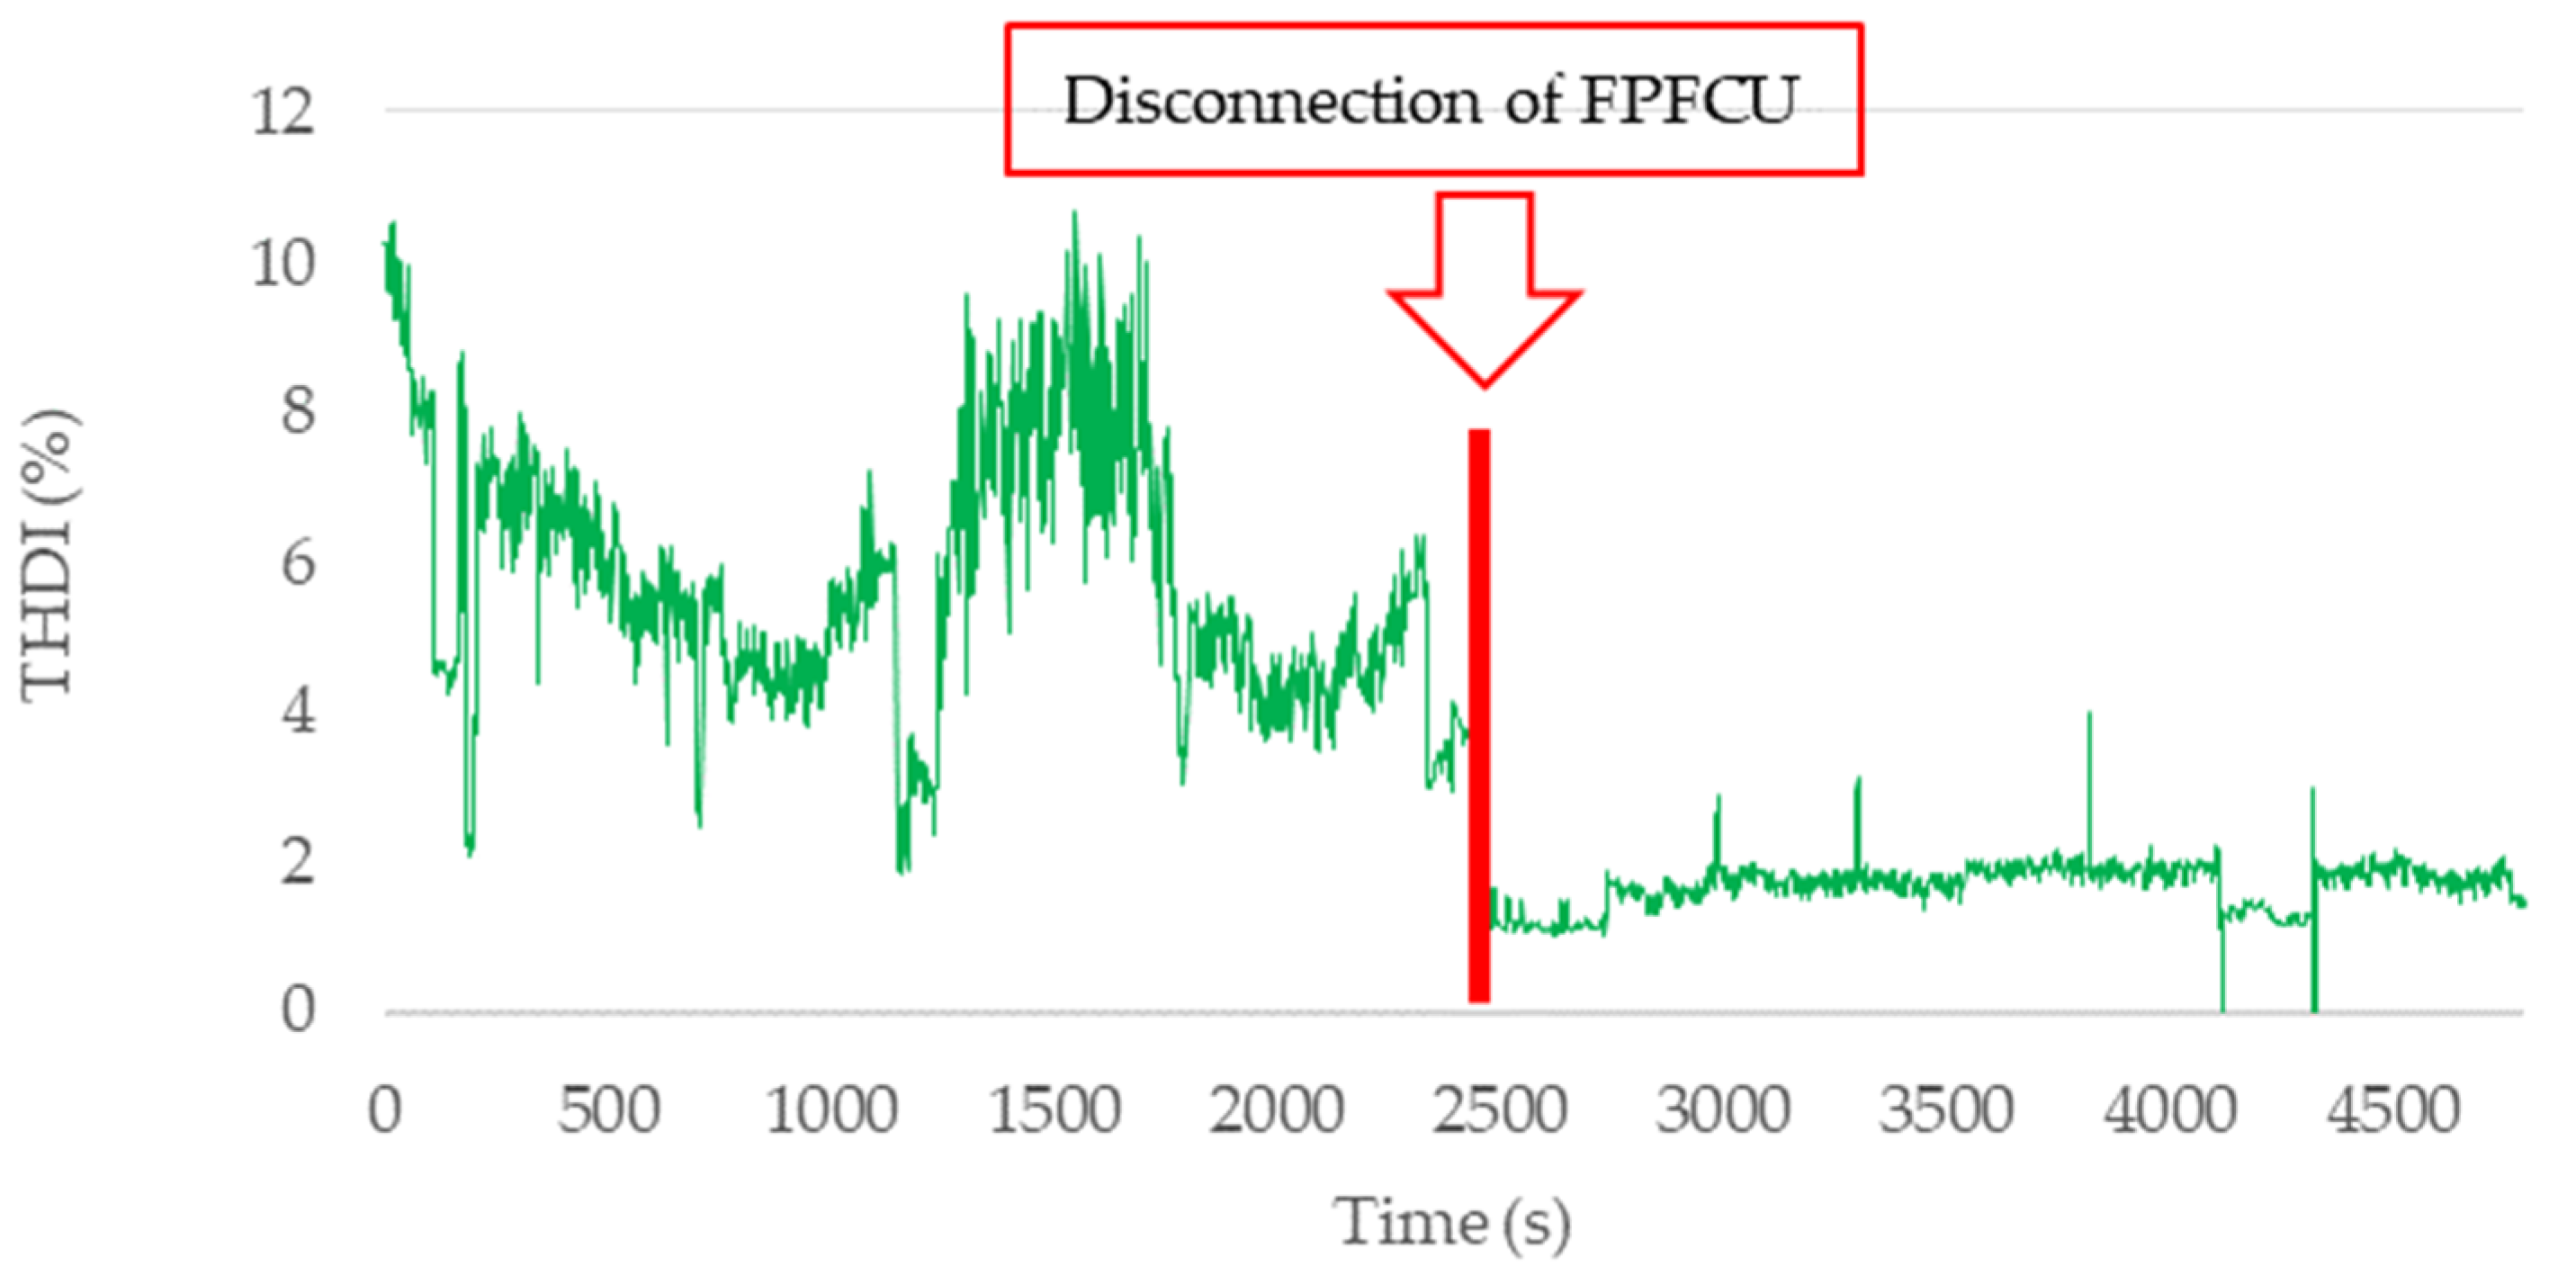
The fixed power factor correction unit was installed only with capacitors. The capacitor is a linear reactive element and it does not generate harmonics. During the experiment, it was observed that after switching off the FPFCU, current harmonic distortion was decreased from 6 percent on average before to 1.9 percent on average after switching it off. The data with measured THDI are provided in Figure 6.
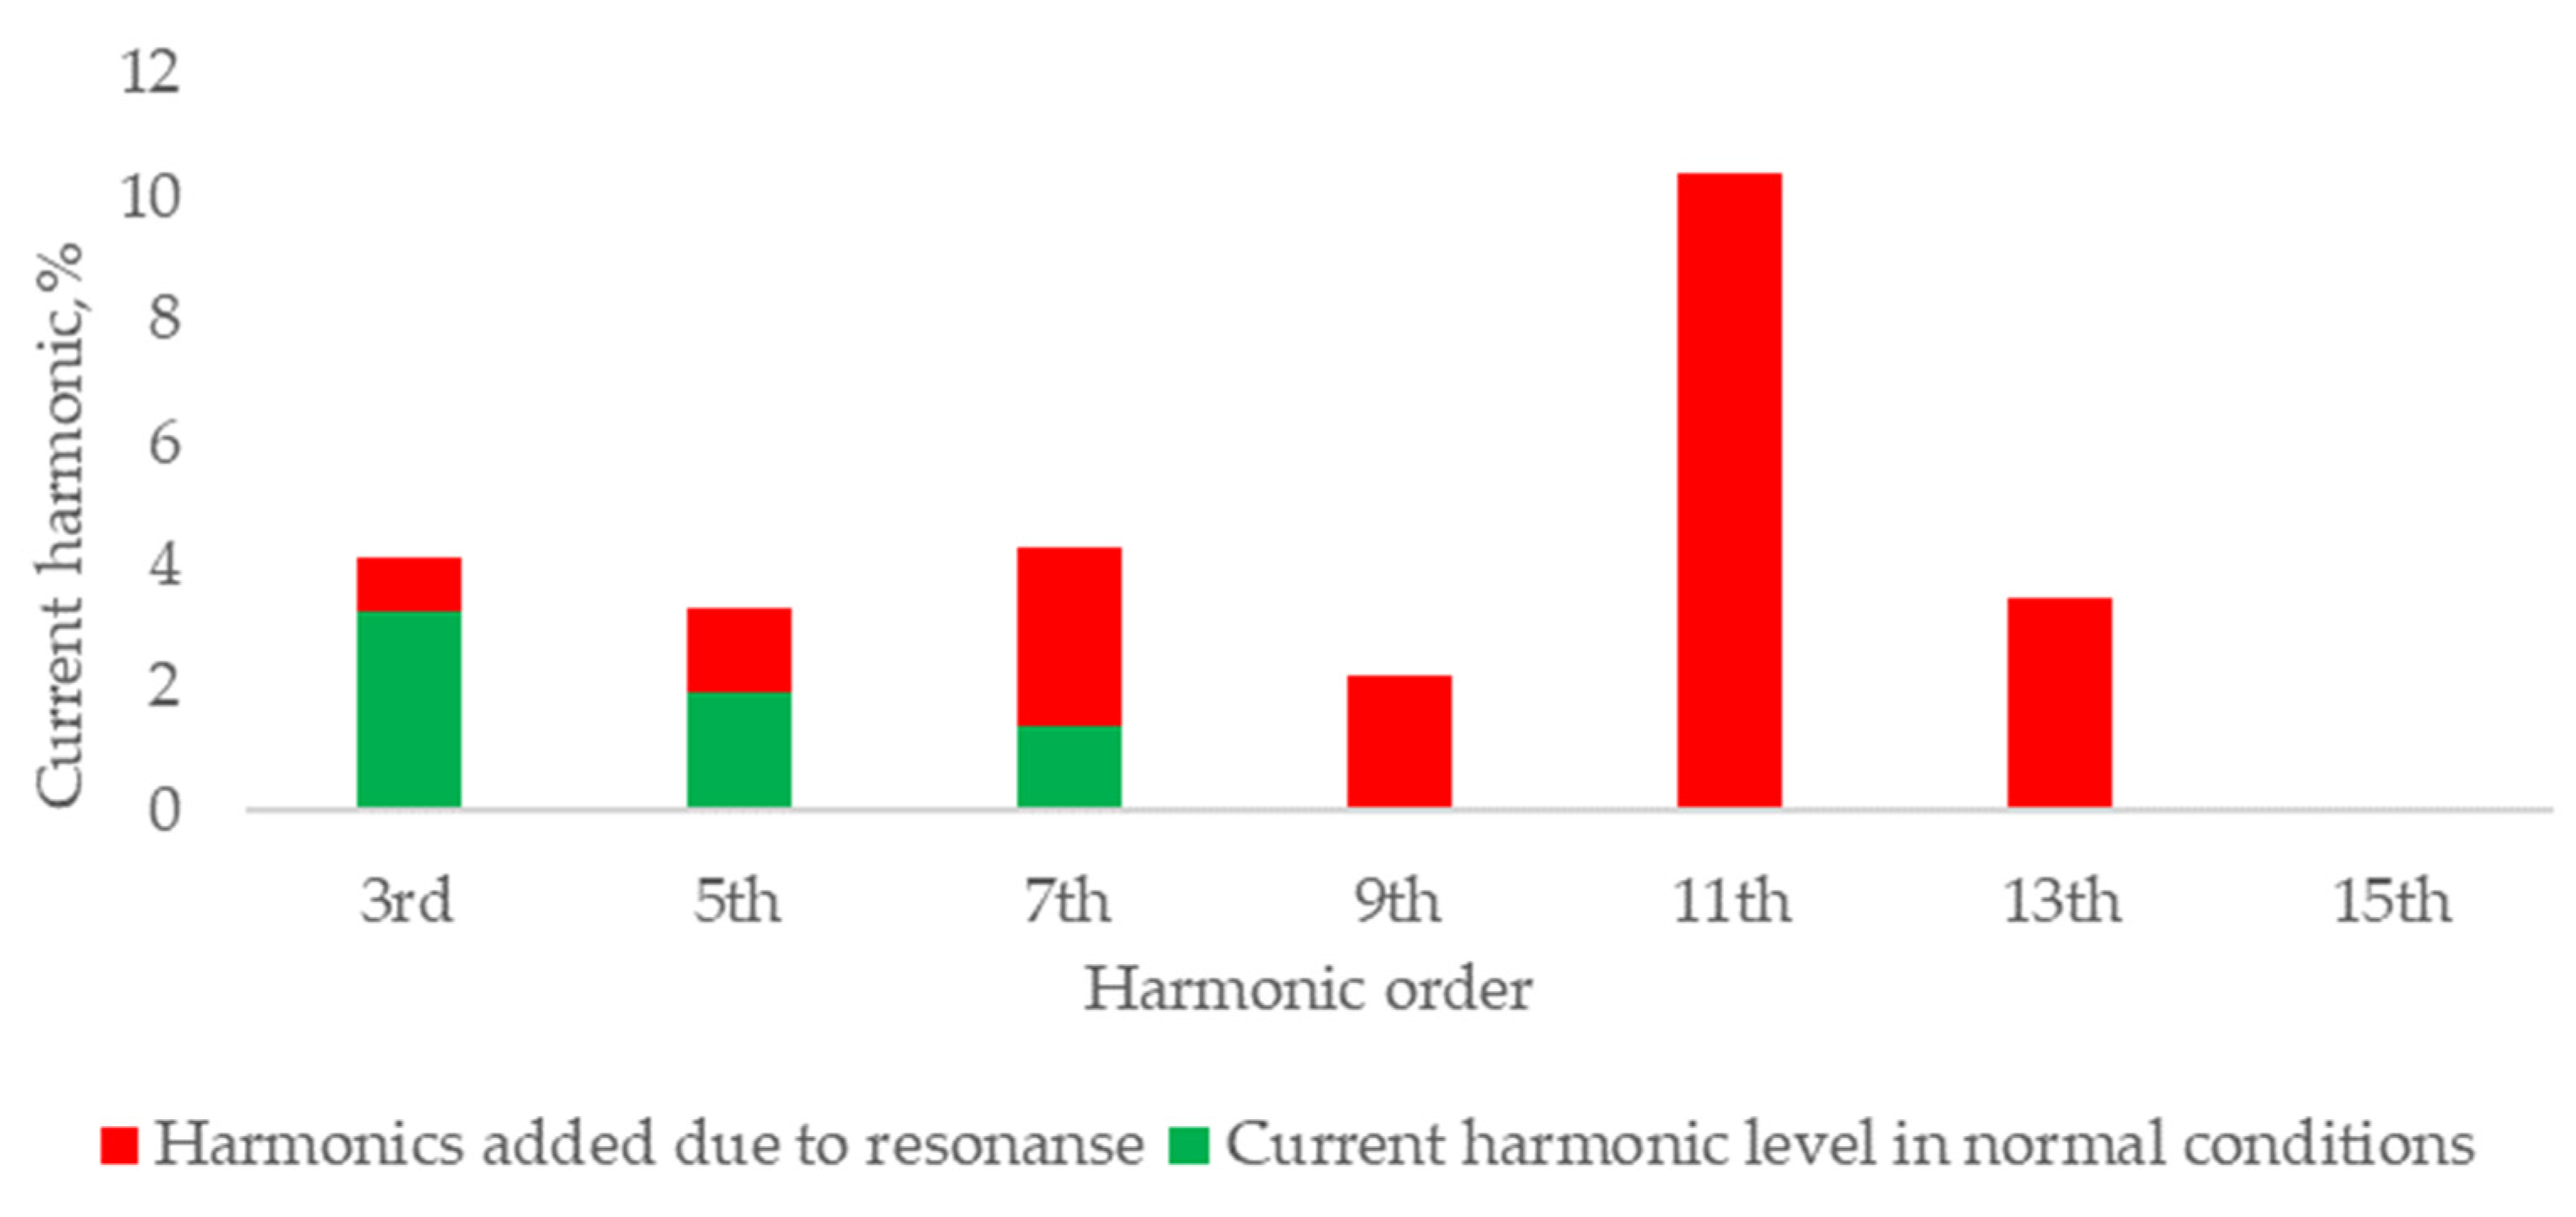
Due to ongoing resonance between the FPFCU and the transformer, the harmonic levels were increased. The most significant change occurred in the 11th-order harmonic, where its maximum level 10.37% was recorded prior to disconnection of the FPFCU. However, this harmonic level was no longer present following the disconnection of the FPFCU. The change in current harmonics on average is provided in Figure 7.
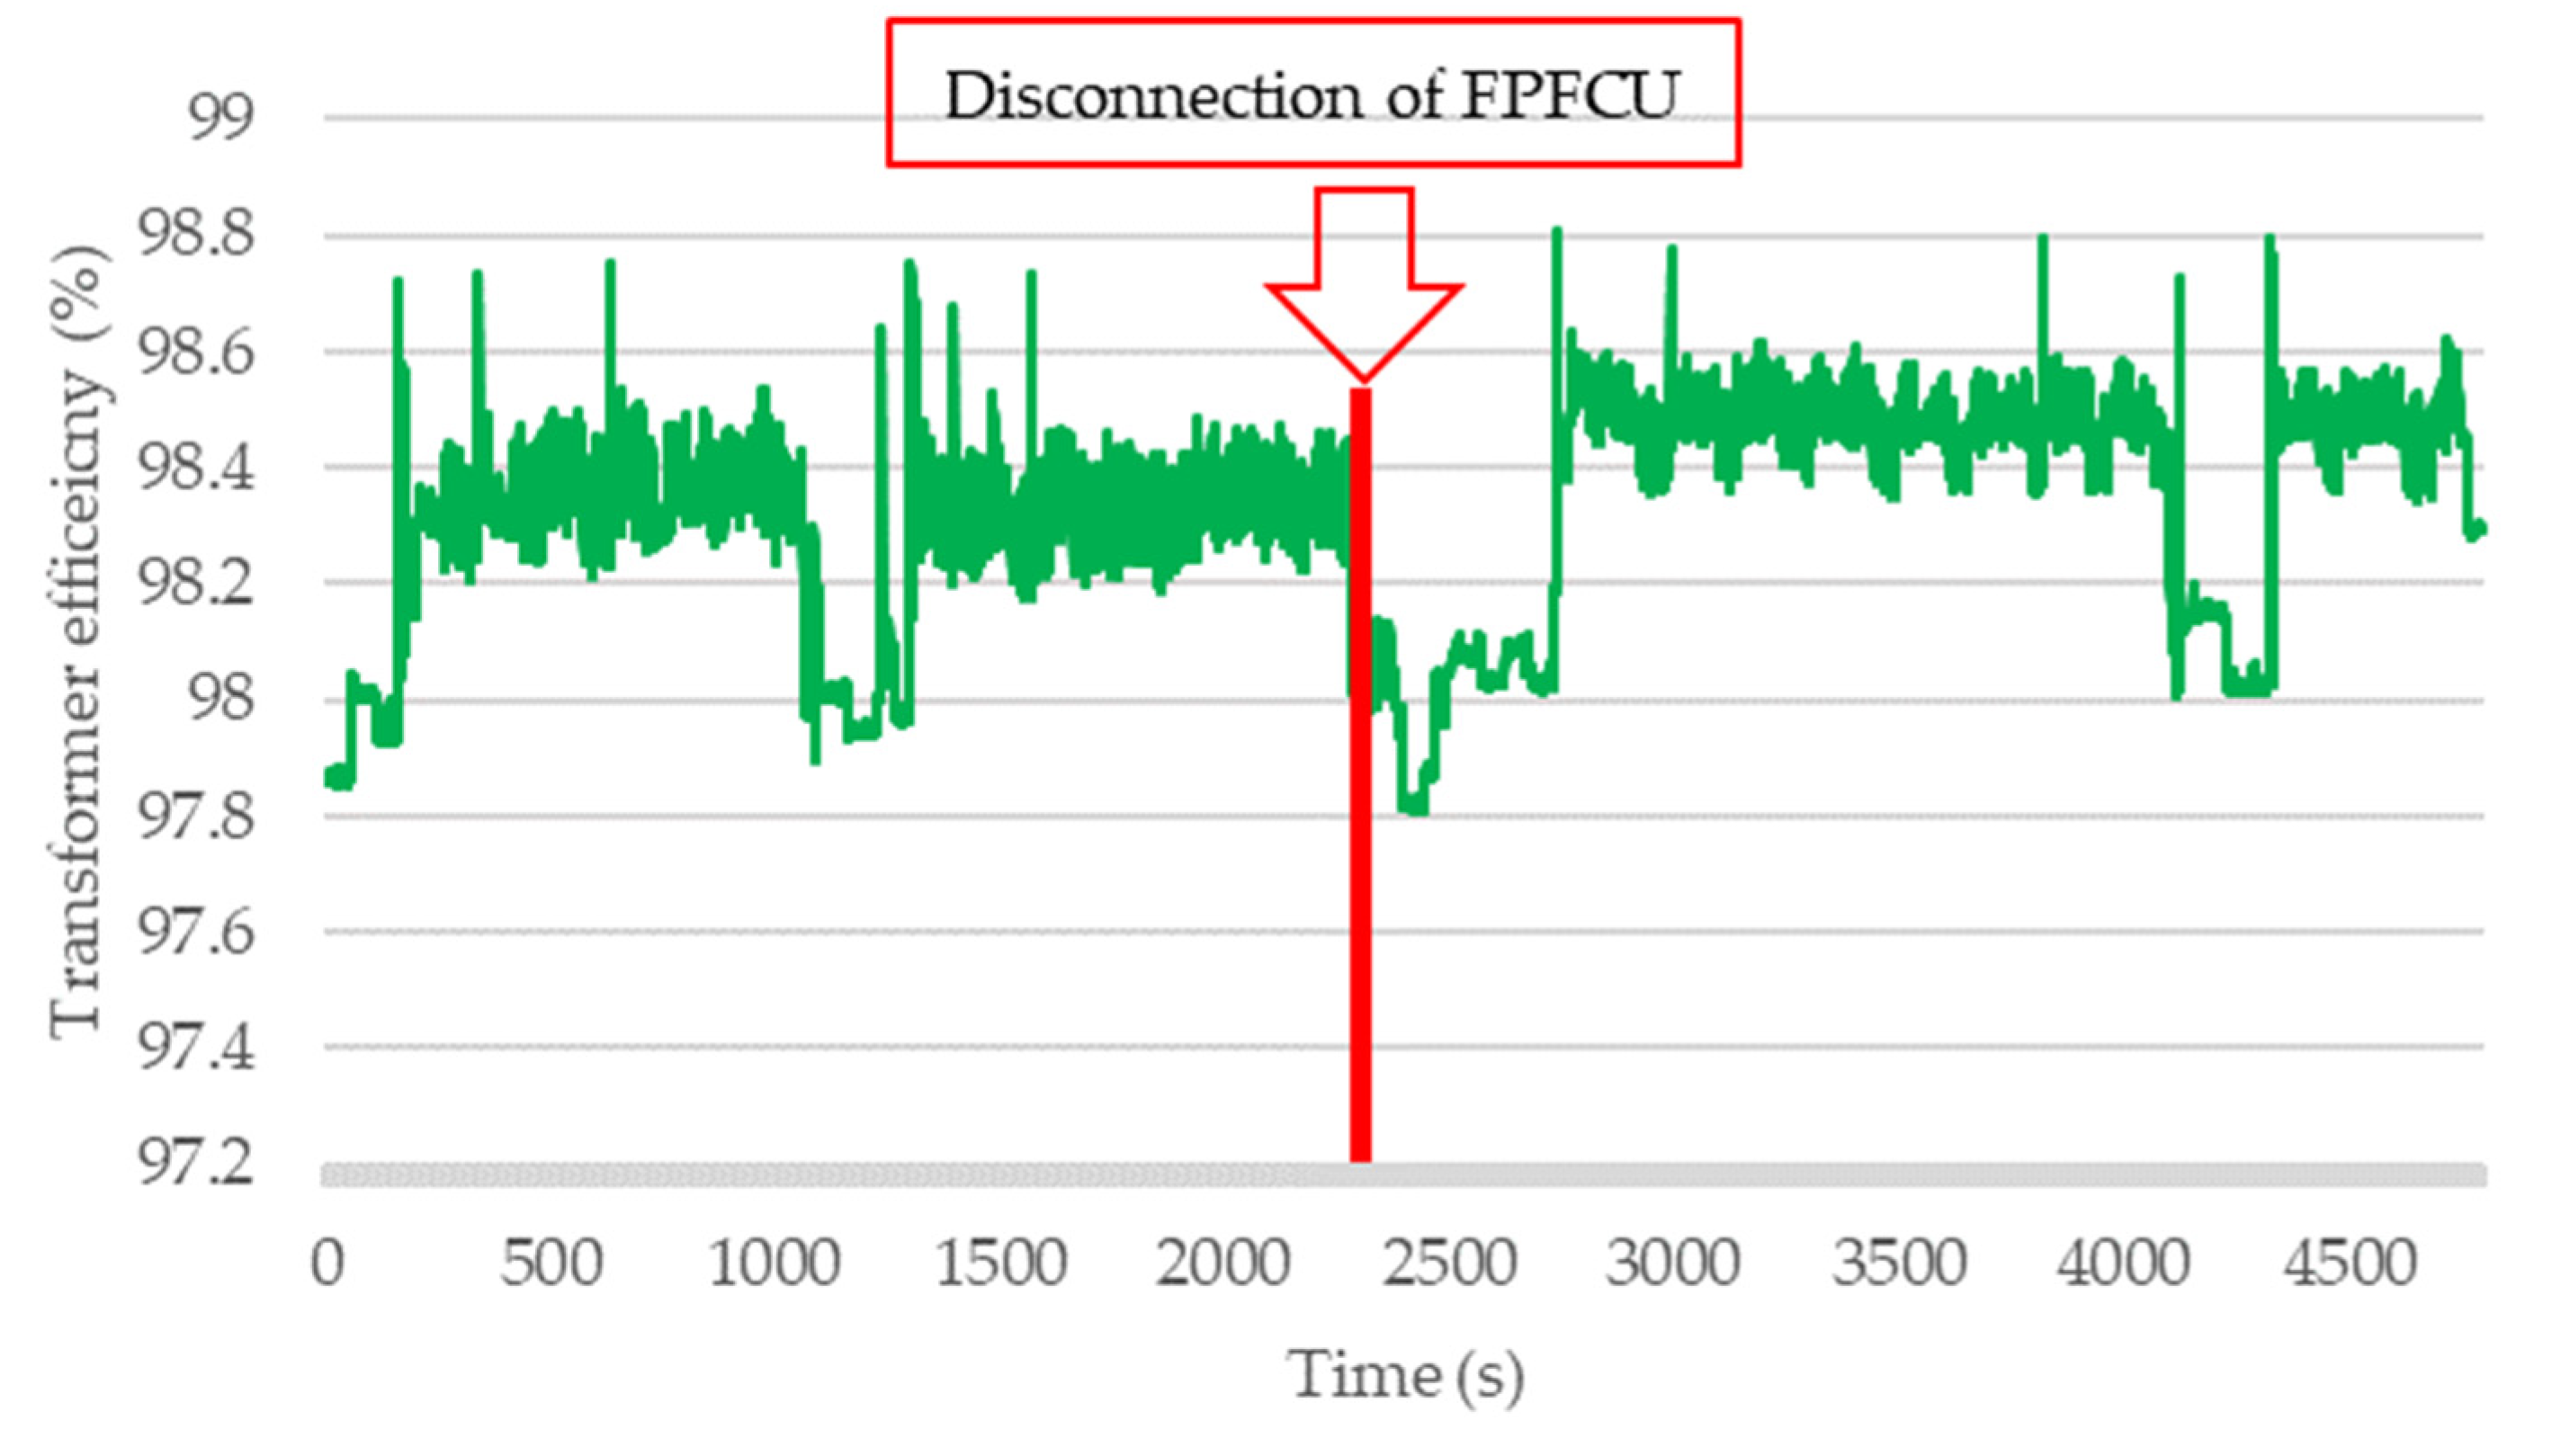
Even when the transformer lost the FPFCU, and the apparent power was increased, the transformer efficiency was also increased because of the smaller current harmonic content. The transformer efficiency increased from 98.25% on average to 98.39% on average. The graph of the transformer efficiency is provided in Figure 8.
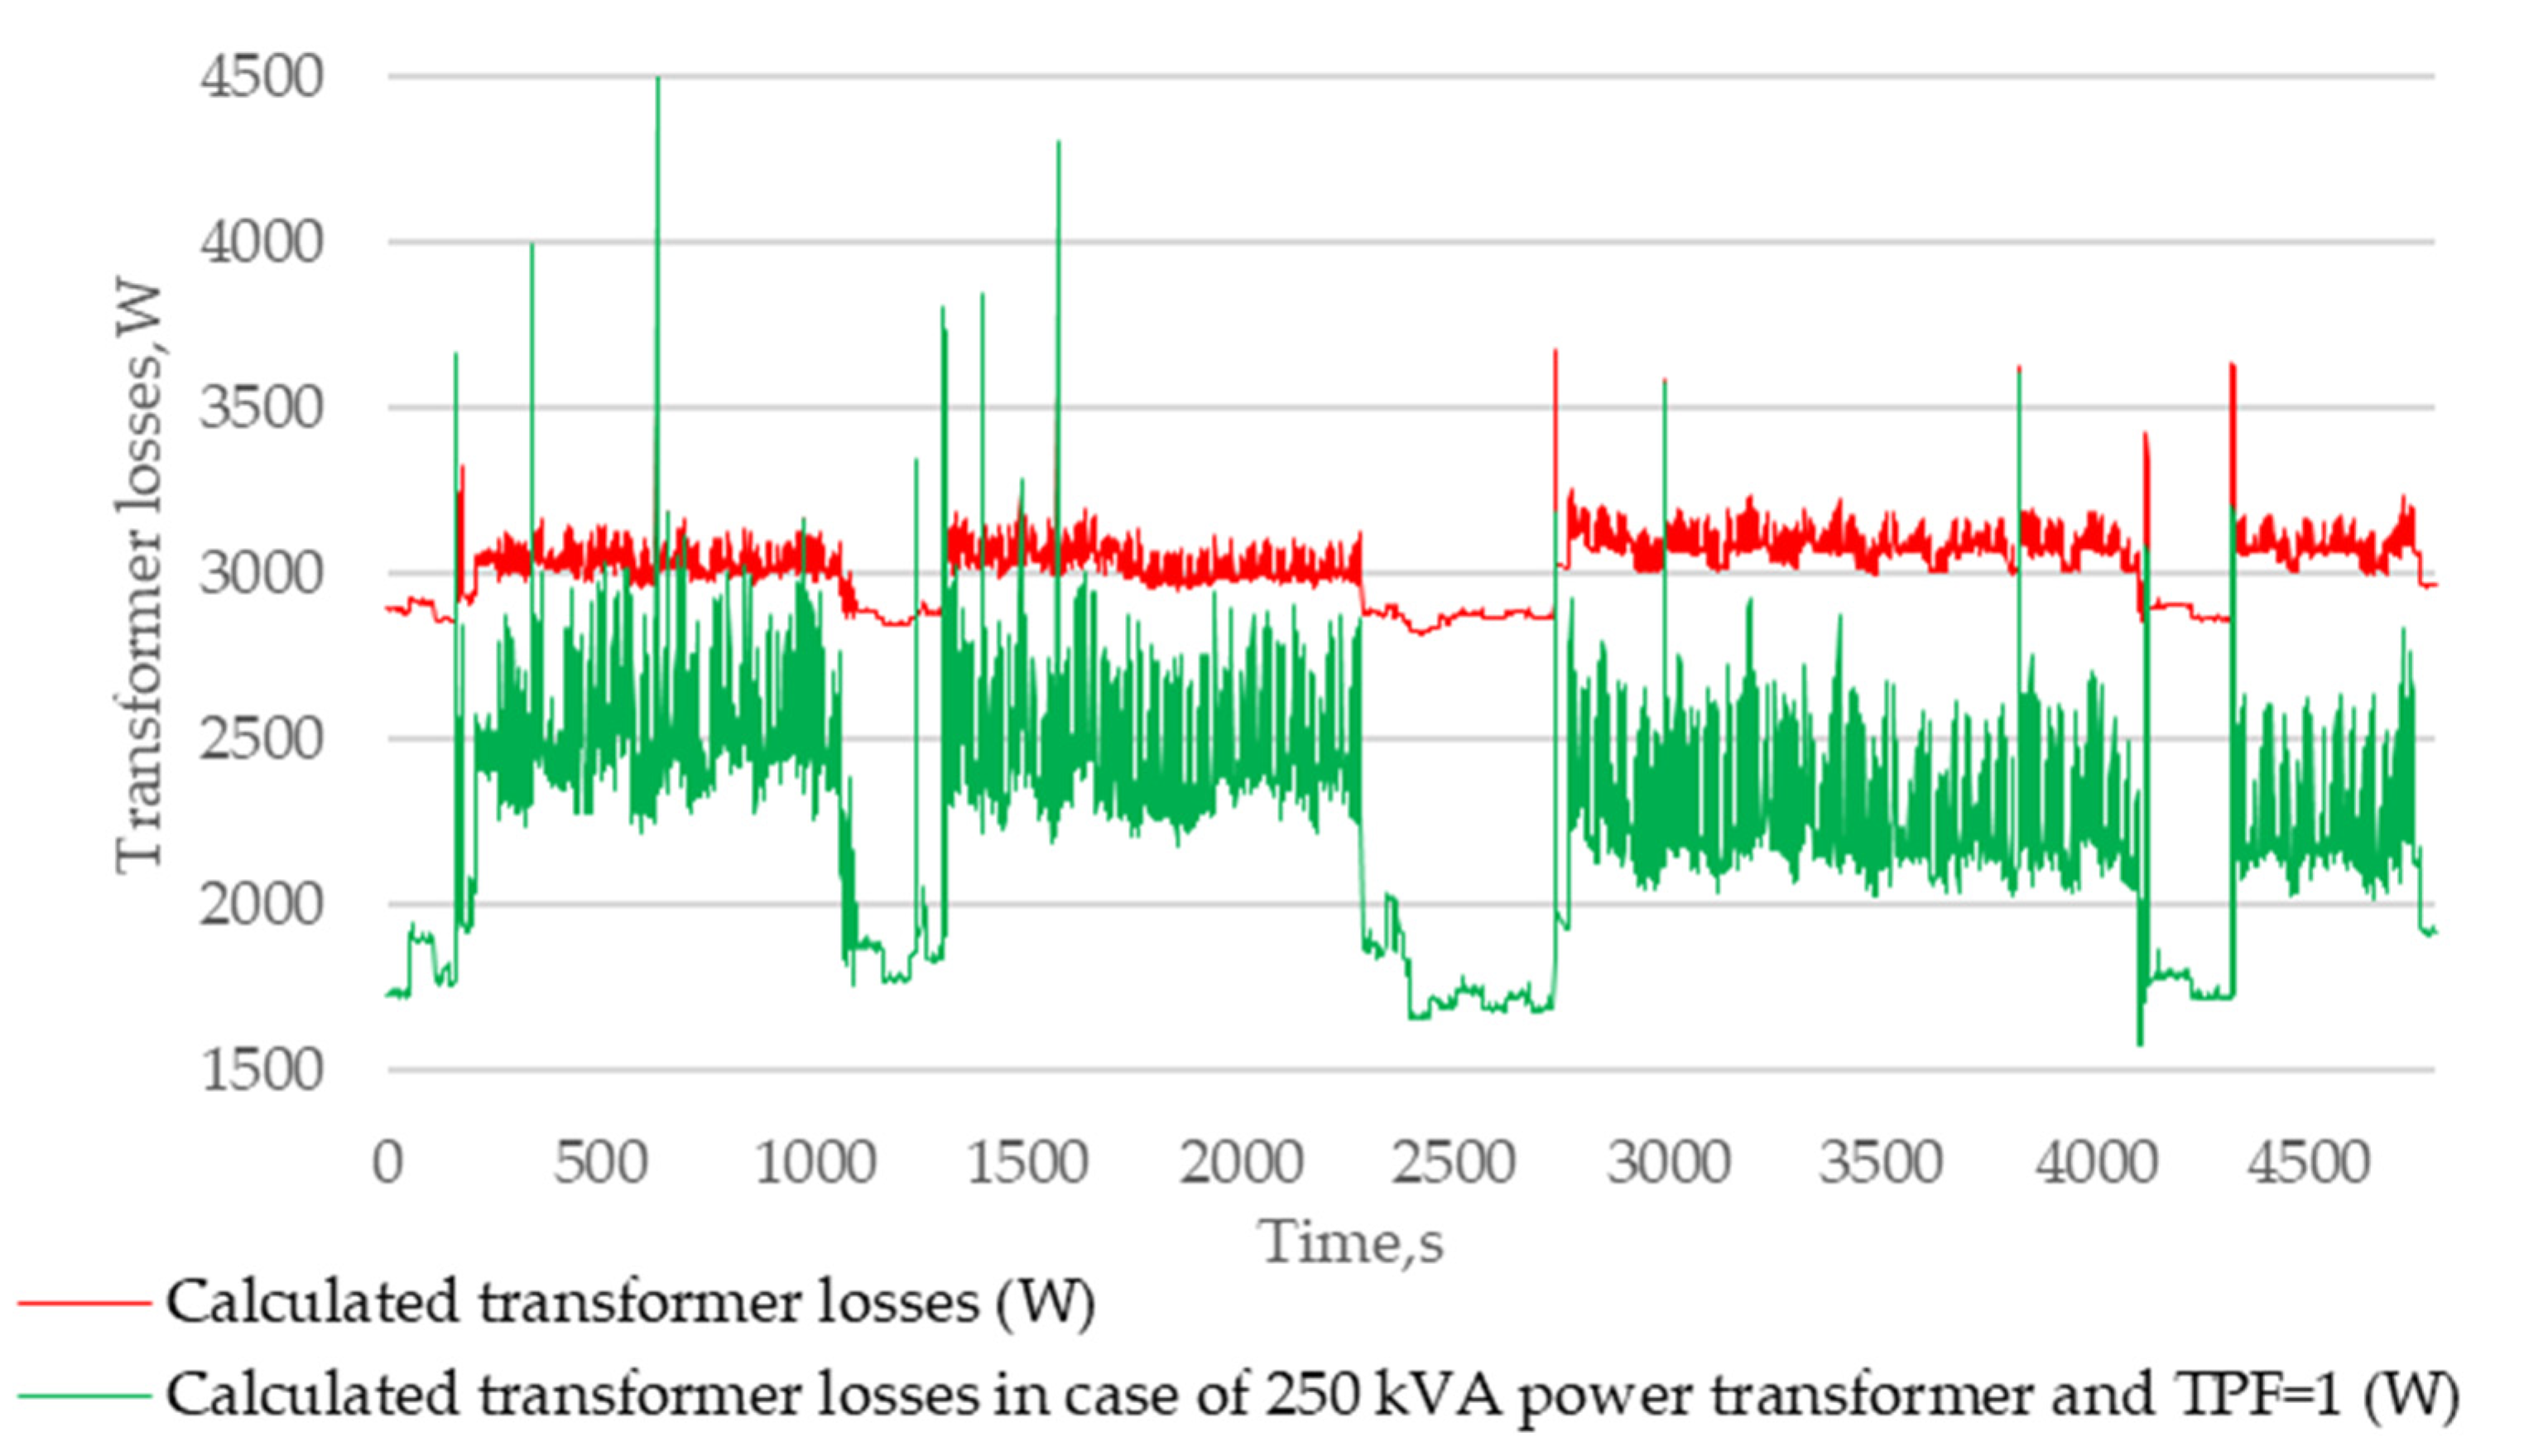
For energy audit purposes, it is necessary to provide calculations of the better performance system. In the PLC-implemented calculation to compare power transformer losses, and power transformer losses in the case of TPF = 1, the transformer is 250 KVA of nominal power. Results are provided in Figure 9.
6. Discussion
The experiment shows that the calculation algorithm was working with an average relative error of 0.7%. The prototype can be used for energy audits of power transformers to give better insight into efficiency losses. During audits, it can help to find abnormal operation modes such as resonance to avoid complications with power factor correction units. Furthermore, it can help to evaluate the economic return on investments in power quality-enhancing devices or usage of higher class rather than in oversized power transformers.
This prototype has real-time measurement and calculation advantages compared to existing methodologies. Furthermore, it has the advantage of the flexibility to be connected with different types of power meters, which are already installed in industrial companies. Unfortunately, this calculation algorithm is a simplified version and has a time delay; for this reason, calculations with eddyling software can achieve better accuracy.
As a potential field for future research, the usage of more advanced power analyzers could be explored. These power analyzers have the capability to be programmed, enabling them to perform calculations independently without relying on programmable logic controllers (PLCs). Such an approach could potentially mitigate time delays and enhance efficiency. In addition, those analyzers can measure higher-order harmonics with higher measurement sampling.
7. Conclusions
The prototype was designed and tested to aid in conducting energy audits of a power transformer in industrial operations. A programmable logic controller and a power meter with a Modbus RTU connection were used in the prototype. Calculations in the PLC were carried out following IEEE Std C57.110TM-2018 standards and tested using the indirect measurement technique, with a relative calculation accuracy of roughly 0.7% when compared to real medium voltage measurements.
During the experiment, resonance between the FPFCU and transformer was noticed. After disconnection of the FPFCU, the current harmonic distortion was reduced from 6% to 1.9%. This indicates that the source of current harmonics is outside of the company’s network. The change of the efficiency of power transformers increased from 98.25% to 98.39%; thus, even a relatively small amount of THDI can have similar effects to system losses, as reactive power and economic factor have to be considered. The need for those calculations are more relevant due to the increasing number of nonlinear loads and increasing power of renewable energy sources, which will lead to higher harmonic distortion.
Author Contributions
Conceptualization, M.P. and S.G.; methodology, A.J.; software, A.J.; validation, M.P., A.J. and T.D.; formal analysis, T.D.; investigation, T.D.; resources, S.G.; data curation, M.P.; writing—original draft preparation, M.P.; writing—review and editing, A.J.; visualization, M.P.; supervision, T.D.; project administration, S.G.; funding acquisition, S.G. All authors have read and agreed to the published version of the manuscript.
Funding
This research received no external funding.
Institutional Review Board Statement
Not applicable.
Informed Consent Statement
Not applicable.
Data Availability Statement
The data presented in this study are available on request from the corresponding author. The data are not publicly available due to involvement of the industry company.
Conflicts of Interest
The authors declare no conflict of interest.
References
- Iyer, G.C.; Edmonds, J.A.; Fawcett, A.A.; Hultman, N.E.; Alsalam, J.; Asrar, G.R.; Calvin, K.V.; Clarke, L.E.; Creason, J.; Jeong, M.; et al. The contribution of Paris to limit global warming to 2 °C. Environ. Res. Lett. 2015, 10, 125002. [Google Scholar] [CrossRef]
- Climate Impacts in Europe, the JRC PESETA II Project. 2014. Available online: https://publications.jrc.ec.europa.eu/repository/handle/JRC87011 (accessed on 24 November 2022).
- Galvin, R. Policy pressure to retrofit Germany’s residential buildings to higher energy efficiency standards: A cost-effective way to reduce CO2 emissions? Build. Environ. 2023, 237, 110316. [Google Scholar] [CrossRef]
- Pomykala, A.; Szelag, A. Reduction of Power Consumption and CO2 Emissions as a Result of Putting into Service High-Speed Trains: Polish Case. Energies 2022, 15, 4206. [Google Scholar] [CrossRef]
- Tamboli, P.D.; Kulkarni, S.S.; Thosar, A.G. Energy Efficiency in Manufacturing Industry and Analysis of Industrial Motors. In Proceedings of the 2020 4th International Conference on Electronics, Communication and Aerospace Technology (ICECA), Coimbatore, India, 5–7 November 2020; pp. 170–175. [Google Scholar] [CrossRef]
- National Energy Conservation Agency. Energijos Vartojimo Efektyvumas. Available online: www.ena.lt/energijos-vartojimo-efektyvumas/ (accessed on 7 December 2022).
- Market Data|Nord Pool. Available online: https://www.nordpoolgroup.com/en/Market-data1/Dayahead/Area-Prices/LT/Yearly/?view=table (accessed on 12 May 2023).
- Driving down energy costs: A new report says energy efficiency is the best way for industries to cut spending and reduce emissions right now. Pit Quarry 2023, 115, 46.
- Zhang, J.; Zhang, Y.; Chen, S.; Gong, S. How to reduce energy consumption by energy audits and energy management: The case of province Jilin in China. In Proceedings of the 2011 Proceedings of PICMET ‘11: Technology Management in the Energy Smart World (PICMET), Portland, OR, USA, 31 July–4 August 2011; pp. 1–5. [Google Scholar]
- Nguyen, V.; Nguyen, N.; Schumacher, B.; Tran, T. Practical Application of Plan–Do–Check–Act Cycle for Quality Improvement of Sustainable Packaging: A Case Study. Appl. Sci. 2020, 10, 6332. [Google Scholar] [CrossRef]
- Al Momani, D.; Al Turk, Y.; Abuashour, M.I.; Khalid, H.M.; Muyeen, S.; Sweidan, T.O.; Said, Z.; Hasanuzzaman, M. Energy saving potential analysis applying factory scale energy audit—A case study of food production. Heliyon 2023, 9, e14216. [Google Scholar] [CrossRef] [PubMed]
- Stamenić, M.; Jankes, G.; Tanasić, N.; Trninić, M.; Simonović, T. Energy audit as a tool for improving overal energy efficiency in Serbian industrial sector. In Proceedings of the 2012 2nd International Symposium on Environment Friendly Energies and Applications, London, UK, 25–27 June 2012; pp. 118–122. [Google Scholar] [CrossRef]
- Sulistyanto, M.P.T.; Pranata, K.B. Preliminary study of utilizing Internet of Things for monitoring energy use in building to support energy audit process. In Proceedings of the 2017 4th International Conference on Computer Applications and Information Processing Technology (CAIPT), Kuta Bali, Indonesia, 8–10 August 2017; pp. 1–7. [Google Scholar] [CrossRef]
- Akhtar, T.; Rehman, A.U.; Jamil, M.; Gilani, S.O. Impact of an Energy Monitoring System on the Energy Efficiency of an Automobile Factory: A Case Study. Energies 2020, 13, 2577. [Google Scholar] [CrossRef]
- McElholm, M.; Harkin, J.; Razaq, A.; Maguire, L. Case study: Impact of auxiliary energy in manufacturing operations. In Proceedings of the 2018 2nd International Symposium on Small-scale Intelligent Manufacturing Systems (SIMS), Cavan, Ireland, 16–18 April 2018; pp. 1–6. [Google Scholar] [CrossRef]
- Maheepala, D.C.; Nayanajith, R.M.N.; Somarathna, M.W.R.P.; Bandara, R.A.A.M.; Hemapala, K.T.M.U. Designing an Energy Monitoring, Analysing and Solution Providing System for Energy Auditing. In Proceedings of the 2018 Fourth International Conference on Advances in Electrical, Electronics, Information, Communication and Bio-Informatics (AEEICB), Chennai, India, 27–28 February 2018; pp. 1–5. [Google Scholar] [CrossRef]
- Jiang, L.-M.; Meng, J.-X.; Yin, Z.-D.; Dong, Y.-X.; Zhang, J. Research on additional loss of line and transformer in low voltage distribution network under the disturbance of power quality. In Proceedings of the 2018 International Conference on Advanced Mechatronic Systems (ICAMechS), Zhengzhou, China, 30 August–2 September 2018; pp. 364–369. [Google Scholar] [CrossRef]
- Taher, M.A.; Kamel, S.; Ali, Z.M. K-Factor and transformer losses calculations under harmonics. In Proceedings of the 2016 Eighteenth International Middle East Power Systems Conference (MEPCON), Cairo, Egypt, 27–29 December 2016; pp. 753–758. [Google Scholar] [CrossRef]
- Jiang, W.; Cheng, J.; Zhou, Z.; Huang, B.; Zhao, Z. Research on harmonics liability division considering the influence of user harmonics on economic loss. Energy Rep. 2023, 9, 1569–1577. [Google Scholar] [CrossRef]
- Thango, B.A.; Jordaan, J.A.; Nnachi, A.F. Effects of Current Harmonics on Maximum Loading Capability for Solar Power Plant Transformers. In Proceedings of the 2020 International SAUPEC/RobMech/PRASA Conference, Cape Town, South Africa, 29–31 January 2020; pp. 1–5. [Google Scholar] [CrossRef]
- Rinas, I.W.; Suartika, I.M.; Pemayun, A.A.M. Analysis of the increase of transformer power losses due to the operation of unbalanced nonlinier loads. J. Electr. Electron. Inform. 2018, 2, 38. [Google Scholar] [CrossRef]
- Thango, B.A.; Jordaan, J.A.; Nnachi, A.F. Contemplation of Harmonic Currents Loading on Large-Scale Photovoltaic Transformers. In Proceedings of the 2020 6th IEEE International Energy Conference (ENERGYCon), Tunis, Tunisia, 28 September–1 October 2020; pp. 479–483. [Google Scholar] [CrossRef]
- Shadab, S.; Revati, G.; Wagh, S.R.; Singh, N.M. Finite-time parameter estimation for an online monitoring of transformer: A system identification perspective. Int. J. Electr. Power Energy Syst. 2023, 145, 108639. [Google Scholar] [CrossRef]
- Hu, W.; Guo, Q.; Wang, W.; Wang, W.; Song, S. Loss reduction strategy and evaluation system based on reasonable line loss interval of transformer area. Appl. Energy 2022, 306, 118123. [Google Scholar] [CrossRef]
- Tavarov, S.S.; Zicmane, I.; Beryozkina, S.; Praveenkumar, S.; Safaraliev, M.; Shonazarova, S. Evaluation of the Operating Modes of the Urban Electric Networks in Dushanbe City, Tajikistan. Inventions 2022, 7, 107. [Google Scholar] [CrossRef]
- Rahat, O.; Saniei, M.; Seifossadat, S.G. Modeling and new tuning of the distribution transformer-integrated passive power filter and its effects on the transformer performance and network power quality. Electr. Power Syst. Res. 2023, 214, 108844. [Google Scholar] [CrossRef]
- Owosuhi, A.; Hamam, Y.; Munda, J. Maximizing the Integration of a Battery Energy Storage System–Photovoltaic Distributed Generation for Power System Harmonic Reduction: An Overview. Energies 2023, 16, 2549. [Google Scholar] [CrossRef]
- Gómez, J.S.; Navas-Fonseca, A.; Flores-Bahamonde, F.; Tarisciotti, L.; Garcia, C.; Nuñez, F.; Rodriguez, J.; Cipriano, A.Z. Predictive Control for Current Distortion Mitigation in Mining Power Grids. Appl. Sci. 2023, 13, 3523. [Google Scholar] [CrossRef]
- Paul, W.; Scholand, M. Energy PROPHET II: The Potential for Global Energy Savings from High-Efficiency Distribution Transformers; Waide Strategic Efficiency Limited and N14 Energy Limited: Manchester, UK, 2014. [Google Scholar]
- Yuan, W.; Yuan, X.; Xu, L.; Zhang, C.; Ma, X. Harmonic Loss Analysis of Low-Voltage Distribution Network Integrated with Distributed Photovoltaic. Sustainability 2023, 15, 4334. [Google Scholar] [CrossRef]
- Wang, Y.; Li, L.; Wu, D.; Yuan, X. Real-time dynamic energy efficiency evaluation and analysis of industrial processes based on multi-objective state transition algorithm with reference vector. Can. J. Chem. Eng. 2022, 100, S121–S140. [Google Scholar] [CrossRef]
- Bantras, T.; Ćuk, V.; Cobben, J.F.G.; Kling, W.L. Estimation and classification of power losses DUE to reduced Power Quality. In Proceedings of the 2012 IEEE Power and Energy Society General Meeting, San Diego, CA, USA, 22–26 July 2012; pp. 1–6. [Google Scholar] [CrossRef]
- Shaked, D.; Holdengreber, E. Efficiency Improvement of an Electric-Grid Transformer Using the Diamagnetism Characteristics of a Bulk Superconductor. Energies 2022, 15, 7146. [Google Scholar] [CrossRef]
- De Almeida, A.T.; Ferreira, F.J.T.E.; Fong, J. Perspectives on Electric Motor Market Transformation for a Net Zero Carbon Economy. Energies 2023, 16, 1248. [Google Scholar] [CrossRef]
- De Almeida, A.; Santos, B.; Martins, F. Energy-efficient distribution transformers in Europe: Impact of Ecodesign regulation. Energy Effic. 2016, 9, 401–424. [Google Scholar] [CrossRef]
- Dems, M.; Komeza, K.; Szulakowski, J.; Kubiak, W. Increase the Efficiency of an Induction Motor Feed from Inverter for Low Frequencies by Combining Design and Control Improvements. Energies 2022, 15, 530. [Google Scholar] [CrossRef]
- Aguiar, V.P.B.; Pontes, R.S.T.; Ferreira, F.J.T.E. Technical and Economic Evaluation of Efficiency Improvement after Rewinding in Low-Power Induction Motors: A Brazilian Case. Energies 2018, 11, 1701. [Google Scholar] [CrossRef]
- Elektros Energetikos Infrastruktūros Energijos. Available online: https://enmin.lrv.lt/uploads/enmin/documents/files/Veikla/Veiklos%20sritys/energijos-naudojimo-efektyvumas/EVE-priemoniu-diegimas-Civitta-2015.pdf (accessed on 7 December 2022).
- Energy Saving Opportunities—Motors. Available online: http://www.electrical-installation.org/enw/index.php?oldid=12752&title=Energy_saving_opportunities_-_Motors (accessed on 18 November 2022).
- Thirugnanasambandam, M.; Hasanuzzaman, M.; Saidur, R.; Ali, M.; Rajakarunakaran, S.; Devaraj, D.; Rahim, N. Analysis of electrical motors load factors and energy savings in an Indian cement industry. Energy 2011, 36, 4307–4314. [Google Scholar] [CrossRef]
- Why Improve the Power Factor? Available online: https://www.electrical-installation.org/enwiki/Why_improve_the_power_factor%3F (accessed on 18 November 2022).
- Kostic, M. Effects of Voltage Quality on Induction Motors’ Efficient Energy Usage. In Induction Motors—Modelling and Control; InTech: London, UK, 2012. [Google Scholar] [CrossRef]
- Savina, N.; Myasoedov, Y.V.; Myasoedova, L.A. Influence of Quality of the Electric Energy on Reliability of Electrical Supply Systems. In Proceedings of the 2018 International Multi-Conference on Industrial Engineering and Modern Technologies (FarEastCon), Vladivostok, Russia, 3–4 October 2018; pp. 1–5. [Google Scholar] [CrossRef]
- Fakhrian, A.; Ganji, B.; Mohammadi, H.R.; Samet, H. De-rating of Transformers under Non-sinusoidal Loads: Modeling and Analysis. In Proceedings of the 2019 IEEE International Conference on Environment and Electrical Engineering and 2019 IEEE Industrial and Commercial Power Systems Europe (EEEIC/I&CPS Europe), Genova, Italy, 11–14 June 2019; pp. 1–5. [Google Scholar] [CrossRef]
- Kovernikova, L.I. Resonance Modes at Harmonics Frequencies in Electrical Networks. E3S Web Conf. 2020, 209, 07006. [Google Scholar] [CrossRef]
- Chaphekar, S.N.; Mohite, R.A.; Dharme, A. Energy monitoring by energy audit and supply side management. In Proceedings of the 2015 International Conference on Energy Systems and Applications, Pune, India, 30 October–1 November 2015; pp. 178–183. [Google Scholar] [CrossRef]
- Orsag, P.; Kocman, S.; Otypka, J. Impact of mains power quality on operation characteristics of induction motor. In Proceedings of the 2014 14th International Conference on Environment and Electrical Engineering, Krakow, Poland, 10–12 May 2014; pp. 382–385. [Google Scholar] [CrossRef]
- Donolo, P.; Pezzani, M.; Bossio, G.; Quispe, E.C.; Valencia, D.; Sousa, V. Impact of Voltage Waveform on the Losses and Performance of Energy Efficiency Induction Motors. In Proceedings of the 2018 IEEE ANDESCON, Cali, Colombia, 22–24 August 2018; pp. 1–4. [Google Scholar] [CrossRef]
- Donolo, P.D.; Pezzani, C.M.; Bossio, G.R.; De Angelo, C.H.; Donolo, M.A. Derating of Induction Motors Due to Power Quality Issues Considering the Motor Efficiency Class. IEEE Trans. Ind. Appl. 2020, 56, 961–969. [Google Scholar] [CrossRef]
- Li, P.; Li, G.; Xu, Y.; Yao, S. Methods Comparation and Simulation of Transformer Harmonic Losses. In Proceedings of the 2010 Asia-Pacific Power and Energy Engineering Conference, Chengdu, China, 28–31 March 2010; pp. 1–4. [Google Scholar] [CrossRef]
- IEEE Std C57.110™-2018. IEEE Recommended Practice for Establishing Liquid-Immersed and Dry-Type Power and Distribution Transformer Capability when Supplying Nonsinusoidal Load Currents. IEEE: Piscataway, NJ, USA, 2018; pp. 1–68. [CrossRef]
- Plienis, M.; Deveikis, T.; Jonaitis, A.; Peftitsis, D. Research of current harmonics’ impact on energy losses in distribution power transformers. In Proceedings of the 2021 IEEE 62nd International Scientific Conference on Power and Electrical Engineering of Riga Technical University (RTUCON), Riga, Latvia, 15–17 November 2021; pp. 1–7. [Google Scholar] [CrossRef]
- Sharifian, M.; Faiz, J.; Fakheri, S.; Zraatparvar, A. Derating of distribution transformers for non-sinusoidal load currents using finite element method. In Proceedings of the 10th IEEE International Conference on Electronics, Circuits and Systems ICECS 2003, Sharjah, United Arab Emirates, 14–17 December 2003; Volume 2, pp. 754–757. [Google Scholar] [CrossRef]
- Pramono, W.B.; Wijaya, F.D.; Hadi, S.P.; Wahyudi, M.S.; Indarto, A. Designing Power Transformer Using Particle Swarm Optimization with Respect to Transformer Noise, Weight, and Losses. Designs 2023, 7, 31. [Google Scholar] [CrossRef]
Figure 1.
Deming cycle.

Figure 2.
Equivalent short-circuit scheme of the power transformer.

Figure 3.
Block diagram of the algorithm in PLC.

Figure 4.
Equipment during experiment.

Figure 5.
Accuracy of calculation algorithm.

Figure 6.
Total current harmonic distortion chart before and after disconnecting FPFCU.

Figure 7.
Average levels of current harmonic distortion before and after disconnecting FPFCU.

Figure 8.
Transformer efficiency during the experiment.

Figure 9.
Loss comparison with smaller power transformer with good power quality.


Table 1.
Formulas for calculating nominal power transformer values [52].
Table 1.
Formulas for calculating nominal power transformer values [52].
| Rated Phase Voltage of the Primary Winding, V | Rated Current of the Primary Winding, A | Transformation Coefficient | Rated Current of Secondary Winding, A | |
|---|---|---|---|---|
| Symbol | k | |||
| Formula |
where U1N is rated line-to-line voltage of primary winding in V, SN is rated power transformer power in kVA, and U2N is rated line-to-line voltage of secondary winding in V.
Table 2.
Calculations of power transformer resistance [52].
Table 2.
Calculations of power transformer resistance [52].
| Short-Circuit Voltage, V | Short-Circuit Impedance, Ω | Short-Circuit Active Resistance, Ω | Idle Reactive Resistance, Ω | |
|---|---|---|---|---|
| Symbol | ||||
| Formula |
Table 3.
Calculations of resistance for separate windings.
| Active Resistance of the Primary Winding, Ω | Reactive Resistance of the Primary Winding, Ω | Active Resistance of the Secondary Winding, Ω | Reactive Resistance of the Secondary Winding, Ω | |
|---|---|---|---|---|
| Symbol | ||||
| Formula |
Table 4.
Ratio of total stray loss distribution in oil-filled transformer [51].
Table 4.
Ratio of total stray loss distribution in oil-filled transformer [51].
| Power, kVA | Eddy Current Losses PEC-N | Other Stray Losses, % | |
|---|---|---|---|
| LV Side (PEC_LV), % | HV Side (PEC_LV), % | ||
| ≤300 | 55 | 5 | 40 |
| >300 ≤1000 | 40 | 10 | 50 |
| >1000 ≤3000 | 20 | 10 | 70 |
| >3000 | 25 | 15 | 60 |
Table 5.
TM-1000/10 power transformer data.
| Rated Power of Transformer, kVA | Rated Primary Voltage, kV | Rated Secondary Voltage, kV | Idle Losses, kW | Short-Circuit Losses, kW | Idle Current, % | Short-Circuit Voltage, % |
|---|---|---|---|---|---|---|
| SN | U1N | U2N | ΔP0 | ΔPk | i0 | uk |
| 1000 | 10.5 | 0.4 | 2.64 | 11.2 | 1.39 | 5.79 |
Disclaimer/Publisher’s Note: The statements, opinions and data contained in all publications are solely those of the individual author(s) and contributor(s) and not of MDPI and/or the editor(s). MDPI and/or the editor(s) disclaim responsibility for any injury to people or property resulting from any ideas, methods, instructions or products referred to in the content. |
© 2023 by the authors. Licensee MDPI, Basel, Switzerland. This article is an open access article distributed under the terms and conditions of the Creative Commons Attribution (CC BY) license (https://creativecommons.org/licenses/by/4.0/).
Share and Cite
MDPI and ACS Style
Plienis, M.; Deveikis, T.; Jonaitis, A.; Gudžius, S. Design of IOT-Based Framework for Evaluation of Energy Efficiency in Power Transformers. Energies 2023, 16, 4358. https://doi.org/10.3390/en16114358
AMA Style
Plienis M, Deveikis T, Jonaitis A, Gudžius S. Design of IOT-Based Framework for Evaluation of Energy Efficiency in Power Transformers. Energies. 2023; 16(11):4358. https://doi.org/10.3390/en16114358
Chicago/Turabian StylePlienis, Mantas, Tomas Deveikis, Audrius Jonaitis, and Saulius Gudžius. 2023. "Design of IOT-Based Framework for Evaluation of Energy Efficiency in Power Transformers" Energies 16, no. 11: 4358. https://doi.org/10.3390/en16114358
Note that from the first issue of 2016, this journal uses article numbers instead of page numbers. See further details here.