
What If Country Commitments for CO2 Removal Were Based on Responsibility for Historical Emissions?
CICERO Center for International Climate Research, Gaustadalléen 21, 0349 Oslo, Norway
Energies 2023, 16(11), 4350; https://doi.org/10.3390/en16114350
Submission received: 30 March 2023
/
Revised: 14 May 2023
/
Accepted: 22 May 2023
/
Published: 26 May 2023
(This article belongs to the Section B1: Energy and Climate Change)
Abstract
:This study explored the consequences of allocating commitments to remove CO2 to countries according to their responsibility for human-made climate change based on historical (cumulative) CO2 emissions from fossil fuel use and industry. The ‘carbon debt’ to be restored through CO2 removal was calculated as the remaining carbon budget for warming by 2 °C minus emissions until 2100. The study included the remaining carbon budget from the recent literature and scenarios for greenhouse gas emissions. This experiment showed that industrialized countries would need to take on the biggest share of CO2 removal if the calculation of historical emissions starts with the industrial era. If accounting instead starts with the global negotiations on climate policy in 1990, however, developing countries would have to take on the largest commitment for CO2 removal. Given this scheme and with the aim of settling the carbon debt over two decades with equal annual efforts, the eight countries with the largest shares of historical emissions would have to take on annual CO2 removal efforts from 1 to 12 Gt CO2. These CO2 removal commitments would imply substantial efforts for many countries but nevertheless depend on the choice of a fairness principle and calculation method to render this operational.
1. Introduction
According to the IPCC, the world will require massive amounts of CO2 removal (CDR) to be able to meet the climate policy goal of the Paris Agreement, which is well below the 2 °C warming from pre-industrial times and pursuing 1.5 °C [1,2]. CO2 and other greenhouse gas (GHG) emissions must be significantly reduced to meet this goal; however, CDR is gaining terrain as an essential complementary climate policy measure. The more slowly global GHG emissions are reduced, the greater the need for CDR to meet the climate policy goal. Reducing GHG emissions is more challenging in some sectors; for example, methane emissions from agriculture and some industrial processes where the development and deployment of more climate-friendly technologies will take time and likely be expensive. Furthermore, in the future, we may enter an ‘overshoot’ situation, where a high atmospheric GHG concentration will decrease the probability of meeting the climate policy goal, or where the GHG concentration approaches a ‘tipping point’ for the climate system. In such cases, further emission reduction is insufficient to meet the climate policy goal and more CDR is necessary [1,2]. From a climate system perspective, CO2 removal will therefore not be equivalent to the reduction in CO2 emissions from fossil fuels and industrial processes.
The basic concept of CDR is to remove CO2 from the atmosphere and store the carbon permanently in another sink, foremost the biosphere (i.e., living or dead biomass), the bedrock (carbon capture and storage (CCS)), or the ocean. There are six main categories of CDR technologies: bioenergy with CCS, biochar, forestation, enhanced weathering (mineralization), direct air capture (DAC), and ocean fertilization [2]. Ocean alkalinity enhancement, habitat restoration (vegetation and ecosystems), and the use of CO2 to produce carbonated building materials can be added to this list.
There is a wide gap between what science indicates about the need for CDR and policy development as well as deployment. One reason for this is that biomass has been considered neutral in terms of CO2 emissions since the climate convention (UNFCCC) was adopted in 1992. Another reason is the focus on GHG emission reduction until the IPCC 1.5 °C report came out in 2018 [2]. As opposed to reducing CO2 emissions, undertaking CDR projects may be seen as a public service since there are rarely direct local benefits, and the projects may even have negative side-effects when scaled up, in addition to the fuzzy politics of a fair handling of the ‘carbon debt’ [3]. Given this background, there is currently no common framework and rules for accounting and approving CDR activities; in addition, formal markets and business incentives for CDR remain absent [4,5,6]. Such rules may be developed under the carbon markets of Article 6 of the Paris Agreement. CDR is not compatible with the EU’s emissions trading system (EU ETS); however, the EU is developing a CDR certificate scheme [7]. Therefore, the further regulation and facilitation of rules and markets by the government is called for. The Paris Agreement focuses on a temperature goal, and there is some uncertainty regarding the equilibrium temperature response to a specific GHG concentration in the atmosphere. Consequently, an interpretation of the climate policy goal in terms of atmospheric concentration instead of temperature would simplify the rules for and accounting of CDR efforts.
However, there has been increasing CDR activity in the voluntary market, whereby companies with ‘net-zero’ or ‘climate neutrality’ goals buy climate credits (CDR credits) to subtract from their GHG emissions, primarily based on forestation and renewable energy projects. Several companies have been established to serve this market by producing and selling CDR credits. Some proprietary standards for CDR projects have also been developed, such as the Verra Verified Carbon Standard (VCS) and Gold Standard (other standards include VOS, CCB, Green-e, and standards in the formal markets, such as the CDM (Clean Development Mechanism), which was included in the Kyoto Protocol, and EUA (allowances under the EU ETS)). The lack of a globally accepted common standard for CDR projects means that quality varies and may be low for some CDR credits, which causes difficulties when making comparisons across projects and credit standards. The activity in the informal market may, however, provide learning opportunities and act as a steppingstone for the integration of CDR into formal carbon markets.
In this study a ‘what if’ analysis (‘experiment’) was performed, where the remaining ‘carbon budget’ for GHG emissions was combined with the estimated CO2 removal over the next decades required to meet the Paris Agreement’s climate policy goal, and each country’s responsibility to undertake CO2 removal was allocated based on their share of past CO2 emissions. From more than three decades of climate policy negotiations, we know that reaching a global agreement on how much GHG mitigation should be carried out and what a fair allocation of the necessary efforts would be is a very complicated challenge. Views on the fairness and burden sharing of climate change mitigation efforts are significantly influenced by national interests, which are related to each country’s level of development, industrial structure, and resource situation [8]. Consequently, when exploring climate policies, there are numerous relevant factors that may receive a high score with respect to fairness and therefore influence the ability to earn broad support in global negotiations. Some examples of such factors are land use changes and related CO2 emissions, GHG emissions from transport and buildings, emissions of GHGs other than CO2, population growth, development level and other economic conditions, energy system, available technologies, and the expected impacts of climate change. However, this study presents a ‘what if’ experiment that focuses on restoring excessive past CO2 emissions by means of CDR efforts, where the burden sharing across countries is based on responsibility, defined as the share of past CO2 emissions. Thus, a broader analysis of fair and feasible climate policies is outside the scope of this study.
The research question of this study is as follows:
- How would commitments for CO2 removal (CDR) be allocated across countries if they were based on responsibility for past CO2 emissions?
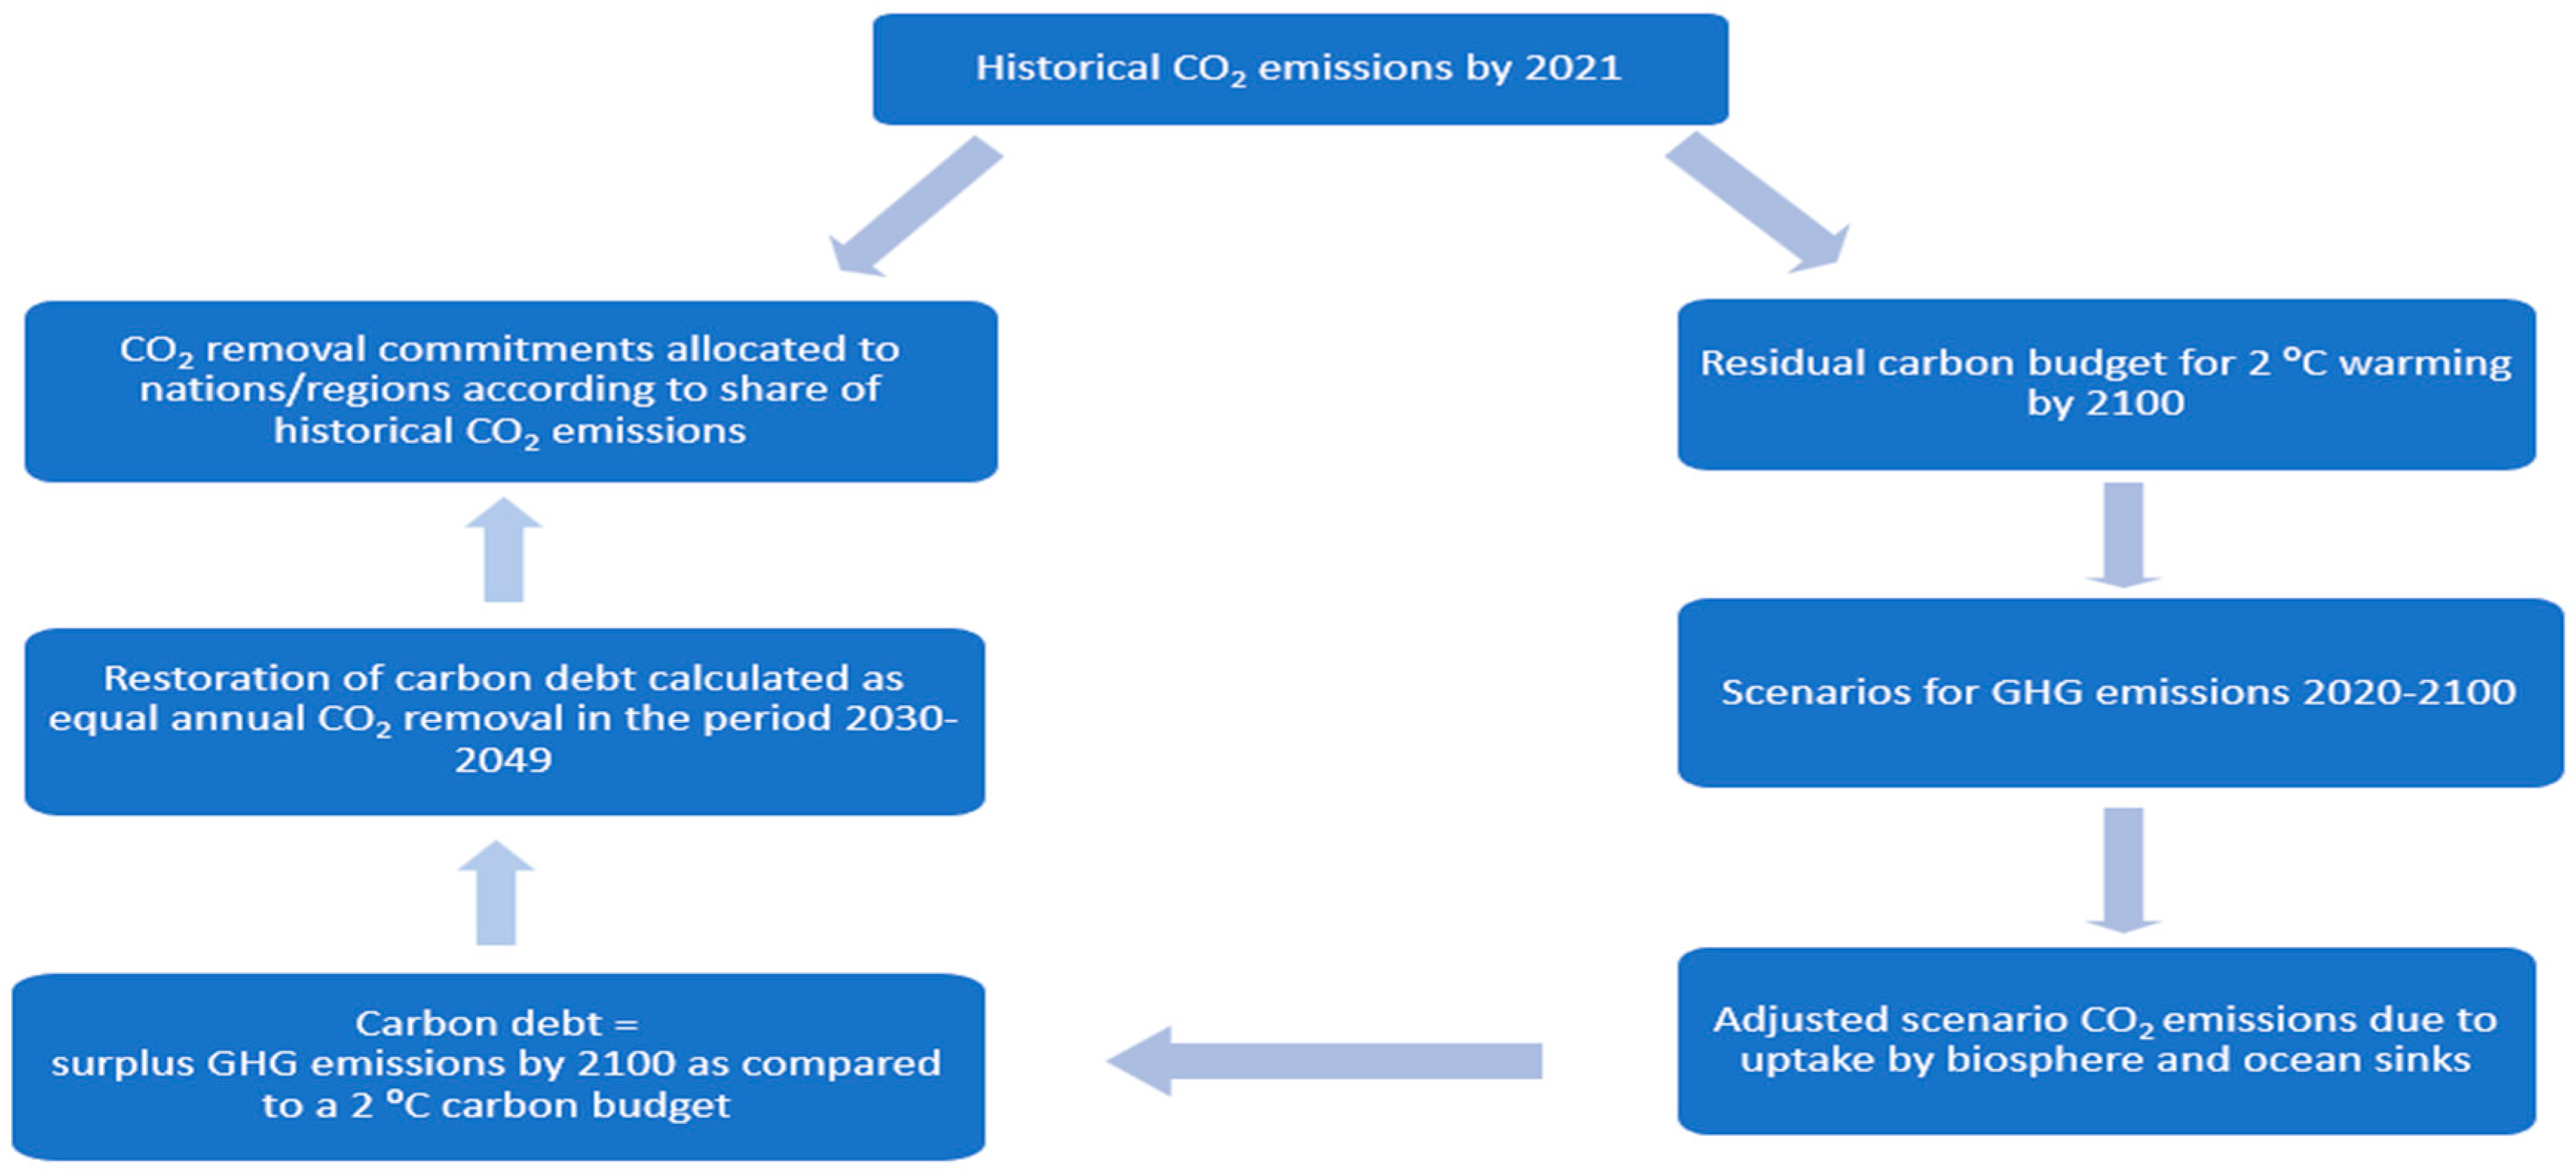
First, the ‘carbon debt’ was defined as the likely ‘surplus’ of CO2 in the atmosphere given historical (cumulative) global emissions until 2020 and adding plausible emissions from 2021 to 2100. The calculation of the carbon debt was based on the current remaining ‘carbon budget’ consistent with 2 °C warming according to the IPCC and subtracting expected GHG emissions until 2100 based on emission scenarios. Next, the allocation of this carbon debt across the major countries and regions of the world was analyzed, building on historical (cumulative) CO2 emissions until the present. Here, historical CO2 emissions act as an interpretation of the fairness principle referred to as ‘polluter pays’ or ‘responsibility’ [9]. The allocation of CO2 removal commitments across nations was emphasized since climate policy fairness is most challenging at the global level, particularly when comparing developing and industrialized countries. The effect of different starting years for calculating historical emissions was also examined [10]. The carbon debt was then allocated to nations and regions as equal annual commitments for CDR over a 20-year period and specified for countries that were found to be responsible for 2% or more of global historical CO2 emissions. Figure 1 shows a schematic representation of the study.
Very few studies exist on the fairness-based allocation of commitments to undertake CDR activities. Honegger (2023) discussed the fair funding of CDR technologies and argued that the ‘polluter pays’ principle may seem appropriate, advocating that a coalition of climate leaders should declare quantitative milestones for the scaling of CO2 removal and storage aligned with their net-zero target years [6]. Honegger et al. (2021) noted a near-universal failure to sufficiently address the policies needed for CDR development and implementation and recommended the following six functions that CDR policy instruments should jointly deliver to be a part of long-term mitigation efforts under the Paris Agreement: provide clarity on the intended role of CDR; accelerate innovation; ensure participation; transition to long-term and cost-effective operation; measure, report, and verify results in a robust manner; and manage side-effects [11]. Pozo et al. (2020) analyzed the allocation of CDR quotas from recent integrated assessment model (IAM) projections of required historical CDR volumes until 2100—aligned with a 1.5 °C goal and based on the fairness principles ‘responsibility’, ‘capability’ (‘ability to pay’), and ‘equality’ (equal per capita emissions)—first in a global setting and then in a more detailed analysis of countries in the EU [12]. The historical emissions accounted for CO2 only and were calculated from 1850 onwards. The quotas varied substantially across the fairness principles, and the variation in biophysical conditions for CDR across EU countries meant that only four EU countries could meet their CDR quotas on an individual basis (in the ‘responsibility’ case), indicating a strong need for collaboration across countries. Fyson et al. (2020) used an IAM to compare the fairness-based allocation of CDR among regions and countries according to ‘responsibility’ (in terms of per capita cumulative GHG emissions) or ‘ability to pay’ (interpreted as gross domestic product (GDP) per capita) [3]. The global carbon debt to be allocated was calculated based on historical emissions since 1990, adding nationally determined contributions (NDCs) under the Paris Agreement and current policy projections from the Climate Action Tracker (CAT) until 2030. The authors found that the equity-based ‘burden-sharing’ of CDR commitments across countries and regions is very different from least-cost approaches, as typically calculated by IAM models.
The work of Fyson et al. (2020) shares some similarities with my study, but the two differ in terms of the cumulative GHG emissions database used; the use of person-based (per capita) responsibility for cumulative GHG emissions (as compared to nationally or regionally based responsibility for CO2 emissions); the calculation of the allowable ‘carbon budget’ in the IAM model (as compared to the IPCC (2021) and Carbon Action Tracker (CAT) data up until 2100 used in this study); and the use of 1990 as the starting year (as opposed to four different starting years, including 1990) [13]. This study focused more on the responsibility principle as well as the effect of using different starting years when calculating the ‘CDR burden’ and how this will transfer to annual CDR commitments until 2050. This study contributes to the literature by using historical CO2 emissions from four starting years (between the industrial era in 1750 and when climate change entered the global scene in 1990) and scenarios for future GHG emissions to calculate a ‘carbon debt’, i.e., surplus CO2 in the atmosphere, under a 2 °C carbon budget. The commitments for CDR across nations are aimed at restoring the carbon debt over a twenty-year period, such that CDR efforts from the mid-century can focus on subsequent hard-to-mitigate GHG emissions and the avoidance of possible ‘tipping points’ related to atmospheric concentration.
2. CDR Needs and Challenges
2.1. Need for CDR
IPCC reports show that meeting the climate goal of the Paris Agreement will be impossible without rapid and considerable reductions in GHG emissions, as well as the deployment of sizable CDR volumes [1,2]. The slower the mitigation of GHG emissions, the greater the reliance on CDR. The world may end up in an ‘overshoot’ situation by 2100, whereby global warming is higher than 2 °C when compared to the pre-industrial temperature. Meeting the 2 °C goal would then not only require net-zero emissions year-by-year from, for example, 2050 to 2100, but also enhanced CDR efforts to reduce the atmospheric concentration of CO2 (and other relevant GHGs) from past emissions to a level consistent with this climate goal.
Parties to the Paris Agreement submit their NDCs at regular intervals. By 2020, 126 countries accounting for over 50% of global GHG emissions had considered or announced net-zero goals; however, the vast majority of NDCs neither relate their contribution to a carbon budget (i.e., net historical emissions) nor specify the relative contribution expected from emission reduction compared to CDR [11].
With a focus on CO2 emissions, climate change mitigation measures can be divided into three categories: (1) avoided carbon dioxide emissions through the decreased use of fossil fuels due to increased energy efficiency, more renewable energy, carbon-free industrial processes, and reductions in land use changes that release carbon dioxide; (2) reduced carbon dioxide emissions with the help of carbon capture and storage (CCS); (3) the removal of carbon dioxide from the atmosphere with the help of measures such as forestation and other land use changes that increase carbon storage in vegetation and soil, bioenergy combined with CCS, biochar added to soil, and direct air capture (DAC). From an efficiency perspective, countries and companies should carry out climate mitigation efforts across these three categories according to the mitigation effect relative to cost.
Avoided and reduced CO2 emissions are not equivalent to the removal of CO2 due to the dynamics of the global carbon cycle, which generate a ‘rebound’ effect [14] (in addition, IPCC (2021) mentions that about 40% of anthropogenic CO2 emissions are absorbed by the ocean and terrestrial sinks.). More CO2 must be removed with the help of CDR as compared to avoided or reduced emissions. This rebound effect can be understood as the decreased absorption of CO2 from the atmosphere by the ocean and the biosphere when the atmospheric concentration is reduced at the margin. If the CDR removal efficiency given the rebound effect is 70%, achieving a net effect of one tonne CO2 less in the atmosphere would require the removal of 1.43 tonnes of CO2. The effect of this carbon cycle rebound in addition to possible unwanted effects from a broader sustainability perspective, such as reduced biodiversity, as well as energy, GHG, and energy efficiency aspects in a life cycle and upstream/downstream context, make the accounting of the climate and sustainability effects of CDR challenging [4] (these broader efficiency aspects could also be associated with Scope 2 (energy use) and Scope 3 (upstream and downstream value chains) GHG emissions. Scope 1 refers to the direct GHG emissions from an activity).
2.2. Lifecycle and Permanency Considerations
Some countries have adopted ‘net-zero’ or ‘climate neutrality’ goals for 2030 or 2050, where CDR deployment is assumed given some time and scale. The IPCC (2022) refers to ‘climate neutrality’ related to anthropogenic emissions and removals within and beyond the direct control or territorial responsibility of a country (or another reporting entity), whereas net-zero emissions are limited to emissions and removals that are under the direct control or territorial responsibility of a country (or another reporting entity) [1]. Likewise, the term carbon neutrality only refers to carbon dioxide and not to other GHGs. The term climate neutrality is rarely used by the IPCC since the concept is diffuse and used differently by different communities, in addition to it being challenging to quantify. On a global scale, climate neutrality is equal to net-zero.
Ideally, CDR efforts should lead to a permanent reduction in atmospheric CO2 concentration; however, this will be challenging with many CDR technologies. The risk for decreased CO2 removal effects over time is the highest for so-called nature-based alternatives, such as reforestation and afforestation, due to their dependency on land use and the long-term storage of carbon in trees and other vegetation categories with a limited lifetime. In addition, there is a risk of wildfire and other incidences that release CO2. The risk of decreased CO2 removal effects over time is lower for so-called technology-based methods, such as bioenergy with CCS and DAC; however, this risk is not eliminated since both technologies rely on the geological storage of CO2, where there is a non-zero but likely very small leakage risk [15].
2.3. Value and Market Development
Given the lack of formal rules and accounting of CDR activities, as well as the historical absence of linkages to formal climate policy instruments, such as emissions trading, it is no surprise that current CDR activity is low and dominated by the voluntary market. There is a large gap between the need for CDR and policy development to facilitate CDR [5]. Regarding formal markets, the most recent development is the EU’s proposal for CDR certificates [7]. The voluntary market provides interesting learning opportunities, but sizeable upscaling requires mainstreaming CDR into formal climate policy schemes, such as the EU ETS and Art. 6 (on carbon markets) of the Paris Agreement. In addition, policy tools, value creation, business models, and market development are required to incentivize CDR efforts for businesses. Governments must develop an enabling framework for CDR with economic and regulative stimulants and some direct support for technology development, pilot testing, and initial full-scale deployment. The carbon cycle rebound effect and the different roles of CO2 emission avoidance and reduction as compared to CDR in a GHG atmospheric overshoot situation are arguments for the different pricing of the two climate policy options [4]. According to the literature, the CDR instrument toolbox includes linking to emissions trading systems; establishing a separate CDR market; public procurement with reverse auctions; guaranteed prices; contracts of differences; CDR certification; tax credits (e.g., subtracted from carbon tax); requirements to use CDR (with user payment, e.g., increased waste fee for biogenic waste incineration); and a deposit-refund system for CO2 [16,17].
3. Fairness Principles for CDR
Fairness is an essential part of allocating commitments for restoring ‘carbon debt’, especially at a global scale. However, when compared to the allocation of CDR efforts across countries to minimize total cost, fairness leads to very different allocations [3]. Fairness can be analyzed at three levels: fairness principles, equity formulas or rules, and indicators [9]. The three most popular fairness principles are ‘polluter pays’ (‘responsibility’, commonly interpreted as historical or cumulative emissions at the national or per capita level); ‘capability’ (or ‘ability to pay’, often interpreted as GDP per capita); and ‘equality’ (often interpreted as equal per capita emissions from some future year). However, the blending of these principles is possible [18].
In line with the national focus of NDCs in the Paris Agreement, the focal point of this study was the sharing of the carbon burden across countries (and some regions). This implies that burden sharing is based on historical CO2 emissions at the national level; however, these emissions were not adjusted according to population size (per capita). Only CO2 emissions from fossil fuel use and industry were included, not CO2 released from land use changes due to the significant uncertainty associated with land use CO2 emission data. However, land-use-related CO2 emissions were included in the study by Fyson et al. (2020) [3]. Given the focus on CDR, the historical emissions of other GHGs such as methane were left out. The fairness principle of ‘responsibility’—interpreted as historical CO2 emissions—was chosen due to its close relation to ‘carbon debt’ and CDR; it is in good alignment with the carbon budget and the concept of a ‘carbon debt’ that has to be restored. The ‘ability to pay’ principle is more associated with economics and the cost dimension, whereas ‘equality’ directs more attention to future obligations than responsibility. Fyson et al. (2020) included the ‘responsibility’ and ‘capability’ fairness principles in their study [3], whereas Pozo et al. (2020) allocated CDR quotas according to all the fairness principles (‘responsibility’, ‘ability to pay’, and ‘equality’) [12].
4. Materials and Methods
4.1. Calculation of CDR Responsibilities
With the focus on carbon debt and responsibility, we limit our attention to historical CO2 emissions from fossil fuel use and industry and omit other GHG emissions. This choice is also motivated by the availability of data on historical emissions, where, for instance, CO2 emissions related to land use changes are scarcer and more uncertain than energy- and industry-related data. With this approach, the starting year for calculating emissions becomes important since industrialized countries have dominated global emissions up until the last 30-year period. As an example, China’s share of global emissions has grown strongly since 2000. One alternative is to start with the industrial era, in 1750; other alternatives are 1900, the end of World War 2 (1945), and the time when human-made climate change entered the global political scene (1990) (The United Nations’ Framework Convention on Climate Change (UNFCCC) was negotiated in the period 1990–1992 and adopted in Rio de Janeiro in 1992). The analysis contains these four starting years to illustrate the effect of the changing pattern of emission shares globally, which is of particular interest from a fairness perspective. In addition, the analysis is carried out at the country level and does not examine how the obligations for CDR could be transferred to business and companies at a national level.
Since the responsibilities for covering the carbon debt through CDR are based on past emissions until the present (2021), it will be possible to update the calculations later, for instance, before the start of CDR deployment to restore the carbon debt (2030 in this study) or even later if the carbon budget for 2 °C is updated or a revised climate policy goal is adopted, or if it turns out that the CDR volumes generated are not sufficient to cover the carbon debt such that an updated CDR scheme is called for.
4.2. Data on Historical Emissions
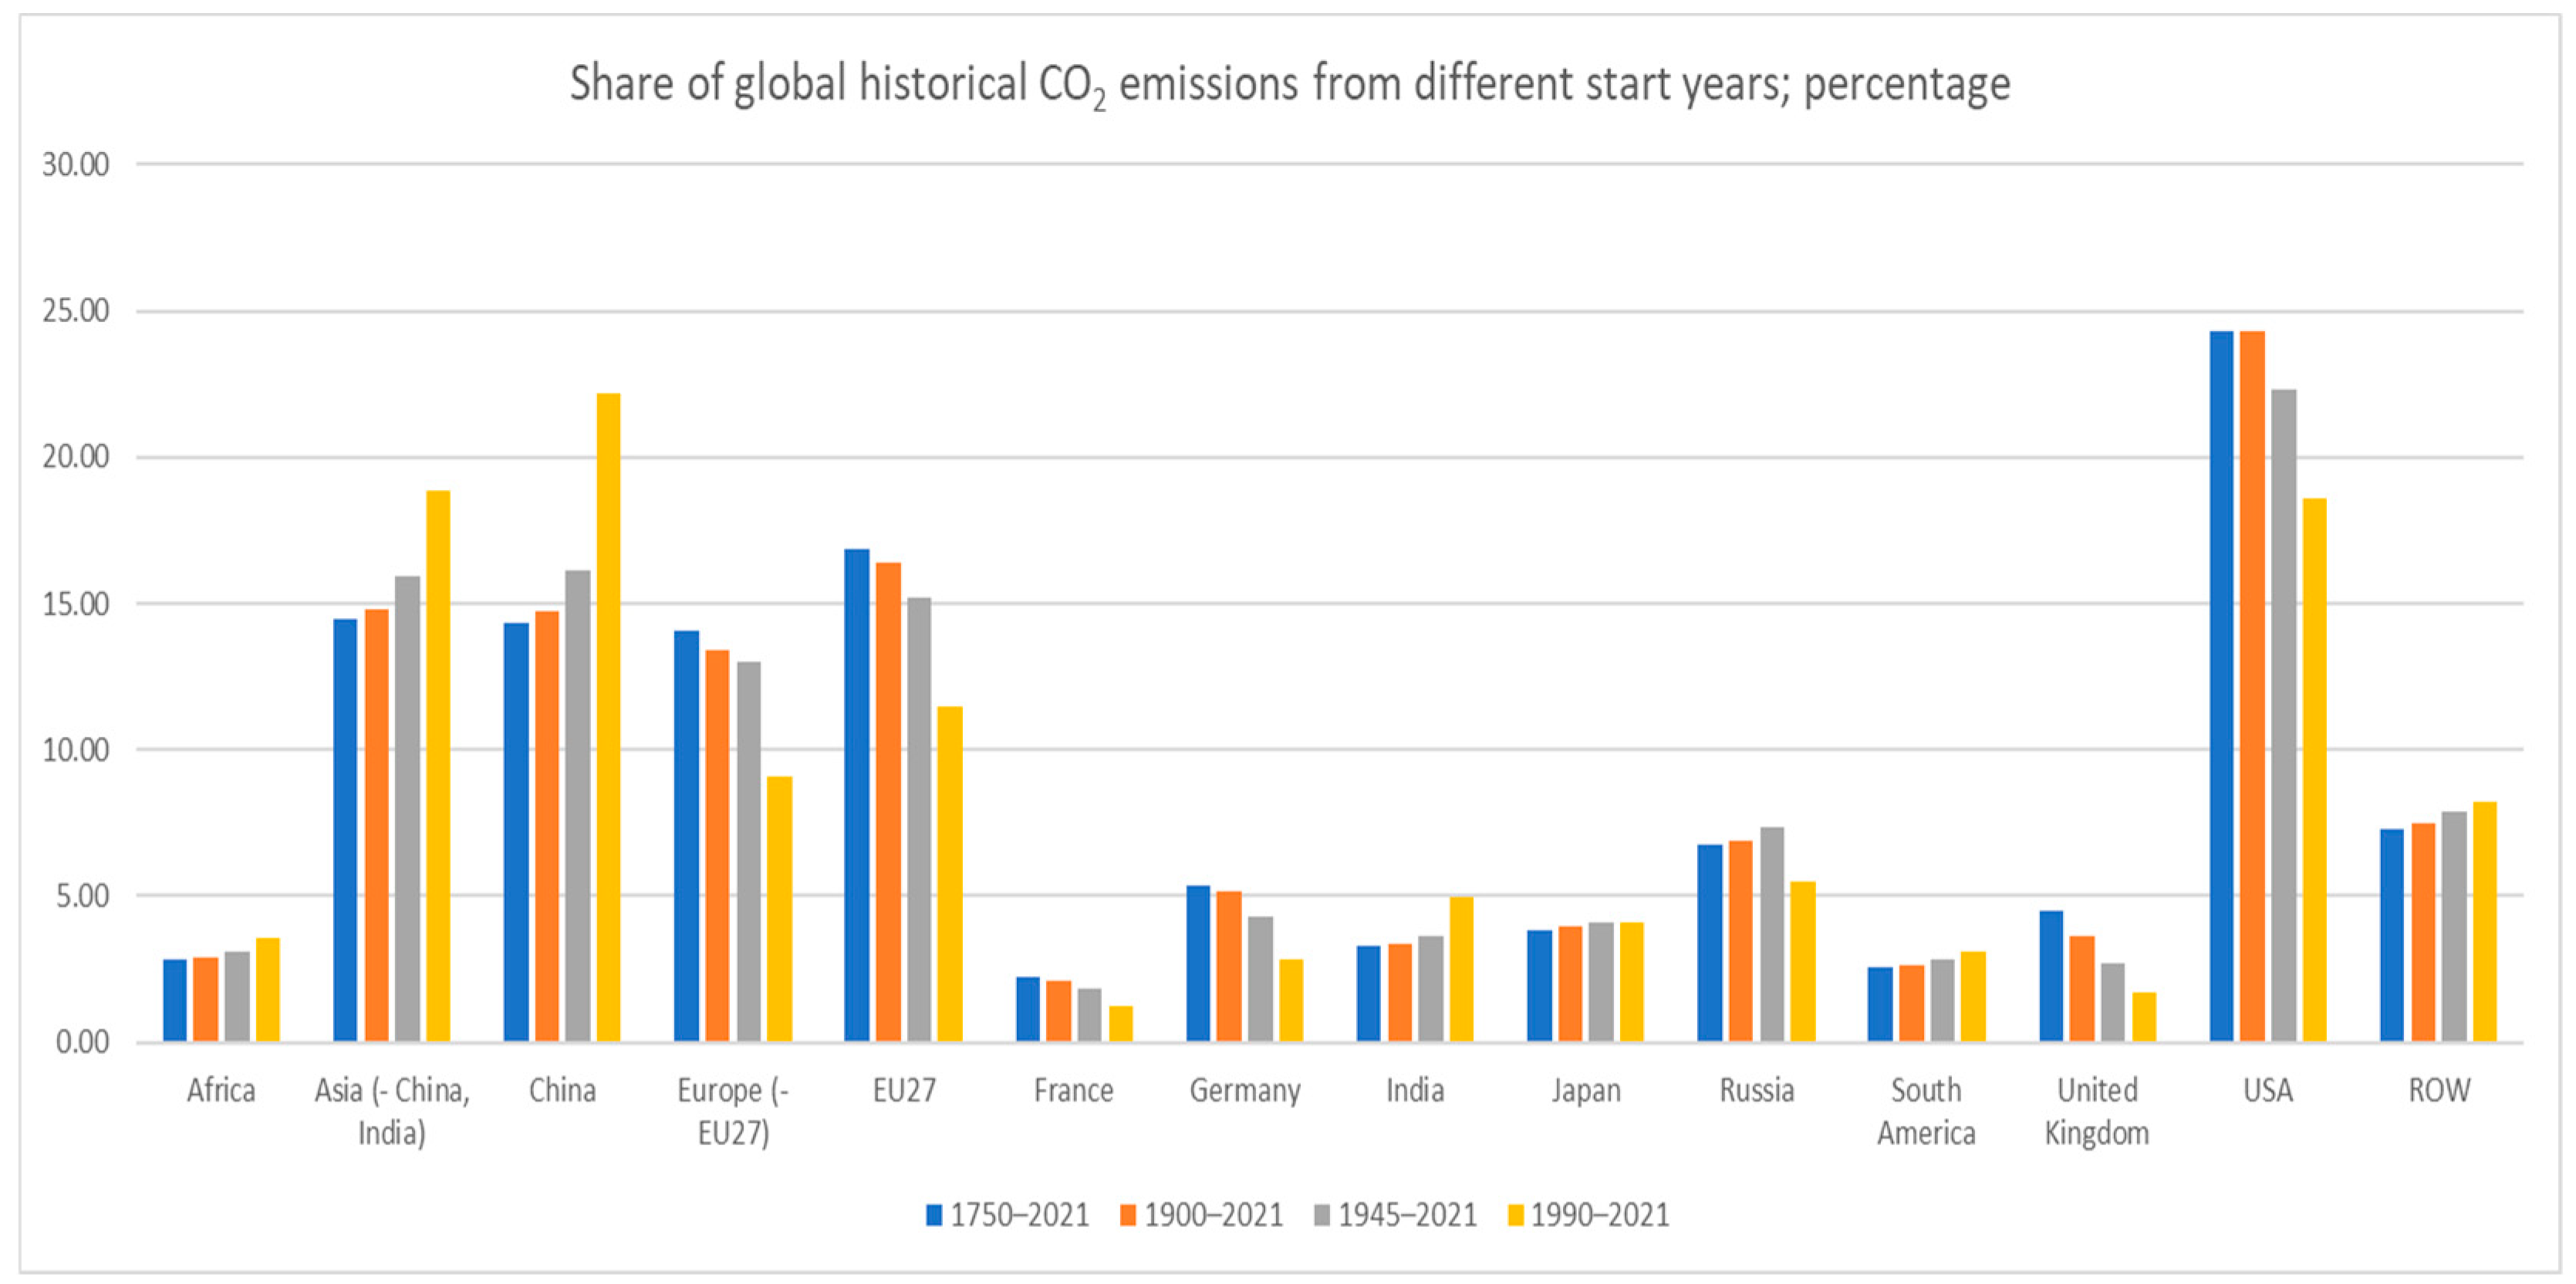
The time series data on country and regional CO2 emissions measured as Giga tonnes (Gt) of CO2 are from Ritchie et al. (2020) [19], which builds on Global Carbon Project (2023) data and provides records from 1750 to 2021 [20]. The historical (cumulative) CO2 emissions included are production-based, which means emissions from fossil fuel use and industry (cement), whereas trade-related emissions (i.e., consumption) and emissions from international transport and land use changes are not included. The shares of historical CO2 emissions for each country or region depend on when we start counting the emissions [10]. Countries and regions that have a 2% or larger share of historical emissions globally are specified, while the remaining countries are included in rest of world (ROW). The starting years include 1750, 1900, 1945, and 1990, see Figure 2. For most of the periods considered, the USA has had the largest share of historical CO2 emissions. However, this share has declined over time, and China has surpassed the USA in the most recent period (1990–2021). China was responsible for around 15% of global emissions before a steep increase in 1990. Asia (without China and India) shows a similar trend to China, but with less growth after 1990. India has a share around 3%, with a small increase in the most recent period. EU-27 and the rest of Europe were each responsible for around 15% of global emissions, but their shares have declined to around 10%. Germany, France, and the UK have also reduced their shares significantly, whereas only small changes are observed for Africa, Japan, and ROW. Russia shows a decline from 7% to 5%.
4.3. Data on Emission Projections
The projections for GHG emissions from 2022 until 2100 are based on Climate Action Tracker (CAT) data (2023) and the ‘2030 targets only’ (medium version leading to 2.4 °C warming by 2100) and ‘pledges and targets’ (upper end version leading to 2.5 °C warming by 2100) scenarios. The ‘pledges and targets’ scenario builds on the ‘2030 targets only’ scenario by adding the expected effects of the pledges submitted as NDCs. Taken together, this implies that we could be in an ‘overshoot’ situation by 2100, leading to around 2.5 °C warming (noting that the upper end of the Paris Agreement goal is 2 °C). These assumptions frame the calculation of the carbon debt.
5. Results and Discussion
5.1. Carbon Debt and Responsibilities
To calculate the carbon debt according to our scheme, we must add the (residual) carbon budget from 2022 onwards aligned with the 2 °C climate goal. Historical CO2 emissions from 1750 to the present are at 1737 Gt CO2 at the global level, as shown in the second column of Table 1 [19]. From the IPCC (2021), we find a carbon budget of 1150 Gt CO2 from 2020 till 2100 (which will meet the 2 °C goal at a confidence level of 67%), as shown in the third column of Table 1 [13]. The fourth column of Table 1 shows the projected emissions until 2100 [21] (according to the IPCC (2022) [1], the expected CO2 share of future GHG emissions is at 75%). The estimation of the carbon budget is based on the workings of the biogeochemical cycle, where CO2 adsorption by the ocean and biosphere is accounted for. Furthermore, we assume that the ocean and biosphere carbon sinks absorb 40% of future CO2 emissions, which reduces the carbon debt [13].
By 2100, surplus CO2 in the atmosphere can be calculated from the emissions in the ‘2030 target only’ (i.e., NDC targets by 2030) and the ‘pledges and targets’ (NDC 2030 targets plus submitted and binding long-term targets) scenarios, adjusted for the CO2 uptake by the ocean and biosphere sinks, minus the carbon budget. These scenarios are based on the emissions of all GHGs. Accordingly, our carbon debt includes all GHGs from the present until 2100. The carbon debt is calculated at 995 Gt CO2 for the first scenario and 500 Gt CO2 for the latter scenario, as shown in Table 1. Over a twenty-year period of equal annual restoration, this translates to 50 and 25 Gt CO2, respectively. For the following calculations of CDR responsibility, we will use the 50 Gt CO2 debt case as an example (‘2030 targets only’ scenario). The ‘pledges and targets’ case implies the same relative sharing of the CDR burden across countries, but with half the volumes. Finally, the CDR share is allocated to countries and regions according to responsibility, interpreted as their share of historical CO2 emissions.
5.2. Time Span for CO2 Removal
To reduce the risk of overshooting the carbon budget and possibly reaching a tipping point in the climate system due to a high atmospheric concentration of GHGs, we assume that CDR activities will settle the carbon debt over the next two decades, 2030–2049, as outlined in the last column of Table 1. The delayed start is motivated by a lack of CDR deployment at the present; therefore, the need for a significant upscaling of CO2 removal investments and deployment is clear. This requires the further development of CDR rules, technologies, and markets. The CAT scenarios assume substantial efforts to reduce GHG emissions during the remaining decades of this century and may also include sizable CDR efforts. If the aggregated net emissions of GHGs are larger than assumed in the scenarios due to insufficient climate policies or changes in external conditions, keeping the carbon budget will require additional efforts to reduce emissions and/or increase investments in CDR.
5.3. Commitments for CO2 Removal
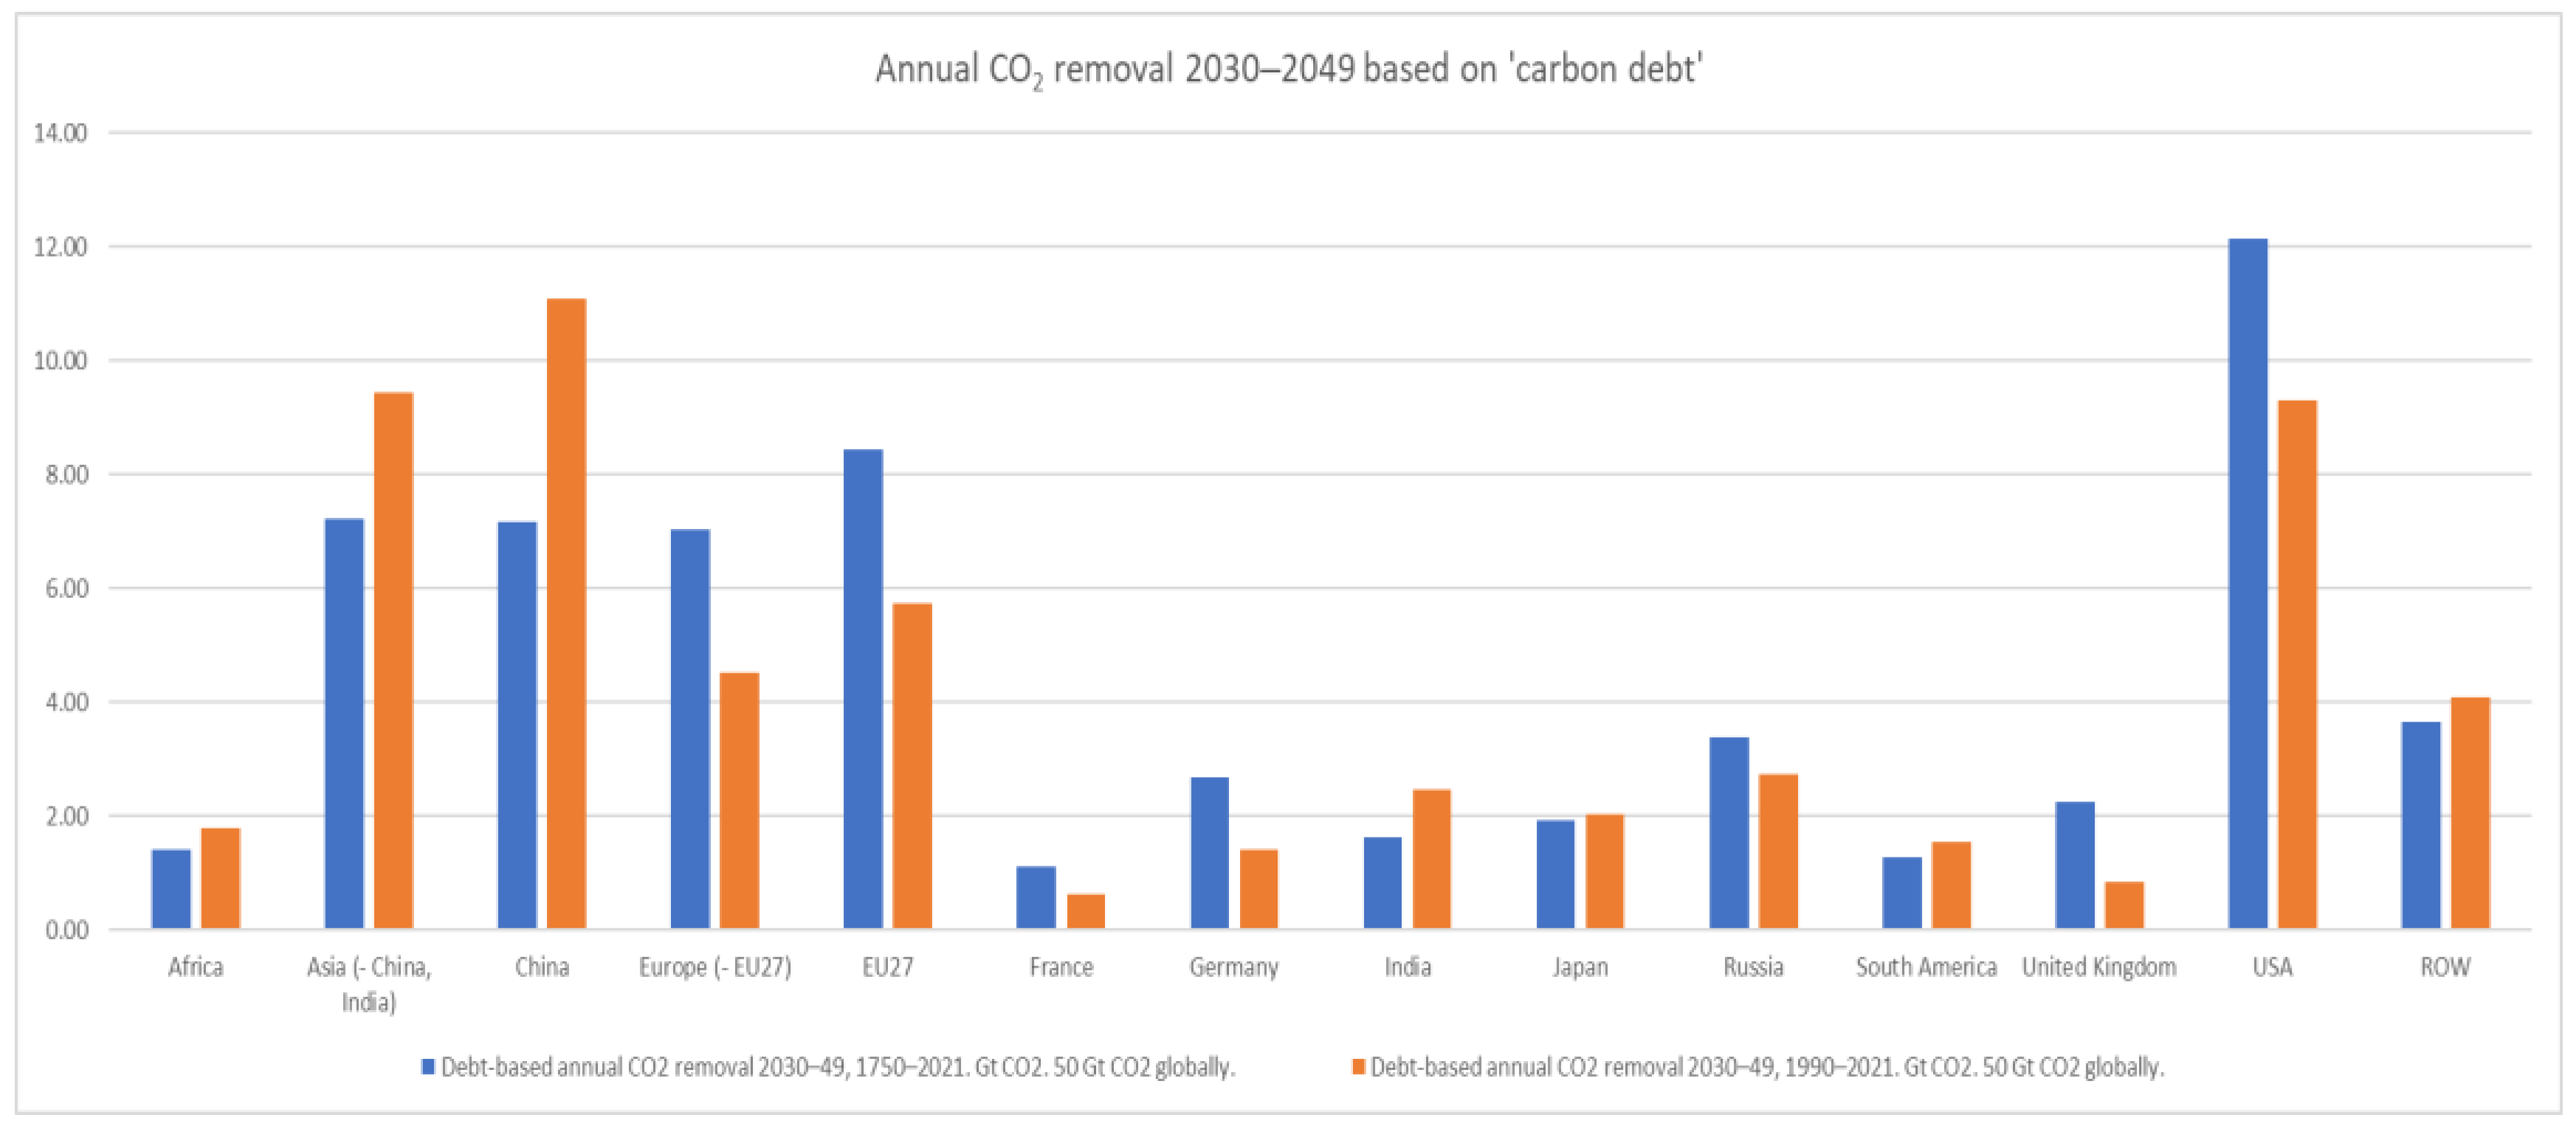
Based on this scheme, Figure 3 shows the commitments of countries and regions to accomplish CO2 removal. The commitments to CO2 removal are shown as annual removal in Gt CO2 required for the period from 2030 to 2049 to correct the carbon debt. The effect of choosing different starting years is illustrated by showing the contrast between the longest period, 1750–2021, and the shortest period, 1990–2021.
Comparing the responsibility periods 1750–2021 and 1990–2021, the general trend is that industrialized countries will have a lower commitment when choosing the newest period, whereas developing countries will have a larger commitment. This is a consequence of industrialized countries’ dominance in terms of industry production and fossil fuel use until quite recently: the last two or three decades. As expected, the USA would need to take on the largest commitment to remove CO2, at 12 Gt annually for the 1750–2021 period and 9 Gt CO2 for the 1990–2021 period. These volumes are very large compared to global GHG emissions from fossil fuels and industry for 2021, at 37 Gt for CO2 only and 55 Gt CO2 for all GHG accounted as CO2 [19]. China’s commitment increases from 7 to 11 Gt CO2 moving from the first to second of these periods, surpassing the USA in the latter period. Asia (minus China and India) increases from 7 to 9 Gt CO2 over the two periods. India’s commitment is around 2 Gt CO2, with a small increase for the newest period, whereas Japan’s commitment is stable at 2 Gt CO2. Africa’s commitment increases from around 1 to 2 Gt CO2. EU27’s and the rest of Europe’s shares are at 7–8 Gt CO2 for the first period and fall to around 5–6 Gt CO2 for the second period, although with larger reduction for EU27 than for the rest of Europe. The strong reduction in commitments for European countries is also illustrated by Germany, France, and the UK, where the commitments are about halved. Russia’s commitment is around 3 Gt CO2, although somewhat reduced in the second period.
Different calculations of the carbon debt, such as those with varying assumptions about the restoration period, emission scenarios, and potential overshot volume, would give different global volumes for CDR but the same relative allocation of commitments across countries and regions. Therefore, the example analyzed in this study foremost illustrates how responsibility for historical CO2 emissions translates into relative commitments for countries and regions to undertake CO2 removal.
This study was only based on the responsibility (equality) fairness principle, which means that other fairness principles could yield different outcomes. However, studies comparing the burden sharing effects of different fairness principles indicate that ‘ability to pay’ and ‘equality’ largely imply the same bigger share of industrialized countries when compared to developing countries, like ‘responsibility’ [18].
6. Conclusions
In this study, the consequences of allocating commitments for CO2 removal to countries according to their responsibility for human-made climate change were explored. If countries should agree on responsibility in terms of past (also referred to as historical or cumulative) emissions as the most relevant fairness principle to allocate the carbon debt globally, this study shows how such a scheme would play out in terms of annual commitments for CO2 removal over the next two decades. The need for CO2 removal over the next few decades is founded on restoring a carbon debt, which depends on the remaining carbon budget for a maximum of 2 °C warming beyond the pre-industrial level by 2100. Future emissions are based on a scenario that includes the 2030 climate targets of countries, and these emissions are subtracted from the carbon budget.
There is no consensus on when the calculation of historical emissions should start even if a responsibility-based scheme for climate change mitigation should obtain broad support; thus, the effect of different start years was compared in this work. The selection of the start year when calculating cumulative CO2 emissions has an important effect on the allocation of commitments across countries, especially when comparing the burden sharing between industrialized and developing countries. The results show that industrialized countries would need to take on the largest commitments for CO2 removal if 1750 is used as the start year for calculating historical CO2 emissions. If 1990 is instead chosen as the start year for historical emissions, developing countries would have to take on a larger share for CO2 removal than industrialized countries. This is exemplified by the recent large increase in emission shares by Asia, especially China, as compared to the reduced emission shares of European countries and the USA. Implementing this burden-sharing scheme over a twenty-year period, the eight countries with the largest shares of historical emissions would have to take on a CO2 removal effort between 1 and 12 Gt CO2 annually.
This study illuminates the consequences of choosing one way to allocate the responsibility for CO2 removal across countries. However, other schemes are possible. These include adding cumulative CO2 emissions from other sectors, such as land use changes, as well as adding other GHG, foremost methane, given the availability of data. Other fairness principles and equity rules as well as their combinations could have been chosen. In addition, the carbon debt can be calculated based on other assumptions; however, the relative allocation across countries will remain the same if the same responsibility-based allocation of CO2 removal commitments is selected. Expressing CO2 removal commitments at a per capita basis, however, would enlighten the comparison between large and small countries. Further research could explore the consequences of burden sharing when using alternative fairness principles, such as GDP per capita at the country level or equal per capita emissions. Future studies could also use historical emissions at the national (or EU) level to allocate commitments for CO2 removal to sectors or companies, depending on available data.
Funding
This research was funded by the Research Council of Norway’s project 295789—PLATON—a platform for open and nationally accessible climate policy knowledge.
Data Availability Statement
Conflicts of Interest
The author declares no conflict of interest.
References
- IPCC. Climate Change 2022: Mitigation of Climate Change, WGIII, Summary for Policymakers. 2022. Available online: https://www.ipcc.ch/report/ar6/wg3/downloads/report/IPCC_AR6_WGIII_SummaryForPolicymakers.pdf (accessed on 30 March 2023).
- IPCC. Special Report on Global Warming of 1.5 °C. 2018. Available online: https://www.ipcc.ch/sr15/ (accessed on 30 March 2023).
- Fyson, C.L.; Baur, S.; Gidden, M.; Scheussner, C.-F. Fair-share carbon dioxide removal increases major emitter responsibility. Nat. Clim. Chang. 2020, 10, 836–841. [Google Scholar] [CrossRef]
- Torvanger, A. Governance of bioenergy with carbon capture and storage (BECCS): Accounting, rewarding and the Paris agreement. Clim. Policy 2019, 19, 329–341. [Google Scholar] [CrossRef]
- Schenuit, F.; Colvin, R.; Fridahl, M.; McMullin, B.; Reisinger, A.; Sanchez, D.; Smith, S.M.; Torvanger, A.; Wreford, A.; Geden, O. Carbon Dioxide Removal policy in the making: Assessing developments in 9 OECD cases. Front. Clim. 2021, 3, 638805. [Google Scholar] [CrossRef]
- Honegger, M. Toward the effective and fair funding of CO2 removal technologies. Nat. Commun. 2023, 14, 534. [Google Scholar] [CrossRef] [PubMed]
- European Parliament. A Union Certification Framework for Carbon Removals. Briefing, EU Legislation in Progress. 2023. Available online: https://www.europarl.europa.eu/RegData/etudes/BRIE/2023/739312/EPRS_BRI(2023)739312_EN.pdf (accessed on 30 March 2023).
- Brick, K.; Vissner, M. What is fair? An experimental guide to climate negotiations. Eur. Econ. Rev. 2015, 74, 79–95. [Google Scholar] [CrossRef]
- Ringius, L.; Torvanger, A.; Underdal, A. Burden sharing in international climate policy: Principles of fairness in theory and practice. Int. Environ. Agreem. Polit. Law Econ. 2002, 2, 1–22. [Google Scholar]
- Rive, N.; Torvanger, A.; Fuglestvedt, J. Climate agreements based on responsibility for global warming: Periodic updating, policy choices, and regional costs. Glob. Environ. Chang. 2006, 16, 182–194. [Google Scholar] [CrossRef]
- Honegger, M.; Poralla, M.; Michaelowa, A.; Ahonen, H.-M. Who is paying for carbon dioxide removal? Designing policy instruments for mobilizing negative emissions technologies. Front. Clim. 2021, 3, 672996. [Google Scholar] [CrossRef]
- Pozo, C.; Galán-Martín, Á.; Reiner, D.M.; Dowell, N.M.; Guillén-Gosálbez, G. Equity in allocating carbon dioxide removal quotas. Nat. Clim. Chang. 2020, 10, 640–646. [Google Scholar] [CrossRef]
- IPCC. Climate Change 2021: The Physical Science Basis, WG1, Summary for Policymakers. 2021. Available online: https://reliefweb.int/report/world/climate-change-2021-physical-science-basis?gclid=CjwKCAiA3pugBhAwEiwAWFzwdTo0cbAc4ha53Sgp_d0vkhu6GR_3WeuAry7MTRP8GAWjyIWJIIm_vxoCkjIQAvD_BwE (accessed on 25 February 2023).
- Jones, C.D.; Ciais, P.; Davis, S.J.; Friedlingstein, P.; Gasser, T.; Peters, G.P.; Rogelj, J.; van Vuuren, D.P.; Canadell, J.G.; Cowie, A.; et al. Simulating the Earth system response to negative emissions. Environ. Res. Lett. 2016, 11, 095012. [Google Scholar] [CrossRef]
- Deng, H.; Bielicki, J.M.; Oppenheimer, M.; Fitts, J.P.; Peters, C.A. Leakage risks of geologic CO2 storage and the impacts on the global energy system and climate change mitigation. Clim. Chang. 2017, 144, 151–163. [Google Scholar] [CrossRef]
- IPCC. Climate Change 2022: Mitigation of Climate Change, WGIII. 2022. Available online: https://www.ipcc.ch/report/ar6/wg3/ (accessed on 30 March 2023).
- Torvanger, A. Business models for negative emissions from waste-to-energy plants. Front. Clim. 2021, 3, 709891. [Google Scholar] [CrossRef]
- Ringius, L.; Torvanger, A.; Holtsmark, B. Can multi-criteria rules fairly distribute climate burdens?—OECD results from three burden sharing rules. Energy Policy 1998, 26, 777–793. [Google Scholar] [CrossRef]
- Ritchie, H.; Roser, M.; Rosado, P. CO2 and Greenhouse Gas Emissions, OurWorldInData.org. 2020. Available online: https://ourworldindata.org/co2-and-greenhouse-gas-emissions (accessed on 20 February 2023).
- Global Carbon Project. Global Carbon Atlas. 2023. Available online: http://www.globalcarbonatlas.org/en/content/welcome-carbon-atlas (accessed on 20 February 2023).
- Climate Action Tracker (CAT). The CAT Thermometer Explained. 2023. Available online: https://climateactiontracker.org/global/cat-thermometer/ (accessed on 20 February 2023).
Figure 1.
Schematic representation of the study. Historical emissions of CO2 are a basis for calculating the residual carbon budget for 2 °C warming by 2100 as well as the ‘carbon debt’ and are applied to allocate CO2 removal commitments across nations and regions.
Figure 1.
Schematic representation of the study. Historical emissions of CO2 are a basis for calculating the residual carbon budget for 2 °C warming by 2100 as well as the ‘carbon debt’ and are applied to allocate CO2 removal commitments across nations and regions.

Figure 2.
Share of historical CO2 emissions from energy and industry across countries and regions with a 2% or larger share for different starting years. ROW—rest of world. Percentage.
Figure 2.
Share of historical CO2 emissions from energy and industry across countries and regions with a 2% or larger share for different starting years. ROW—rest of world. Percentage.

Figure 3.
Responsibility of countries and regions to undertake CO2 removal in the period 2030–2049 according to historical CO2 emissions until 2021, starting from 1750 and 1990. Annual removal in Gt CO2.
Figure 3.
Responsibility of countries and regions to undertake CO2 removal in the period 2030–2049 according to historical CO2 emissions until 2021, starting from 1750 and 1990. Annual removal in Gt CO2.


Table 1.
Historical global CO2 emissions, projected GHG emissions until 2100, and the calculation of the carbon debt to be restored with the help of CDR. CAT—Climate Action Tracker. Gt CO2.
Table 1.
Historical global CO2 emissions, projected GHG emissions until 2100, and the calculation of the carbon debt to be restored with the help of CDR. CAT—Climate Action Tracker. Gt CO2.
| CAT GHG Emission Scenario | Historical CO2 Emissions 1750–2021 | Carbon Budget 2020–2100 for 2 °C (67%) | CAT GHG Emissions 2020–2100 | Carbon Debt with 40% Ocean and Terrestrial CO2 Uptake; Compensating for all CAT GHG Emissions 2020–2100. | Carbon Debt Restored through Equal Annual Commitments 2030–2049 |
|---|---|---|---|---|---|
| 2030 targets only | 1737 | 1150 | 3064 | 995 | 50 |
| Pledges and targets | 2357 | 500 | 25 |
Disclaimer/Publisher’s Note: The statements, opinions and data contained in all publications are solely those of the individual author(s) and contributor(s) and not of MDPI and/or the editor(s). MDPI and/or the editor(s) disclaim responsibility for any injury to people or property resulting from any ideas, methods, instructions or products referred to in the content. |
© 2023 by the author. Licensee MDPI, Basel, Switzerland. This article is an open access article distributed under the terms and conditions of the Creative Commons Attribution (CC BY) license (https://creativecommons.org/licenses/by/4.0/).
Share and Cite
MDPI and ACS Style
Torvanger, A. What If Country Commitments for CO2 Removal Were Based on Responsibility for Historical Emissions? Energies 2023, 16, 4350. https://doi.org/10.3390/en16114350
AMA Style
Torvanger A. What If Country Commitments for CO2 Removal Were Based on Responsibility for Historical Emissions? Energies. 2023; 16(11):4350. https://doi.org/10.3390/en16114350
Chicago/Turabian StyleTorvanger, Asbjørn. 2023. "What If Country Commitments for CO2 Removal Were Based on Responsibility for Historical Emissions?" Energies 16, no. 11: 4350. https://doi.org/10.3390/en16114350
Note that from the first issue of 2016, this journal uses article numbers instead of page numbers. See further details here.