Article

Performance Test and Structure Optimization of a Marine Diesel Particulate Filter

College of Merchant Marine, Shanghai Maritime University, Shanghai 201306, China
*
Author to whom correspondence should be addressed.
Energies 2023, 16(11), 4336; https://doi.org/10.3390/en16114336
Submission received: 8 March 2023 / Revised: 10 May 2023 / Accepted: 16 May 2023 / Published: 25 May 2023
(This article belongs to the Topic CO2 Capture and Renewable Energy)

Abstract

:
Particulate matter (PM) is a major pollutant in the exhaust of marine diesel engines, which seriously endangers human health and the atmospheric environment, and how to reduce particulate matter emissions from marine engines has become a key research direction in the field of environmental protection and diesel engines. In this study, we analyzed the components and sources of PM from marine engines and conducted tests on the performance of Wärtsilä 20DF Diesel Particulate Filter (DPF) catalysts to verify the capture efficiency, gaseous pollutant removal rate, regeneration effect and the relationship between carbon loading and pressure loss of DPF catalysts in the context of Tier III emission regulations. The results showed that PM emissions of 20DF in diesel mode after adding the DPF system meet the requirements of the regulatory limit, but the pressure drop of the engine increases after adding the DPF system. Therefore, numerical simulation was used to optimize the DPF structure by evaluating the system velocity field, flow field distribution uniformity and system pressure drop to improve the pressure drop.

1. Introduction

In recent years, with the rapid development of the shipping industry, marine diesel engines have become the main source of air pollution in port cities, their exhaust pollutants affect the flow of the atmosphere and affect the global environment. Marine diesel engine emissions have become an important source of atmospheric pollution [1]. PM is one of the main pollutants in diesel engine exhaust emissions, which can be suspended in the atmosphere for a long time and is extremely harmful to human respiratory and blood circulation systems, while it is easy to enter the ship ventilation pipeline system and pollute the living environment of the crew [2]. As the main pollutant of ship diesel engines, the problem of PM purification is getting more and more attention. The installation of DPF is the most effective measure to reduce exhaust PM and has been the focus of research in recent years [3,4]. As a large shipping country, China’s ports are mostly concentrated in densely populated areas, such as the Pearl River Delta, Bohai Sea, etc. The pollution hazards caused by PM in the exhaust of ship engines are more serious, and the treatment of particulate matter emissions has become a top priority.
Currently, the United States, the European Union and China have all established ship emission regulations that set emission limits for PM [5,6]. On 22 August 2016, the Ministry of Environmental Protection of China issued regulations limiting the emission of PM from ship engines. Phase 1 emission limits have been officially implemented on 1 July 2018. Phase 2 emission limits have been implemented from 1 July 2021. Under the environmental protection trend of preventing air pollution from ships, it is necessary to research marine diesel engine PM emission control technology in order to cope with the increasingly stringent regulatory requirements.
MTU Germany has developed a compact particle trap for yacht diesel engines that can be integrated into the diesel engine system and also has a sound-deadening function. The particulate removal efficiency can reach over 90% and the regeneration is catalytic. The U.S. Emission Control Manufacturers Association has designed a DPF+SCR (Selective Catalytic Reduction) system for marine 2-stroke diesel engines with an average particulate matter and NOx removal efficiency of over 90% for 200 h of operation, and regeneration is by injection fuel-assisted regeneration.
Some foreign research institutes have studied DPF technology for marine diesel engines. Yamamoto et al. [7] from Osaka Prefectural University, Japan, studied the capture of particulate matter by DPF and the regeneration of DPF on an 800 kW marine diesel engine by bypassing 5% of the exhaust gas at 25% load and achieved high capture efficiency. To cope with emission regulations, DPF is often used in combination with SCR to remove both PM and NOx from the exhaust gas, and SCR-DPF systems have removal efficiencies of 92% and 92–97% for NOx and PM at full load, respectively.
Yamada et al. [8] initially explored the generation process of VOCs during DPF regeneration by bench tests, and the results showed that the VOCs with small relative molecular masses were first separated from DPF in the early stage of DPF regeneration, and the large molecular components were gradually separated from DPF as the DPF temperature increased. Mueller et al. [9] studied the PM characteristics and temporal evolution from a marine diesel engine with fuel-switching capability and found that emissions of PM, organic matter, sulfate and inorganic elements were significantly higher when burning heavy fuel oil compared to burning regular diesel.
The MARINE-X system of DCL in the United States includes a wall-flow filter, a back-pressure and temperature monitoring system. The filter element is a catalytic ceramic filter, with passive regeneration and P→M removal efficiency of more than 90%. The system has been used in ferries, luxury yachts and tugboats. Particle trap technology in the market is more mature and the particulate trap efficiency is high, all reaching more than 90% [10]. Different ships and diesel engine models use different regeneration technology methods of particulate trap devices. For China to carry out the development of particulate trap devices has some reference significance.
Some research institutes and universities mainly focus on theoretical aspects of particulate matter management, such as structural optimization, performance improvement and modeling analysis of catalysts [11,12]. Chinese scholars have less research on DPF for marine diesel engines and mainly focus on DPF trapping and regeneration for automotive engines [13,14]. The structural optimization of catalysts focuses on the filter carrier and catalyst formulation, loading, and coating process; the performance enhancement focuses on the soot oxidation rate; the modeling analysis can study the internal state of catalysts and further improve the understanding of NO2-related reactions as well as soot oxidation and pressure drop.
CFD technology has developed rapidly in recent years, and the use of numerical simulation can effectively reduce costs and shorten the development cycle [15,16]. Many scholars generally use experimental or numerical simulation methods, focusing on the DPF capture efficiency, exhaust back pressure and regeneration strategy [17]. For example, scholars from Tongji University in Shanghai used GT-Power software to simulate the influence of DPF structural parameters on pressure drop and capture efficiency. Some scholars from the Wuhan University of Technology have designed a post-treatment technology plan for diesel fuel injection regeneration that integrates burner regeneration and catalytic regeneration and proposed a two-stage exhaust heating strategy with burner warming as the mainstay and fuel injection warming in front of the diesel oxidation catalyst as a supplement. However, the above studies were conducted on the bench of land-based diesel engines, and there is a lack of corresponding studies in the face of the special use scenarios of marine diesel engines.
In summary, the current research on diesel particulate reduction devices in China is mainly focused on theoretical and simulation aspects, and less research has been conducted in the area of diesel particulate reduction management for marine engines [18,19,20]. Therefore, it is of great practical significance to carry out research on marine diesel engine particulate matter emission control technology and form a perfect PM control technology and device for ocean-going and inland river vessels to meet the challenges of international regulations on marine diesel engine PM emission. Therefore, it is necessary to carry out research on marine diesel PM control technology, complete the development of PM control devices, and form a PM reduction program applicable to many types of marine diesel engines.
In order to cope with the increasingly stringent marine particulate emission regulations and their treatment needs, this paper has carried out performance testing and structural optimization of low-pressure loss marine particulate trap reactors for different regions and different ship types. It has also completed diesel engine bench tests to fully verify the performance and reliability of DPF, optimized the low-pressure loss DPF structure of marine diesel engines through CFD simulation, and finally formed the best marine particulate treatment solution to further promote the transformation and upgrading of the shipping industry to green.

2. Engine Test System and CFD Model Description

2.1. Engine Test System

The DPF capture and regeneration process is influenced by many factors such as engine exhaust flow, exhaust temperature and gas fraction, etc. The engine’s original exhaust test was first conducted to obtain the exhaust conditions required for the numerical simulation. The engine used for the test was a marine Wärtsilä 20DF (dual-fuel) engine with the main technical parameters shown in Table 1. When operating in gas mode, the Wärtsilä 20DF engine itself complies with IMO Tier III regulations and does not require any secondary exhaust gas cleaning system. In addition, when running on gaseous fuels, sulfur oxide and CO2 emissions are significantly reduced, resulting in smoke-free operation, and CO2 emissions are reduced by nearly 20%, eliminating the need for any harmful secondary purification systems.
In diesel mode, the Wärtsilä 20DF engine fully complies with the IMO Tier II exhaust emission regulations contained in Annex VI of MARPOL 73/78. Wärtsilä 20DF Engine and DPF test system are shown in Figure 1. E2 cycle is used for this test. The ambient temperature during the test was 15 °C.
The DPF filter used is cordierite material, and the main parameters are shown in Table 2. The test system built is mainly composed of a diesel engine, dynamometer, exhaust gas analyzer, etc. The detection instruments used in the test are shown in Table 2.
The DOC and DPF catalysts were arranged in the DPF reactor in the direction of airflow, and the DOC catalyst package is shown in Figure 2 and the DPF catalyst package is shown in Figure 3. DOC+DPF Catalyst design parameters are shown in Table 3 and Table 4.

2.2. Evaluation Index of Particle Trap

To quantify the inhomogeneity of the temperature distribution of the catalyst inlet cross-section, the root-mean-square deviation coefficient of the catalyst inlet cross-section temperature is used to express the inhomogeneity of the cross-section temperature, respectively; the larger the inhomogeneity, the more unfavorable the cross-section DPF regeneration.
In order to quantitatively analyze the inhomogeneity of the temperature distribution in the catalyst inlet section of the reactor, the inhomogeneity of the ammonia concentration distribution is expressed by the root mean square deviation coefficient of the mass fraction of ammonia concentration in the reactor outlet section. When the inhomogeneity is greater than 1, the inhomogeneity is no longer applicable, indicating that the uniformity of ammonia concentration distribution is very poor, i.e., the mixing effect of the mixing method is poor; its calculation formula is shown in Equation (1).
σ 2 = N i N 0 2 n 1 0.5 N 0
where: Ni is the mass fraction of ammonia concentration at each sample point on the section; N0 is the actual average mass percentage of the section; n is the number of sample points; ∑(NiN0)2 is a summation of the velocity variance for each point.

2.3. DPF Model Establishment

In order to study the gas flow and distribution effect of the reactor as well as the reactor drag loss, the flow field inside the reactor was simulated and optimized using Fluent software; the reactor structure consisted of a deflector, inlet deflector cluster, DOC deflector cluster and outlet deflector cluster according to the catalyst arrangement and design requirements.
CFD calculation adopts the standard k-ε model, considering the effect of temperature, the inlet is massflow-inlet, the inlet is 2.505 kg/s, and the temperature is 648 K (375 °C); The outlet is pressure-outlet; the Mass percentage of each component of flue gas: CO2-7.66%; N2-72.76%; O2-14.25%; H2O-5.32%; The average molecular weight of trace gas is 28.46. The average density of flue gas is 0.526 kg/m3, the specific heat capacity at constant pressure is 1.156 kJ/kg·K, the thermal conductivity is 0.0574 W/m·k, and the viscosity coefficient is 31.25 × 10⁻⁶ Pa·s.
The honeycomb ceramic used by DPF is a kind of porous media material. The two adjacent channels are alternately blocked at the inlet and outlet. Therefore, after the exhaust enters from the inlet channel, it can only pass through the porous ceramic wall and discharge from the adjacent outlet channels, while the particles are trapped on the porous wall. The porous media model is used to simulate the resistance loss of the catalyst area.
The honeycomb ceramic used in the DPF is a porous media material with two pores adjacent to each other, and the inlet and outlet are alternately blocked. Therefore, the exhaust gas entering from the inlet orifice can only pass through the porous ceramic wall and exit through the adjacent outlet orifice, while the particulate matter is trapped in the porous wall. The viscosity resistance coefficient of the catalyst is 1.581 × 10⁷ 1/m2, the inertia resistance coefficient is 0.132, and the porosity is 0.683.

3. Results and Discussion

3.1. PM Capture Efficiency of the DPF System

In order to evaluate the effect of DPF systems on diesel exhaust particulate matter capture, the PM ratio emissions before and after a DPF system under different diesel engine load conditions were tested separately, and the PM measurement results after a DPF system were compared with the limit values of Chinese regulation GB15097. The test data are shown in Table 5.
As can be seen from Table 5, when the diesel engine load increased, the flue gas flow rate in the DPF system reactor increased and the air velocity of DOC catalyst and DPF catalyst also increased. The design airspeed of the DOC catalyst is 51,746/h and the design airspeed of the DPF catalyst is 14,000/h. During the test, the airspeed of the DOC catalyst at 100% load is 174,017/h and the airspeed of the DPF catalyst is 43,504/h, both of which are much higher than the design airspeed of the catalyst.
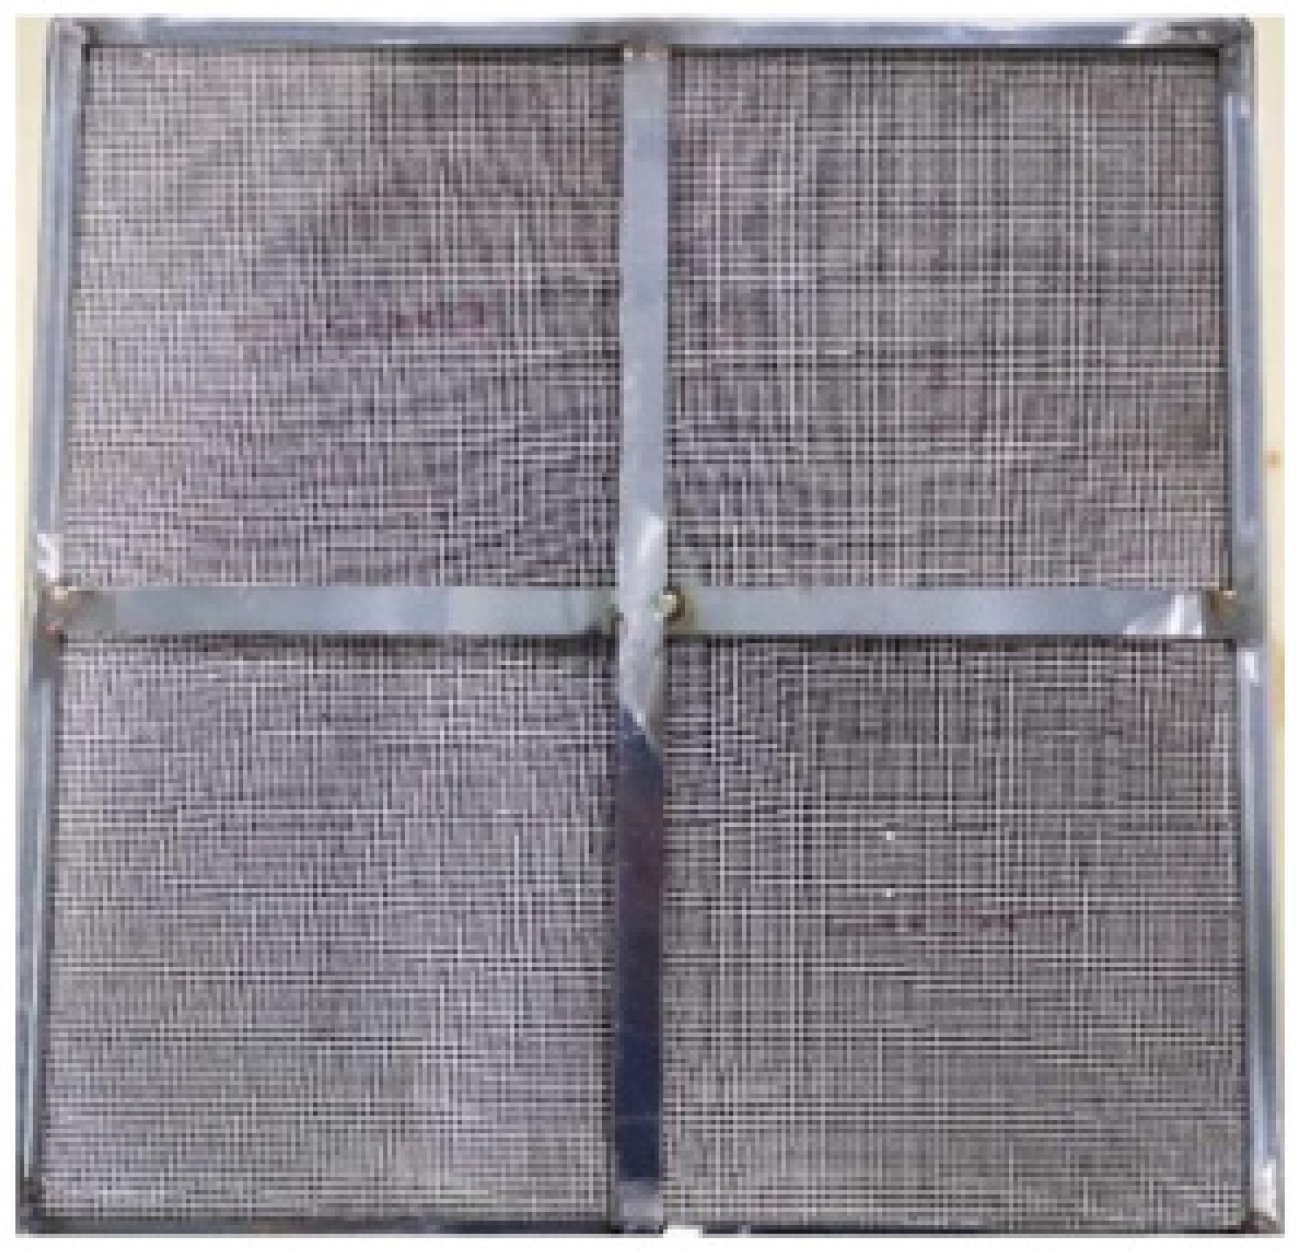
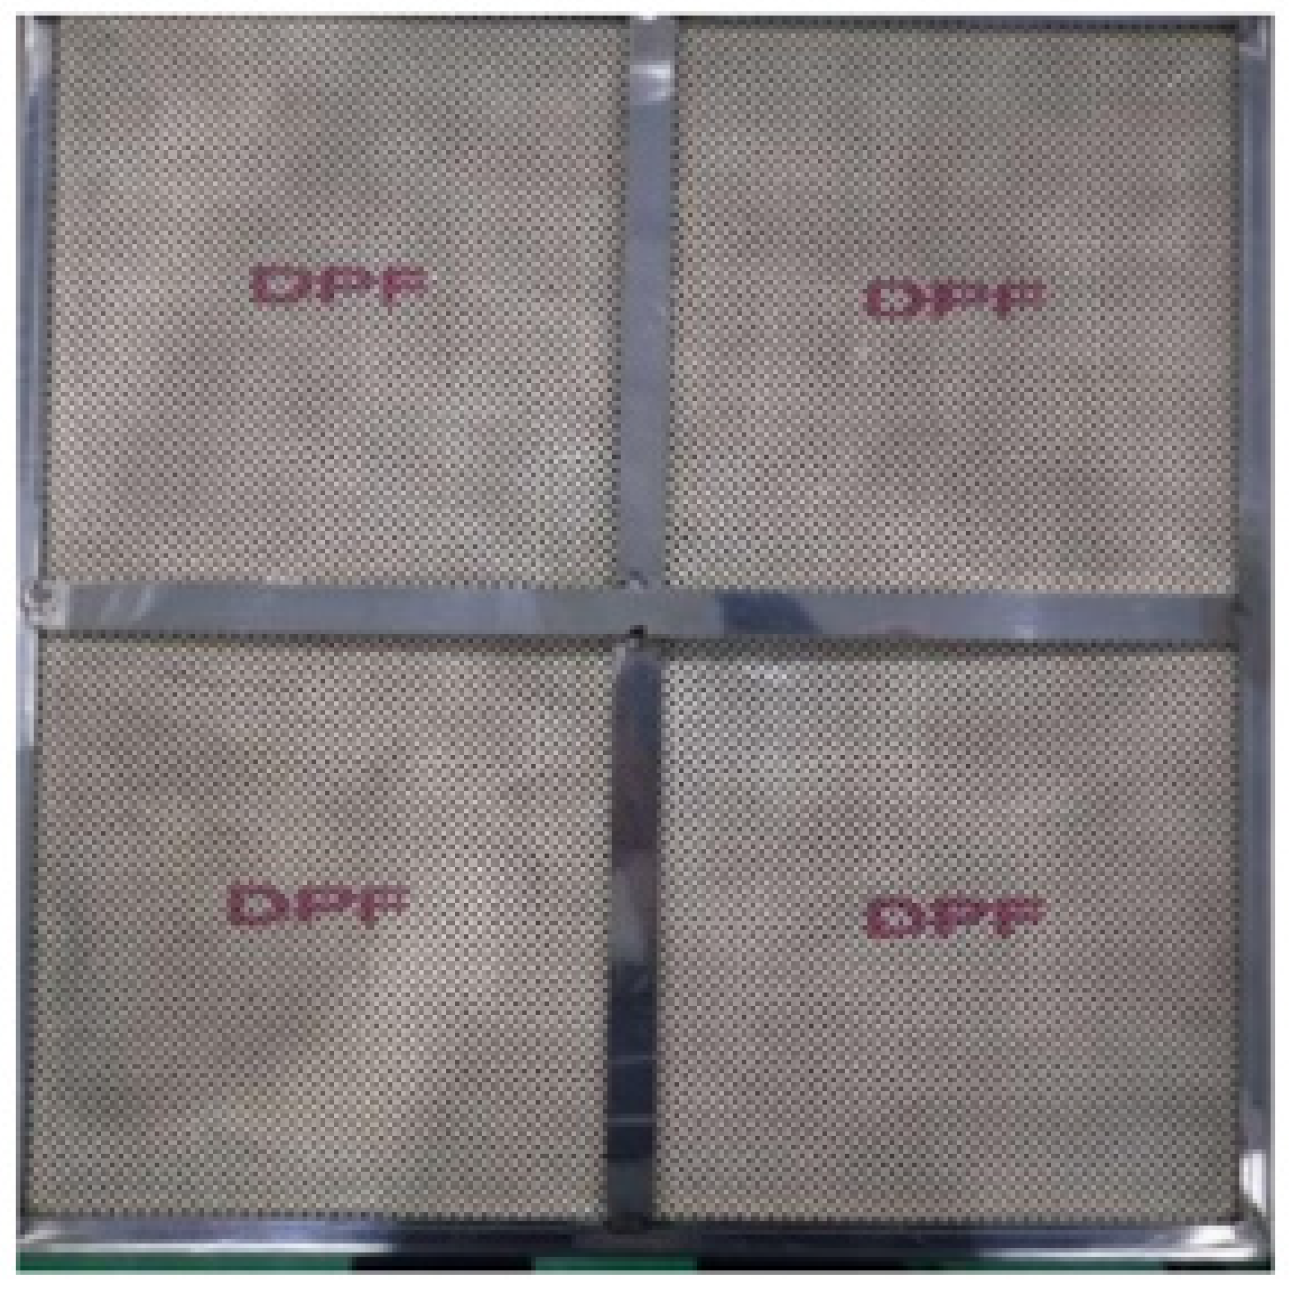
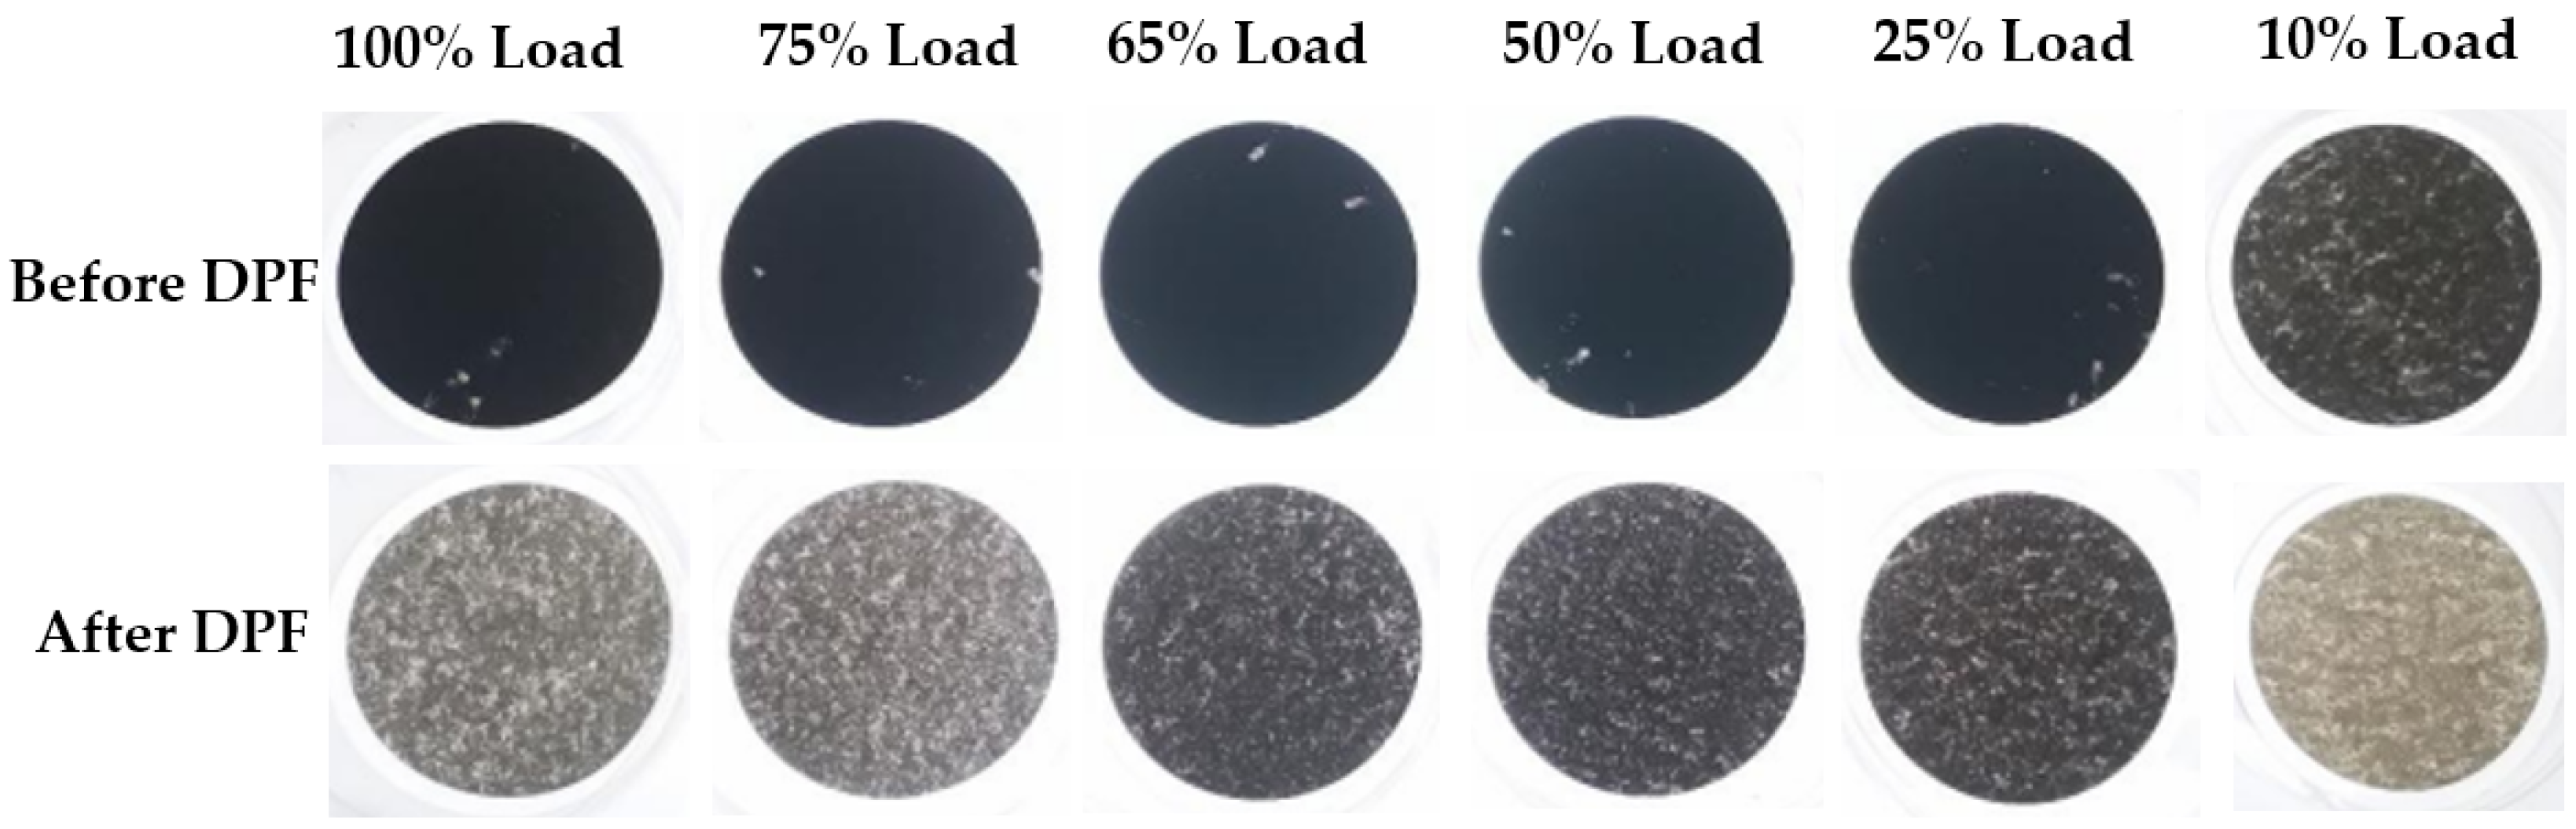
At different loads, the PM sampling filter paper before and after the DPF system is shown in Figure 4, under different load conditions of the diesel engine. The PM emission in diesel engine flue gas was reduced after adding the DPF system.
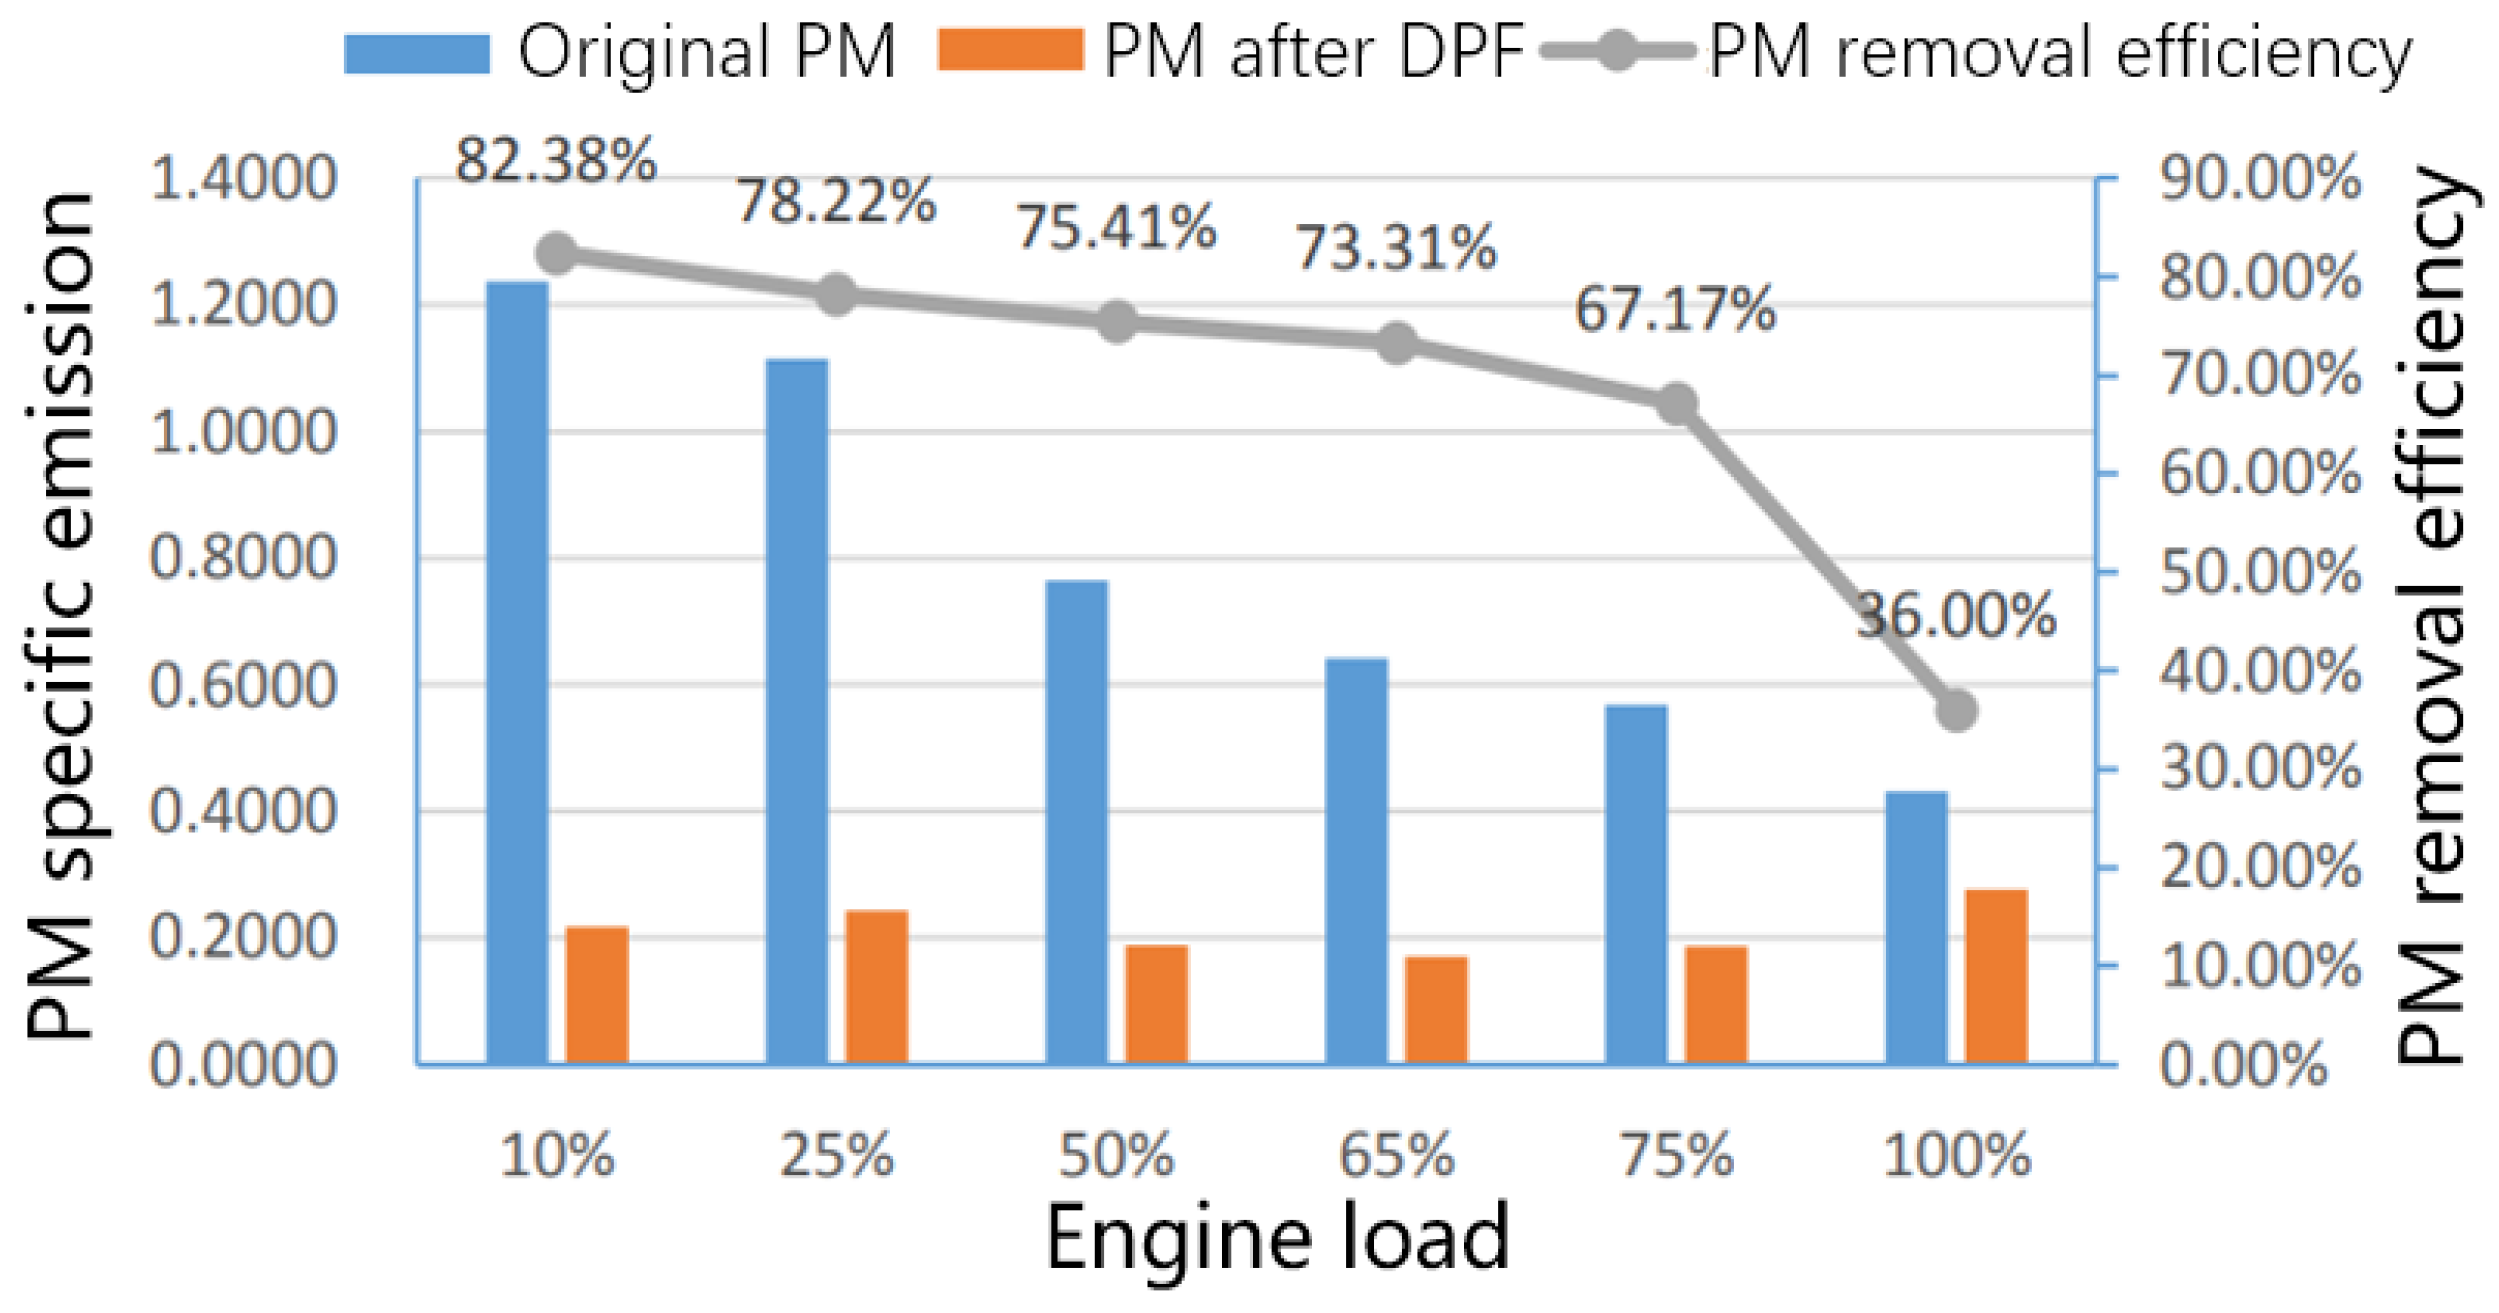
PM emission and PM removal efficiency of flue gas before and after the DPF system is shown in Figure 5. As shown in Figure 5, the PM emissions in diesel engine flue gas decreased after the addition of the DPF system under different load conditions of diesel engines. With the increase in diesel engine load, the PM capture efficiency of diesel engine flue gas started to decrease, and the particle capture efficiency is 82.38% at 10% load and decreased to 36% at 100% load.
On the one hand, the reason for the decreased efficiency of DPF at 100% engine load is due to the DPF being too small. The air velocity increases and the residence time of the gas on the catalyst surface becomes shorter and lower. On the other hand, due to the increase in diesel engine load, the flow rate of flue gas in the reactor increases and the pressure drops before and after it also increases, which leads to the increase in kinetic energy of the particles in the flue gas, resulting in the reduction of the filtering ability of DPF catalyst for the particles and the decrease in PM capture efficiency.
The specific emission values of PM in Table 5 were weighted and compared with the regulatory limits. The measured value of PM weighted emission before DPF is 0.8509 g/kWh, and after DPF is 0.2115 g/kWh. According to the results, the original emissions of the diesel engine and the emissions after the DPF system cannot meet the limit requirements of the first and second stages of the regulation.
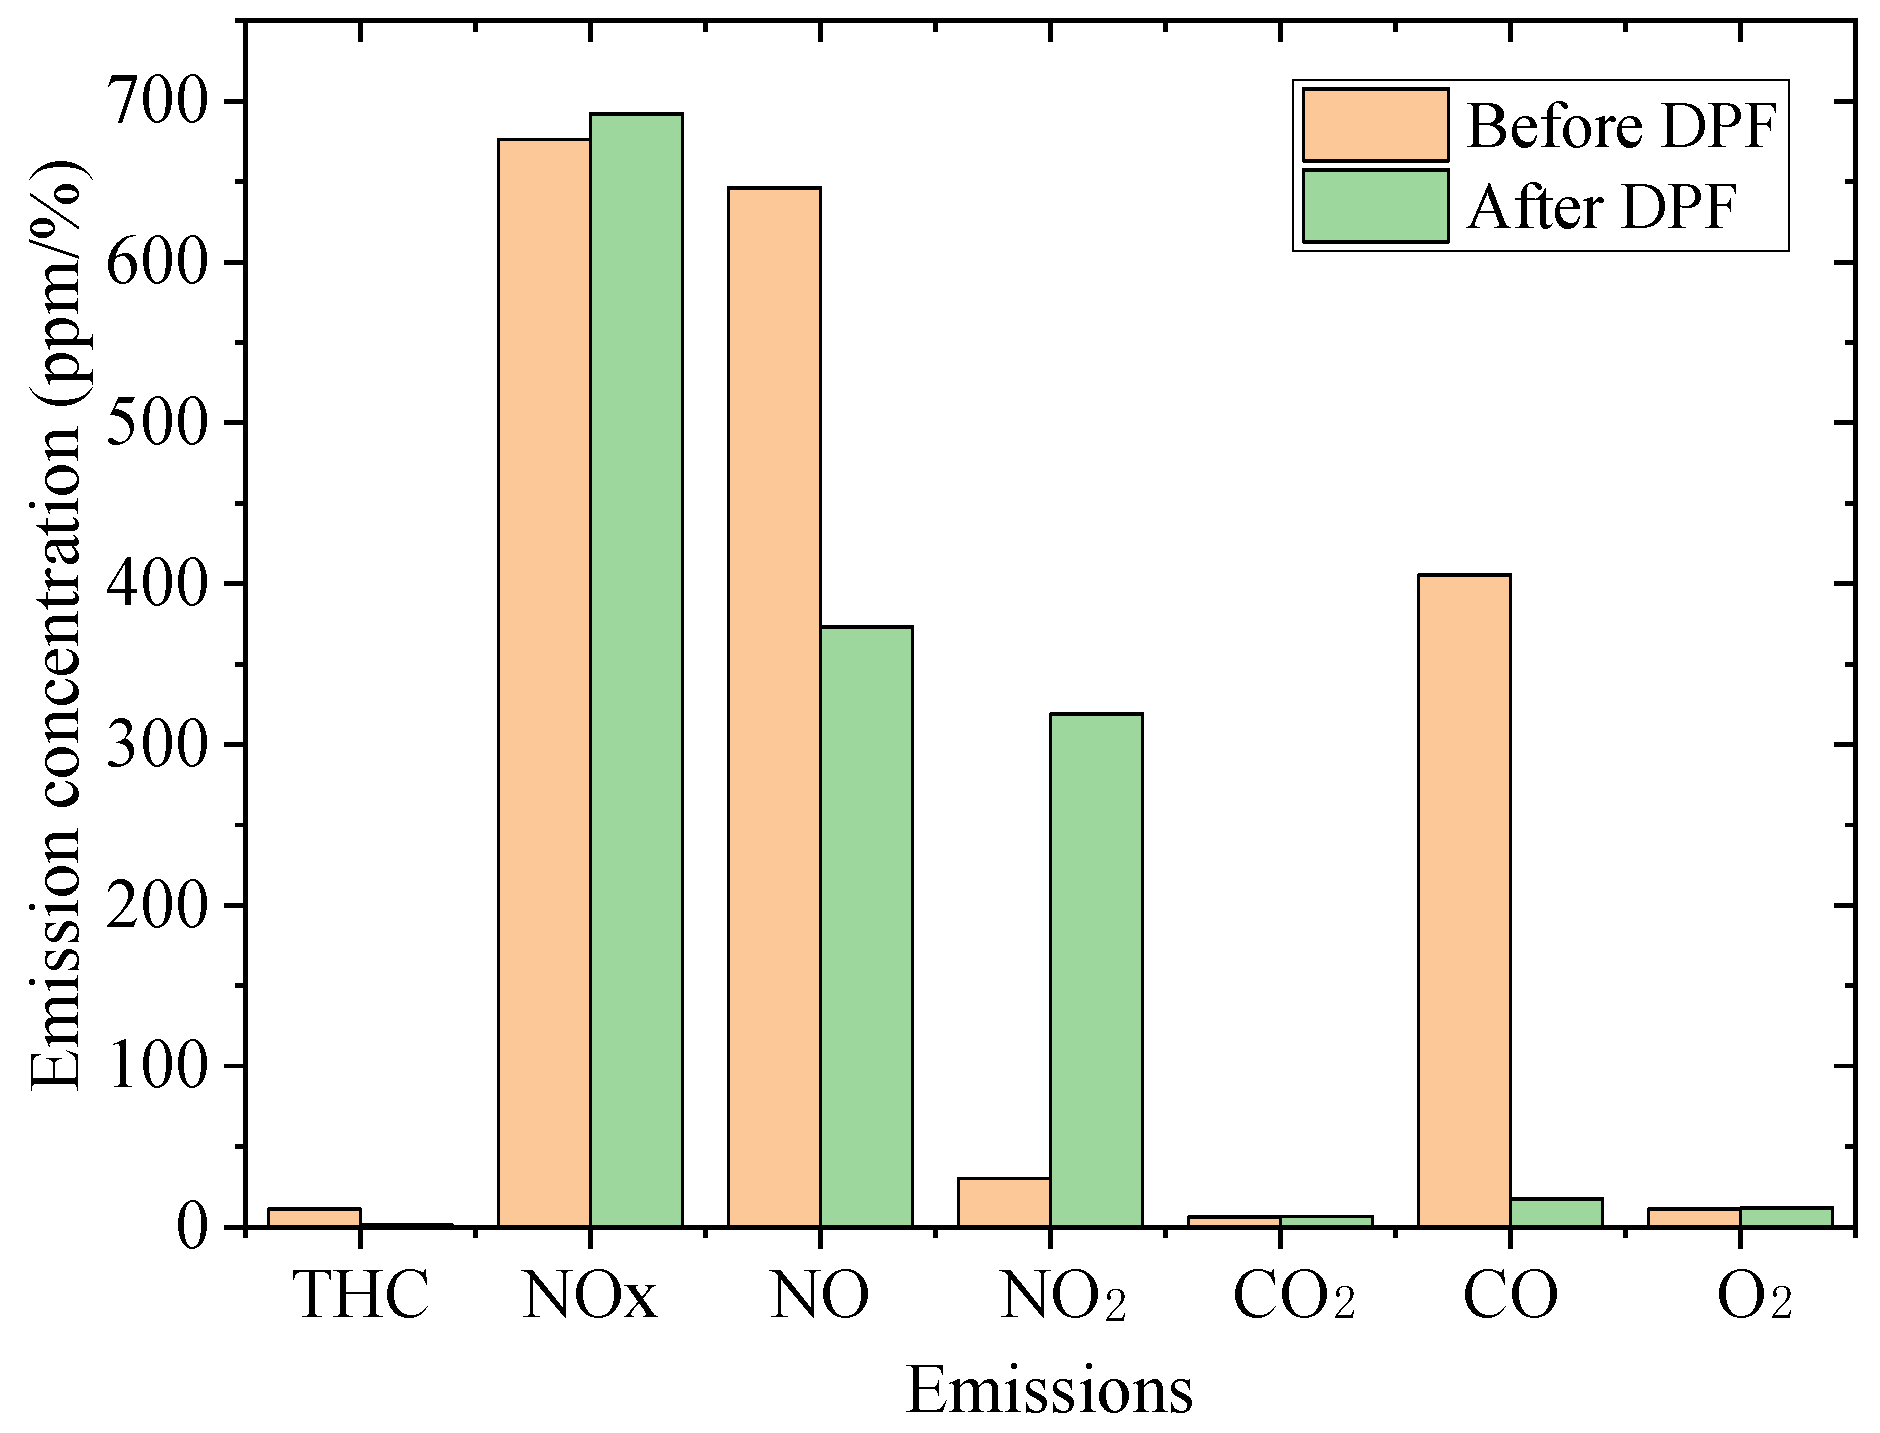
The removal efficiency of the DPF system catalyst for gaseous pollutants in diesel engine exhausts is shown in Figure 6. During the test, the diesel engine operating condition is 65% load, and the diesel engine flue gas temperature is 340 °C.
As shown in Figure 6, the DPF system catalyst has an obvious removal effect on total hydrocarbon (THC), CO and NO in diesel engine flue gas, with a removal efficiency of 88.50%, 95.73% and 42.25%, respectively; At the same time, the content of NO2 and CO2 in diesel engine flue gas increases, while the content of NOX in flue gas has little change. This is because THC, CO2 and NO in diesel engine flue gas undergo catalytic oxidation reactions under the action of DOC catalyst to generate CO2, H2O and NO2. Then, NO2 oxidizes the particulate matter captured on the catalyst carrier under the action of the DPF catalyst to generate CO2 and NO for particulate matter capture and regeneration. The amount of NO2 generated by DOC catalytic oxidation exceeds the amount of NO2 required for carbon particle regeneration on the catalyst carrier, Therefore, the NOX content after the DPF reactor is almost unchanged from that before the DPF reactor, while the NO decreases and the NO2 increases.

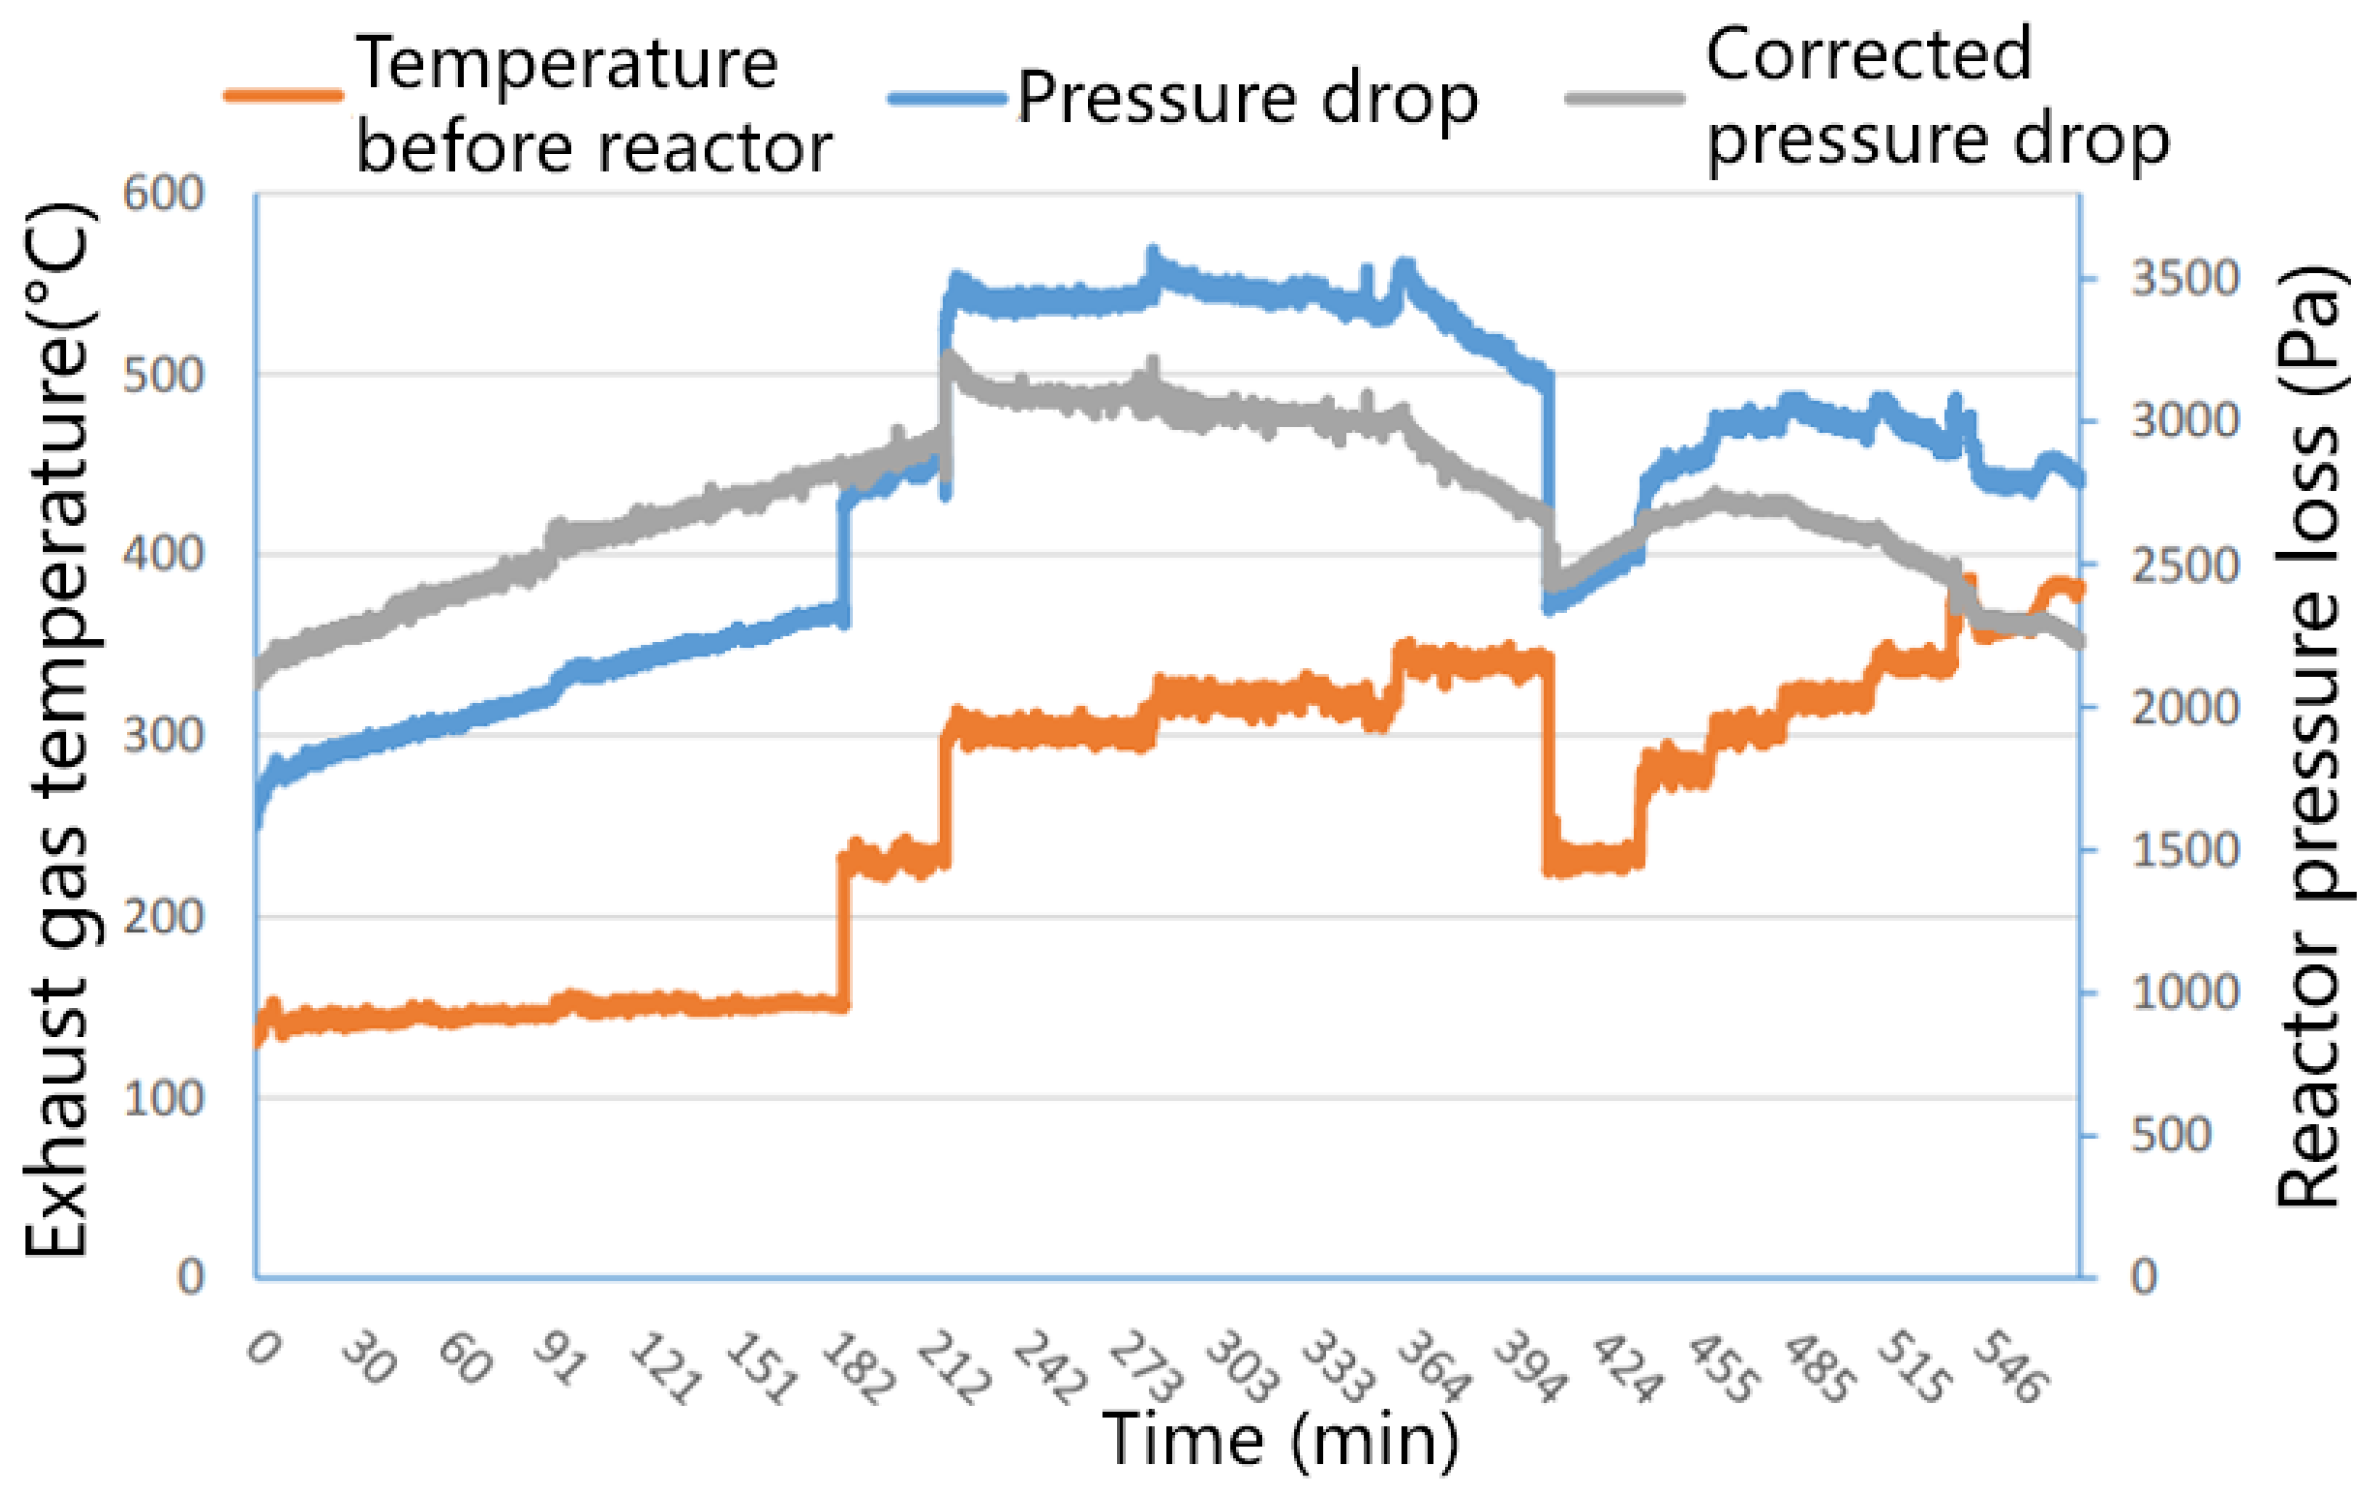
3.2. DPF System Active Regeneration Effect Test

In order to test the active regeneration performance of the DPF system catalyst, the diesel engine working condition was controlled at 65% load and the flue gas temperature was adjusted to 140 °C (much lower than the re-livability temperature of this type of catalyst) for about 240 min, and then the flue gas temperature was increased sequentially to determine the regeneration effect of the DPF system by measuring the pressure difference between the two ends of the DPF reactor. The test procedure was recorded as shown in Table 6, and a total of one carbon loading condition and two regeneration cycles were performed, and the test results are shown in Figure 7.
As shown in Figure 7, when the DPF reactor inlet flue gas temperature is 140 °C, the pressure drop at both ends of the reactor has been increasing with the increase in running time, and then the temperature of the diesel engine is increased to 280 °C, and the reactor pressure loss still rises. When the flue gas temperature rises above 300 °C, the pressure drop at both ends of the DPF reactor starts to decrease, and the DPF starts to regenerate. With the increase in temperature, the rate of decrease in pressure difference between the two ends of the DPF reactor increases, and the efficiency of DPF regeneration increases.
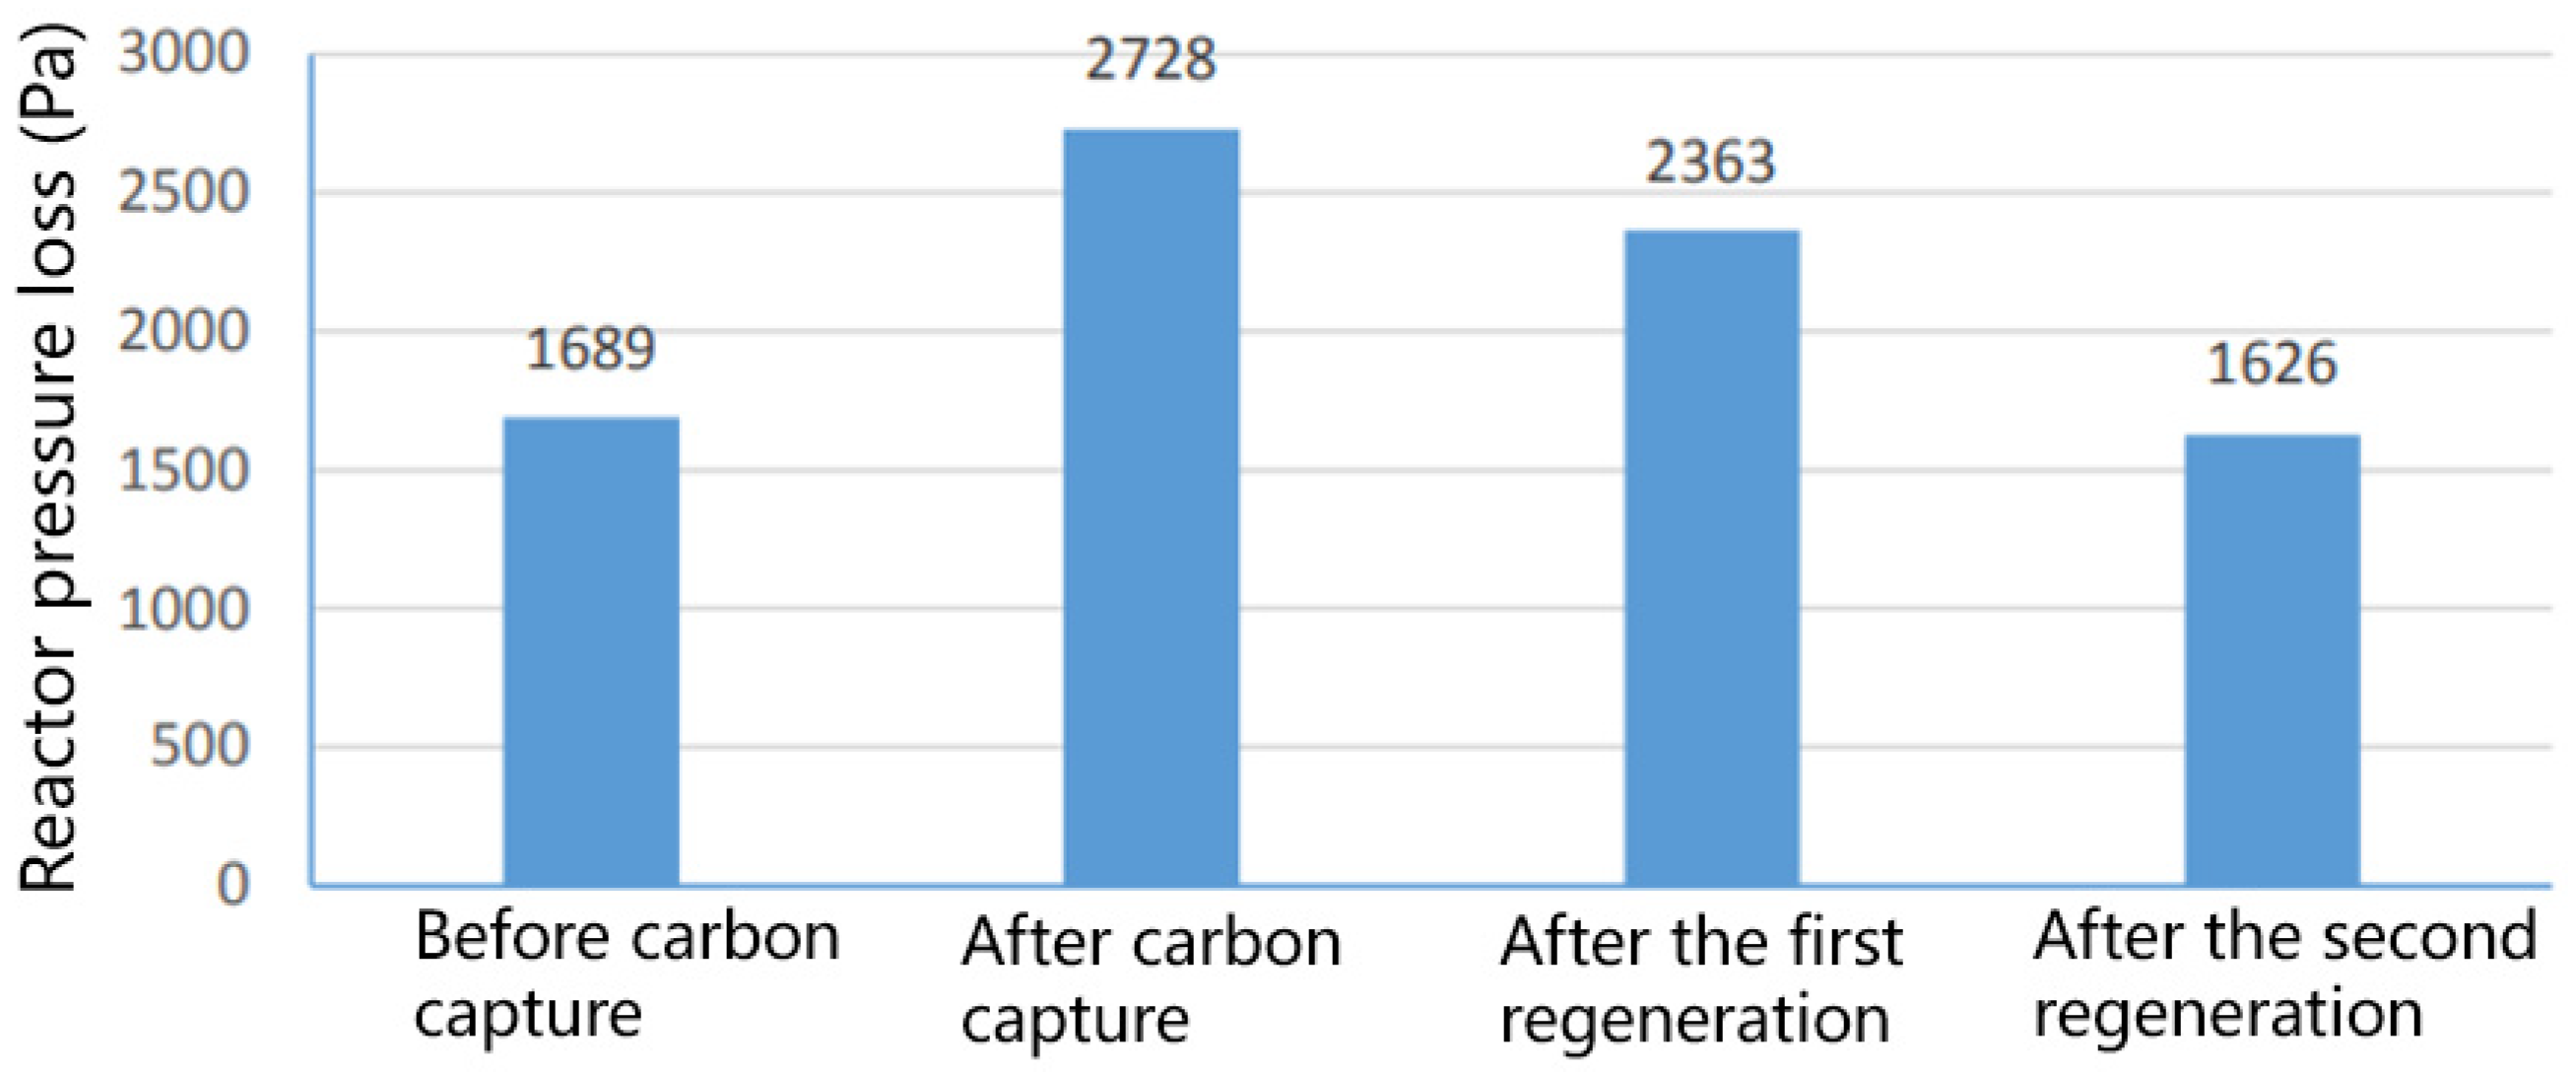
During the DPF regeneration effect test, the operating condition of the diesel engine was adjusted to 65% load and the flue gas temperature was adjusted to 230 °C before and after the carbon load and after the first and second regeneration cycle test process, respectively, and the differential pressure of the DPF reactor was measured, and the results are shown in Figure 8.
It can be seen from Figure 8 that the reactor pressure loss increased after the DPF system was carbon loaded, and after the regeneration test was performed, the reactor pressure loss decreased. The combined test results in Figure 8 and Figure 9 show that this type of DPF catalyst regenerates well, and the regeneration temperature range is above 300 °C (the upper limit of the regeneration temperature of the DPF catalyst was not tested because the maximum temperature of the test working condition diesel engine is 380 °C), which is in good agreement with the design value of the DPF system catalyst, and the regeneration efficiency of the DPF system increases with the increase in temperature.
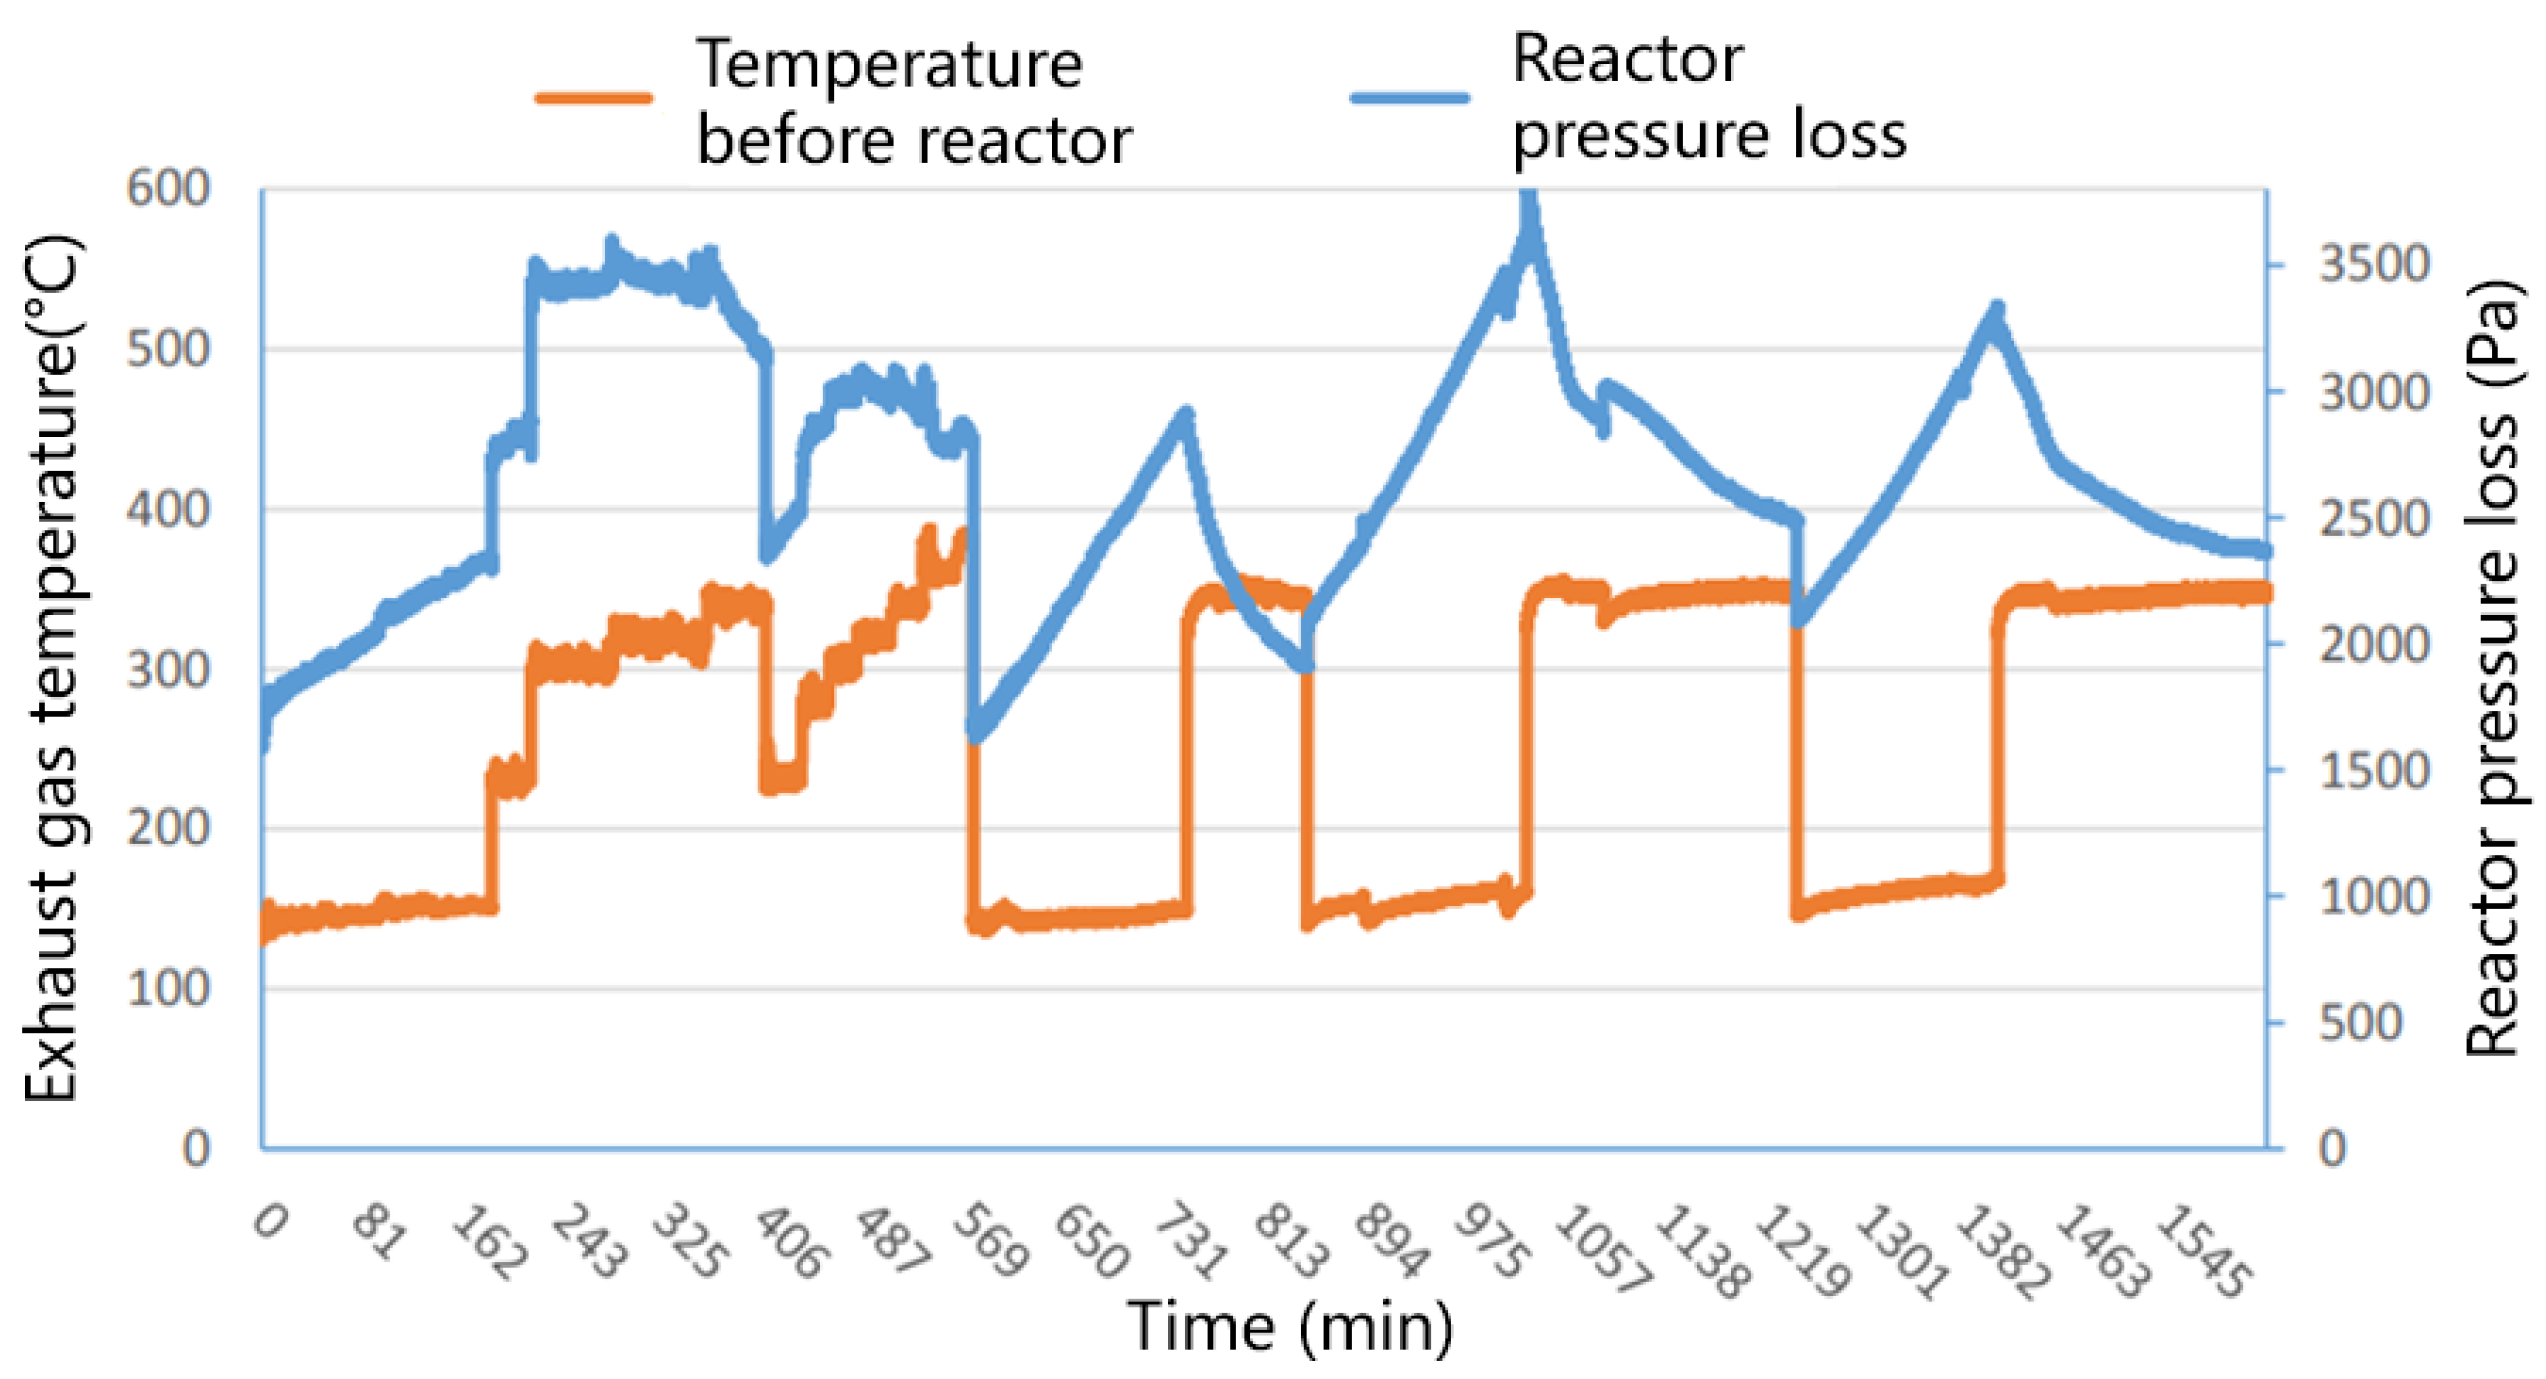
In order to repeat the verification and durability test of the active regeneration effect of the DPF catalyst, after completing the active regeneration effect test of the DPF system as shown in Table 6, three carbon loading and regeneration cycles were continued. The test results are shown in Figure 9.
As shown in Figure 9, the increase in exhaust gas temperature brings about the increase in pressure drop loss inside the DPF filter body, the larger the carbon load, the larger the pressure drop generated, and the trend of temperature change with pressure drop is non-linear. This is due to the increase in temperature, the increase in energy in the gas, the intensification of gas motion, viscosity, and resistance to flow; at the same time, the increase in temperature reduces the gas density, increases the gas volume flow rate, and accelerates the flow rate, thus increasing the pressure drop loss along the way. The good active regeneration performance of the DPF system has been proved during many carbon loading and regeneration cycle tests on the catalyst of the DPF system.

3.3. Number-Size Distribution and Pressure Loss in DPF Systems

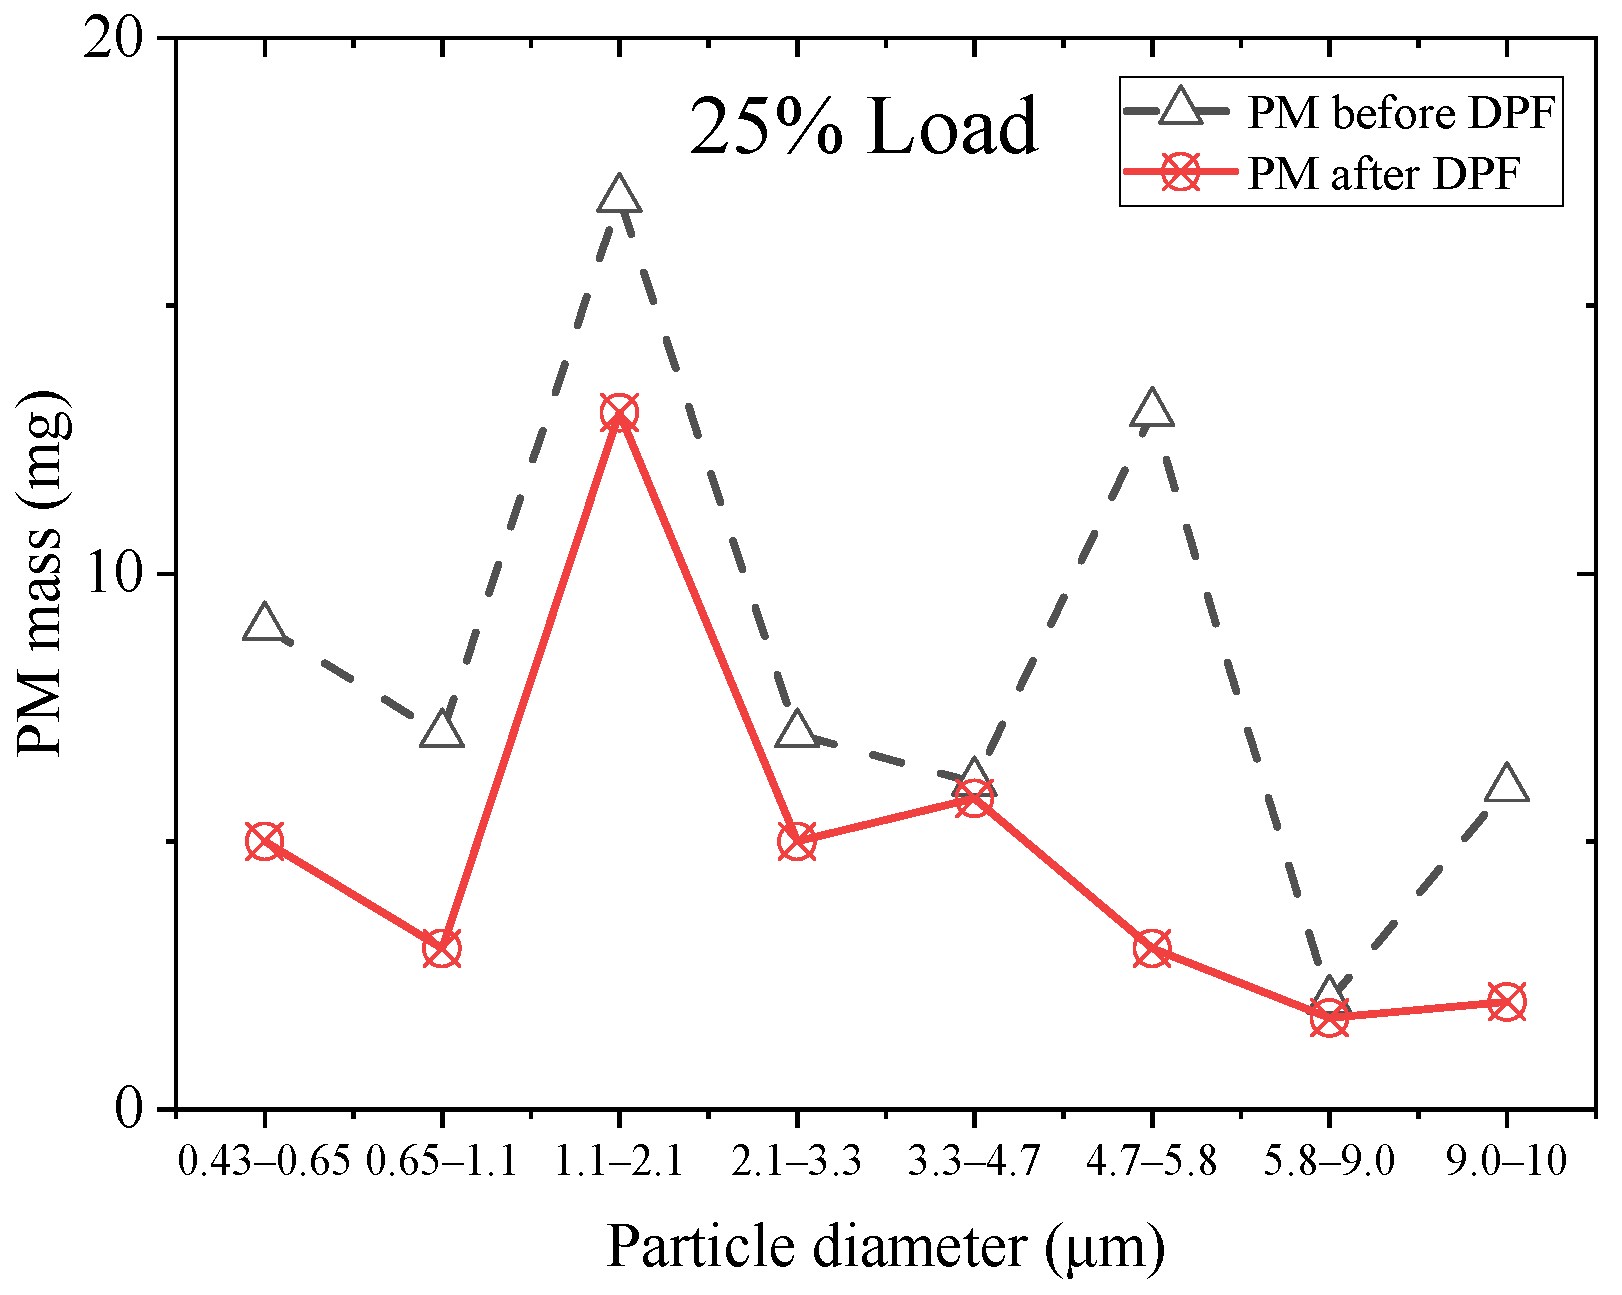
Particulate mass is the main index to evaluate marine engine particulate emission. Figure 10 shows the number-size distribution of PM from 20DF engine under 25% load. From the results, it can be seen that the particulate matter in the experiment under 25% load condition is concentrated in the region of 1.1–2.1 μm and 4.7–5.8 μm, and the DPF is effective in reducing the particulate matter in the region of 4.7–5.8 μm.
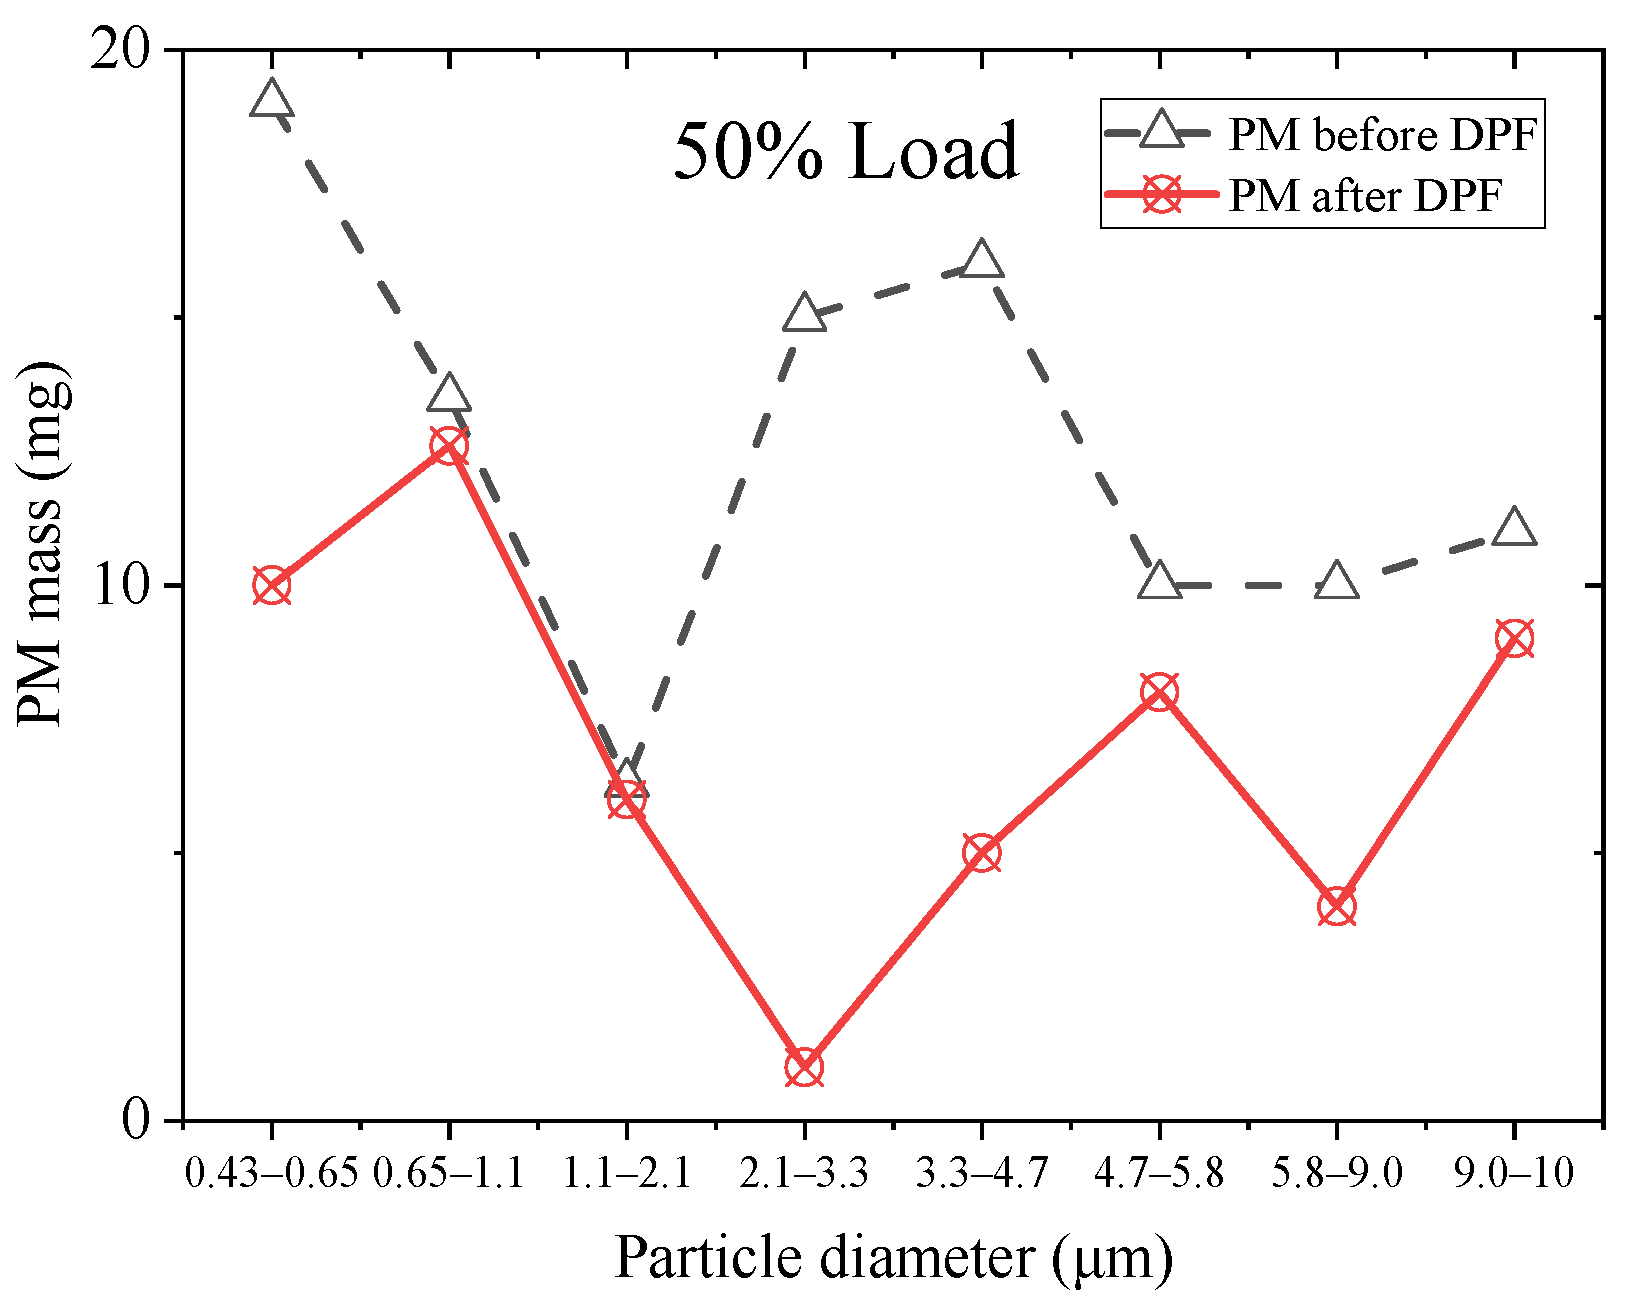
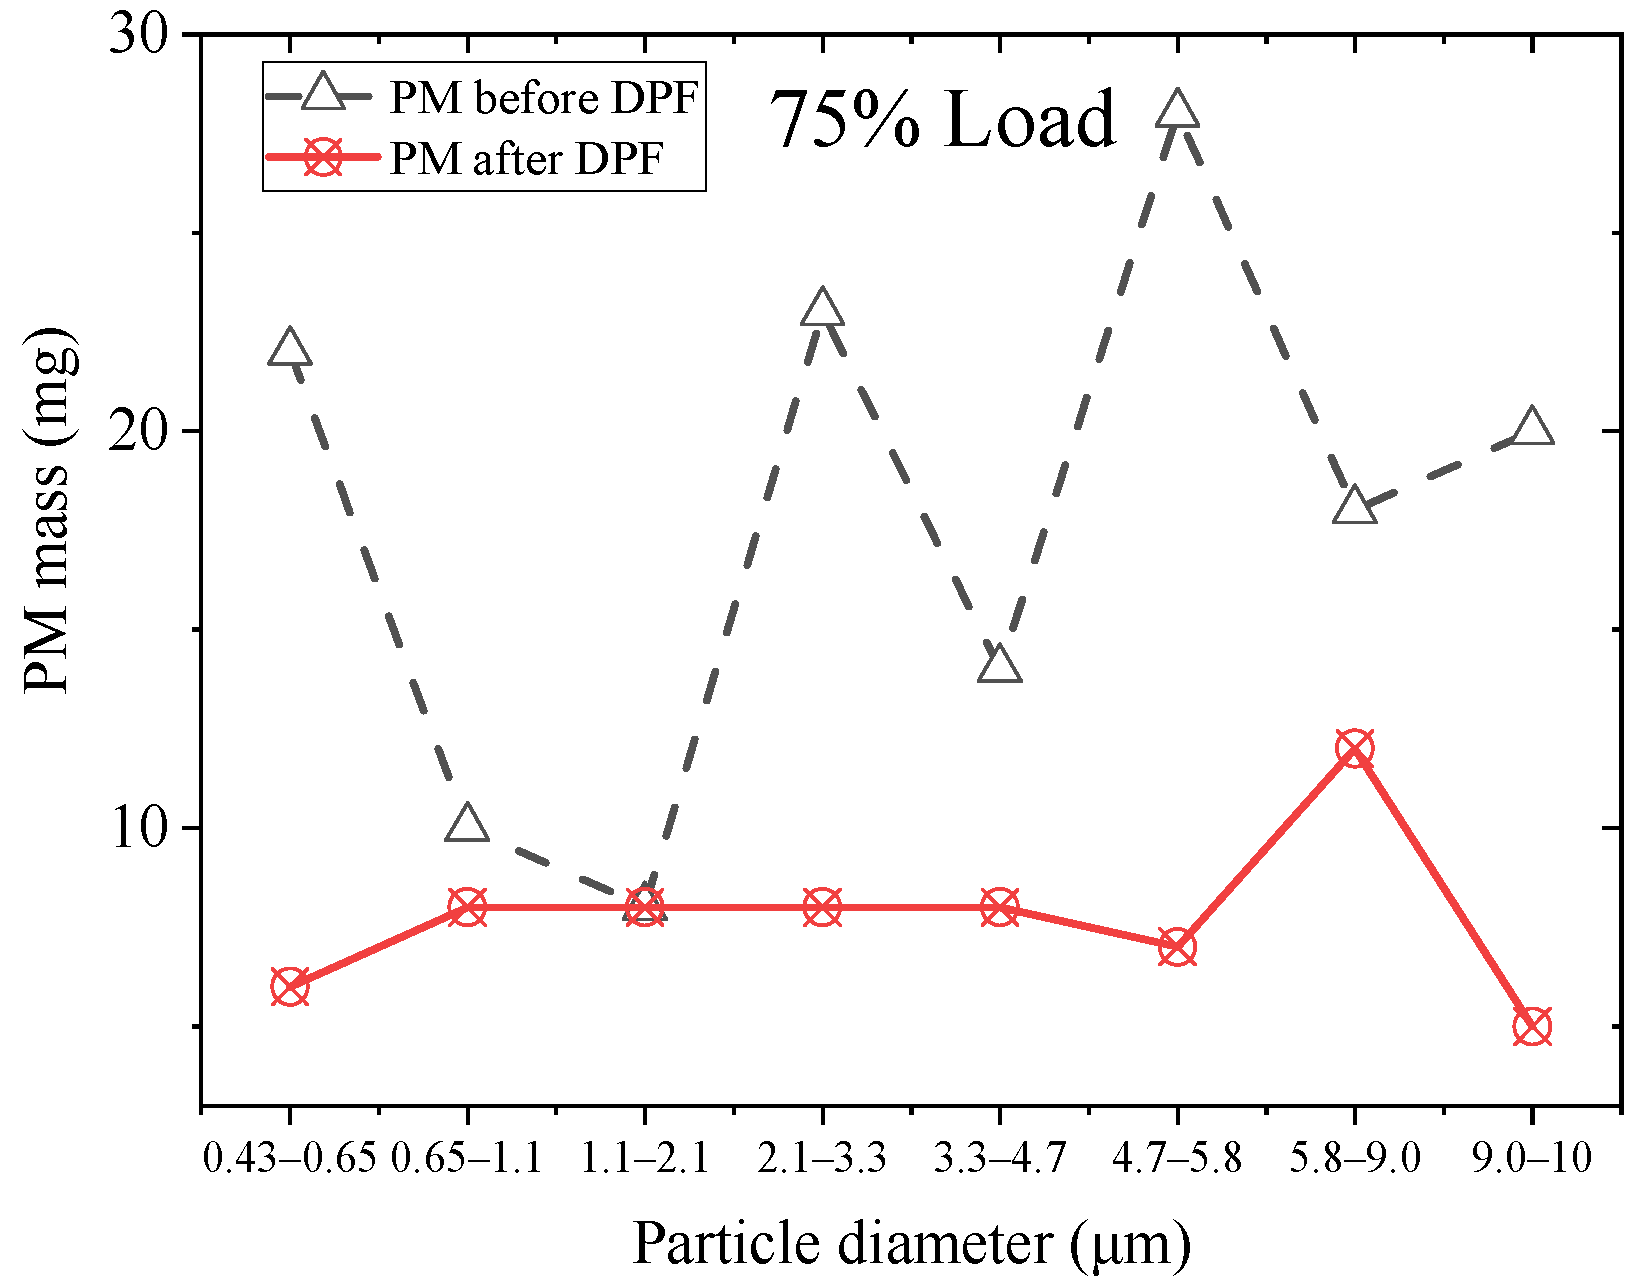
From Figure 11 and Figure 12, it can be seen that the number-size distribution of PM from the 20DF engine is under 50% and 75% load. The effect of DPF on particle reduction in the 1.1–4.7 μm region is obvious. Under 75% load condition, the particulate matter emission increases. In this experiment, the particulate matter is concentrated in the 2.1–5.8 μm region, and the DPF has an overall significant effect on the reduction of particulate matter in the 20DF engine. For the 4-stroke diesel engine with the increase in load, the particulate emission rate increases gradually from 50% medium load to a higher load of 75%, which is because the increased fuel consumption by the increase in diesel engine load is mainly used for diffusion combustion, and most of the dry carbon smoke is produced in the diffusion combustion stage, therefore, the PM rate increases significantly under the high load condition.
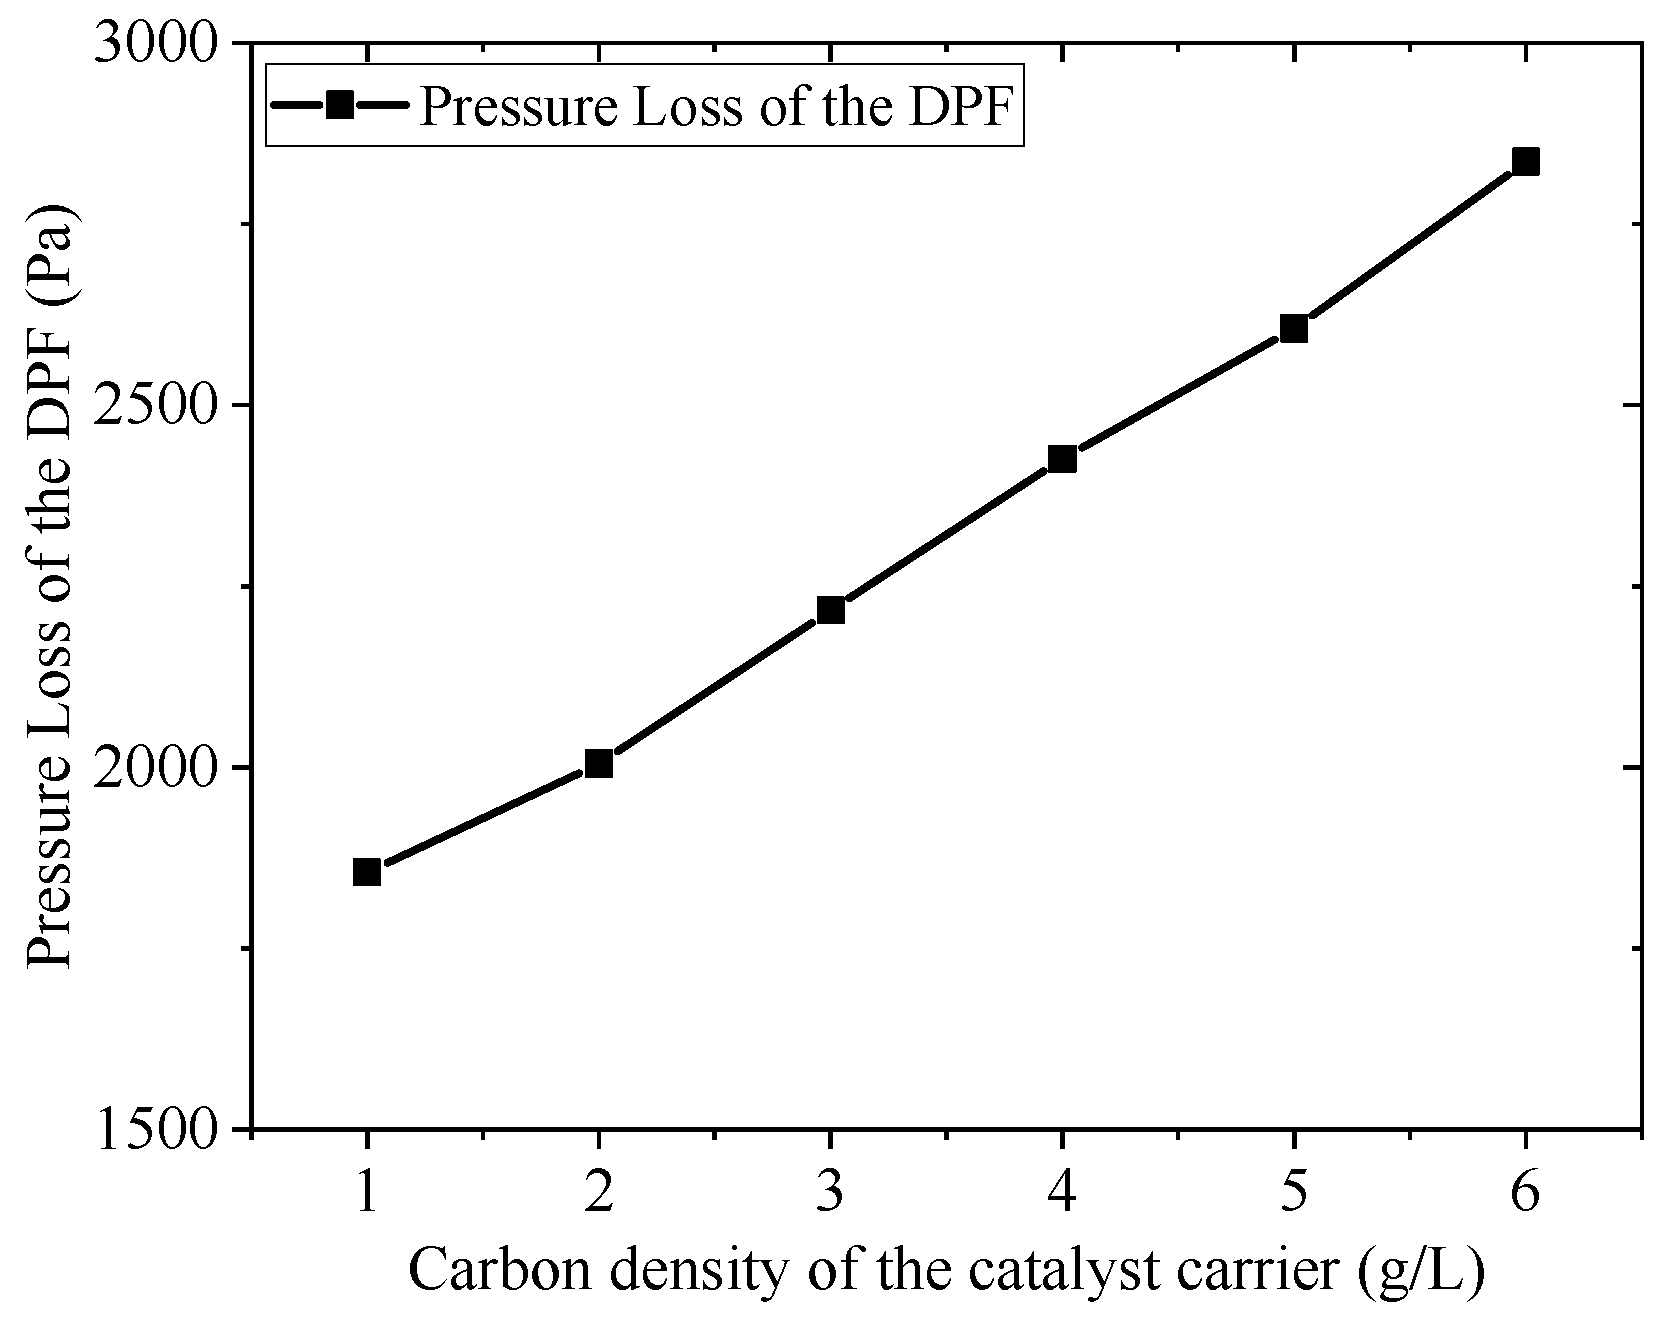
The correspondence between the carbon density of the catalyst carrier and pressure loss of the DPF is shown in Figure 13. As shown in Figure 13, the pressure loss of the DPF system is linearly related to the carbon loading of the catalyst, and the pressure loss of the reactor increases with the increase in the carbon density of the catalyst carrier.
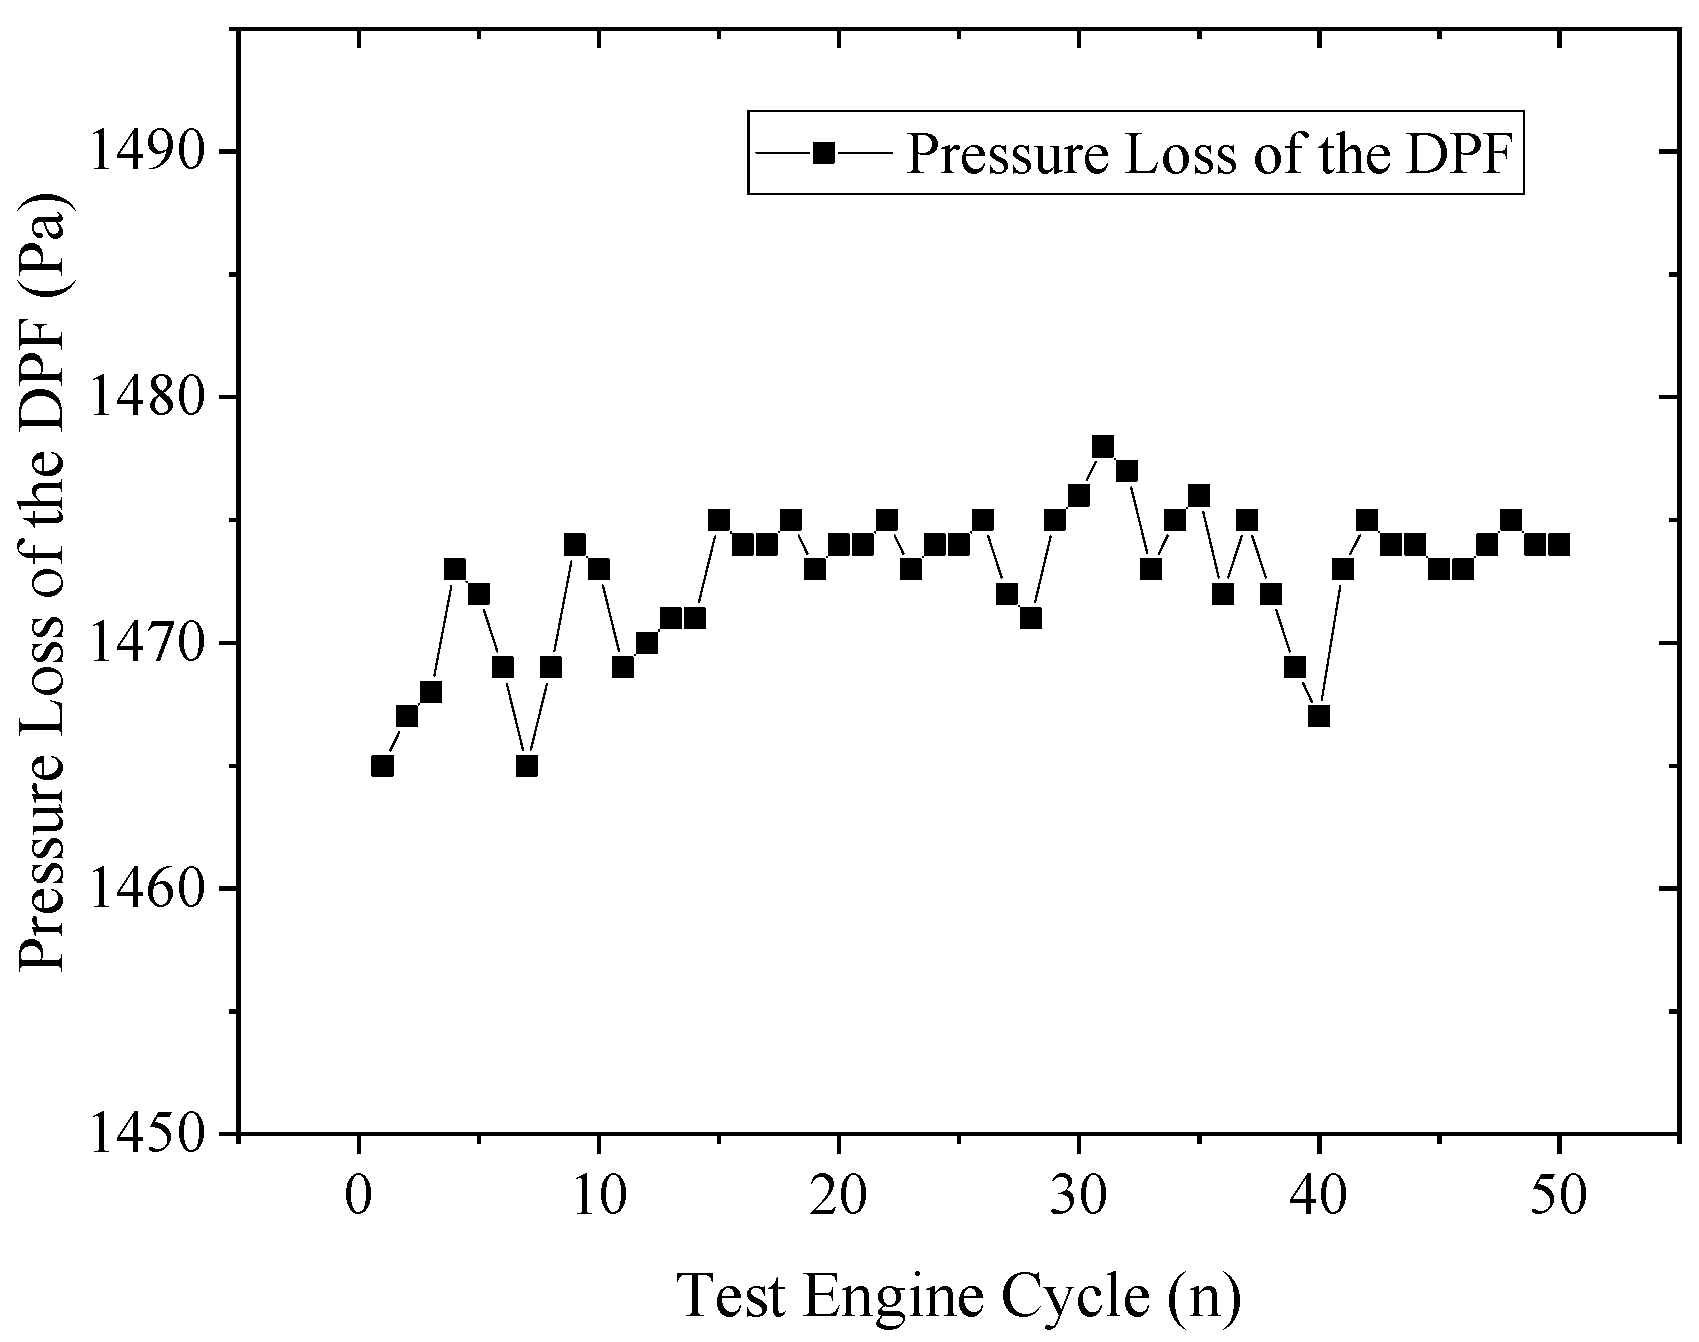
As can be seen from Figure 14, When the diesel engine load is 25%, the pressure loss of the reactor is variable and fluctuates around 1472 Pa. The carrier used by DPF is a porous medium material. After the exhaust enters from the inlet channel, it can only pass through the porous ceramic wall and exit from the adjacent outlet channel, while the particles are trapped on the porous wall. The DPF system can effectively remove the particulate matter emissions in the flue gas of the marine diesel engine, and the regeneration of the particulate matter in the DPF system can be achieved in different ways according to the differences in the exhaust characteristics of the diesel engine.

3.4. Reactor Flow Field and Catalyst Inlet Velocity Distribution Optimization

The DPF device in the experiment has the problem of high-pressure drop at 100% engine load, and further CFD simulation optimization is needed. The pressure drop results of the simulation model are kept the same as the experiments, so as to ensure that the CFD model can be used to optimize the internal flow field of the DOC+DPF reactor. The DPF system design requirements are velocity inhomogeneity ≤ 0.15 at DOC inlet cross section, homogeneity ≥ 0.85 reactor pressure loss ≤ 2200 Pa. In order to achieve the design goals of the DPF system, seven proposals (Case 1–Case 7) were compared to optimize the flow field inside the reactor.
The CFD optimization objectives are as follows: (1) To design a reasonable reactor structure, size, deflector or deflector plate arrangement position and combination form to make the uniformity at the DOC inlet section meet the design requirements given the reactor parameters (flue gas temperature, flow rate, DOC and DPF catalyst size and quantity). (2) Optimize the reactor size parameters and deflector arrangement position to meet the design requirements in terms of pressure loss of the reactor while satisfying the objective (1).
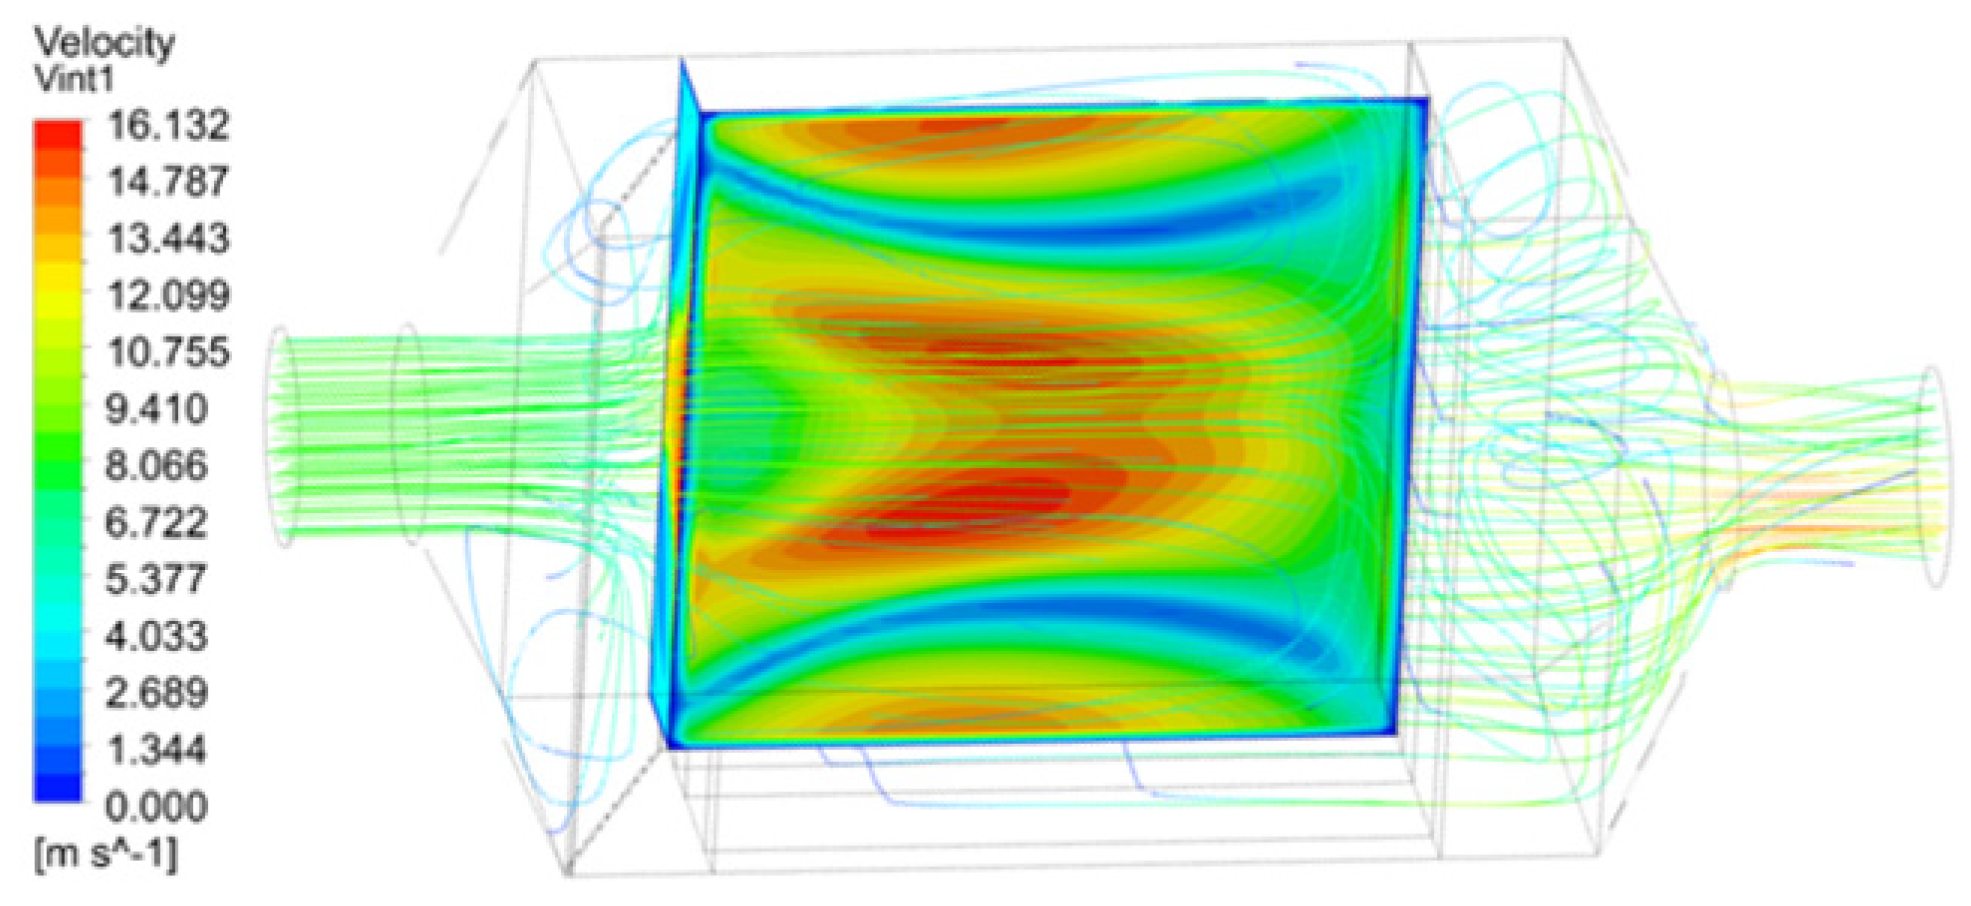
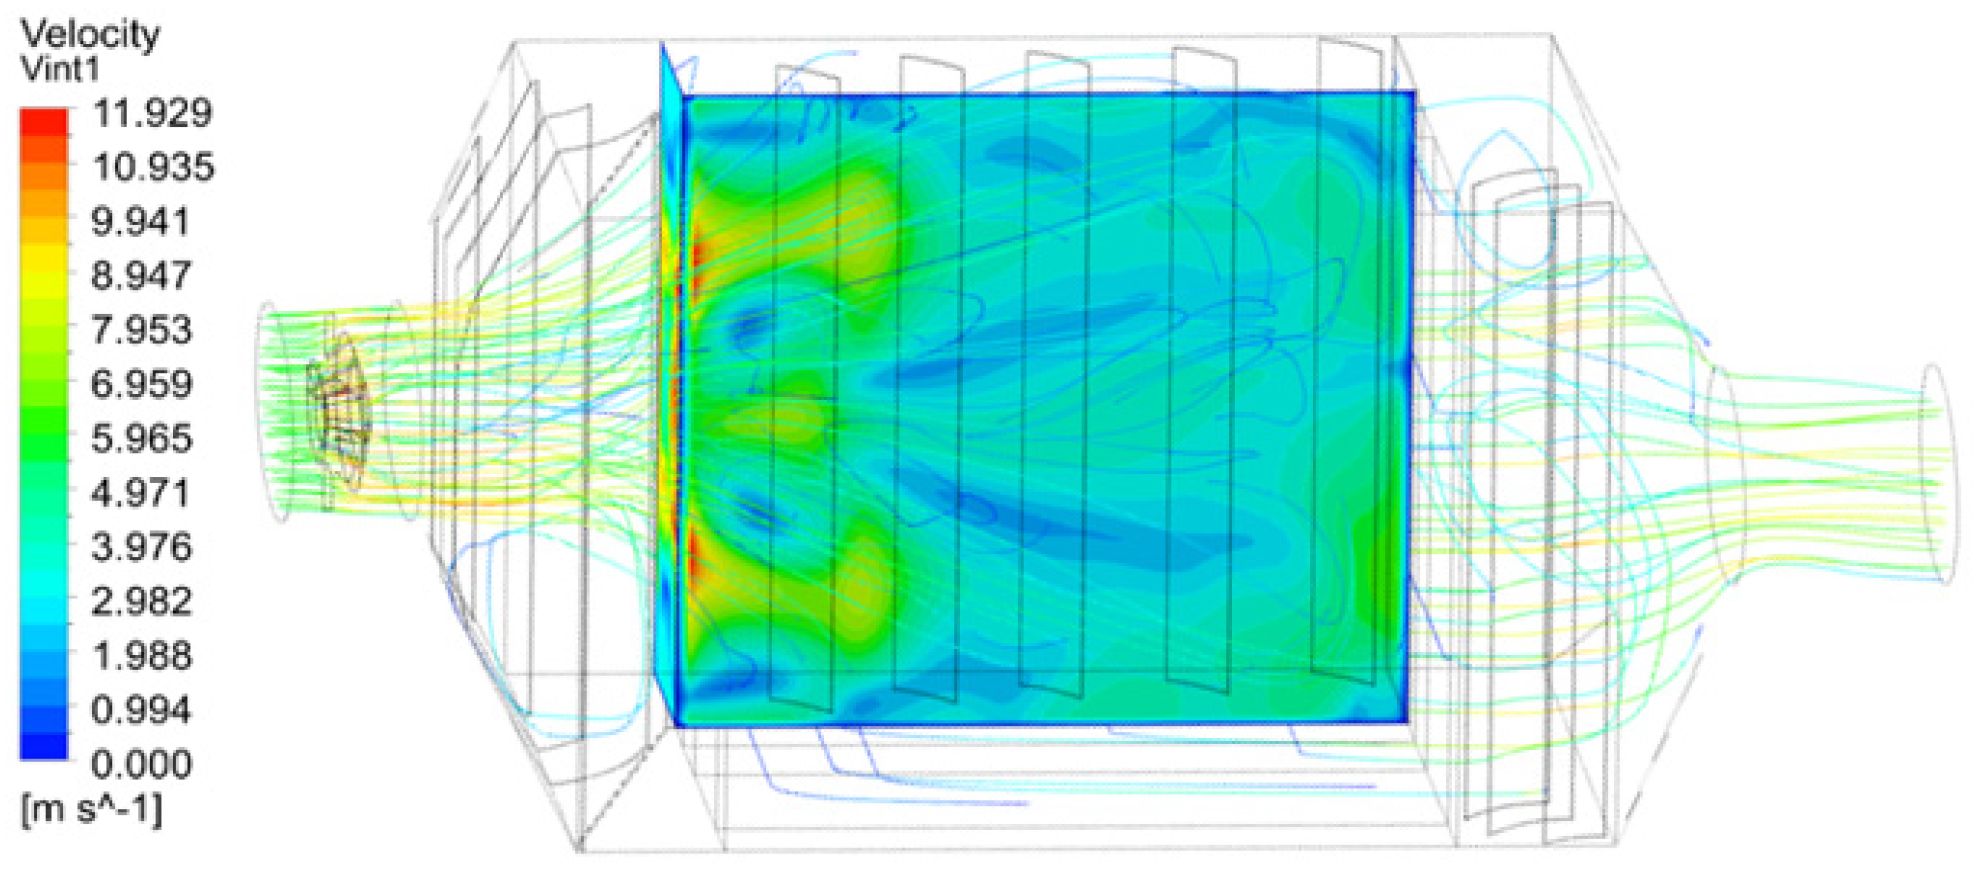
Optimization Case 1: Based on the original design scheme (no deflector, inlet deflector, DOC deflector and outlet deflector), the distance in front of the DOC catalyst inlet cut-off is increased to 300 mm. The velocity inhomogeneity of the reactor DOC inlet section and all other sections, the velocity distribution of the reactor DOC inlet section and the reactor pressure loss are shown in Figure 15.
As seen in Figure 15, after the DOC distance of the conventional reactor increases, a high-speed zone of about 16 m/s will be formed at the center of the DOC inlet cross-section. The velocity inhomogeneity of the DOC inlet cross is 0.382, and the velocity distribution is not uniform; the reactor pressure loss (except for DOC and DPF catalyst) is 406.5 Pa. It can be seen that after the DOC inlet distance of the conventional reactor increases, the reactor flow effect slightly decreases and fails to achieve the optimization target.
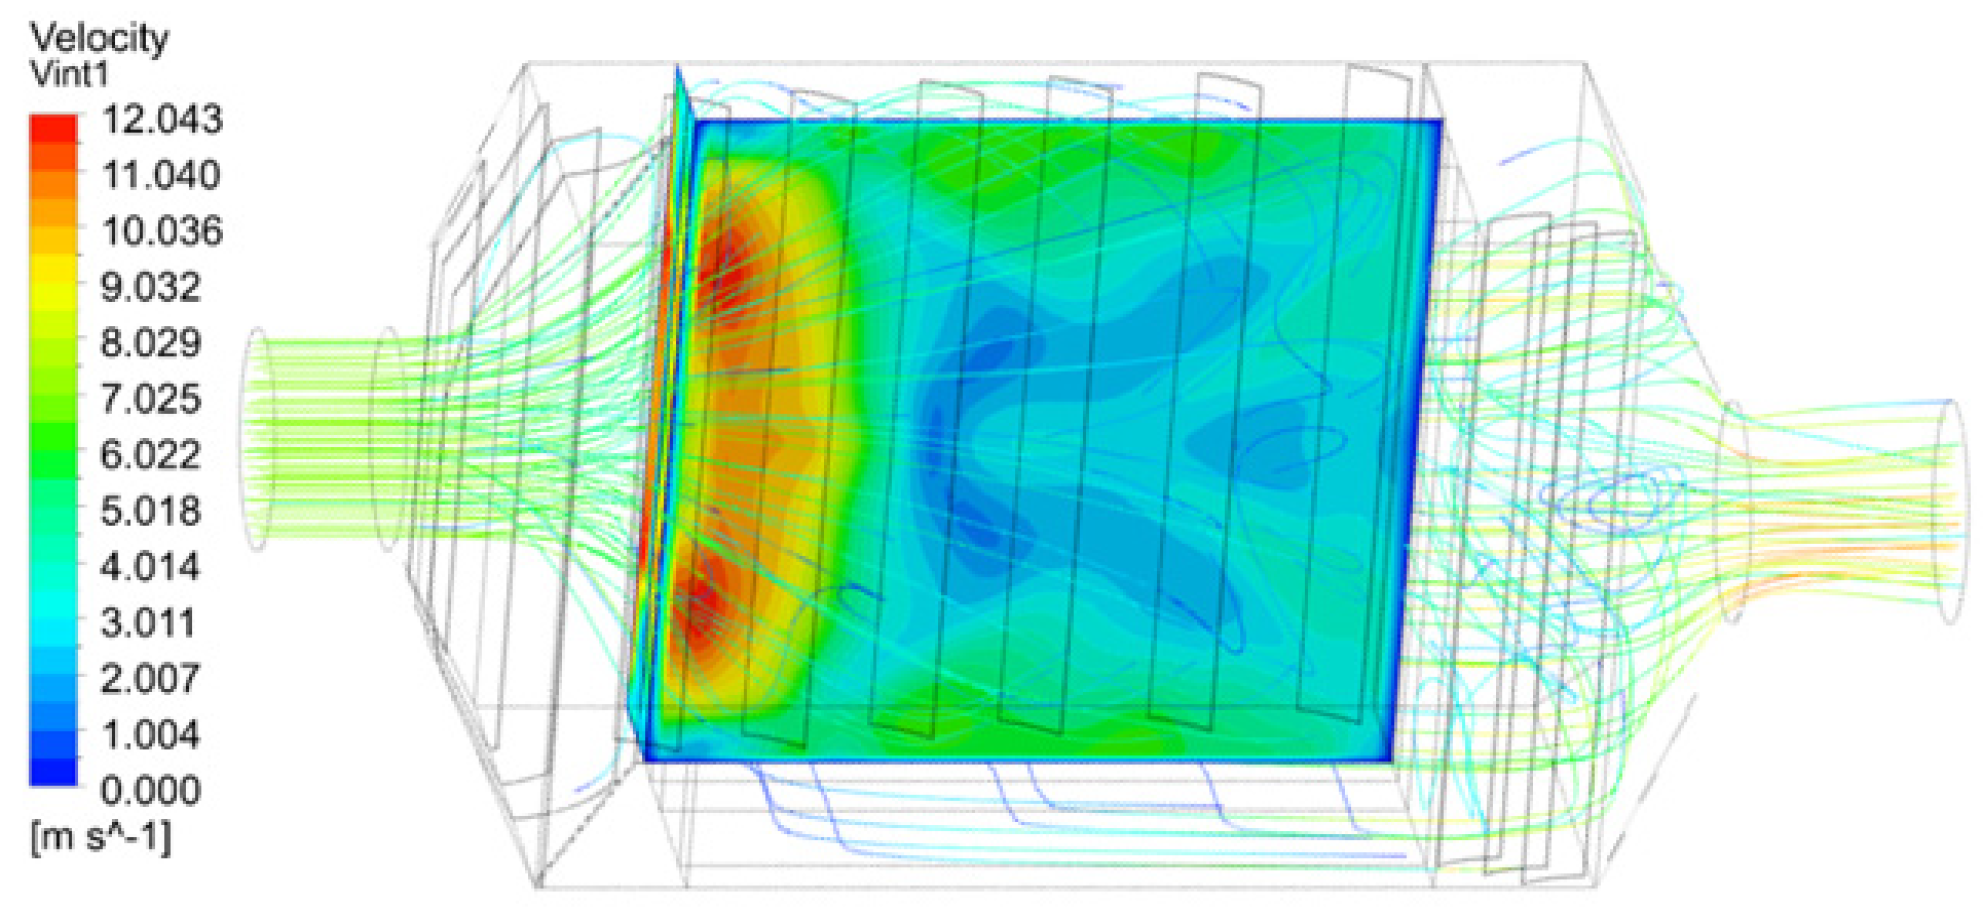
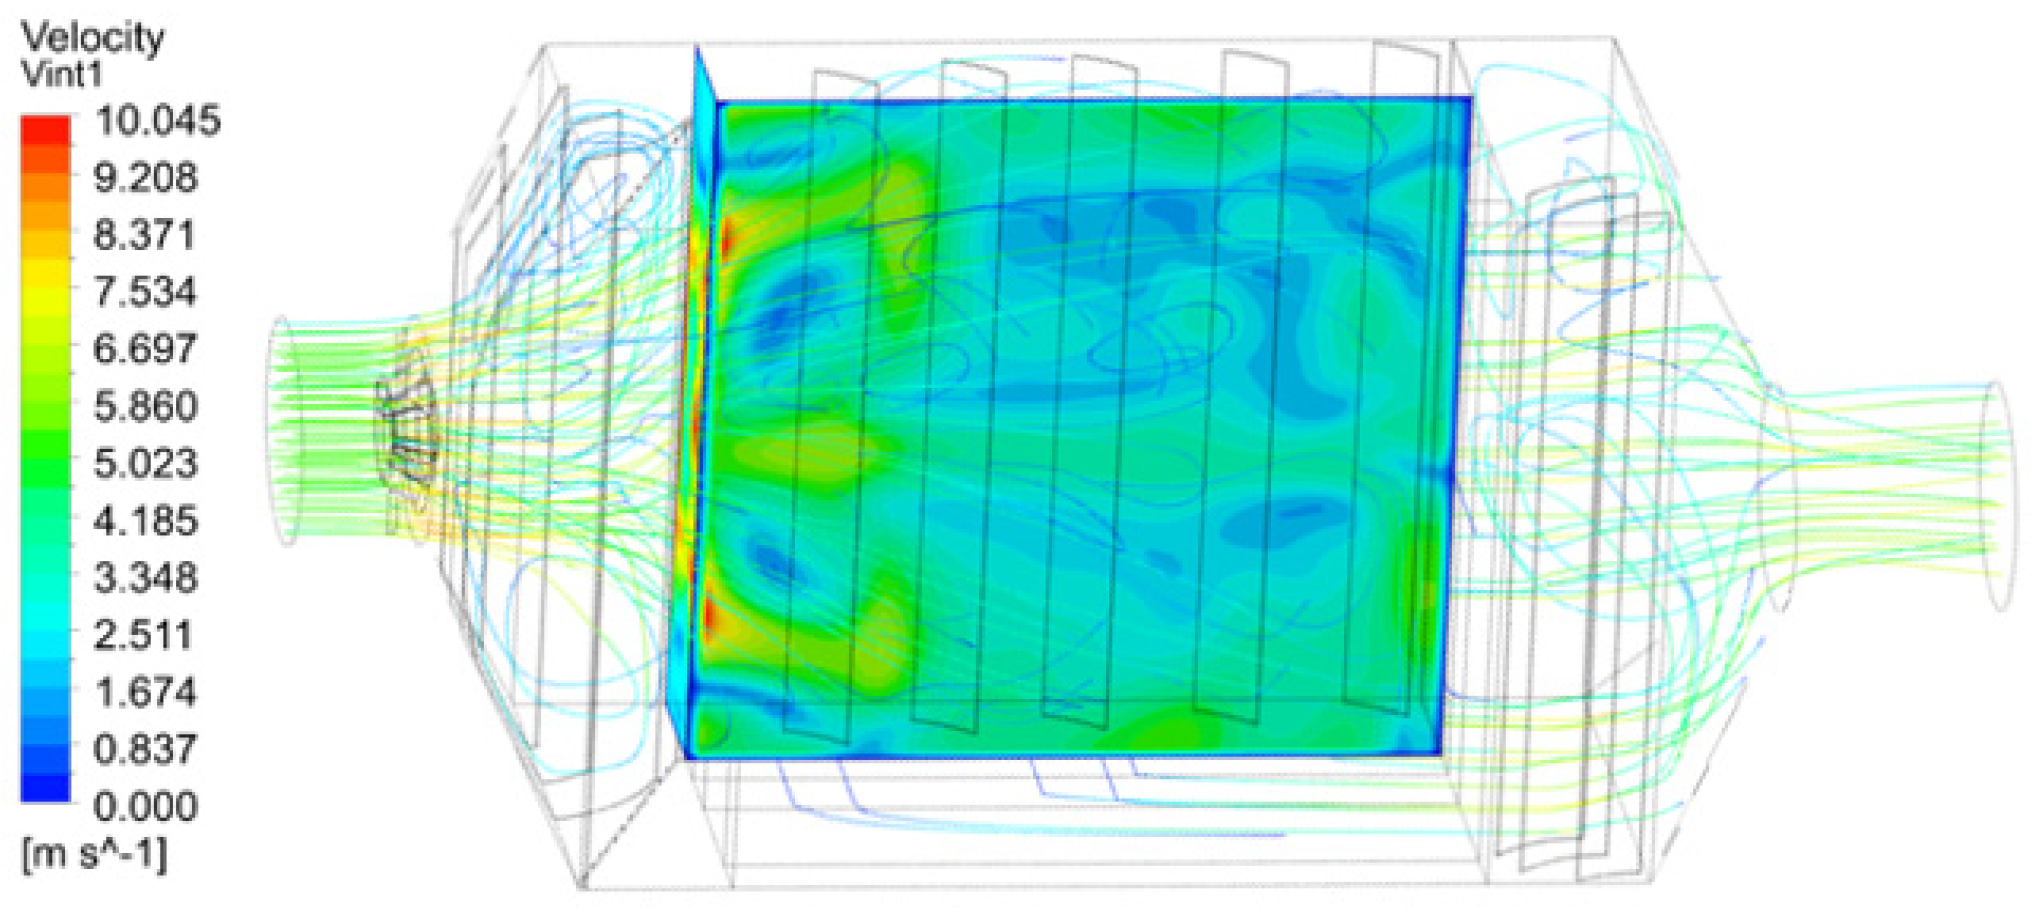
Optimization Case 2: Adding deflector clusters. On the basis of the conventional design scheme (no deflector, inlet deflector, DOC deflector and outlet deflector), the distance in front of the DOC catalyst inlet section is increased to 300 mm. The reactor DOC inlet cross-section velocity inhomogeneity and reactor pressure loss are slightly increased, and the flow effect is decreased. However, to facilitate the arrangement of the inlet deflector and the DOC deflector, the distance in front of the DOC catalyst inlet cutoff is still 300 mm. The velocity inhomogeneity of the reactor DOC inlet section and other sections, the velocity distribution of the reactor DOC inlet section and the reactor pressure loss are shown in Figure 16.
It can be seen from Figure 16 that after adding deflector clusters to the reactor, a high-speed zone of about 12 m/s will be formed at the DOC inlet section near the flue gas inlet side, and a low-speed zone of 0 m/s will be formed at the center of the section. The velocity inhomogeneity of DOC inlet section is 0.232, and the velocity distribution inhomogeneity is reduced but still does not meet the standard. The reactor pressure loss is 351.5 Pa. It can be seen that after adding deflector clusters the reactor flow effect increased but failed to meet the standard.
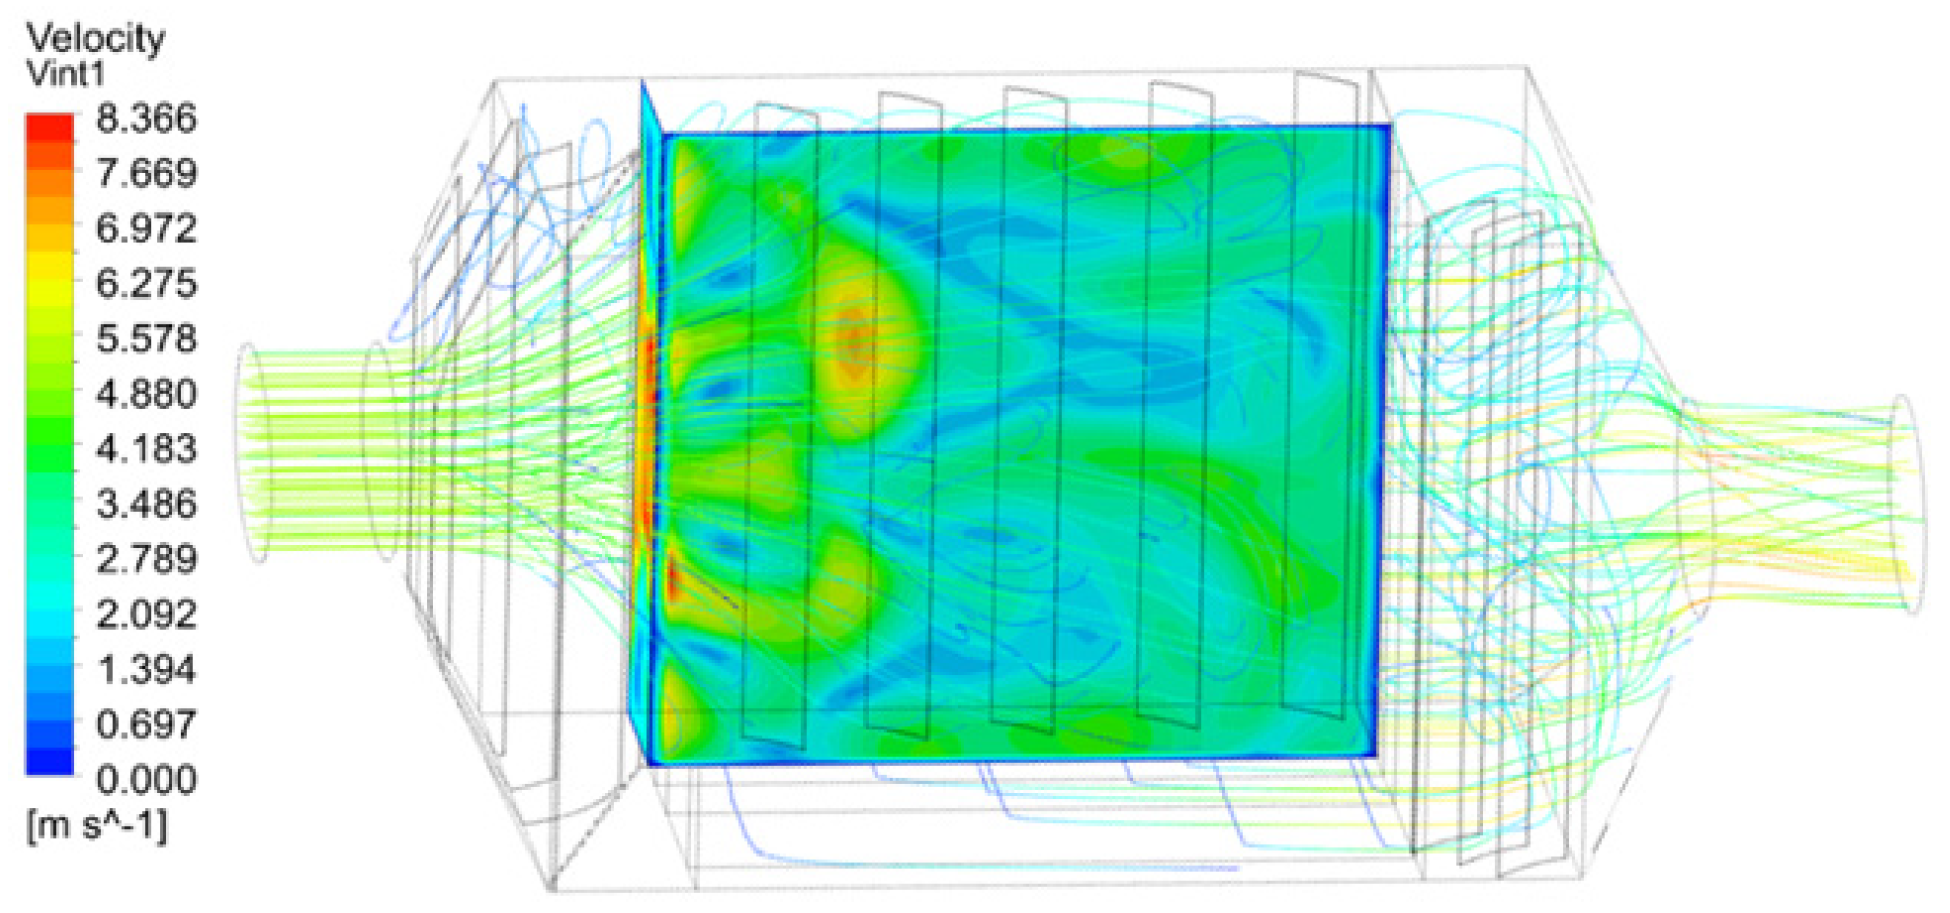
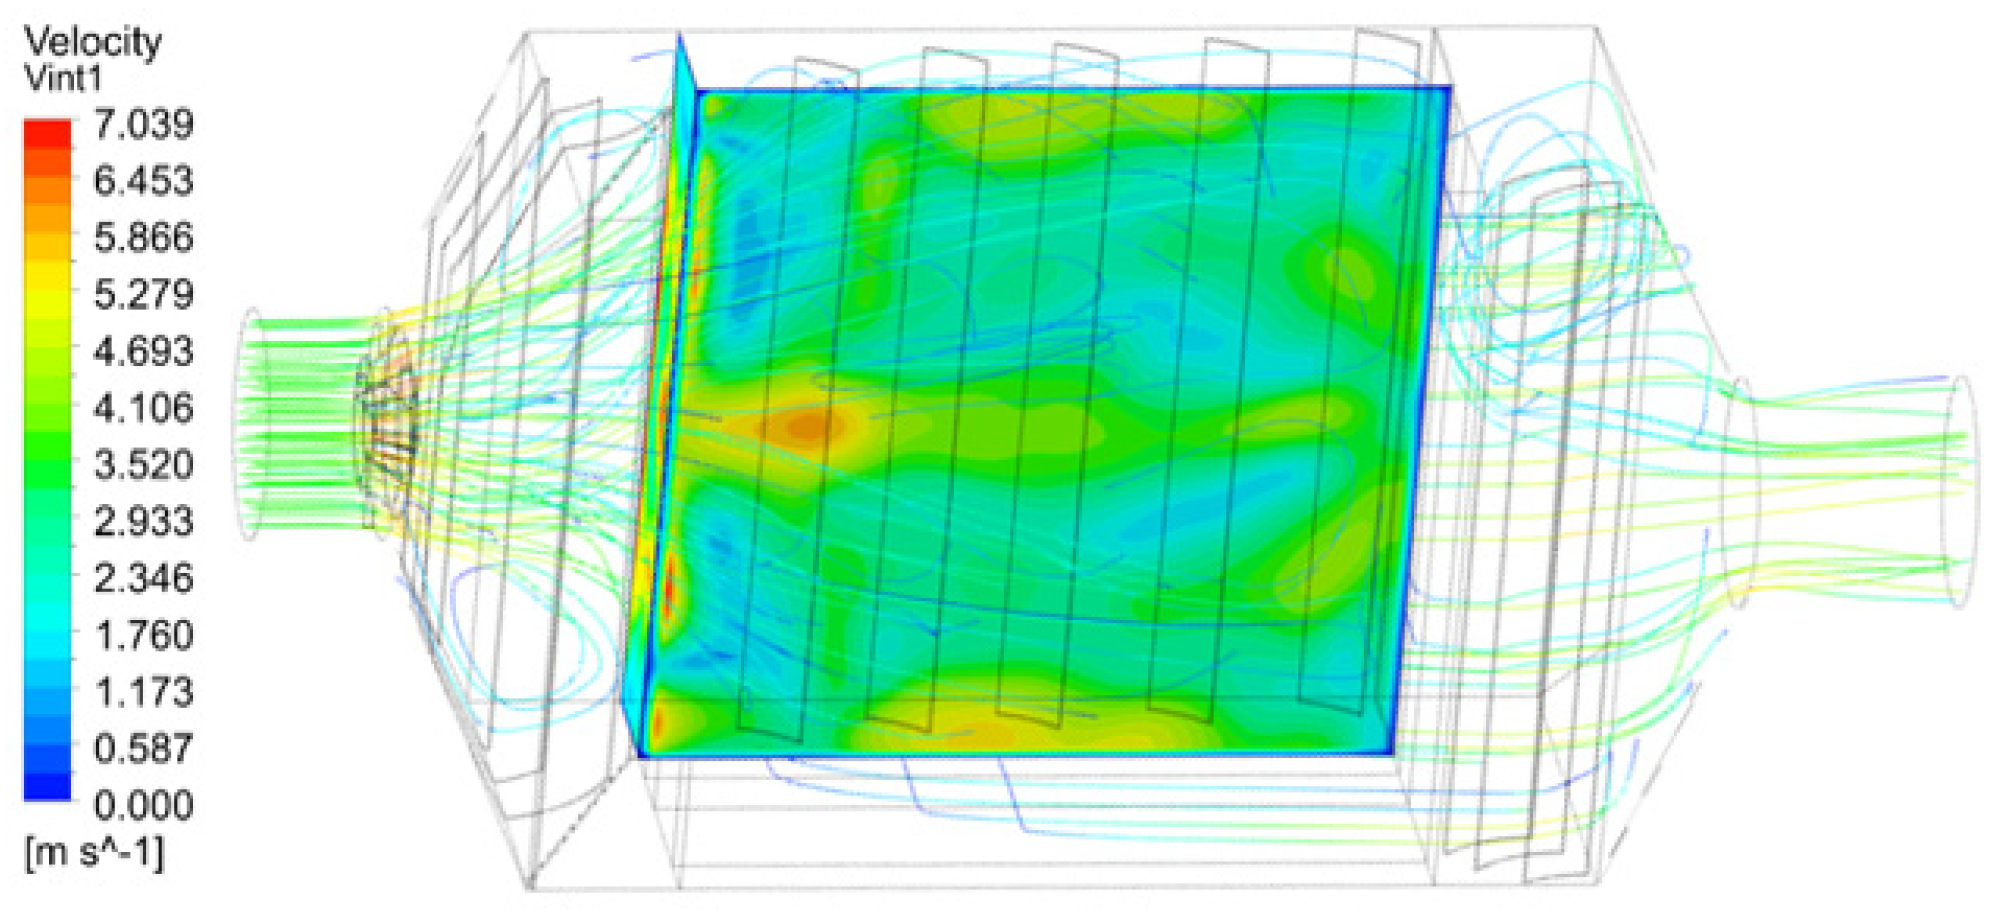
Optimization Case 3: Adjustment of the DOC deflector cluster. After adding the inlet deflector cluster, DOC deflector cluster and outlet deflector cluster in the conventional reactor, the reactor flow effect increased, but a high-speed zone of about 12 m/s is formed in the DOC inlet section near the flue gas inlet side, and a low-speed zone of 0 m/s is formed in the center of the section. Mainly the DOC deflector near the flue gas inlet side blocked the flue gas, therefore, the DOC deflector cluster needed to be optimized and adjusted. The velocity inhomogeneity of the DOC inlet section and all other sections, the velocity distribution of the reactor DOC inlet section and the reactor pressure loss are shown in Figure 17.
As can be seen from Figure 17, after adjusting the DOC deflector cluster (removing the flue gas inlet side), the high-speed zone of about 12 m/s near the flue gas inlet side of the DOC inlet section disappeared, and the low-speed zone of 0 m/s is formed at the center of the section to expand outward. The velocity inhomogeneity of the DOC inlet section is 0.182, and the velocity distribution inhomogeneity is reduced but still did not meet the standard. The reactor pressure loss is 306.3 Pa. It can be seen that the reactor flow effect increased after adjusting the DOC deflector cluster but failed to meet the standard.
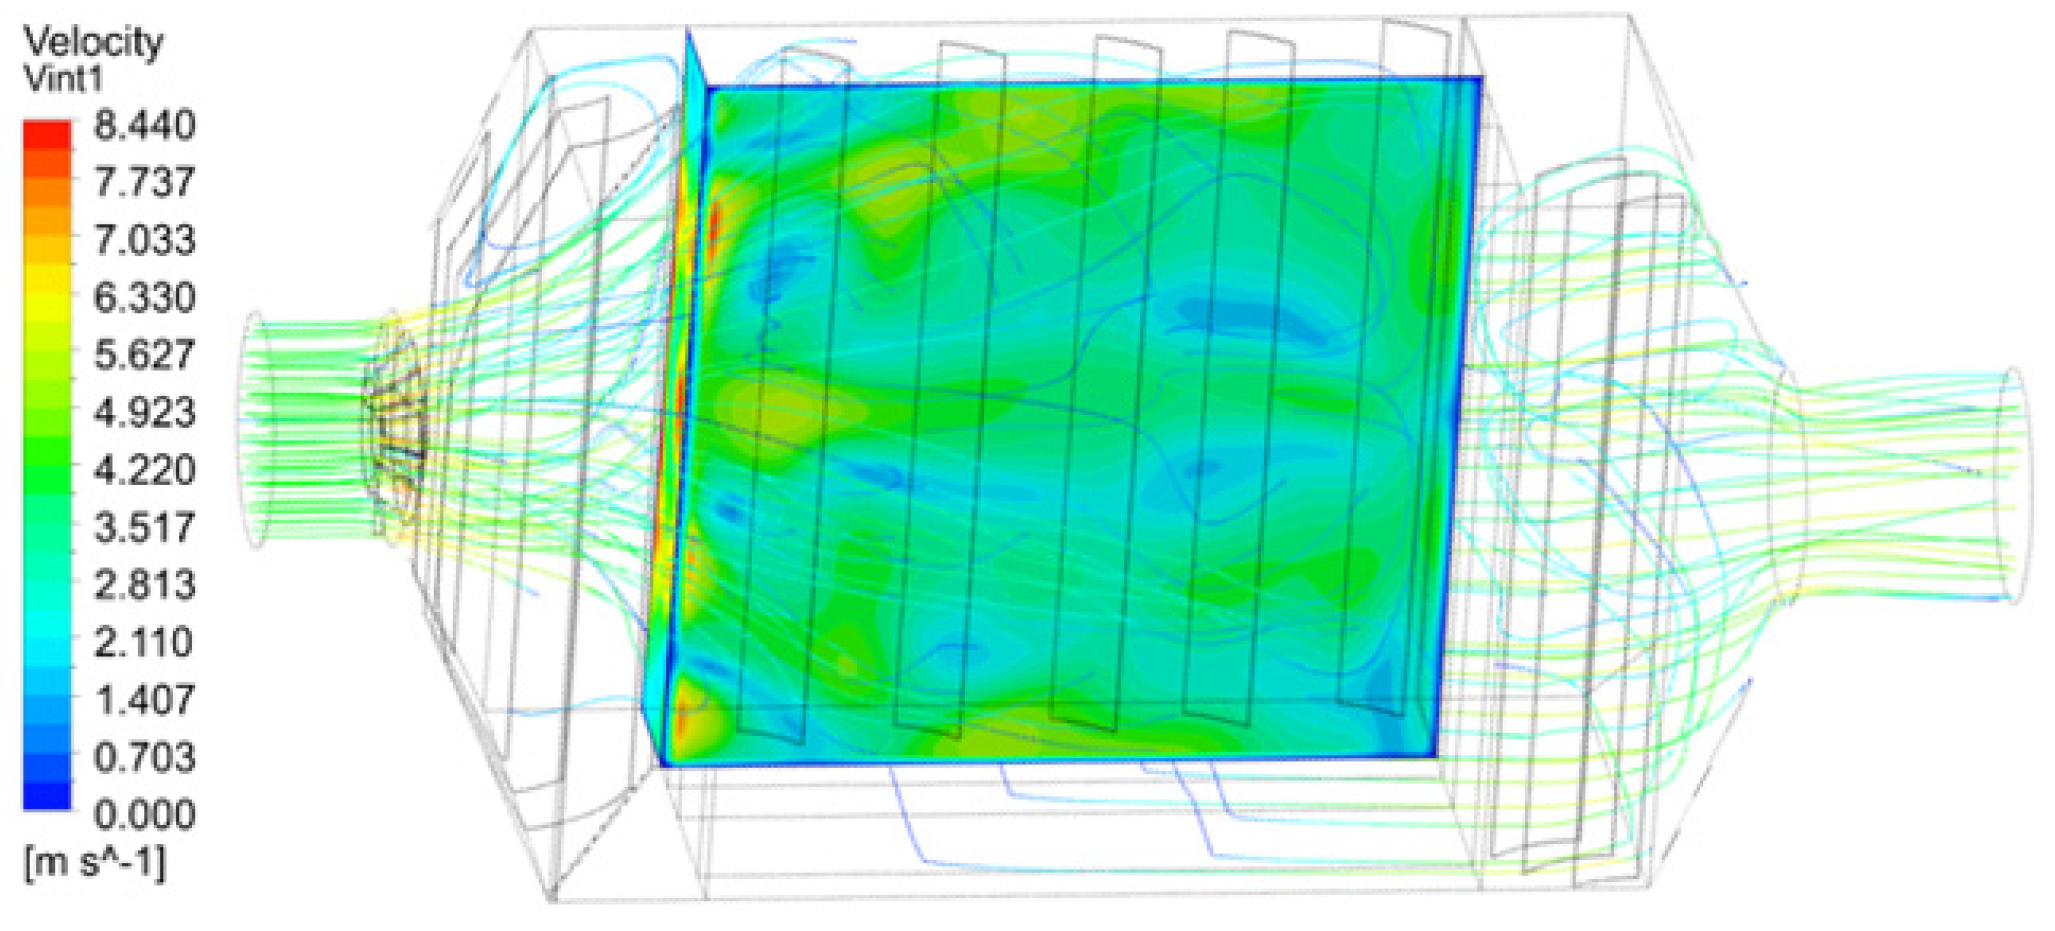
Optimization Case 4: Adding deflector. The reactor flow effect increased after adjusting the cluster of DOC deflectors but failed to meet the standard, and the optimization effect of purely adjusting the deflectors on the reactor flow field distribution is not obvious; therefore, the deflectors were added to the flue gas inlet side. The velocity inhomogeneity of the DOC inlet section and each other section, the velocity distribution of the reactor DOC inlet section and the reactor pressure loss are shown in Figure 18.
It can be seen from Figure 18 that after adding the inlet deflector, the DOC inlet section is close to a small range of high-speed zone of about 11 m/s at the flue gas inlet side, and a low-speed zone of 0 m/s is formed at the center of the section to expand outward. The non-uniformity of velocity at DOC inlet section is 0.163, and the non-uniformity of velocity distribution is reduced, but still not up to standard. The reactor pressure loss is 616.3 Pa. It can be seen that after adding the inlet deflector, the flow effect of the reactor increased, but failed to reach the standard, but the pressure loss increased significantly.
Optimization Case 5: Adjusting the deflector position. After adjusting the DOC deflector cluster, the reactor flow effect rose, but failed to meet the standard, and the optimization effect of simply adjusting the deflector on the reactor flow field distribution is not obvious; therefore, the deflector was added to the flue gas inlet side; the velocity inhomogeneity of the DOC inlet section and each other section, the velocity distribution of the reactor DOC inlet section and the reactor pressure loss are shown in Figure 19.
After adjusting the inlet deflector from Figure 19, the high-velocity zone of the DOC inlet section near the flue gas inlet side of about 10 m/s was reduced and a relatively high-velocity zone of about 7 m/s was formed. The low-velocity zone of 0 m/s formed at the center of the section expanded outward and disappeared, and the low-velocity zone of 0.5 m/s in the section increased. The velocity inhomogeneity of the DOC inlet section is 0.165, and the change of velocity distribution inhomogeneity was not obvious and still did not meet the standard. The reactor pressure loss is 543.3 Pa. It can be seen that after adjusting the inlet deflector, the range of high-velocity region above 10 m/s and low-velocity region at 0 m/s decreased, the velocity distribution converged to the average velocity, and the reactor pressure loss decreased.
From the analysis of the flow line in Figure 19, it can be seen that the second deflector of the inlet deflector cluster directs most of the flue gas close to the inlet side, therefore, it is necessary to adjust the position and angle of the second deflector of the inlet deflector, i.e., the deflector is shifted to the inlet side and the angle of the deflector is increased from 30 degrees to 45 degrees.
Optimization Case 6: As mentioned above, the inlet deflector cluster needs to be adjusted. The velocity inhomogeneity of the DOC inlet section and each other section, the velocity distribution of the reactor DOC inlet section and the reactor pressure loss are shown in Figure 20.
As seen in Figure 20, after adjusting the inlet deflector cluster (the position and angle of the second deflector of the inlet deflector should be adjusted), a relatively high-speed zone of about 6 m/s was formed in the DOC inlet cross section near the flue gas inlet side, and the low-speed zone of 0.5 m/s disappeared in the cut-off cross-section. The reactor pressure loss is 546.3 Pa. It can be seen that after adjusting the inlet deflector cluster, the velocity distribution of the DOC inlet section converged to the average velocity; and the reactor pressure loss did not increase. In order to further improve the velocity uniformity of the DOC inlet section, a relatively high-velocity zone of about 6 m/s was eliminated from the DOC inlet section near the flue gas inlet side (due to the large inlet ring inlet of the inlet deflector, which resulted in a central high-velocity flow). Therefore, the inlet deflector inner ring inlet diameter and angle need to be adjusted, i.e., the inlet inner ring angle is increased from 15 degrees to 20 degrees, and the inner ring inlet diameter is reduced from 50 mm to 35 mm.
Optimization Case 7: As mentioned before, the inner ring of the deflector needs to be adjusted. The velocity inhomogeneity of the DOC inlet section and each other section, the velocity distribution of the reactor DOC inlet section and the reactor pressure loss are shown in Figure 21.
As seen in Figure 21, after adjusting the inner ring of the inlet deflector (the angle of the inlet inner ring increased from 15 degrees to 20 degrees, and the diameter of the inlet inner ring decreased from 50 mm to 35 mm), the relatively high-speed area of about 6 m/s formed on the inlet side of the DOC inlet section near the flue gas inlet became 4 m/s. The velocity inhomogeneity of the DOC inlet section is 0.137, and the velocity distribution inhomogeneity decreased and met the standard. The reactor pressure loss is 545.3 Pa. It can be seen that after adjusting the inner ring of the inlet deflector, the velocity distribution of the DOC inlet section tends to the average velocity, and the reactor pressure loss does not increase. The reactor design meets the requirements.
In summary, the optimization of reactor flow field distribution by simply adjusting the deflector is not obvious through the comparison of the above seven proposals. 
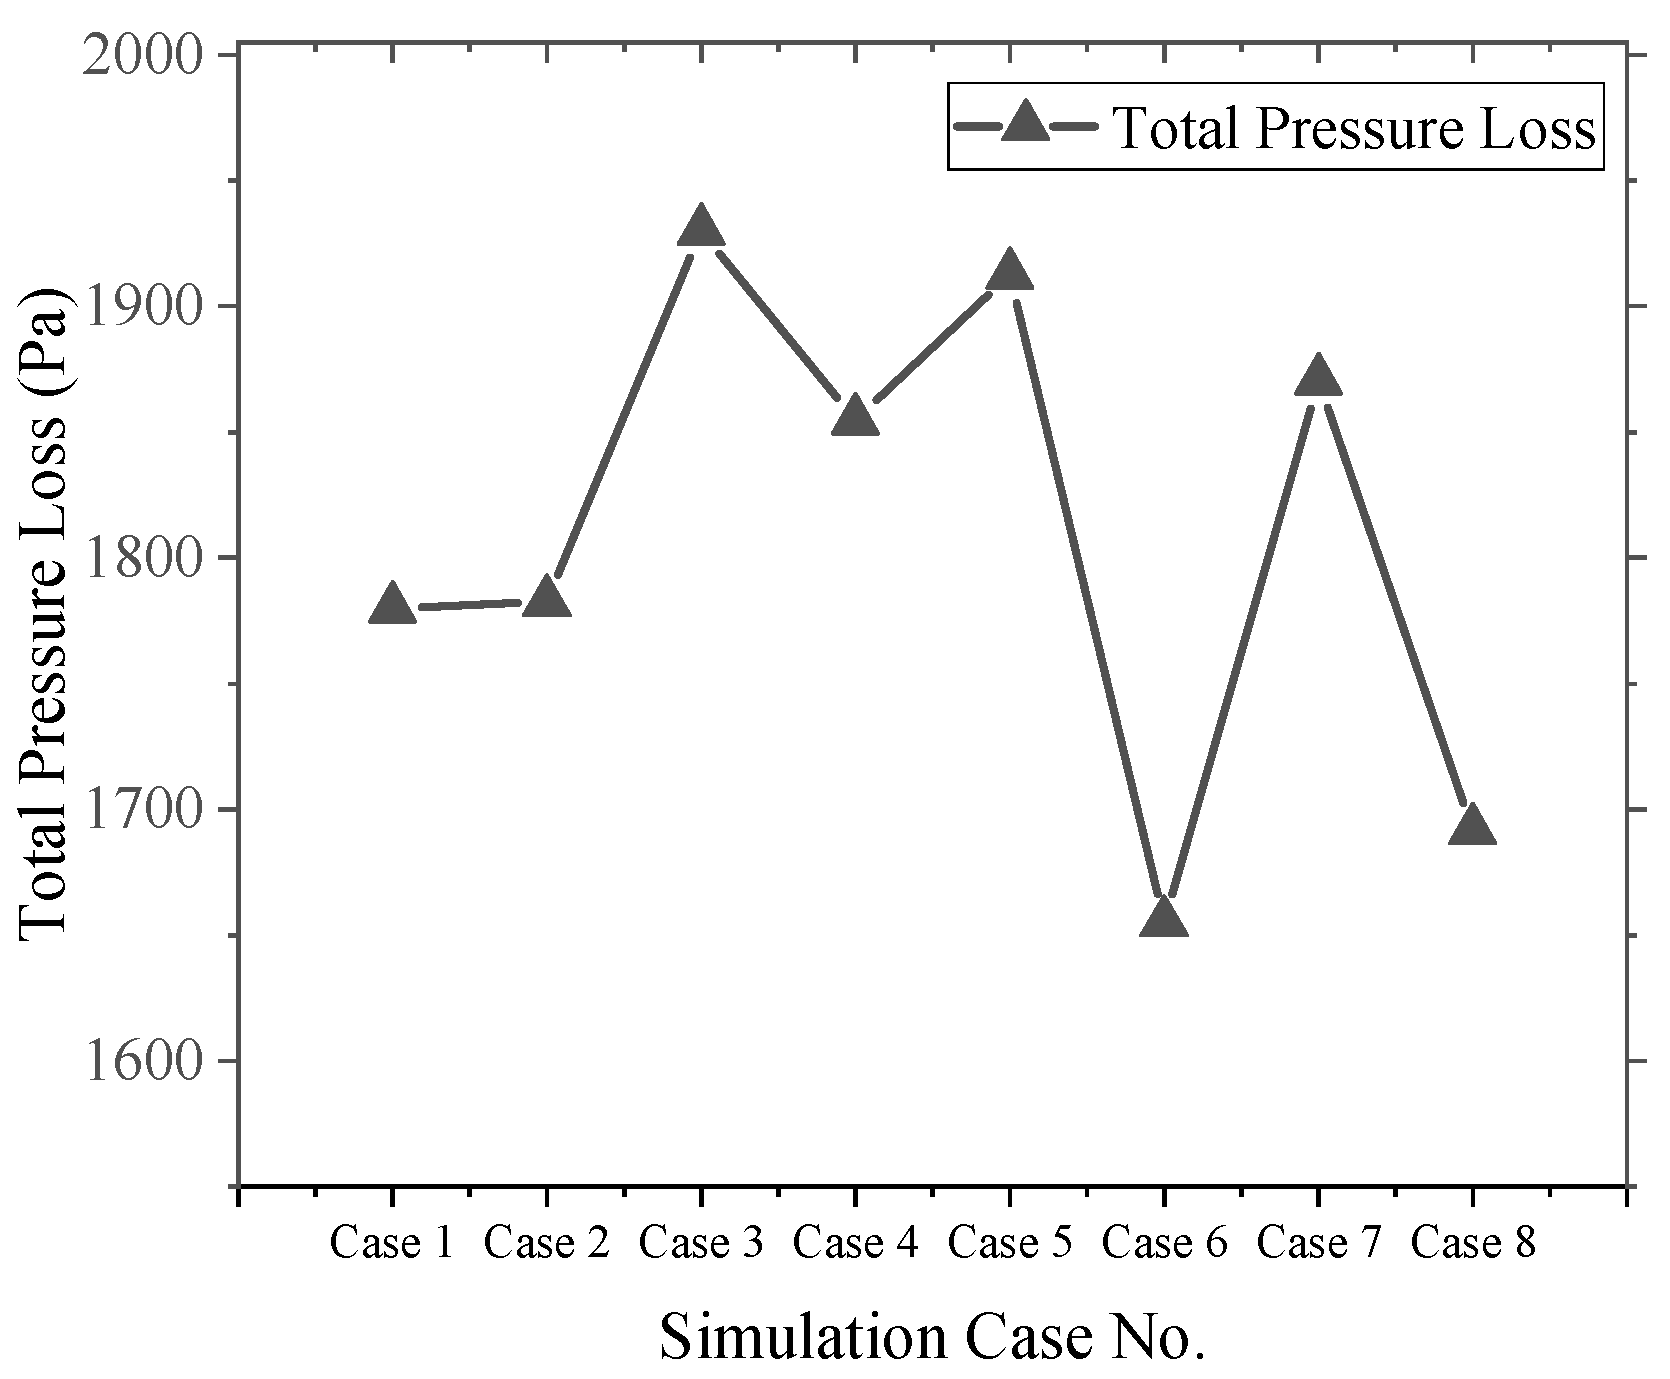
Figure 22 illustrates the total pressure loss of the DPF system. The reactor flow effect slightly decreased after the distance of the DOC inlet of the conventional reactor increased. After adjusting the inlet deflector cluster, the velocity distribution of the DOC inlet section converged to the average velocity, and the reactor pressure loss did not increase. After adjusting the inner ring of the inlet deflector, the velocity distribution of the DOC inlet section converged to the average velocity. The total pressure loss of the DPF system was low, and the DOC+DPF reactor design met the requirements.

4. Conclusions

In this paper, the Wärtsilä 20DF engine performance test and structure optimization of a low-pressure loss marine diesel particulate filter had been completed. CFD numerical simulation method was used to optimize the DPF structure through the evaluation indexes of the system velocity field, flow field distribution uniformity and system pressure drop. The main conclusions are listed as follows:
(1)
The particulate matter emissions of the diesel engine after adding the DPF system meet the requirements of the regulatory limit, and the back pressure of the diesel engine increases after adding the DPF system. The DPF system has good active regeneration performance and has achieved regeneration after repeated verification.
(2)
DOC+DPF catalyst scheme has an obvious removal effect on gaseous pollutants CO and THC in diesel engine exhaust gas, with removal rates of 95.73% and 88.50%, respectively. It has an obvious removal effect on NO, but the content of NO2 in flue gas after the reactor increases, and the total amount of NOx does not change.
(3)
This type of DOC+DPF catalyst scheme has a good trapping effect on diesel engine PM emissions. The designed catalyst space velocity value and PM trapping efficiency can reach 82.38%. With the increase in catalyst space velocity and reactor flow rate, the PM trapping efficiency of the DPF catalyst decreases.
(4)
Numerical simulation is a powerful tool for optimizing flow field, flow field distribution uniformity and system pressure drop. After CFD optimization, the new DPF structure can already achieve the expected design goals.

Author Contributions

Conceptualization, Z.Y.; methodology, Z.Y.; software, H.G.; formal analysis, Z.Y.; investigation, C.L.; data curation, H.G.; writing—original draft preparation, C.L. and Q.T.; writing—review and editing, H.C.; supervision, H.C.; project administration, Z.Y.; funding acquisition, Q.T. All authors have read and agreed to the published version of the manuscript.

Funding

This work was supported by the Science and Technology Commission of Shanghai Municipality and Shanghai Engineering Research Center of Ship Intelligent Maintenance and Energy Efficiency (NO. 20DZ2252300). This research was supported by the China financial support of Research on the bench test of particle capture and regeneration system (NO. H20210338).

Data Availability Statement

Not applicable.

Acknowledgments

Thanks to the Science and Technology Commission of Shanghai Municipality and Shanghai Engineering Research Center of Ship Intelligent Maintenance and Energy Efficiency for their support and funding.

Conflicts of Interest

The funders had no role in the design of the study; in the collection, analyses, or interpretation of data; in the writing of the manuscript, or in the decision to publish the results.

References

  1. Huang, Z.X.; Huang, J.L.; Luo, J.B.; Hu, D.; Yin, Z.B. Performance enhancement and emission reduction of a diesel engine fueled with different biodiesel-diesel blending fuel based on the multi-parameter optimization theory. Fuel 2022, 314, 122753. [Google Scholar] [CrossRef]
  2. Omidvarborna, H.; Kumar, A. Recent studies on soot modeling for diesel combustion. Renew. Sustain. Energy Rev. 2015, 48, 635–647. [Google Scholar] [CrossRef]
  3. Ono, K.; Matsukawa, Y.; Dewa, K.; Watanabe, A.; Takahashi, K.; Saito, Y.; Matsushita, Y.; Aoki, H.; Era, K.; Aoki, T.; et al. Formation mechanisms of soot from high-molecular-weight polycyclic aromatic hydrocarbons. Combust. Flame 2015, 162, 2670–2678. [Google Scholar] [CrossRef]
  4. Zhou, S.; Zhou, J.; Zhu, Y. Chemical Composition and Size Distribution of Particulate Matters from Marine Diesel Engines with Different Fuel Oils. Fuel 2019, 235, 972–983. [Google Scholar] [CrossRef]
  5. Maria, Z.; Jana, M.; Xiangyu, P.; Ravi Kant, P.; Benjamin, D. Impact of the 0.1% fuel sulfur content limit in SECA on particle and gaseous emissions from marine vessels. Atmos. Environ. 2016, 145, 338–345. [Google Scholar]
  6. Maria, A.; Kent, S.; Asa, M.H.; Erik, F. Characterization of particles from a marine engine operating at low loads. Atmos. Environ. 2015, 101, 65–71. [Google Scholar]
  7. Takuya, K.; Keiichiro, Y. Pilot-Scale Experiments of Continuous Regeneration of Ceramic Diesel Particulate Filter in Marine Diesel Engine Using Nonthermal Plasma-Induced Radicals. IEEE Trans. Ind. Appl. 2012, 5, 1649–1656. [Google Scholar]
  8. Yamada, H.; Inomata, S.; Tanimoto, H. Mechanisms of increased particle and VOC emissions during DPF active regeneration and practical emissions considering regeneration. Environ. Sci. Technol. 2017, 51, 2914–2923. [Google Scholar] [CrossRef] [PubMed]
  9. Laarnie, M.; Gert, J.; Hendryk, C.; Benjamin, S. Characteristics and temporal evolution of particulate emissions from a ship diesel engine. Appl. Energy 2015, 15, 5204–5217. [Google Scholar]
  10. Sippula, O.; Stengel, B.; Sklorz, M.; Streibel, T. Particle Emissions from a Marine Engine: Chemical Composition and Aromatic Emission Profiles under Various Operating Conditions. Environ. Sci. Technol. 2014, 48, 11721–11729. [Google Scholar] [CrossRef] [PubMed]
  11. Fridell1, E.; Kent, S. Measurements of abatement of particles and exhaust gases in a marine gas scrubber. J. Eng. Marit. Environ. 2016, 1, 154–162. [Google Scholar] [CrossRef]
  12. Di Natale, F.; Carotenuto, C.; D’Addio, L.; Jaworek, A.; Krupa, A.; Szudyga, M.; Lancia, A. Capture of fine and ultrafine particles in a wet electrostatic scrubber. J. Environ. Chem. Eng. 2015, 3, 8. [Google Scholar] [CrossRef]
  13. Zhu, R.J.; Cheung, C.S.; Huang, Z.H.; Wang, X.B. Experimental investigation on particulate emissions of a direct injection diesel engine fueled with diesel–diethyl adipate blends. J. Aerosol Sci. 2011, 42, 264–276. [Google Scholar] [CrossRef]
  14. Diantao, L.; Song, Z. Experimental study and model analysis sodium desulfurization in marine application. J. Chem. Eng. Jpn. 2015, 11, 909–914. [Google Scholar]
  15. Zhang, Y.H.; Zhong, Y.H.; Wang, J.; Tan, D.L.; Zhang, Z.Q.; Yang, D.Y. Effects of Different Biodiesel-Diesel Blend Fuel on Combustion and Emission Characteristics of a Diesel Engine. Processes 2021, 9, 1984. [Google Scholar] [CrossRef]
  16. Zhang, F. Emission factors for gaseous and particulate pollutants from offshore diesel engine vessels in China. Atmos. Chem. Phys. 2016, 16, 6319–6334. [Google Scholar]
  17. Zhou, J.; Zhou, S.; Zhu, Y. Experiment and Prediction Studies of Marine Exhaust Gas SO2 and Particle Removal Based on NaOH Solution with a U-Type Scrubber. Ind. Eng. Chem. Res. 2017, 56, 12376–12384. [Google Scholar] [CrossRef]
  18. Maria, Z. Particle and gaseous emissions from an LNG powered ship. Environ. Sci. Technol. 2016, 49, 12568–12575. [Google Scholar]
  19. Gysel, N.R.; Russell, R.L.; Welch, W.A.; Cocker, D.R., III. Impact of Aftertreatment Technologies on the In-Use Gaseous and Particulate Matter Emissions from a Tugboat. Energy Fuels 2015, 8, 546–551. [Google Scholar]
  20. Asadi, A.; Kadijani, O.N.; Doranehgard, M.H.; Bozorg, M.V.; Xiong, Q.; Shadloo, M.S.; Li, L.K.B. Numerical study on the application of biodiesel and bioethanol in a multiple injection diesel engine. Renew. Energy 2020, 150, 1019–1029. [Google Scholar] [CrossRef]
Figure 1. Wärtsilä 20DF Engine and DPF test system.
Energies 16 04336 g001
Figure 2. DOC catalyst package.
Energies 16 04336 g002
Figure 3. DPF catalyst package.
Energies 16 04336 g003
Figure 4. Comparison of diesel engine exhaust gas sampling filter paper before and after DPF.
Energies 16 04336 g004
Figure 5. PM emission and PM removal efficiency of flue gas before and after DPF system.
Energies 16 04336 g005
Figure 6. Removal efficiency of DPF system catalyst for gaseous pollutants.
Energies 16 04336 g006
Figure 7. DPF regeneration effect test.
Energies 16 04336 g007
Figure 8. Change of reactor pressure loss during DPF regeneration effect test.
Energies 16 04336 g008
Figure 9. DPF catalyst active regeneration durability test results.
Energies 16 04336 g009
Figure 10. Number-size distribution of PM from 20DF engine under 25% load.
Energies 16 04336 g010
Figure 11. Number-size distribution of PM from 20DF engine under 50% load.
Energies 16 04336 g011
Figure 12. Number-size distribution of PM from 20DF engine under 75% load.
Energies 16 04336 g012
Figure 13. Carbon density of the catalyst carrier.
Energies 16 04336 g013
Figure 14. Pressure loss of the DPF.
Energies 16 04336 g014
Figure 15. Case 1: Velocity distribution when the distance before the DOC catalyst inlet section is 300 mm.
Energies 16 04336 g015
Figure 16. Case 2: Flow effect of the reactor after adding deflector cluster.
Energies 16 04336 g016
Figure 17. Case 3: Flow effect of reactor after adjusting DOC deflector cluster.
Energies 16 04336 g017
Figure 18. Case 4: Reactor flow effect after adding deflector.
Energies 16 04336 g018
Figure 19. Case 5: Reactor flow effect after adjusting the deflector position.
Energies 16 04336 g019
Figure 20. Case 6: Adjust the flow effect of the inlet deflector cluster reactor.
Energies 16 04336 g020
Figure 21. Case 7: Adjustment of the flow effect of the inner ring reactor of the deflector.
Energies 16 04336 g021
Figure 22. Total pressure loss of DPF system.
Energies 16 04336 g022
Table 1. Technical Main data for Wärtsilä 20DF engine.
ParameterValue
Engine typeW6L20DF
ApplicationAUX(D2)
Bore200 mm
Stroke280 mm
Cylinder Number6
Rated speed1200 r/min
Rated power1060 kW
Compression Ratio12
Methane number (MN)≥80
Table 2. Properties of engine-tested equipment.
Tested EquipmentTypeManufacturerAccuracy
DynamometerG630Cence, Changsha, China-
Gas analyzerAMA i60AVL List GmbH, Graz, Austria±10.000 P/cm3
Intake flowmeterGFF20GEFRUN, Provaglio d’Iseo, Italy±1.5%FS
Fuel consumption meterFC2210Cence, Changsha, China±0.2%FS
Exhaust gas samplerSPC478AVL List GmbH, Austria-
Particle weighing roomRXCH500RXTECH, Beijing, China±1%FS
Particle weighing scaleMAS2.7S-0CE-DFSartorius, Göttingen, Germany±0.1 μg
Differential pressure sensorPMD55E+H, Lörrach, Germany±0.01%FS
Table 3. DOC Catalyst design parameters.
ParameterValue
ManufacturerGrace Davison
Carrier materialCordierite
Recommended temperature300–500 °C
Overall dimension150 × 150 × 75 mm
Cell density200 cpsi
Noble metals content5 g/tf3
Design space velocity51,746 h−1
Number of layers16 (4 × 4)
Table 4. DPF Catalyst design parameters.
ParameterValue
BrandGrace Davison
Carrier materialCordierite
Recommended temperature350–550 °C
Overall dimension150 × 150 × 300 mm
Cell density200 cpsi
Noble metals content5 g/tf3
Design space velocity14,000 h−1
Number of layers16 (4 × 4)
Table 5. PM emission measurement and exhaust gas parameters of a diesel engine with different loads.
Engine LoadPM Emission before DPFPM Emission after DPFPM Capture EfficiencyReactor Pressure LossExhaust Gas TemperatureExhaust Gas Air Velocity in ReactorSpace Velocity in DOC CatalystSpace Velocity in DOC Catalyst
Unit(g/kWh)(g/kWh)(%)(Pa)(°C)(m/s)(h−1)(h−1)
1000.4320.276536.004656404.53.24174,01743,504
750.56830.186667.173358385.52.83152,21138,052
650.64170.171373.3128913722.58138,66734,666
500.76370.187875.4122933322.13114,77628,694
251.11480.242878.221471306.51.5985,57521,393
01.2370.218082.38971211.51.1461,55215,388
Table 6. DPF regeneration performance test process record.
NumberTest ConditionTest Working ConditionsTime of Duration
1Carbon load condition65% Load, Tinlet = 140 °C180 min
2First cycle regeneration50% Load, Tinlet = 280 °C30 min
65% Load, Tinlet = 300 °C60 min
65% Load, Tinlet = 320 °C90 min
65% Load, Tinlet = 340 °C45 min
3Second cycle regeneration65% Load, Tinlet = 230 °C38 min
65% Load, Tinlet = 280 °C29 min
65% Load, Tinlet = 300 °C26 min
65% Load, Tinlet = 320 °C23 min
65% Load, Tinlet = 340 °C29 min
65% Load, Tinlet = 360 °C18 min
65% Load, Tinlet = 380 °C13 min
Disclaimer/Publisher’s Note: The statements, opinions and data contained in all publications are solely those of the individual author(s) and contributor(s) and not of MDPI and/or the editor(s). MDPI and/or the editor(s) disclaim responsibility for any injury to people or property resulting from any ideas, methods, instructions or products referred to in the content.

