Article

Techno-Economic Assessment of a Hybrid Offshore Wind–Wave Farm: Case Study in Norway

1
Department of Mechanical Engineering, School of Engineering, Aalto University, 02150 Espoo, Finland
2
SDU Mechatronics and Center for Industrial Mechanics, Department of Mechanical and Electrical Engineering, University of Southern Denmark, 6400 Sønderborg, Denmark
*
Author to whom correspondence should be addressed.
Energies 2023, 16(11), 4316; https://doi.org/10.3390/en16114316
Submission received: 4 May 2023 / Revised: 19 May 2023 / Accepted: 22 May 2023 / Published: 25 May 2023
(This article belongs to the Special Issue Wave Energy: Theory, Methods, and Applications)

Abstract

:
Recent years have seen the development of cutting-edge technology, such as offshore wind turbines and wave energy converters. It has previously been investigated whether integrating offshore wind turbines with wave energy converters is feasible. Diversifying the sources of offshore renewable energy also lowers investment costs and power fluctuation. This paper focuses on the development of a hybrid wind–wave energy system as well as the development of a techno-economic model to assess the system performance for a case study. A levelized cost of energy is calculated for the hybrid system by the Norwegian North Sea based on current knowledge about the technology costs. The economic benefits of sharing the common components of a wind-wave hybrid farm are inspected. Combinations of different wind–wave offshore hybrid systems are presented. Three technologies for both offshore wind turbines and wave energy converters are compared to find the most cost-efficient device pairing. The potential benefits of a shared infrastructure and the operational expenses are included in the evaluation. The combination yielding the lowest production cost of the cases studied is a combination of 160 MW of wind power and 40 MW of wave power, with a levelized cost of energy of EUR 107/MWh when the shared costs are 15%. In the study region, the average electricity price in Autumn 2022 was over EUR 300/MWh due to the European energy crisis.

1. Introduction

Renewable energy is seen as a key means to reduce CO2 emissions and mitigate climate change in Europe. The EU has set binding country-specific targets of increasing the share of renewable energy used in terms of final consumption to 20% by 2020 [1]. This target was met and a new, more ambitious EU-level target of 55% of final energy consumption is set for the year 2030 [2]. Many central European countries are already facing a lack of available land space for the construction of wind power technology, and the construction of large wind parks is moving offshore. For instance, the Gruissan floating offshore wind farm project, which entails the development of a 30 MW power-generating floating offshore wind farm in France [3], and the second stage of the Hornsea zone, which is the offshore wind farm known as Hornsea Two in the UK. It is situated next to Hornsea One, the biggest offshore wind farm in the world, which lies about 89 km off the coast of Yorkshire in the North Sea. Other examples include Moray East’s 950 MW capacity which can power around 950,000 houses in the UK and saves the annual emission of 1.4 million tonnes of CO2 and the RWE-built Triton Knoll offshore wind farm, which will have an 857 MW capacity. This project will provide enough electricity annually to power 800,000 households [4].
For the over 2.4 billion people who live within 100 km of the coast, or 40% of the world’s population, ocean energy may offer a practical way to combat climate change while promoting a more sustainable future [5]. The marine energy market is still in its infancy, and it is a developing sector of the economy. Tidal streams and ocean waves are two marine energy sources that have been shown to offer a lot of promise in helping the European energy grid [6]. Since ocean energy has a theoretical resource potential of roughly 130,000 TWh of power annually, or more than double the world’s current electricity consumption, it could theoretically supply both the current and projected levels of global electricity demand [7]. In recent years, countries by the North Sea have started to develop several demo sites for wave energy, including Waves4Power in Norway [8], Blue X in the UK [9], and WaveStar in Denmark [10].
The mix of power produced in the EU may include a significant amount of wave and offshore wind energy. By 2050, they are anticipated to supply up to 20% of the national demand in some nations and 15% of the electrical consumption in Europe. The installed capacity of offshore wind is now 12 GW, and the European Commission estimates that by 2050, there will be 300 GW of offshore wind and 40 GW of marine energy [11]. The growth of the offshore renewable energy sector is also encouraged by EU policy funding. For instance, 37% of EUR 672.5 billion has been designated for the green transition to a more sustainable future by the “NextgenerationEU” Economic Recovery Plan [11].
Hybrid systems are becoming more popular in terms of new concept ideas for effective offshore energy harnessing, as demonstrated by, e.g., the hybrid energy platform Poseidon [12,13,14,15,16,17,18,19]. The idea of a hybrid system is that it can tackle multiple problems that arise with offshore technology, one example being the motion effect on floating offshore wind turbines caused by wave loads. A hybrid platform with wave energy converters (WECs) forming a barrier in front of wave turbines could extract the energy and enable the better functioning of the offshore turbines [18]. In addition, the variations of wind energy and wave energy are not correlated, thus it can be expected that a hybrid farm could utilise the existing transmission connections more efficiently than either technology alone. Furthermore, wind power has significant landscape and noise impacts, which do not exist at the same scale with wave power production.
Norway is not an EU member country, but it is an important electricity producer country for both the Nordic electricity market and the north-western European market due to its abundant hydropower reserves and growing transmission connections to the adjacent regions. In fact, imports from southern Norway have been used to balance the increasing wind power production in Denmark, for example, for a long time already. In 2021, 91% of the total electricity production in Norway was hydropower. Norway generated 151 TWh electricity and exported 26 TWh. Denmark received 8.1 TWh from Norway, Sweden 7.8 TWh, and Germany 4.4 TWh. The new transmission connection to the UK was put into use in October 2021, aimed largely at exports to balance wind power in the UK market [20,21].
However, the potential for new hydropower construction in Norway, similarly to the other hydropower-rich Nordic countries, Sweden and Finland, is limited: the existing potential sites have mostly been built upon and expansion is often restricted by the environmental protection aspects. The main possibilities for increasing hydropower generation lie in the modernization of existing equipment. In addition, the construction of onshore wind power technology is facing increasing opposition in Norway; indeed, the supreme court of Norway recently cancelled the licenses for two existing wind power parks in Norway due to their adverse impacts on the traditional livelihood of reindeer herding of the indigenous Sami people [22].
Europe is currently facing a serious energy crisis due to the Russian war in Ukraine and the related cessation of energy imports from Russia. Due to the more and more serious lack of adjustable electricity generation capacity in central Europe, there is likely to be a growing need for imports from Norway, both in the short term and in the long term. During 2022 the central European and Nordic electricity markets have witnessed unprecedentedly high electricity prices. For instance, the average electricity prices in Germany and France have been EUR 218/MWh and EUR 249/MWh, respectively, in May 2022, whereas the long-term typical price has been about EUR 50–80/MWh [23].
In the Nordic market, there are significant bottlenecks, i.e., the lack of transmission capacity within Norway and Sweden. Thus, there have been tremendous price differences between these sub-national regions. For instance, the NordPool NO2 bidding area in south Norway often has electricity prices 10 times the price of the NO3 and NO4 bidding areas in the North (Figure 1). Due to, e.g., the mountainous and difficult terrain in these locations, it is not expected that these bottlenecks will disappear in the near future [24]. Thus, the practical motivation of this paper is to study whether a hybrid wind and wave electricity production farm located in southern Norway would be able to provide cost-competitive electricity to support exports of renewable electricity to adjacent central European regions.

Knowledge Gaps and Research Questions

Wave farms have significant investment costs and relatively low production, which stalls research work. It is still unknown whether wind–wave offshore hybrid farms could answer the problem. Combining R&D wave technology with offshore wind could bring investors’ money for the first commercial wave farm to supply the electricity grid. Moreover, an energy deficit is currently affecting southern Norway, while the potential of wave energy has not been utilized. This study compares different wave and wind devices and scenarios for technology capacities in a hybrid system on a local scale to find the best solution with the lowest cost of electricity.
The research questions of this study are as follows:
  • What is the production cost (EUR/MWh) of a combined wind and wave production plant at different capacity combinations?
  • What kind of plant would be closest to competitiveness?
  • What other benefits are there regarding a combined plant? What are the economic benefits and why?
This paper is organised as follows: the second chapter presents a literature review of offshore wind, wave, and hybrid farm economics and their potential to provide for increased European energy demand, as well as the material and methods used in the case study in the Norwegian North Sea at the Nord Pool NO2 bidding area. The third chapter shows results that include an evaluation of the hybrid farm’s performance, the levelized cost of the produced energy, and the sensitivity to uncertain parameters. Lastly, the results are discussed to summarize the techno-economic potential of the offshore farm.

2. Materials and Methods

2.1. Literature Review of Wave and Off-Shore Wind Power Costs

The investment costs of wind power have fallen significantly in the past two decades, as there has been strong growth in the installation of wind power technology globally [26]. Wave power, in turn, is at present more in the development and testing phase. There is currently 824 GW of wind power installed globally, of which 54 GW is offshore wind [27]. Globally there is no industrial wave power connected to national grids, but a few small test sites exist [28,29,30].

2.1.1. Levelized Cost of Energy of Wind and Wave Technologies

The levelized cost of energy (LCOE) is used to estimate the viability of an energy site project. It considers all the important factors that affect the price and energy production of an energy farm over its lifetime to eventually establish a minimum selling price for an economically sustainable project. The global levelized cost of energy of wind energy was estimated by IRENA as EUR 84/MWh and EUR 39/MWh in 2020 for offshore and onshore wind technologies, respectively [31]. In terms of the bigger picture, the lesser experience in offshore engineering explains the difference from onshore prices but, so far, a decreasing trend can be detected: the renewable power production cost report by IRENA reveals how the offshore wind levelized cost has dropped 48% between 2010 and 2020. Noteworthy is the significant reduction of 32% in total installation costs (CAPEX) for the same period, whereas the operation and maintenance costs remain relatively high [31].
For offshore wind projects, the economic lifetime is often assumed to be 20–30 years [32]. For wave technology there is no example energy site that has lasted over 25 years, but this can be expected as the technology reaches maturity. The average wave energy LCOE estimates cannot be verified with data from operating sites but has been evaluated nevertheless in several studies, as seen in Table 1, where the variance for wave technology is large. The values are between EUR 150/MWh and EUR 1600/MWh, thus not competitive with, e.g., onshore wind, as seen in Table 1. Expensive WEC technology increases the LCOE the most [33], while the lack of actual site data explains the large variance in the literature. In order to drive the emerging wave industry, it is important to first estimate the cost of such projects and then investigate the cost reduction potential.

2.1.2. Wave Energy CAPEX and OPEX

Emerging technologies, such as WECs, have uncertainties in their cost estimations. Table 2 shows the literature findings for wave farm CAPEX, although it is difficult to estimate for an immature technology that lacks industrial consistency standardization. In the case of the initial acquirement cost of WEC devices, a reference price scale is drawn from the literature [17] and is based on a price estimation for the Pelamis 0.75 MW device. The upscaling of the device capacity reduces the initial WEC cost per MW due to the economic benefits of wave farm design [33,37]. The operating expenditures (OPEX) of wave technology are assumptions often based on similar values to those of the offshore wind industry. Most sources indicate that the annual wave OPEX equates to approximately 3% of the total CAPEX (Table 2).

2.1.3. Offshore Wind CAPEX and OPEX

The latest report from IRENA states that offshore wind farm CAPEX costs in Europe varied a lot in 2020. For example, in the Netherlands the average total installed CAPEX was only 2.745 M USD/MW, while in Germany it was up to 4.552 M USD/MW, with Europe having an average of 3.394 M EUR/MW [31]. The cost of turbines is around 40% [31] of the total CAPEX, or 30% according to Statista [23]. The values from the literature for the cost per installed MW are represented in Table 3. A major segment of LCOE costs come from OPEX, and this is estimated to be 30% of onshore LCOE and 16–25% of offshore wind LCOE [31]. In the case of offshore wind, the harsh environment makes maintenance more demanding and thus the OPEX cost per installed capacity is much higher than for onshore wind (Table 4). However, this is compensated for with higher production. Moreover, offshore OPEX costs are currently reducing significantly, exemplified by the offshore developer Ørsted. They were able to reduce OPEX by 43% between 2015 and 2018 [31].

2.1.4. Shared Costs of a Hybrid Farm

There is evidence to support the benefits of combining OWFs with other renewable energy supplies. While offshore technologies have a relatively high price tag for produced electricity, there are also promising results for offshore electricity cost reduction using hybrid wind–solar farms [45]. The potential to share CAPEX as well as OPEX costs motivates this study on the economic benefits of wind–wave hybrid farms. CAPEX can be shared for the processes that are similar for both OWT and WEC [18] and we can assume that all costs apart from device costs have the potential for sharing. For WECs, the device CAPEX is around 61% [46] and the remaining potential for shared costs is 39% of CAPEX.

2.2. Overview of the Modelling Methodology

The methodology used in this paper consists of three steps as shown in Figure 2. First, acquiring the initial data for offshore resources and the estimates for project CAPEX and OPEX; second, modelling the annual energy production (AEP) and evaluating the performance by measuring the capacity factor (CF) of the hybrid system; third, providing LCOE results and a sensitivity analysis using an LCOE simulation model and discussing the results. The first step also includes selecting an applied case study where wind and wave devices are modelled and offshore weather data is analysed in order to estimate their performance. In the second stage, the System Advisor Model (SAM) is used to produce a performance model for wind and wave farms [47]. An LCOE simulation model is implemented for the final economic results.

2.3. Case Study: Stavanger Area

This study investigates a co-located hybrid wind–wave energy farm located in coastal Norway, where the Norwegian Sea meets the North Sea 30 km off the industrial port of Stavanger. To maximise the benefits of acquiring offshore wind resources, the proposed site is located as far as possible offshore, staying, however, within the 50 m water-depth limit in which all the proposed devices for this case study can operate (for more information about the devices see Section 2.5). Due to the generally steep bathymetry of the Norway coast, up to a 7 km shoreline distance with a maximum 50 m water depth limit exists (Figure 3). The hybrid farm is composed of a “barrier” of wave energy converters (WECs) that protect a section of the offshore wind turbines (OWTs) from large waves.
The case study hybrid farm has three scenarios, shown in Figure 4. The first (scenario A) is an even wind–wave energy ratio of 100 MW for both technologies. The second (scenario B) highlights wave technology and has a 140 MW wave energy capacity and a 60 MW wind energy capacity. The third (scenario C) highlights wind technology, with 140 MW and 60 MW capacities for wind and wave energy, respectively. In Scenario C, the smaller wave energy platform may demonstrate how integrating this with an advanced offshore wind farm may reduce high wave CAPEX costs.
This chapter represents the ERA5 resource data for the years 2020 and 2019. The data was downloaded from ECMWF [48] for the case area and is used later for estimating the annual energy production values for the different devices. To estimate wind resources, the hourly wind speed (m/s) at a height of 100 m was used and for wave resources (Figure 4), the significant wave height, Hs (metres), and significant wave period, Tm (seconds), were acquired from the ERA5 database. The energy model in the System Advisor Model uses the significant wave period, Te (seconds), to calculate the annual energy; however, due to the limitations of the REA5 database where only Tm is available, this study assumes Tm = Te. To estimate the available power, wave energy flux (WEF) is also plotted for coastal Stavanger below (Figure 5). WEF describes how much energy is contained in a 1 m wave crest length (kW/m). WEF is calculated as [49]:
W E F = 0.49 H s 2 T m
As seen in Figure 5, the offshore resources were much higher during 2020 compared to 2019, especially when measuring the energy density of the waves. Therefore, this study considers 2020 as an optimistic scenario and 2019 as a pessimistic scenario.
Within the case study area in Stavanger for the year 2020, both the wave energy flux (WEF) and the wind speed at 100 m exhibit a marked peak in winter, while the values in summer appear notably less energetic. This trend can be attributed to the physics of wave creation, as oceanic winds drive wave energy, culminating in a mutual peak in wind energy during the winter months. A detailed examination of Figure 6 reveals that the maximum offshore resources for a hybrid farm in coastal Stavanger can be expected in January and February. The WEF exhibits variation from a low of 2 kW/m in June to a high of 31 kW/m in February, positioning it within the medium range of the WEF spectrum across Norway, as depicted in Figure 5. The operation of a hybrid farm introduces the potential for smoothing out the output of electrical power. This is achieved through the integration of two distinct renewable energy sources that produce energy at different peak times. As displayed in Figure 6, a peak in wind energy precedes a peak in wave energy, reflecting a unique temporal relationship between these energy sources. Notably, this wind–wave lag is estimated to be approximately 3 h for coastal Stavanger. This phenomenon is inferred from our collected weather data, indicating a delay between the time when wind energy reaches its peak and the time when wave energy peaks. The exact calculation of this lag can be obtained by identifying the times of peak energy for both wind and wave sources and calculating the difference. This lag offers a significant advantage for the hybrid farm by maintaining a more consistent output of energy. As the power output from wind begins to decrease post-peak, the power output from wave energy is just reaching its crest. This alternating pattern in peak energy times facilitates a smoother, more consistent local power output than can be achieved through wind energy alone. As such, the hybrid farm is not just a theoretical model, but a practical solution for reducing energy output fluctuation in renewable energy production.

2.4. Norwegian Electricity Markets

The electricity demand per capita is large in Norway, being nearly five times greater than in the rest of Europe. While the EU had a mean per capita electricity consumption of 1581 kWh in 2019, in Norway it was 7529 kWh [50]. The large reservoir in Norway is not only beneficial for Norway, but it also helps to provide clean exported electricity to other European countries. The electricity supply of Norway in 2021 was approximately 156 TWh and electric power demand is growing according to Statnett [51]. According to their report, yearly electricity demand is expected to grow from 139 TWh to 158 TWh between the years 2021 and 2026. This would result in Norway’s energy surplus decreasing from 15 TWh to 3 TWh. Introducing wind–wave hybrid farms could support Norway’s attempts at independence and the country’s export potential in terms of renewable electricity in the future. Firstly, wave energy meets the increased electricity demand during wintertime [52]. Stavanger was chosen for the case study partly due to the NO2 bidding area energy prices, which have been unusually high since December 2021 (see also Figure 1). The reasons lie in the high central European energy prices which reflect southern Norway’s market prices. Moreover, the low transmission capacity from the North and the rainfall shortage in southern Norway caused high electricity prices [53]. The pan-European power exchange [25] reported that Norway’s day-ahead prices increased quickly up to 174.50 EUR/MWh during December 2021 (Figure 7) and since August 2022 the average NO2 electricity price has been over 300 EUR/MWh [25]. This creates a challenging environment for stable electricity markets and currently the Norwegian government has plans for more wind power in the North Sea between Denmark and Norway to balance the power markets [54]. Presently, there is an opportunity for research into hybrid wind–wave power plants in southern Norway. These hybrid offshore plants may offer a remedy for the pricing bottleneck effect that is now present in southern Norwegian electricity markets. Furthermore, the 1400 MW North Sea link launched in October 2021 between the UK and southern Norway causes additional demand for south Norwegian electricity and contributes to electricity price pressures. Thus, it does not appear likely that the region studied here will return to the low-price levels in the near future.

2.5. The Energy Model

A yearly estimate of offshore hybrid farm production was simulated using the System Advisor Model (SAM) created by NREL [55]. First the production of the WEC farm is simulated using a wave energy converter performance model and then the OWT farm production is simulated using a wind turbine performance model. The SAM model also simulates all electricity losses when estimating annual energy production [47]. The SAM calculates annual production separately for wind and wave energy, but the results are then combined to simulate a hybrid farm production amount. The individual device arrays are shaped and optimized automatically by the SAM and, for wind arrays, a wake effect is also modelled automatically [47].
An electrical power capture matrix shows a particular device’s electrical output performance in terms of significant wave height, Hs (metres), and wave energy period, Te (seconds). Given that the library does not provide the relevant WEC models, this investigation employs imported csv files for the WEC production simulation. For imported power matrices, the size of each bin in the matrix should be 0.5 × 1.0 so that Hs is set to a y-axis with 0.5-m intervals and Te is set to an x-axis with 1.0 s intervals. The SAM’s wave energy converter performance model generates three-hour time series data instead of the hourly data that is used in other performance models. For estimating wind turbine energy production, the SAM uses parameters for the device’s power curve and hub height. These parameters are either provided in the SAM’s library of the most common wind turbines or imported by the user. This study uses the SAM’s inbuilt library [47].
Three OWF turbines were chosen for this study: the Vestas V112-3.0 MW [56], Areva Multibird m5000 5 MW [57], and Vestas V164-7.0 MW [56]. The choice was based on the popularity of both manufacturers [26,58] and the availability of the OWT performance data in the SAM library. For wave devices, the WaveStar [59], Pelamis [60], and WaveDragon [60] were chosen due to the availability of techno-economic data. In addition, both the WaveStar and WaveDragon have been already tested in the North Sea and the Pelamis operated in Scottish waters until 2014 [39,61].
A device-specific power matrix is the WEC manufacturer’s estimation of performance at each sea state with a significant height and significant wave period as performance parameters. Figure 8 presents the power matrices for the devices studied, calculated based on the literature values [59,60]. Variation in the areas of optimal performance is obvious. The power matrix of the WaveStar shows an optimal performance in the 2.25–3.75 Hs range and 3.5–14.5 Te range. The Pelamis (Figure 8b) works better in even higher wave conditions compared to the WaveStar and has an optimal performance in the 4.25–8.25 Hs range and 7.0–13.0 Te range. The WaveDragon (Figure 8b has the widest optimal performance area and generates the most power in the 3.75–8.25 Hs range and 4.0–14.0 Te range. The annual power output of a WEC is calculated as [59]:
A E P w a v e = i = 1 n T p j = 1 n H S p i j P i j
where pij is the probability of a sea state defined by Hs and Te, and Pij represents the power output at that sea state as defined in the power matrix.
The offshore wind turbine parameters for the SAM performance model are shown in Table 5 for each device considered. The model calculates outputs based on the wind speed, rated power, hub height, and shear coefficient of the turbine [47]. The power production versus wind speed is shown in Figure 9. The OWTs considered for this study reach their peak power at slightly different wind speeds. The Vestas V112-3.0 MW reaches 3 MW power at 13 m/s. For the Areva Multibird m5000 and Vestas V164-7.0 MW the peak power is reached at 14 m/s for both devices. In the background of Figure 9 the Stavanger wind speed histogram is also drawn, which shows that with the occurrence limit set to 5% the most common wind speeds are between 4 and 14 m/s.
The system’s annual power output is calculated as the sum of 8760 h of a year:
A E P w i n d = n = 1 8760 P w f , j × F a d j , j
where AEPwind is the annual electrical energy output of the system in kWh, Pwf,j is the electrical output of the wind farm in hour j in kWh/h, and Fadj,j is the hourly adjustment factor (more details in Freeman et al. [47]).

2.6. Weather Data

This study utilizes an ERA5 dataset by ECMWF [48] to describe the temporal variance of wind and wave resources. The accuracy of the dataset is around 0.5° × 0.5° with a time interval of 1 h, and data for the year 2020 is obtained. Parameters for the u and v-components, observation height, and atmospheric pressure were used for simulating the wind resource and the significant wave height and significant wave period were used to model the wave resource.

2.7. CAPEX Costs

The farm CAPEX cost is divided into CAPEXdevice and CAPEXsystem costs as seen in Equation (4). The system CAPEX is later reduced using the cost reduction parameter in Section 2.1.4.
CAPEX = CAPEXdevice + CAPEXsystem
Price data from IRENA’s renewable energy report [31] shows European OWF farm total CAPEX costs to be 3394 USD/kW in the year 2020. The same paper shows that the wind device CAPEX is around 40% of the total OWF costs. The cost breakdown according to IRENA is shown in Figure 10. In this study, the initial costs are set to 1358 USD/kW for CAPEXdevice (40% of the total CAPEX) and 2636 USD/kW for CAPEXsystem (60% of the total CAPEX) according to values in the IRENA 2020 report for the European offshore wind farm markets.
The initial WEC price is estimated in Table 6 according to references from the literature [33,39,59]. The economic benefits of upsizing turbine size are expected, making higher capacity projects more feasible [37]. The cost per installed capacity decreases as the rating of the device grows. Table 6 is used to estimate the WaveStar device price, and a value of 3800 EUR/kW is interpolated using the economic scaling effect of the table.
In Table 7 the initial WEC costs of devices used for the hybrid farm are shown. While CAPEXdevice differs according to the technology used, the CAPEXsystem is same for wind and wave energy and is set to 2636 USD/kW, which is the average offshore wind system price in IRENA’s latest report [31]. The system cost is expected to be the same for wind and wave technologies, since the infrastructure, development, installation, and contingency costs are similar for both technologies of the hybrid farm. All values in Table 7 are corrected to EUR 2020 using the dollar exchange rate from the US Dollar to Euro Spot Exchange Rates for 2015 [62] and the inflation rate from the Euro Inflation Calculator [63] according to the source currency and publication year.

2.8. OPEX Costs

The upscaling of offshore wind turbines is taken into account when calculating the LCOE. When using higher rated turbines, the CAPEX and OPEX are expected to show cost savings, as less infrastructure and maintenance is needed at the wind farm array. In Shields et al. [42], upsizing the wind turbine rating from 6 MW to 20 MW reduced the OPEX costs of the offshore wind farm by 33.6%. Based on this finding, a linear interpolation aligned with the aforementioned study was conducted to estimate a general coefficient β applicable to other turbine ratings (Equation (5)). The base OPEX of an offshore wind farm is set to an annual cost of EUR 84.23 per installed kW according to the global baseline for offshore wind projects stated in Noonan et al. [41]. Inflation is considered and corrected to represent year 2020 EUR [63]. To obtain the final wind OPEX, the base price is multiplied with (1 + β/100). The annual operational costs for wave energy are expected to be 5% of the total wave CAPEX. Thus, the following equations are used:
β = 2.4 ∗ Pturbine − 14.4
OPEXwind = 84.23 € ∗ (1 + β/100)
OPEXwave = CAPEXwave ∗ 0.05

2.9. The LCOE Model

This paper uses the following model to estimate the levelized cost of energy (LCOE) of the hybrid farm. The LCOE (EUR/kWh) is the cost of an energy farm measured over its whole lifetime and to evaluate it, the total cost of lifetime COL (EUR) is divided by the total energy produced over lifetime EOL (MWh) and is defined in this study as follows:
L C O E c k W h = C O L E O L 100 = i = 1 n C A P E X + O P E X 1 + r i i = 1 n A E P 1 + r i = i = 1 n C A P E X w i n d + C A P E X w a v e + O P E X w i n d + O P E X w a v e 1 + r i i = 1 n A E P f a r m 1 + r i
where r and n are the real return rate and the analysis period, respectively. The real return rate is expected to be 6.5% and the analysis period is considered as 25 years. The annual energy production is the sum of the outputs of both technologies. The AEP is calculated for both wind and wave farms separately, as wind resources depend on different weather data from that of wave technology (see Section 2.5):
AEPfarm = AEPwave + AEPwind

2.10. Cost Reduction Factor

The potential for sharing CAPEX and OPEX costs is what motivates the present study to shed light on the economic benefits of wind–wave hybrid farms alongside other offshore technology combinations. For example, there are promising results for offshore electricity cost reduction using hybrid wind–solar farms [45]. Reduced CAPEX per installed MW is possible if common system elements are used and to achieve cost savings in OPEX, strategies and crew can be also shared. Astariz et al. [18] estimated that the high capital costs of wave energy can be reduced by 12–14% if combined with an offshore wind farm. For the same scenario, a 12% reduction in OPEX costs was estimated. All in all, cost savings are expected in OPEX and parts of CAPEX. This study assumes that all costs apart from those of acquiring the individual devices (CAPEXdevice) could potentially be shared in the projects. Therefore, a simple cost sharing factor α is applied to system CAPEX and annual OPEX only, and not to CAPEXdevice (Equations (10) and (11)):
CAPEXsystem, reduced = α ∗ CAPEXsystem
OPEXreduced = α ∗ OPEX
For wind and wave technologies CAPEX sharing can be expected in terms of the foundations, electrical grid, installation, and site access related costs, whereas for OPEX there would most likely be a reduction in the operation and maintenance costs of vessels and crew, as the same vessels can operate multiple devices [13,18,37]. A sensitivity analysis is conducted in Section 3, where α ranges between 0 and 30%, simulating the different levels of shared economy of both farms.

2.11. Capacity Factor

Lastly, to analyse how well a device can use the available potential, a capacity factor (CF) is used to finalise the evaluation of the hybrid farm [34]. The CF is calculated as the ratio of the actual and rated production over a period of one year:
CF = (AEPfarm)/(P0 ∗ 8760 h)
where P0 is the rated power of the wind, wave, or combined energy. Guillou and Chapalain simulated the average CF values of 15.7% and 25.3% for the Pelamis and WaveDragon WEC devices, respectively, in coastal France [60]. The values are similar to those of wind power during the early 2000s. Presently, R&D-phase wave energy devices do not have performance competitiveness against offshore wind when compared with state-of-the-art offshore turbines with CF values exceeding 50% [64]. Often, studies from past decades consider the highest energy wave climates as potential locations for WEC sites. However, the current approach in the scientific literature is different. Lavidas and Blok [34] claim that the most powerful wave climates are often not the most profitable due to the harsh conditions. This is also supported by Guillou and Chapalain [60], who state that most former studies have neglected low-resource but stable climates over high-resource areas. That said, AEP should also be evaluated for areas that are characterized as medium and low-resource regions, which describes the coastal sea areas of Stavanger well.

3. Results

3.1. Performance Results

The sea climate of coastal Stavanger has a direct impact on OWT and WEC performance, and in Section 2 it has already been mentioned that this paper views the results as optimistic and pessimistic estimates for the years 2020 and 2019, respectively, due to the annual difference in available resources. This is a consequence of the weather conditions, which were more suitable for offshore wind–wave energy production in 2020 compared to 2019, especially for wave energy. Furthermore, the performance of the proposed hybrid farm depends significantly on which device combination is used and the annual energy production has a large variance for the different technologies applied in the Stavanger case study.
Figure 11 shows the production against installed capacity for one device type only (not at a hybrid farm) in coastal Stavanger. We can observe that the WaveStar 600 kW is clearly the best performing of the wave devices studied (the WECs are described with lines and circle markers). The installed capacity of 100 MW with this technology can reach an annual production of 227 GWh if wave resources are low (2019) and 385 GWh if resources are good (2020), which is approximately two to three times better than the other WECs’ production values.
At 100 MW installed capacity, all OWTs can reach an annual energy production (AEP) of 300 GWh/year for both years 2019 and 2020, whereas only the WaveStar can reach a similar level, provided that a good wave resource year occurs. The other wave device AEPs remain under the level of 200 GWh for both the years considered. The best performing OWT for a 100 MW installed capacity is the Vestas V112-3.0 MW, which has an annual energy output of 349 GWh and 379 GWh for 2019 and 2020, respectively. The least performing OWT is the Areva Multibird M5000 with 306 GWh and 338 GWh AEP for a 100 MW farm for the years 2019 and 2020, respectively.
To assess the offshore device performance in different scenarios (A, B, and C, as shown in Figure 4) and for the years 2020 (representing optimistic resources) and 2019 (representing pessimistic resources), the capacity factor was calculated as in Equation (12). The considered devices for the proposed Stavanger hybrid offshore energy farm show significant differences in performance when analysing Figure 12. Newly installed offshore wind projects have capacity factors (CF) varying between 40 and 50% [64], which can be used as a target capacity factor for our proposed offshore hybrid energy farm. Figure 12 also shows the capacity factors of all devices individually. The Vestas 3 MW and 7 MW are the best performing devices when measuring the used potential of the device. They are both the only devices that can reach the 40% limit for CF during a low resource year, such as 2019. For a good resource year, such as 2020, the devices reaching the 40% limit are both the Vestas wind turbines and the WaveStar600kW wave device. They have CF values of 48%, 45%, and 45% for the Vestas 3 MW, Vestas 7 MW, and WaveStar, respectively. The WaveStar is thus the only WEC whose performance is competitive compared to new offshore wind technologies. The Areva 5 MW had only 36%–39% CF for the years 2019 and 2020, respectively, and was significantly less optimal compared to the performance provided by the Vestas turbines. The major weakness of wave technology is the possibility of a year with low resources that has a high effect on the CF. The proposed WECs had approximately half the CF in 2019 compared to 2020. The Pelamis and WaveDragon have low CF values ranging from 6–15% and 11–20%, respectively. Similar values for these two devices were estimated in Guillou and Chapalain [60]. The WaveStar’s good results are dependent on good wave resources, therefore a large variance (26–45%) in the WaveStar’s capacity factor is seen due to the changing inter-annual WEF levels (see Figure 5).
Figure 13 shows the average annual capacity factors of all the wind–wave device pairs. It can be seen that the Vestas 3 MW and WaveStar 600 kW together is the best device pairing in terms of performance at the case location. The pairing provides competitive CF values during an optimistic resource year, such as 2020: scenarios A, B, and C have high CF values of 46%, 45%, and 47%, respectively. However, the highest values remain under 40% in a low resource year, such as 2019. Other WECs do not have enough performance data and remain under the 40% limit, except for the WaveDragon and Vestas 3 MW in the resource year 2020. In Figure 14 the monthly production curve for the Vestas 3 MW and WaveStar 600 kW is shown (the most productive device pairing, as seen in Figure 12 and Figure 13). The wind–wave split is set to 160 MW and 40 MW for wind and wave energy, respectively (scenario C). During 2020, the wind farm had a maximum monthly productivity of 70 GWh in January and a minimum of 30 GWh in June. The wave power correlates with the wind curve and shows its peak in January (20 TWh) and its lowest value in June (5 GWh). In 2019, the production was lower due to decreased resources.

3.2. LCOE of the Hybrid Farm

The proposed hybrid farm LCOE results are represented in Table 8 for different device combinations with cost-sharing factors set to 0%, 15%, and 30%. Each column represents scenarios A, B, and C for the years 2019 and 2020 and the lowest value is bolded for that column. For most scenarios, the best device combination is the Vestas 3 MW and the WaveStar 600 kW. For a good resource year, such as 2020, with the cost reduction factor set to 15%, the LCOEs with the previously mentioned device pairing are EUR 127, EUR 147, and EUR 107, per MWh for scenarios A, B, and C, respectively. If the cost reduction factor is set to 30%, the 2020 level for the LCOEs are EUR 114, EUR 132, and EUR 96, respectively, for scenarios A, B, and C. The Vestas 3 MW and WaveStar 600 kW pairing was also the most competitive in 2019. However, in scenario C during a low wave resource year, such as 2019, the Vestas 3 MW combined with the WaveDragon can yield approximately the same LCOE as the WaveStar with the same OWT pairing. The explanation is partly the fact that the WaveDragon has a lower capital cost per installed capacity compared to the WaveStar. However, it is not enough to compete with the WaveStar, which enjoys a higher capacity factor compared to other WECs in the case area wave climate (see Section 3.1). Comparing the scenarios with the cost reduction factor set to 15%, we can see that scenarios B and C have the highest and lowest LCOE, respectively. In scenario A, the LCOE is between EUR 127 and 264/MWh, then for scenario B the LCOE is EUR 147–417/MWh, and lastly, for scenario C the LCOE is EUR 107–179/MWh.
Table 8 shows that when the shared economy is set to 30%, the hybrid farm LCOE can reach a value slightly under EUR 100/MWh. However, this is a rather optimistic assumption compared with the literature findings [18]. The situation without any savings (0% shared economy) is shown for comparison. This is not realistic as the hybrid plant yields benefits in terms of shared infrastructure. Table 8 shows that a lower turbine rating provides a lower LCOE (Vestas 3 MW vs. Vestas 7 MW). It is obvious that large capacity OWTs need less infrastructural CAPEX for turbine interconnections than multiple small capacity OWTs; however, the higher capacity factor of the Vestas 3 MW exceeds the Vestas 7 MW’s performance within the parameters of this study. The scale of turbine economics is applied to reduce the CAPEX cost of larger offshore wind turbines (see Section 2.8 “Cost reduction”) but the difference in economic benefits of scaling is less effective here than the difference in device performance between the two OWTs.
The LCOE sensitivity to the wind–wave split (MW/MW) is shown in Figure 15, with the reduced cost factor set to 15%. Scenarios A, B, and C are noted on the x-axis. In 2020, the CF remains above the 40% level even with 180 MW of wave capacity and only 20 MW of offshore wind capacity. This is due to the excellent performance of the WaveStar in an optimal wave resource climate. However, if the year 2019 is considered, the capacity factor can reach the 40% level only at a 160 MW wind- and 40 MW wave-capacity split. Scenario C, with a 140/60 wind/wave split has a capacity factor of 39%, which could be regarded as a high enough CF level if compared to modern wind farms. If we set the LCOE limit to EUR 150/MWh, the maximum wave capacity of the WaveStar can be set up to 140 MW with only 60 MW from the Vestas 3 MW wind turbines in the resource year 2020. However, considering the resource year 2019, the EUR 150/MWh level is reached with 80 MW wave and 120 MW wind capacity. In the year 2020, the LCOE was below EUR 100/MWh with a 160/40 (wind/wave) split, and with a 180/20 split for the year 2019, for the same device pair.

3.3. LCOE Sensitivity to the Real Return Rate

Figure 16 shows that the expected real return rate (r) has a significant impact on the LCOE of the Stavanger hybrid farm. The base real return rate value is set to 6.5% but an increase to 8.0% shows that the LCOE increases from EUR 127/MWh to EUR 139/MWh, considering the pairing of the Vestas 3MW and the WaveStar in scenario A during the year 2020. If the real return rate is expected to be 5%, the same device pair would have a reduced LCOE of EUR 115/MWh.

4. Discussion and Conclusions

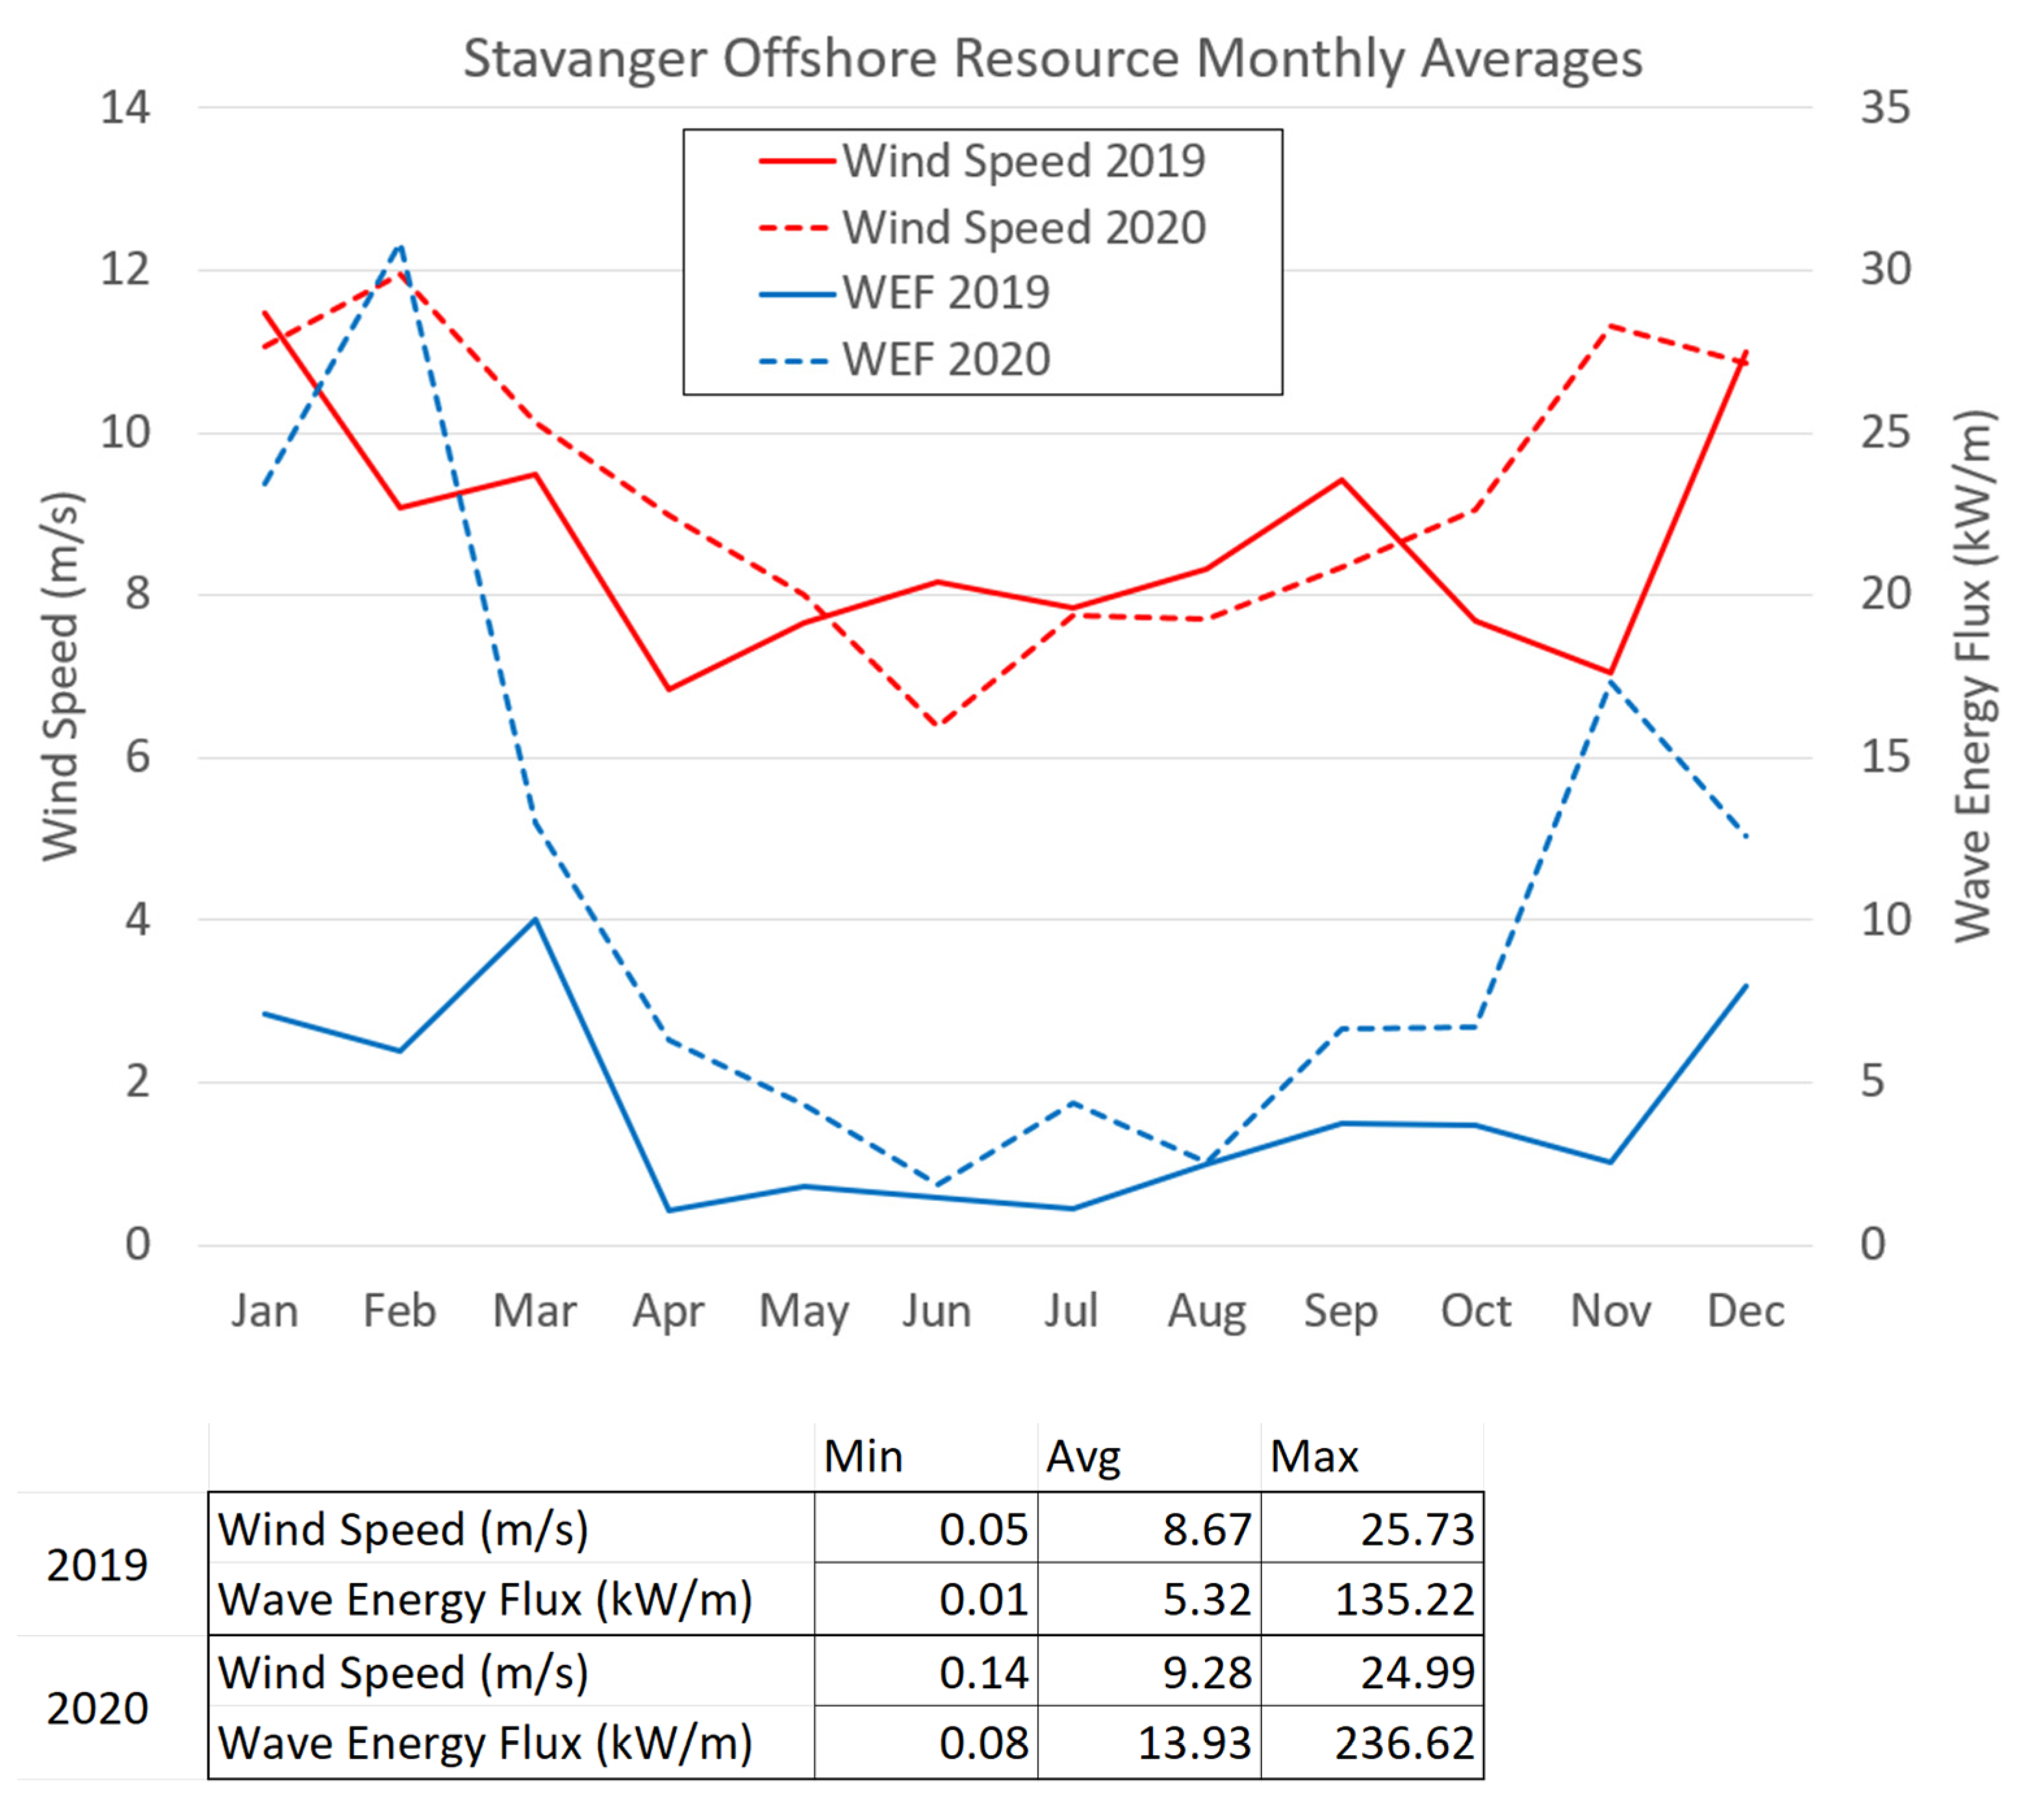
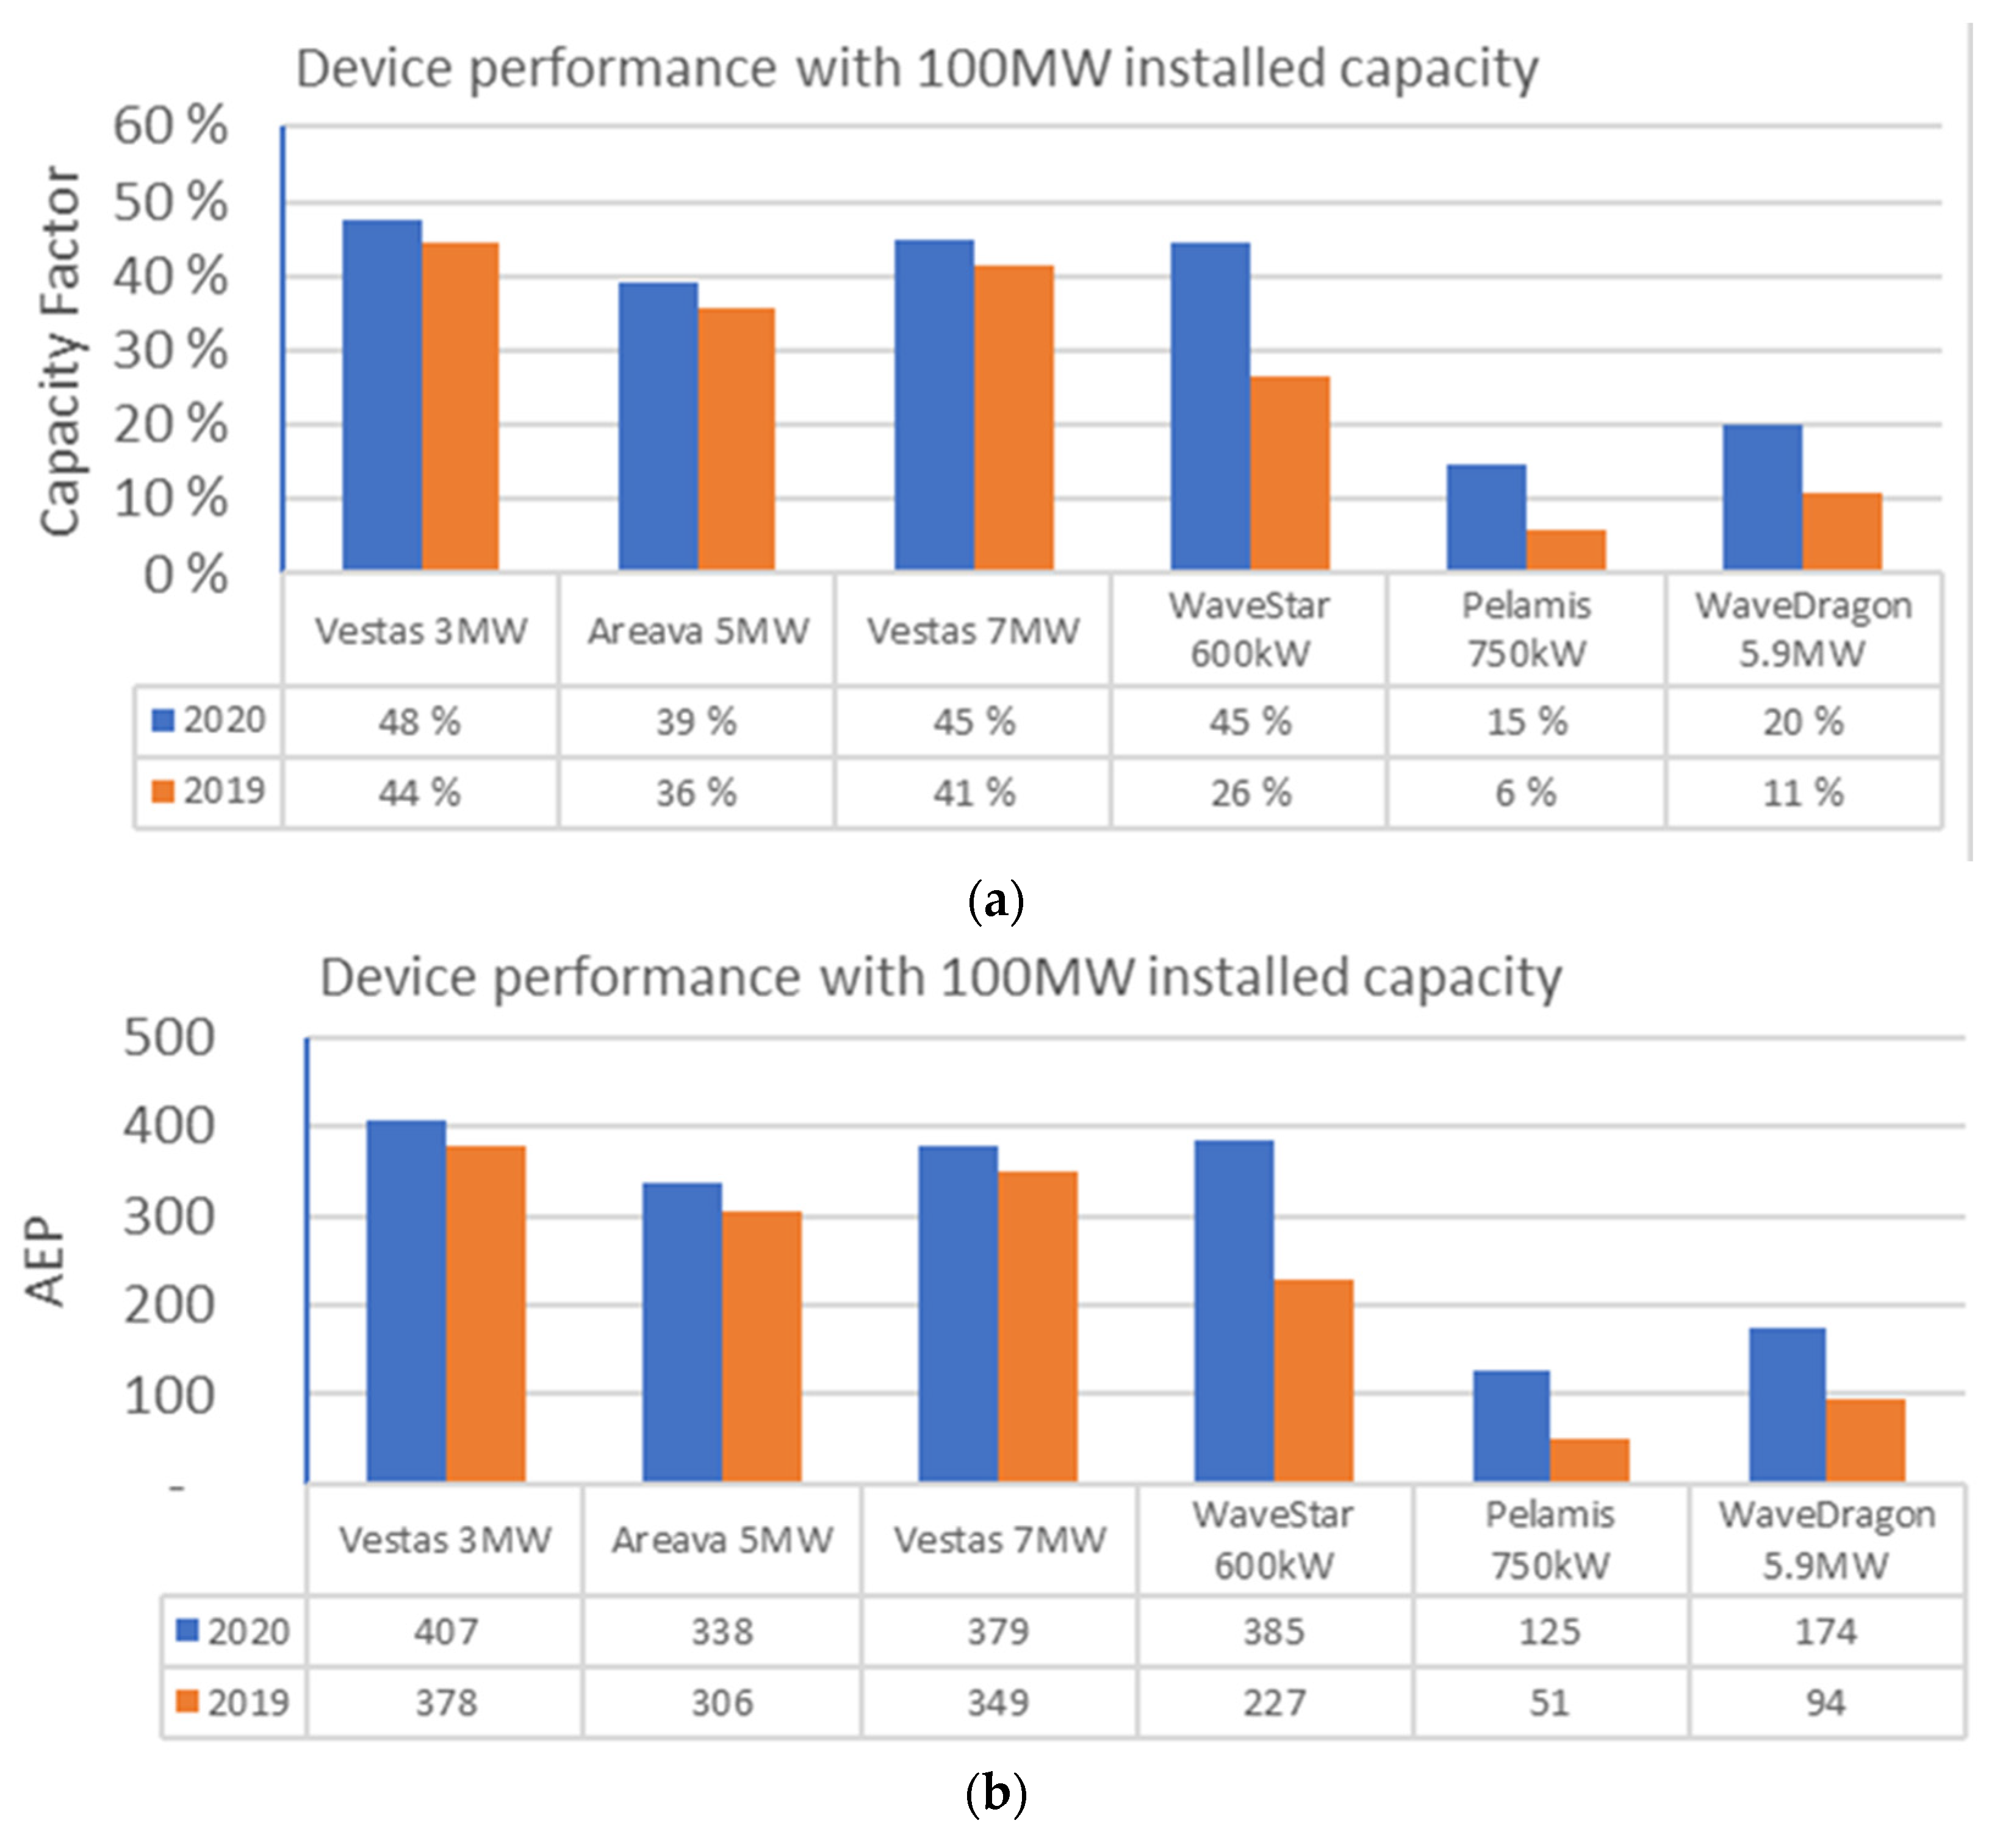
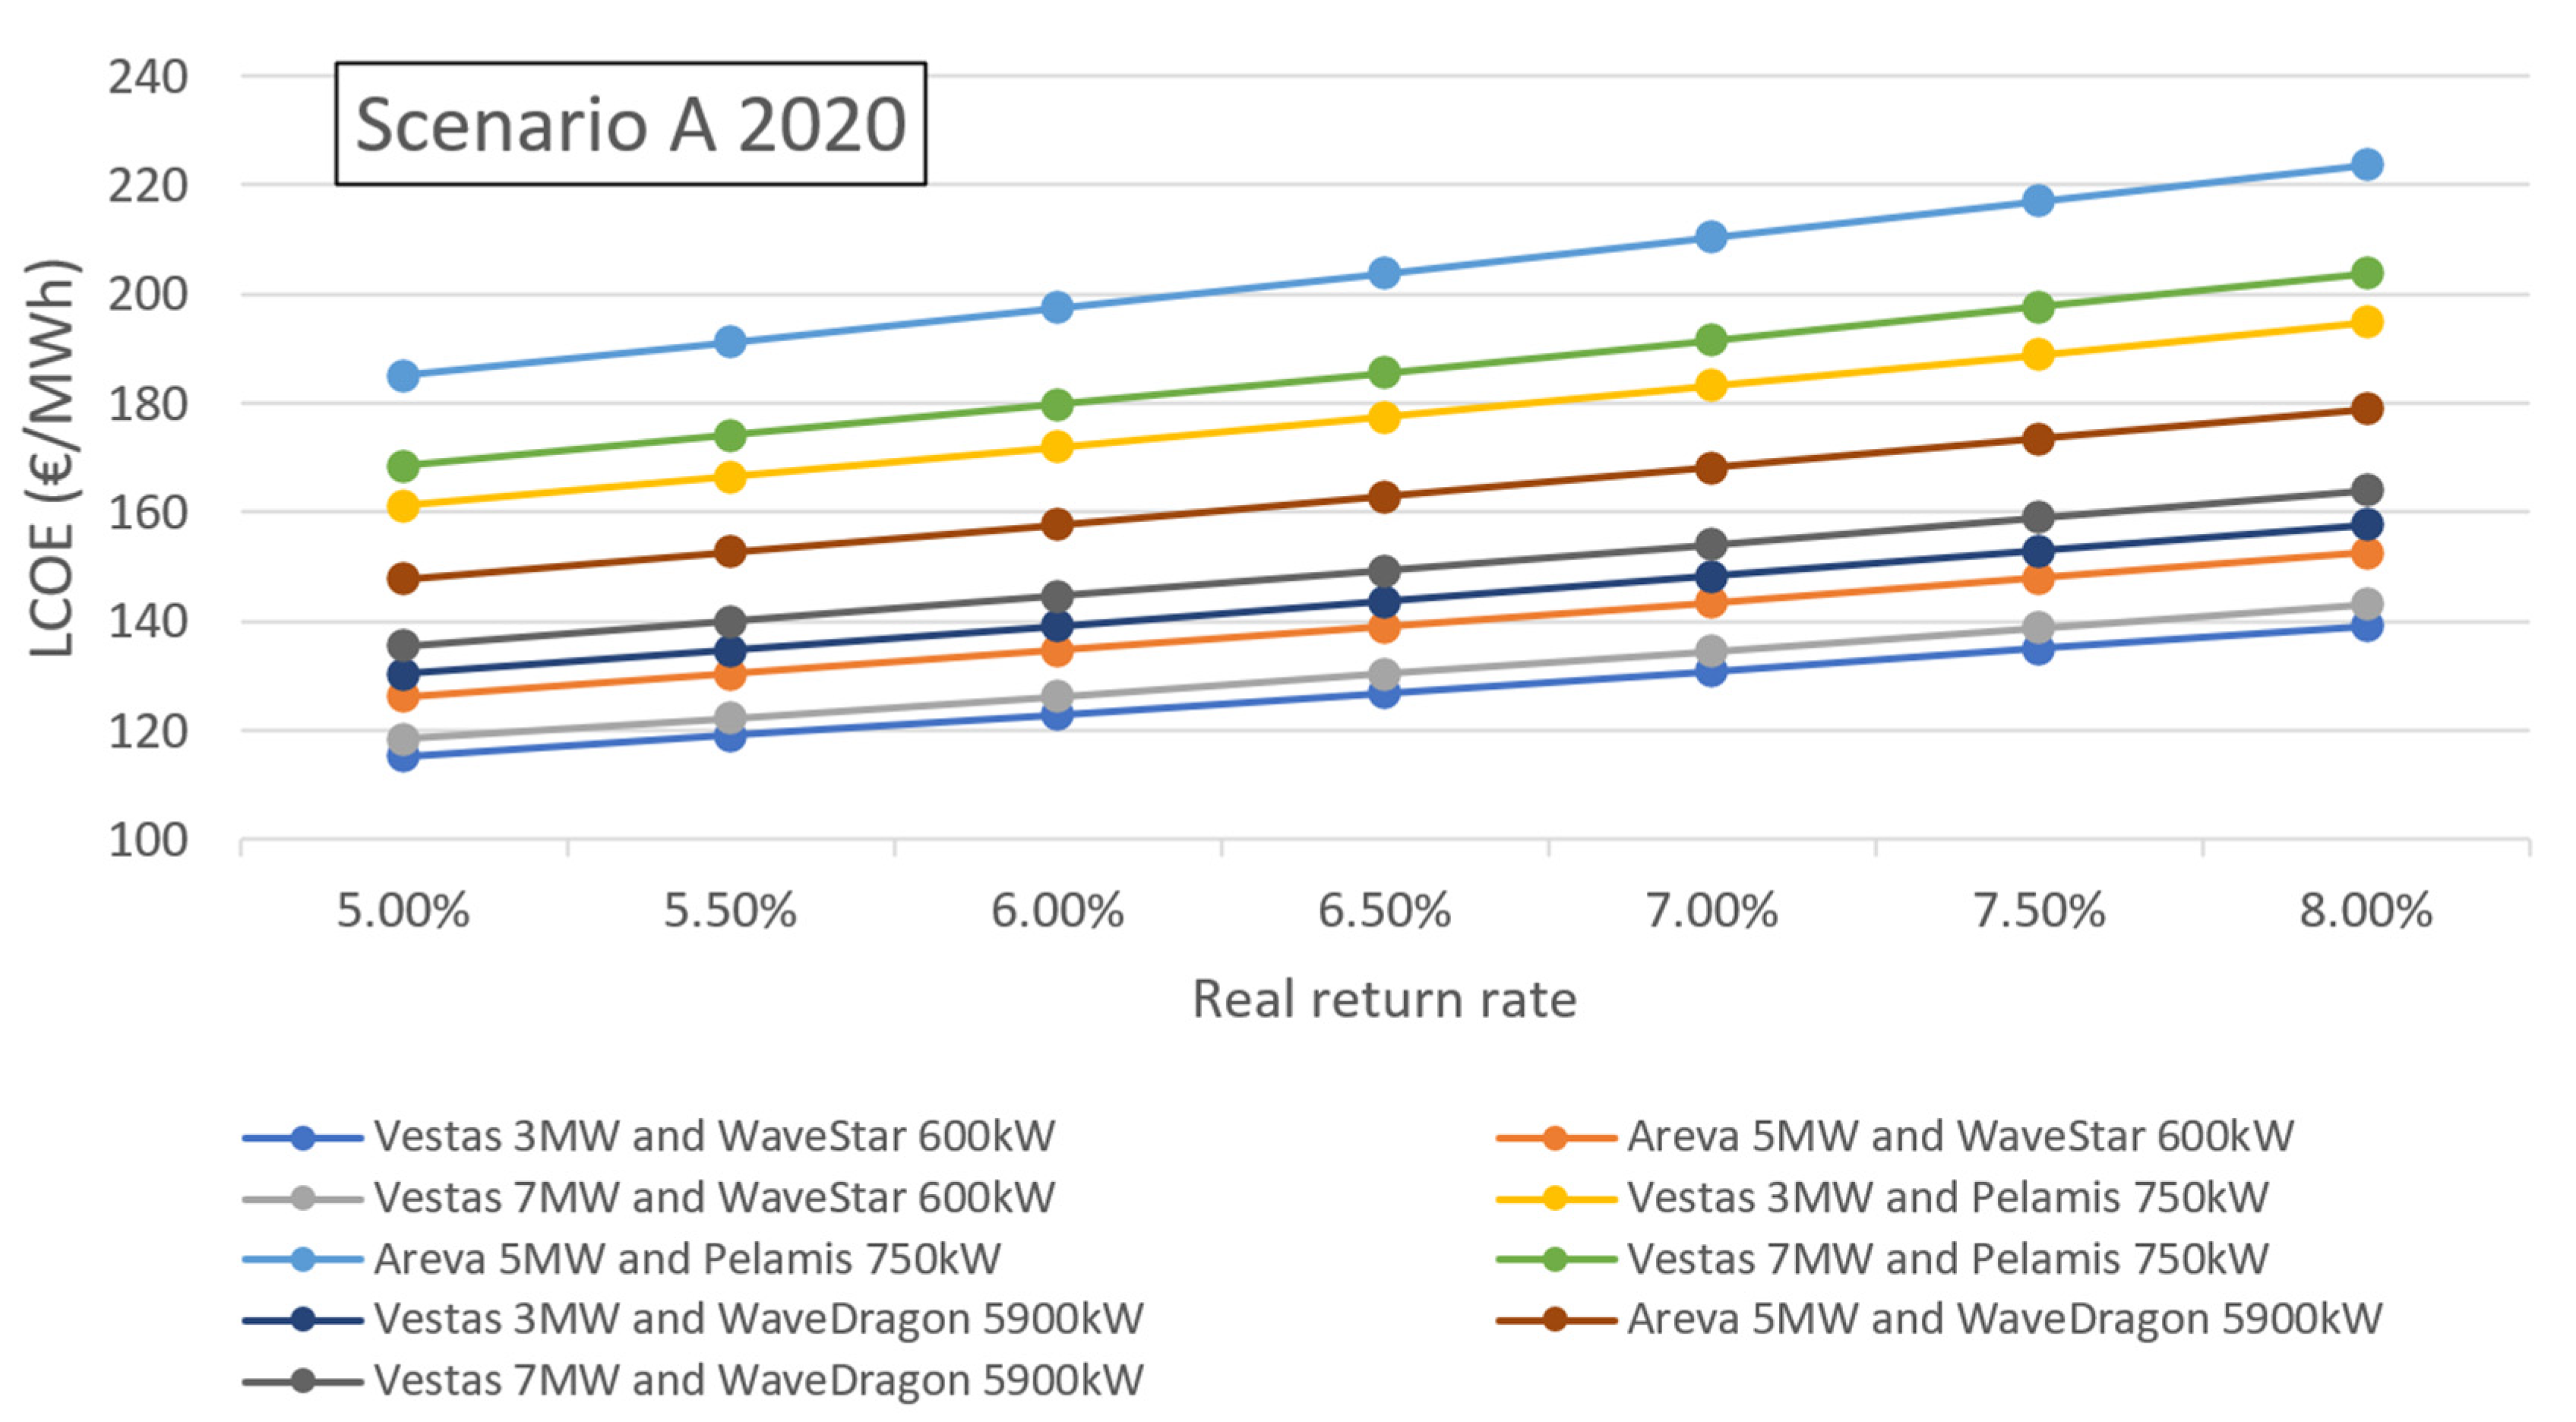
In this contribution, a techno-economical study was conducted to evaluate a proposed 200 MW offshore wind and wave farm in coastal Norway, Stavanger. The use of two different years’ weather data was found necessary to capture the variability in weather parameters that determines the production of wind and wave power plants. The weather parameters for the case study area in coastal Stavanger were provided by the ERA5 dataset. The weather data consisted of the significant wave height, the significant wave period, the wind speed at a height of 100 m, the atmospheric pressure, and the surface temperature, and it was used for estimating the performance of nine different device pairings. Moreover, the LCOE was estimated for scenarios with three different wind–wave capacity splits and for each device pairing.
A hybrid wind–wave power plant, such as the one proposed in this paper, can operate as a reasonable cost platform for novel wave technology. This allows us to gain knowledge and experience from operating new technology in a real scaled energy farm. In general, this study shows that a hybrid offshore wind and wave farm can yield LCOE values directly competitive with an offshore wind farm only. The main factor in terms of cost reduction is building a common infrastructure and sharing the operational expenditures between two production technologies. The LCOE was estimated to be EUR 119/MWh at its lowest with a combination of 60 MW and 140 MW wave and wind capacity, respectively. When a cost reduction of 15% and 30% was applied to the hybrid farm, the LCOEs reduced to EUR 107/MWh and EUR 96/MWh, respectively. The best performing device pairing was the Vestas 3 MW and the WaveStar 600 kW, and their combined capacity factor in the scenario C hybrid farm was estimated to be 47% in 2020.
The winter season yields the most offshore energy production at Stavanger, and it peaks in January, when a peak of 70 GWh of monthly production was achieved. This study demonstrated that the production of offshore wind and wave electricity occur partly at different times. A wave energy peak follows the wind energy peak after roughly three hours. For the electricity system this is an important benefit. Fewer transmission connections are needed, and the electricity supply is more balanced than from offshore wind only. In addition, a hybrid offshore wind and wave farm may have fewer environmental impacts in terms of noise and landscape issues. Currently many countries surrounding the North Sea and the Baltic Sea are investing in building offshore wind power. They are partly funded by public support instruments. This study indicates that expanding the existing subsidy mechanisms to cover hybrid wind and wave power plants as well could be considered to fully harness the potential of all renewable energy resources.

Author Contributions

Conceptualization, data curation, software, validation, formal analysis: J.R. and A.K.; methodology and writing: all authors; supervision and funding acquisition: S.S. All authors have read and agreed to the published version of the manuscript.

Funding

This research was partly funded by the European Commission through the H2020 project Finest Twins (grant no. 856602).

Data Availability Statement

Data is available on request from the authors.

Conflicts of Interest

The authors declare no conflict of interest. The funder had no role in the design of the study; in the collection, analyses, or interpretation of data; in the writing of the manuscript; or in the decision to publish the results.

Abbreviations

W E C Wave energy converter
O W T Offshore wind turbine
O W F Offshore wind farm
L C O E Levelised cost of energy
C A P E X Capital expenditures
O P E X Operating expenses
H s Significant wave height
T m Mean wave period
T e Mean energy wave period
W E F Wave energy flux
p i j Probability of sea state
P i j Power output at sea state
A E P f a r m Annual energy output of hybrid farm
A E P w i n d Annual energy output of wind farm
A E P w a v e Annual energy output of wave farm
P w f , j Electrical output of wind farm
F a d j , j Hourly adjustment factor of wind farm
C A P E X d e v i c e Initial cost of OWT/WEC
C A P E X s y s t e m Initial cost of system (no device)
β Turbine upsizing factor
P t u r b i n e Wind turbine nameplate capacity
O P E X w i n d Wind farm total operational expenses
O P E X w a v e Wave farm total operational expenses
C A P E X w a v e Wave farm total investment cost
C A P E X w i n d Wind farm total investment cost
r Real return rate
C A P E X s y s t e m , r e d u c e d Reduced system investment costs
α Reduction factor
O P E X r e d u c e d Reduced operational expenses
C F Capacity factor

References

  1. EU Achieves 20-20-20 Climate Targets, 55% Emissions Cut by 2030 Reachable with More Efforts and Policies—European Environment Agency. Available online: https://www.eea.europa.eu/highlights/eu-achieves-20-20-20 (accessed on 23 September 2022).
  2. EU Responses to Climate Change|News|European Parliament. Available online: https://www.europarl.europa.eu/news/en/headlines/society/20180703STO07129/eu-responses-to-climate-change (accessed on 23 September 2022).
  3. Five Largest Construction Projects Initiated in Europe in Wind Energy in Q2 2022. Available online: https://www.power-technology.com/marketdata/top-five-construction-projects-europe-wind-energy-q2-2022/ (accessed on 23 September 2022).
  4. 3 UK Offshore Wind Projects Expected to Break European Records in 2022. Available online: https://www.airswift.com/blog/offshore-wind-energy-projects-uk-2022 (accessed on 23 September 2022).
  5. IRENA. World Energy Transitions Outlook 2022. Available online: https://www.irena.org/Digital-Report/World-Energy-Transitions-Outlook-2022 (accessed on 23 September 2022).
  6. IRENA. Innovation Outlook: Ocean Energy Technologies. 2020. Available online: https://publications/2020/Dec/Innovation-Outlook-Ocean-Energy-Technologies (accessed on 23 September 2022).
  7. Nathalie Rousseau (ICOE 2010). Oceans of Energy—European Ocean Energy Roadmap 2010–2050. Available online: https://www.icoe-conference.com/publication/oceans_of_energy_european_ocean_energy_roadmap_2010_2050/ (accessed on 23 September 2022).
  8. Runde Waves4Power Project Full Scale|Tethys. Available online: https://tethys.pnnl.gov/project-sites/runde-waves4power-project-full-scale (accessed on 23 September 2022).
  9. Mocean Energy Concludes Blue X Wave Device Sea Trials—Offshore Energy. Available online: https://www.offshore-energy.biz/mocean-energy-concludes-blue-x-wave-device-sea-trials/ (accessed on 23 September 2022).
  10. Wave Star Hanstholm|Tethys. Available online: https://tethys.pnnl.gov/project-sites/wave-star-hanstholm (accessed on 23 September 2022).
  11. European Commission. Communication from the Commission to the European Parliament, the Council, the European Economic and Social Committee and the Committee of the Regions. 2020. Available online: https://ec.europa.eu/info/index_en (accessed on 23 September 2022).
  12. Loukogeorgaki, E.; Vagiona, D.; Vasileiou, M. Site Selection of Hybrid Offshore Wind and Wave Energy Systems in Greece Incorporating Environmental Impact Assessment. Energies 2018, 11, 2095. [Google Scholar] [CrossRef]
  13. Wen, Y.; Kamranzad, B.; Lin, P. Joint exploitation potential of offshore wind and wave energy along the south and southeast coasts of China. Energy 2022, 249, 123710. [Google Scholar] [CrossRef]
  14. Wan, L.; Gao, Z.; Moan, T. Experimental and numerical study of hydrodynamic responses of a combined wind and wave energy converter concept in survival modes. Coast. Eng. 2015, 104, 151–169. [Google Scholar] [CrossRef]
  15. Stoutenburg, E.D.; Jenkins, N.; Jacobson, M.Z. Power output variations of co-located offshore wind turbines and wave energy converters in California. Renew. Energy 2010, 35, 2781–2791. [Google Scholar] [CrossRef]
  16. Cradden, L.; Kalogeri, C.; Barrios, I.M.; Galanis, G.; Ingram, D.; Kallos, G. Multi-criteria site selection for offshore renewable energy platforms. Renew. Energy 2016, 87, 791–806. [Google Scholar] [CrossRef]
  17. Rusu, E.; Rusu, L. An evaluation of the wave energy resources in the proximity of the wind farms operating in the North Sea. Energy Rep. 2021, 7, 19–27. [Google Scholar] [CrossRef]
  18. Astariz, S.; Perez-Collazo, C.; Abanades, J.; Iglesias, G. Co-located wave-wind farms: Economic assessment as a function of layout. Renew. Energy 2015, 83, 837–849. [Google Scholar] [CrossRef]
  19. Poseidon Project. Available online: http://aristeia-poseidon.naval.ntua.gr/ (accessed on 27 September 2022).
  20. Statistics Norway. Electricity Statistics. 2022. Available online: https://www.ssb.no/en/energi-og-industri/energi/statistikk/elektrisitet (accessed on 16 September 2022).
  21. The Highest Power Export of All Time in 2021. Available online: https://www.ssb.no/energi-og-industri/energi/statistikk/elektrisitet/artikler/tidenes-hoyeste-krafteksport-i-2021 (accessed on 16 September 2022).
  22. Norway Wind Farms to Keep Spinning for Now, Government Says|Reuters. Available online: https://www.reuters.com/world/europe/invalid-norway-wind-farms-keep-spinning-now-government-says-2021-10-27/ (accessed on 16 September 2022).
  23. Statista. Monthly Electricity Prices by Country 2022. Average Monthly Electricity Wholesale Prices in SELECTED countries in the European Union (EU) from January 2020 to August 2022. 2022. Available online: https://www.statista.com/statistics/1267500/eu-monthly-wholesale-electricity-price-country/ (accessed on 16 September 2022).
  24. Nord Pool. Nord Pool’s CEO Tom Darell Has Commented on the Energy Crisis in Norway (in Norwegian). 2022. Available online: https://www.nordpoolgroup.com/en/message-center-container/newsroom/exchange-message-list/2022/q3/nord-pools-ceo-tom-darell-has-commented-on-the-energy-crisis-in-norway-in-norwegian/ (accessed on 27 August 2022).
  25. Nord Pool. Market Data|Nord Pool. Market Data. 2022. Available online: https://www.nordpoolgroup.com/Market-data1/Power-system-data/Consumption1/Consumption/Nordic/Hourly41/?view=table (accessed on 20 February 2022).
  26. GWEC. Global Wind Energy Council. Market Intelligence. 2021. Available online: https://gwec.net/market-intelligence/ (accessed on 13 June 2022).
  27. IRENA. Wind Energy Data. 2022. Available online: https://www.irena.org/wind (accessed on 29 August 2022).
  28. Waves4Power. Demo Site Runde, Norway-Waves4Power. 2016. Available online: https://www.waves4power.com/demo-runde/ (accessed on 22 March 2022).
  29. Kramer, M.; Marquis, L.; Frigaard, P. Performance Evaluation of the Wavestar Prototype; APA: Aalborg, Denmark, 2011.
  30. EMEC. Mocean Energy Blue X Wave Machine Starts Sea Trials at EMEC. June 2021. Available online: https://www.emec.org.uk/press-release-mocean-energy-blue-x-wave-machine-starts-sea-trials-at-emec/ (accessed on 16 September 2022).
  31. IRENA. Renewable Power Generation Costs 2020. 2021. Available online: www.irena.org (accessed on 1 July 2022).
  32. Cavazzi, S.; Dutton, A.G. An Offshore Wind Energy Geographic Information System (OWE-GIS) for assessment of the UK’s offshore wind energy potential. Renew. Energy 2016, 87, 212–228. [Google Scholar] [CrossRef]
  33. Astariz, S.; Iglesias, G. The economics of wave energy: A review. Renew. Sustain. Energy Rev. 2015, 45, 397–408. [Google Scholar] [CrossRef]
  34. Lavidas, G.; Blok, K. Shifting wave energy perceptions: The case for wave energy converter (WEC) feasibility at milder resources. Renew. Energy 2021, 170, 1143–1155. [Google Scholar] [CrossRef]
  35. Astariz, S.; Iglesias, G. Wave energy vs. other energy sources: A reassessment of the economics. Int. J. Green. Energy 2016, 13, 747–755. [Google Scholar] [CrossRef]
  36. Chang, G.; Jones, C.A.; Roberts, J.D.; Neary, V.S. A comprehensive evaluation of factors affecting the levelized cost of wave energy conversion projects. Renew. Energy 2018, 127, 344–354. [Google Scholar] [CrossRef]
  37. Pecher, A.; Kofoed, J.P. Handbook of Ocean Wave Energy; Springer: Cham, Switzerland, 2017; Volume 7. [Google Scholar] [CrossRef]
  38. Tran, T.T.D.; Smith, A.D. Incorporating performance-based global sensitivity and uncertainty analysis into LCOE calculations for emerging renewable energy technologies. Appl. Energy 2018, 216, 157–171. [Google Scholar] [CrossRef]
  39. O’Connor, M.; Lewis, T.; Dalton, G. Techno-economic performance of the Pelamis P1 and Wavestar at different ratings and various locations in Europe. Renew. Energy 2013, 50, 889–900. [Google Scholar] [CrossRef]
  40. O’Connor, M.; Lewis, T.; Dalton, G. Operational expenditure costs for wave energy projects and impacts on financial returns. Renew. Energy 2013, 50, 1119–1131. [Google Scholar] [CrossRef]
  41. Noonan, M.; Stehly, T.; Mora, D.; Kitzing, L.; Smart, G.; Berkhout, V.; Kikuchi, Y. IEA Wind TCP Task 26—Offshore Wind International Comparative Analysis, International Energy Agency Wind Technology Collaboration Programme. Available online: https://www.nrel.gov/docs/fy19osti/71558.pdf (accessed on 29 August 2022).
  42. Shields, M.; Beiter, P.; Nunemaker, J.; Cooperman, A.; Duffy, P. Impacts of turbine and plant upsizing on the levelized cost of energy for offshore wind. Appl. Energy 2021, 298, 117189. [Google Scholar] [CrossRef]
  43. OPEX Benchmark—An Insight into Operational Expenditures of European Offshore Wind Farms—PEAK Wind. Available online: https://peak-wind.com/insights/opex-benchmark-an-insight-into-operational-expenditures-of-european-offshore-wind-farms/ (accessed on 14 September 2022).
  44. Lorenczik, S.; Kim, S.; Wanner, B.; Menendez, J.M.B.; Remme, U.; Hasegawa, T. Projected Costs of Generating Electricity, 2020th ed.; IEA: Paris, France, 2020; Available online: https://inis.iaea.org/search/search.aspx?orig_q=RN:52007078 (accessed on 27 September 2022).
  45. López, M.; Rodríguez, N.; Iglesias, G. Combined floating offshore wind and solar PV. J. Mar. Sci. Eng. 2020, 8, 576. [Google Scholar] [CrossRef]
  46. Bull, D.; Ochs, M.E.; Laird, D.L.; Boren, B.; Jepsen, R.A. SANDIA REPORT Technological Cost-Reduction Pathways for Point Absorber Wave Energy Converters in the Marine Hydrokinetic Environment. 2013. Available online: http://www.ntis.gov/help/ordermethods.asp?loc=7-4-0#online (accessed on 1 July 2022).
  47. Freeman, J.; Jorgenson, J.; Gilman, P.; Ferguson, T. Reference Manual for the System Advisor Model’s Wind Power Performance Model. 2014. Available online: www.nrel.gov/publications (accessed on 1 July 2022).
  48. ECMWF. ERA5 Climate Dataset. Climate Data Store. 2022. Available online: https://cds.climate.copernicus.eu/cdsapp#!/home (accessed on 13 June 2022).
  49. Penalba, M.; Ulazia, A.; Ibarra-Berastegui, G.; Ringwood, J.; Sáenz, J. Wave energy resource variation off the west coast of Ireland and its impact on realistic wave energy converters’ power absorption. Appl. Energy 2018, 224, 205–219. [Google Scholar] [CrossRef]
  50. Idsø, J. Growth and Economic Performance of the Norwegian Wind Power Industry and Some Aspects of the Nordic Electricity Market. Energies 2021, 14, 2701. [Google Scholar] [CrossRef]
  51. Statnett. Increased Power Consumption and Plans for New Industry Generates Need for More Power Production|Statnett. Kortsiktig Markedsanalyse 2021-26. December 2021. Available online: https://www.statnett.no/en/about-statnett/news-and-press-releases/news-archive-2021/increased-power-consumption-and-plans-for-new-industry-generates-need-for-more-power-production/ (accessed on 20 February 2022).
  52. Christakos, K.; Varlas, G.; Cheliotis, I.; Spyrou, C.; Aarnes, O.J.; Furevik, B.R. Characterization of Wind-Sea- and Swell-Induced Wave Energy along the Norwegian Coast. Atmosphere 2020, 11, 166. [Google Scholar] [CrossRef]
  53. Southern Norway Power Price Hits Record Amid Europe-Wide Surge|Nasdaq. 2021. Available online: https://www.nasdaq.com/articles/southern-norway-power-price-hits-record-amid-europe-wide-surge (accessed on 11 April 2022).
  54. Norway Proposes First Southern North Sea Wind Farms. 2022. Available online: https://www.maritime-executive.com/article/norway-proposes-first-southern-north-sea-wind-farms (accessed on 11 April 2022).
  55. NREL. National Renewable Energy Laboratory (NREL) Home Page|NREL. 2022. Available online: https://www.nrel.gov/ (accessed on 13 June 2022).
  56. Vestas. Vestas Home Page; Vestas: Aarhus, Denmark, 2022; Available online: https://www.vestas.com/en (accessed on 13 June 2022).
  57. Areva. Multibrid M5000-5.00 MW—Wind Turbine. 2014. Available online: https://en.wind-turbine-models.com/turbines/22-multibrid-m5000 (accessed on 13 June 2022).
  58. Areva. AREVA Delivers M5000 Turbines for Trianel’s Borkum Wind Farm; Offshore Wind: 2012. Available online: https://www.sa.areva.com/EN/news-9261/offshore-wind-areva-delivers-m5000-turbines-for-trianel-s-borkum-wind-farm.html (accessed on 13 June 2022).
  59. Kamranzad, B.; Hadadpour, S. A multi-criteria approach for selection of wave energy converter/location. Energy 2020, 204, 117924. [Google Scholar] [CrossRef]
  60. Guillou, N.; Chapalain, G. Annual and seasonal variabilities in the performances of wave energy converters. Energy 2018, 165, 812–823. [Google Scholar] [CrossRef]
  61. Orkney Islands Council Buys Defunct Pelamis Wave Generator for £1—BBC News. Available online: https://www.bbc.com/news/uk-scotland-north-east-orkney-shetland-40518995 (accessed on 18 September 2022).
  62. US Dollar to Euro Spot Exchange Rates for 2015. Available online: https://www.exchangerates.org.uk/USD-EUR-spot-exchange-rates-history-2015.html (accessed on 4 July 2022).
  63. €100 in 2015→2022|Euro Inflation Calculator. Available online: https://www.in2013dollars.com/europe/inflation/2015?amount=100 (accessed on 4 July 2022).
  64. IEA. Offshore Wind Outlook 2019—Analysis; IEA: Paris, France, 2019. Available online: https://www.iea.org/reports/offshore-wind-outlook-2019 (accessed on 9 April 2022).
Figure 1. Day-ahead prices (EUR/MWh) on 16 September 2022. Data from Nord Pool [25].
Energies 16 04316 g001
Figure 2. Flowchart of the modelling performed in the study.
Energies 16 04316 g002
Figure 3. Case study area. The proposed hybrid farm is located 7 km off the Norwegian coast and 30 km off the port of Stavanger.
Energies 16 04316 g003
Figure 4. Scenarios for different wave and wind capacity ratings.
Energies 16 04316 g004
Figure 5. Wind and wave resources in Stavanger during 2019 and 2020.
Energies 16 04316 g005
Figure 6. Difference in wind speed and wave height peaks for November 2020. Sample (red dots) average lag is 2.6 h.
Energies 16 04316 g006
Figure 7. Monthly electricity price in Norway 2019–2022. A comparison of Nord Pool data for the price regions of Stavanger (NO2) and Trondheim (NO3). In 2021 the electricity prices started to increase in south Norway, while the rest of Norway maintained remarkably lower electricity prices.
Energies 16 04316 g007
Figure 8. Power matrices of the (a) WaveStar [59], (b) Pelamis [60], and (c) WaveDragon [60] according to the literature. The bin sizes are corrected by averaging the new bins according to the adjacent bin values.
Energies 16 04316 g008
Figure 9. Wind speeds in the case area of Stavanger plotted against turbine power curves.
Energies 16 04316 g009
Figure 10. CAPEX breakdown for offshore wind. Source: IRENA 2020 report.
Energies 16 04316 g010
Figure 11. Energy production of each device in Stavanger as a function of the installed capacity for (a) 2019 and (b) 2020.
Energies 16 04316 g011
Figure 12. Annual energy production (AEP) of single devices with 100 MW capacity for the years 2019 and 2020 in Stavanger. In (a) the capacity factor is shown, and in (b) the AEP is shown.
Energies 16 04316 g012
Figure 13. Capacity factor for individual devices alone (no hybrid farm scenarios) with a 100MW installed capacity. The years 2019 and 2020 are represented for the Stavanger case study.
Energies 16 04316 g013
Figure 14. Monthly electricity production of the hybrid farm in scenario C. The most efficient device pairing, the Vestas and WaveStar600 kW, is used.
Energies 16 04316 g014
Figure 15. LCOE sensitivity for different wind–wave splits, while the total farm capacity is assumed at 200 MW.
Energies 16 04316 g015
Figure 16. LCOE sensitivity to the real return rate. Scenario A in the year 2020 is considered and the cost reduction factor is set to 15%.
Energies 16 04316 g016
Table 1. Literature review on the LCOE for wind and wave technologies.
Farm TypeLCOESourceYear
Wave150–500 (EUR/MWh)[34]2021
Wave674–688 (EUR/MWh)[18]2015
Wave185–1596 (EUR/MWh)[35]2016
Wave370–1220 (USD/kWh)[36]2018
Co-located199–308 (EUR/MWh)[18]2015
Offshore Wind84 (USD/kWh)[31]2020
Onshore Wind39 (USD/kWh)[31]2020
Table 2. Literature estimates for wave energy CAPEX and OPEX.
SourceTotal CAPEXAnnual OPEX
[38]6.2–16.1 (M EUR/MW)180–200 (USD/kW-year)
[39]3.220–5.367 (M EUR/MW)0.50–3.00% of total CAPEX
[35]2.5–6.0 (M EUR/MW)3% of total CAPEX
[40]2.3–8.0 (M USD/MW)3% of total CAPEX
[33]-1.5–5% of total CAPEX
Table 3. Offshore wind CAPEX examples from the literature.
SourceTotal CAPEXTurbine CAPEXYear
[31]2.745–4.552 (M USD/MW)40% of total CAPEX2020
[41]3.349–4.023 (M EUR/MW)1.462–1.587 (M EUR/MW)2018
[32]3.200 (M GBP/MW)1.540 (M GBP/MW)2016
[42]--1.300 (M EUR/MW)2021
Table 4. Offshore vs. onshore wind OPEX.
SourceOffshore Wind OPEXOnshore Wind OPEXYear
[31]70–129 USD/kW/year33–56 USD/kW/year2020
[42]63.7–100.7 USD/kW/year--2021
[43]75–240 EUR/kW/year--2018
[44]95 USD/kW/year34 USD/kW/year2020
Table 5. Technical details for the three considered OWTs.
Vestas V112-3.0Areva Multibird m5000Vestas V164-7.0
Rated power3 MW5 MW7 MW
Rotor diameter112 m116 m164 m
Hub height80 m90 m105 m
Shear coefficient0.140.140.14
Table 6. WEC device cost per installed capacity. Value for a 600 kW WaveStar device interpolated linearly using the adjacent values of 500 kW and 1000 kW [33].
Power Rating of Single WEC Unit (kW)Cost of Installed WEC Capacity (EUR/kW)
2505000
5004000
6003800 (interpolated)
10003000
Table 7. CAPEX for the case study devices.
TechnologyDevice CAPEX (USD/kW)Value in 2020 (EUR/kW) SourceYear
Any wind turbine13581191[31]2020
WaveStar 600 kW-3800 (interpolated)--
Pelamis 750 kW33333041[33]2015
WaveDragon 5900 kW24002190[33]2015
Table 8. Comparison of all device combinations with the lowest cost bolded in each column scenario. Cost sharing factors are set to 0% (a), 15% (b), and 30% (c).
(a) LCOE scenarios with 0% shared economy (EUR/MWh)
20192020
Device PairABCABC
Vestas 3 MW & WaveStar 600 kW183231143140161119
Areva 5 MW & WaveStar 600 kW207251168153170135
Vestas 7 MW & WaveStar 600 kW190241149144165123
Vestas 3 MW & Pelamis 750 kW243392163196280142
Areva 5 MW & Pelamis 750 kW292460199225311167
Vestas 7 MW & Pelamis 750 kW258428172205296148
Vestas 3 MW & WaveDragon 5900 kW197283143160207124
Areva 5 MW &WaveDragon 5900 kW232322173181227145
Vestas 7 MW & WaveDragon 5900 kW207303151166217129
(b) LCOE scenarios with 15% shared economy (EUR/MWh)
20192020
Device PairABCABC
Vestas 3 MW & WaveStar 600 kW166210129127147107
Areva 5 MW & WaveStar 600 kW188229152139155122
Vestas 7 MW & WaveStar 600 kW173219135130150111
Vestas 3 MW & Pelamis 750 kW220356147178254128
Areva 5 MW & Pelamis 750 kW264417179204282150
Vestas 7 MW & Pelamis 750 kW234389155186269133
Vestas 3 MW & WaveDragon 5900 kW177255129144187112
Areva 5 MW &WaveDragon 5900 kW209290155163204131
Vestas 7 MW & WaveDragon 5900 kW187273135149195116
(c) LCOE scenarios with 30% shared economy (EUR/MWh)
20192020
Device PairABCABC
Vestas 3 MW & WaveSar 600 kW14918911511413296
Areva 5 MW & WaveSar 600 kW169206136125140109
Vestas 7 MW & WaveSar 600 kW15519712111713599
Vestas 3 MW & Pelamis 750 kW197319131159228114
Areva 5 MW & Pelamis 750 kW236375160183253134
Vestas 7 MW & Pelamis 750 kW209349139166241119
Vestas 3 MW & WaveDragon 5900 kW15722711412816699
Areva 5 MW &WaveDragon 5900 kW186258138145182116
Vestas 7 MW & WaveDragon 5900 kW166243120133174103
Disclaimer/Publisher’s Note: The statements, opinions and data contained in all publications are solely those of the individual author(s) and contributor(s) and not of MDPI and/or the editor(s). MDPI and/or the editor(s) disclaim responsibility for any injury to people or property resulting from any ideas, methods, instructions or products referred to in the content.

