
Durability Study of Frequent Dry–Wet Cycle on Proton Exchange Membrane Fuel Cell
Abstract
:1. Introduction
2. Experiment
- (1)
- Activate the battery (refer to the “Membrane Electrode Test and Evaluation System” for the activation method and stay at the rated operating point for more than 2 h until the performance is stable). The activation procedure is the same as above;
- (2)
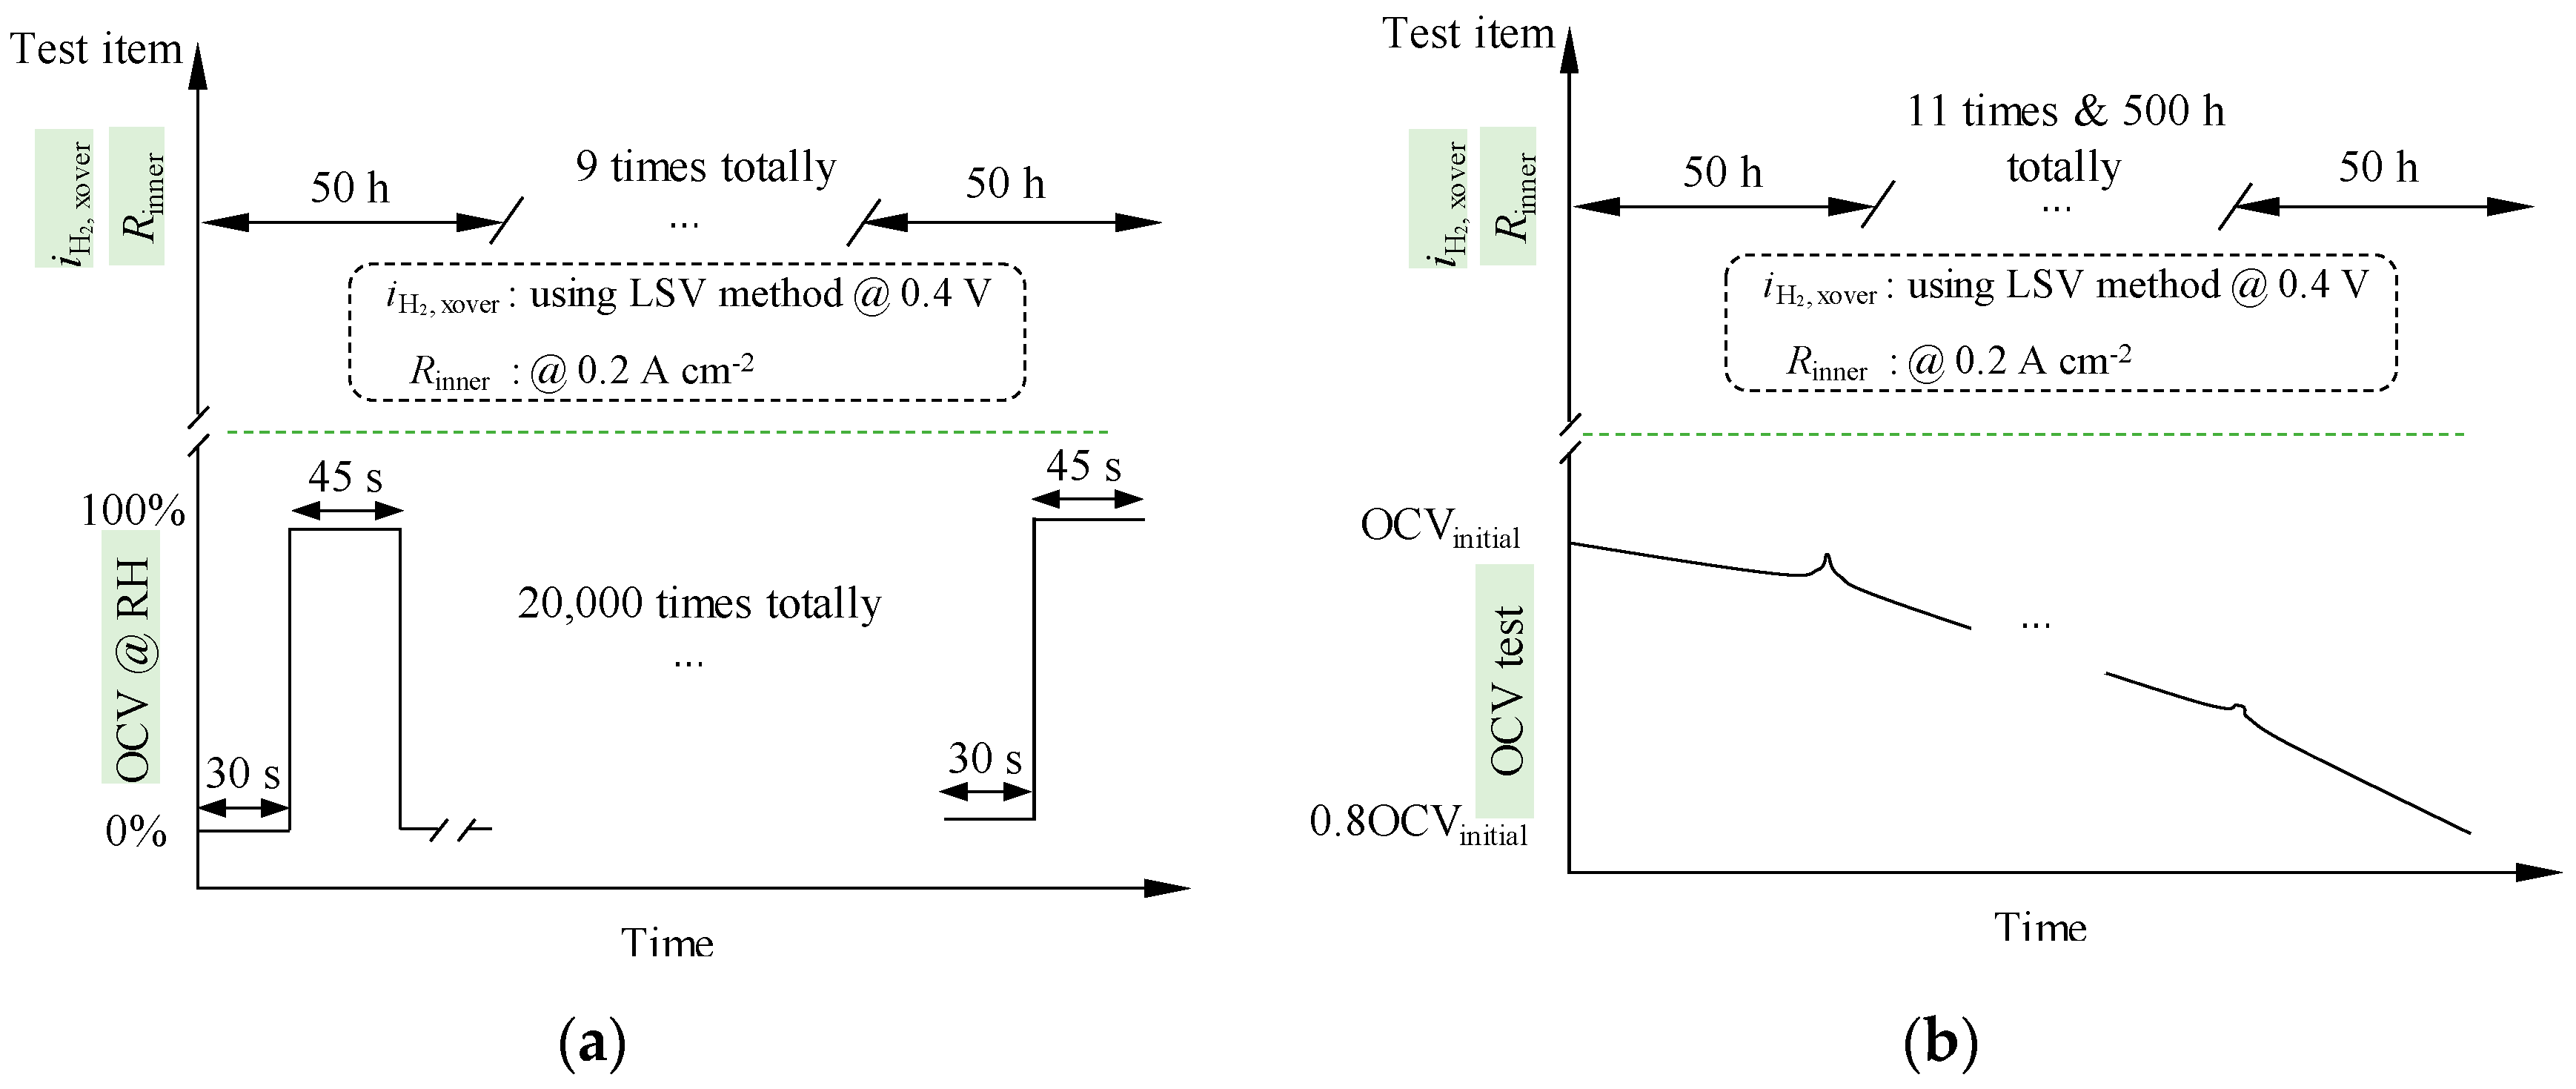
- Cycle test: 0%RH (30 s)~90 °C dew point (45 s) (normal temperature dry gas (30 s)~90 °C humidity (45 s));
- (3)
- Conduct air permeability current (LSV) and high-frequency impedance (EIS) tests at 0.2 A/cm2 every 50 h, where LSV should be performed at 80 °C, 100% humidified, and without back pressure;
- (4)
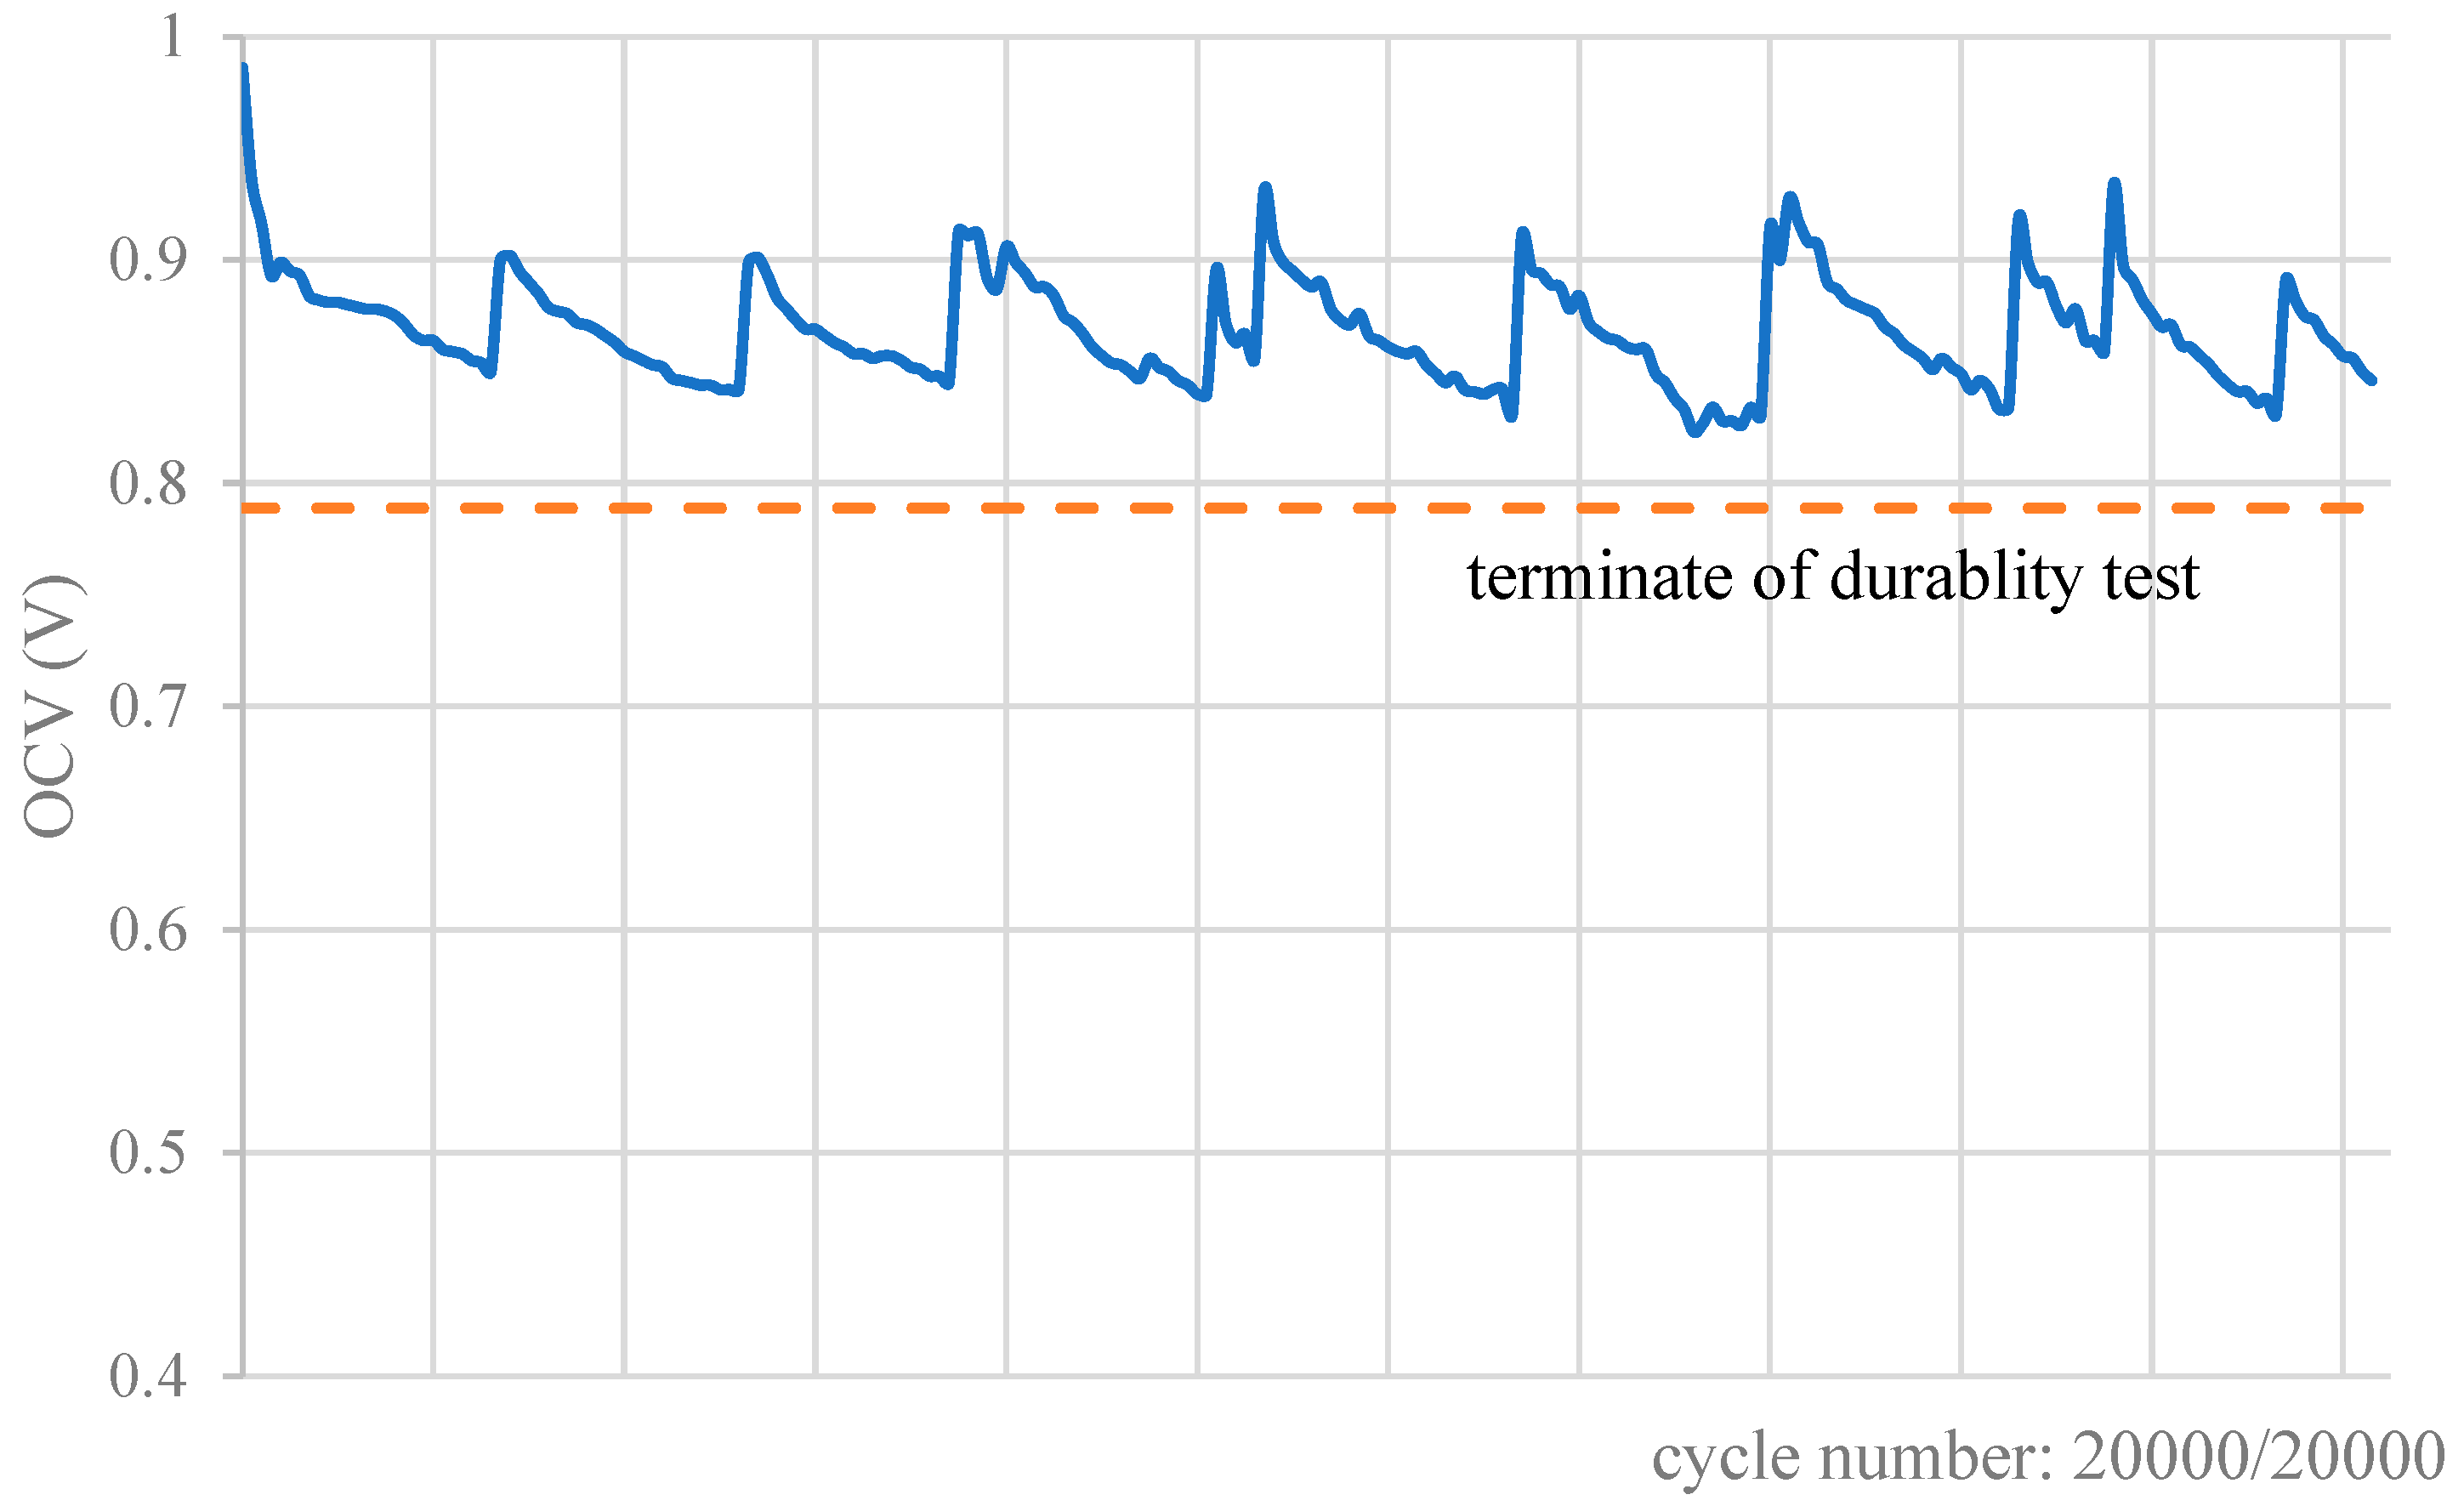
- The experiment stops when the OCV decreases by 20%; or the LSV value is ≥15 mA/cm2; or the experiment stops when 20,000 cycles are completed.
- (1)
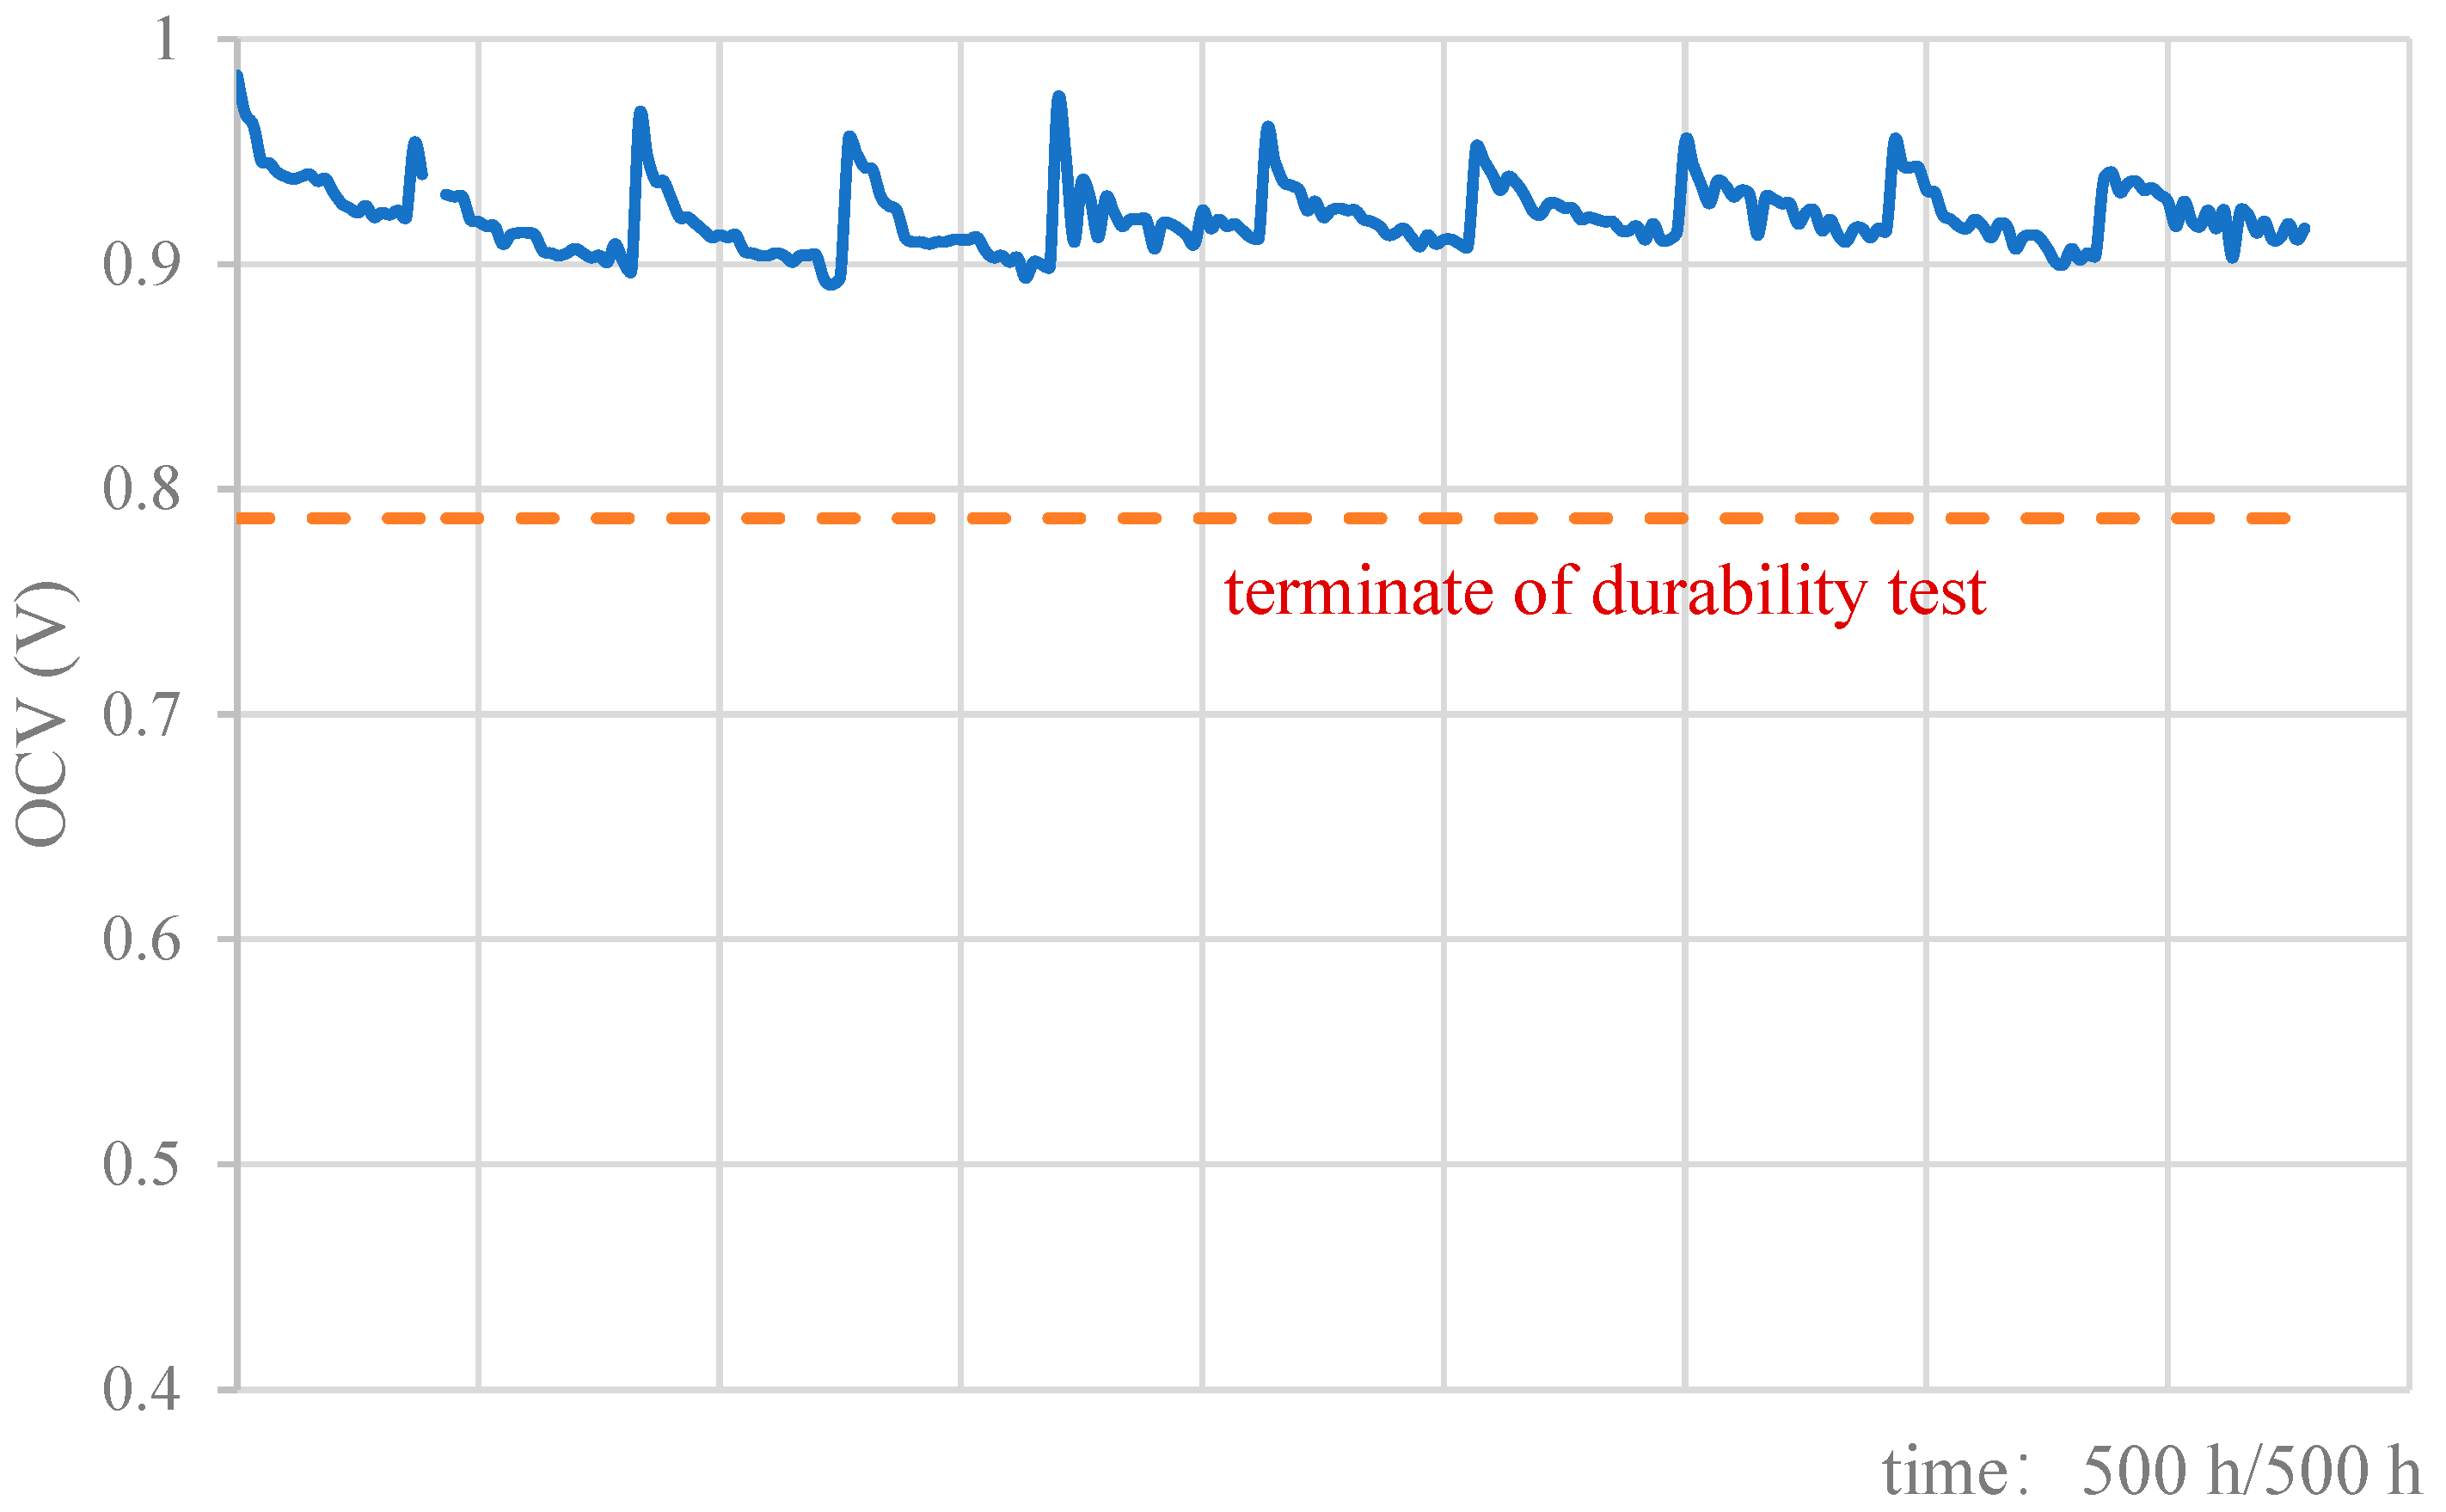
- Similarly, the chemical durability test (Figure 1b) was carried out under open circuit state until the open circuit voltage (OCV) declines 20%, during which, the and the inner resistance was measured for every 50 h in the same conditions in which they were measured in the mechanical durability test. The test procedure is as follows: Activate the battery (refer to the “Membrane Electrode Test and Evaluation System” for the activation method, and stay at the rated operating point for more than 1 h until the performance is stable);
- (2)
- After the activation is completed, keep the battery at the open circuit voltage (OCV) state, record the OCV change value until the OCV is reduced by 20%, and record the OCV running time (at least 500 h);
- (3)
- Conduct air permeability current (LSV) and resistance test at 0.2 A/cm2 current density were tested every 50 h (be sure to blow H2/N2 until the voltage drops below 0.1 V) was tested. After activation, the resistance between the graphite plates was tested with a multimeter. The ohmic resistance between the plates was tested 3 times, and the data were recorded manually. LSV should be performed at 80 °C, 100% humidified, and with no back pressure;
- (4)
- Test end point: OCV attenuation of 20%; or LSV value ≥ 15 mA/cm2.
3. Results and Discussion
3.1. General Influence for Durability
3.2. Dry–Wet Cycle Causing Mechanical Damage
3.3. Typical Long-Time High Potential Affecting Durability
4. Conclusions
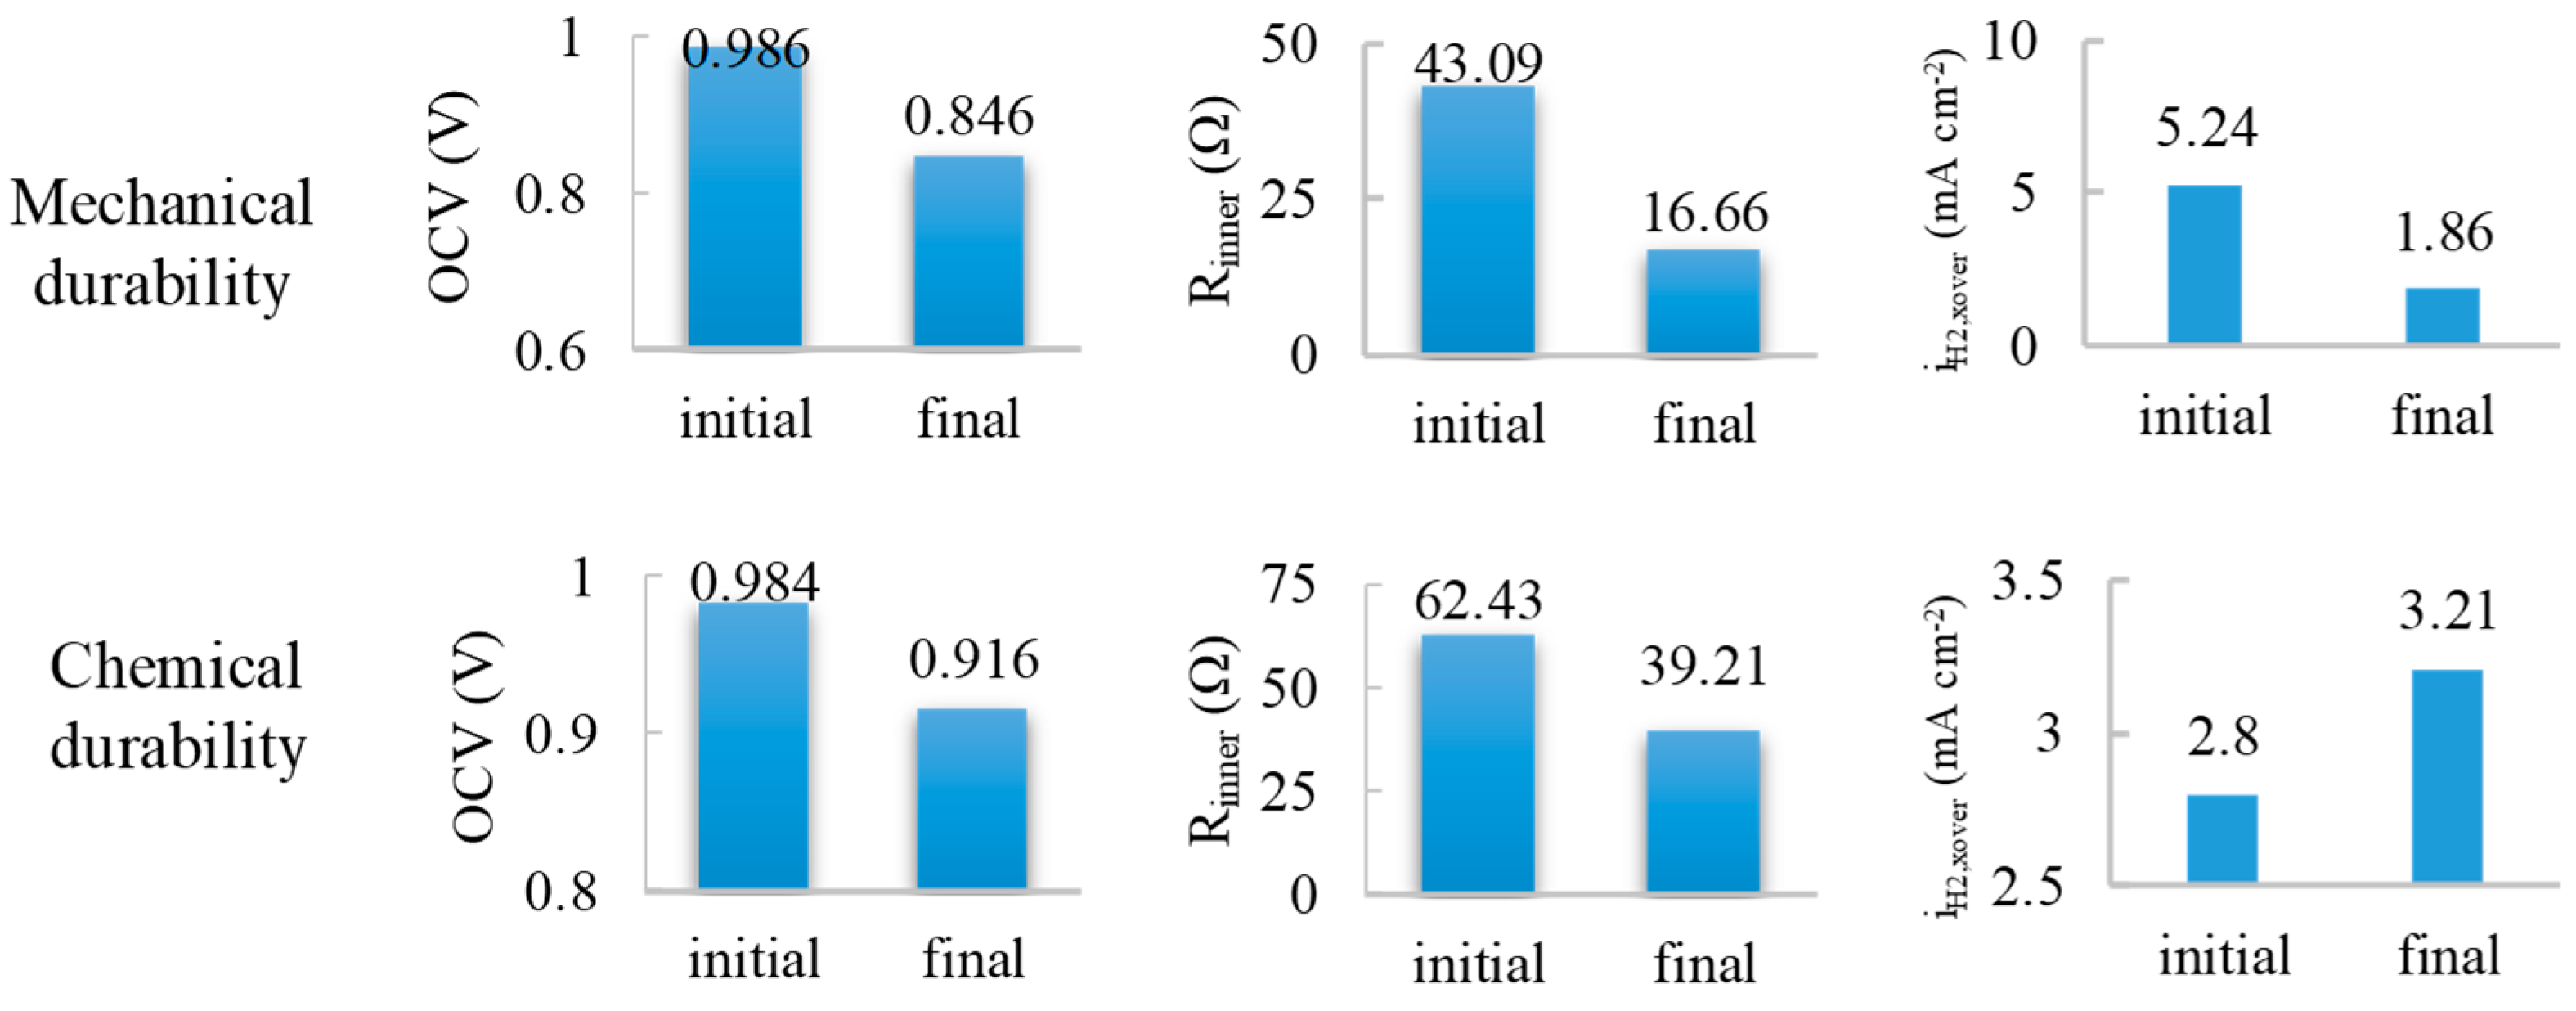
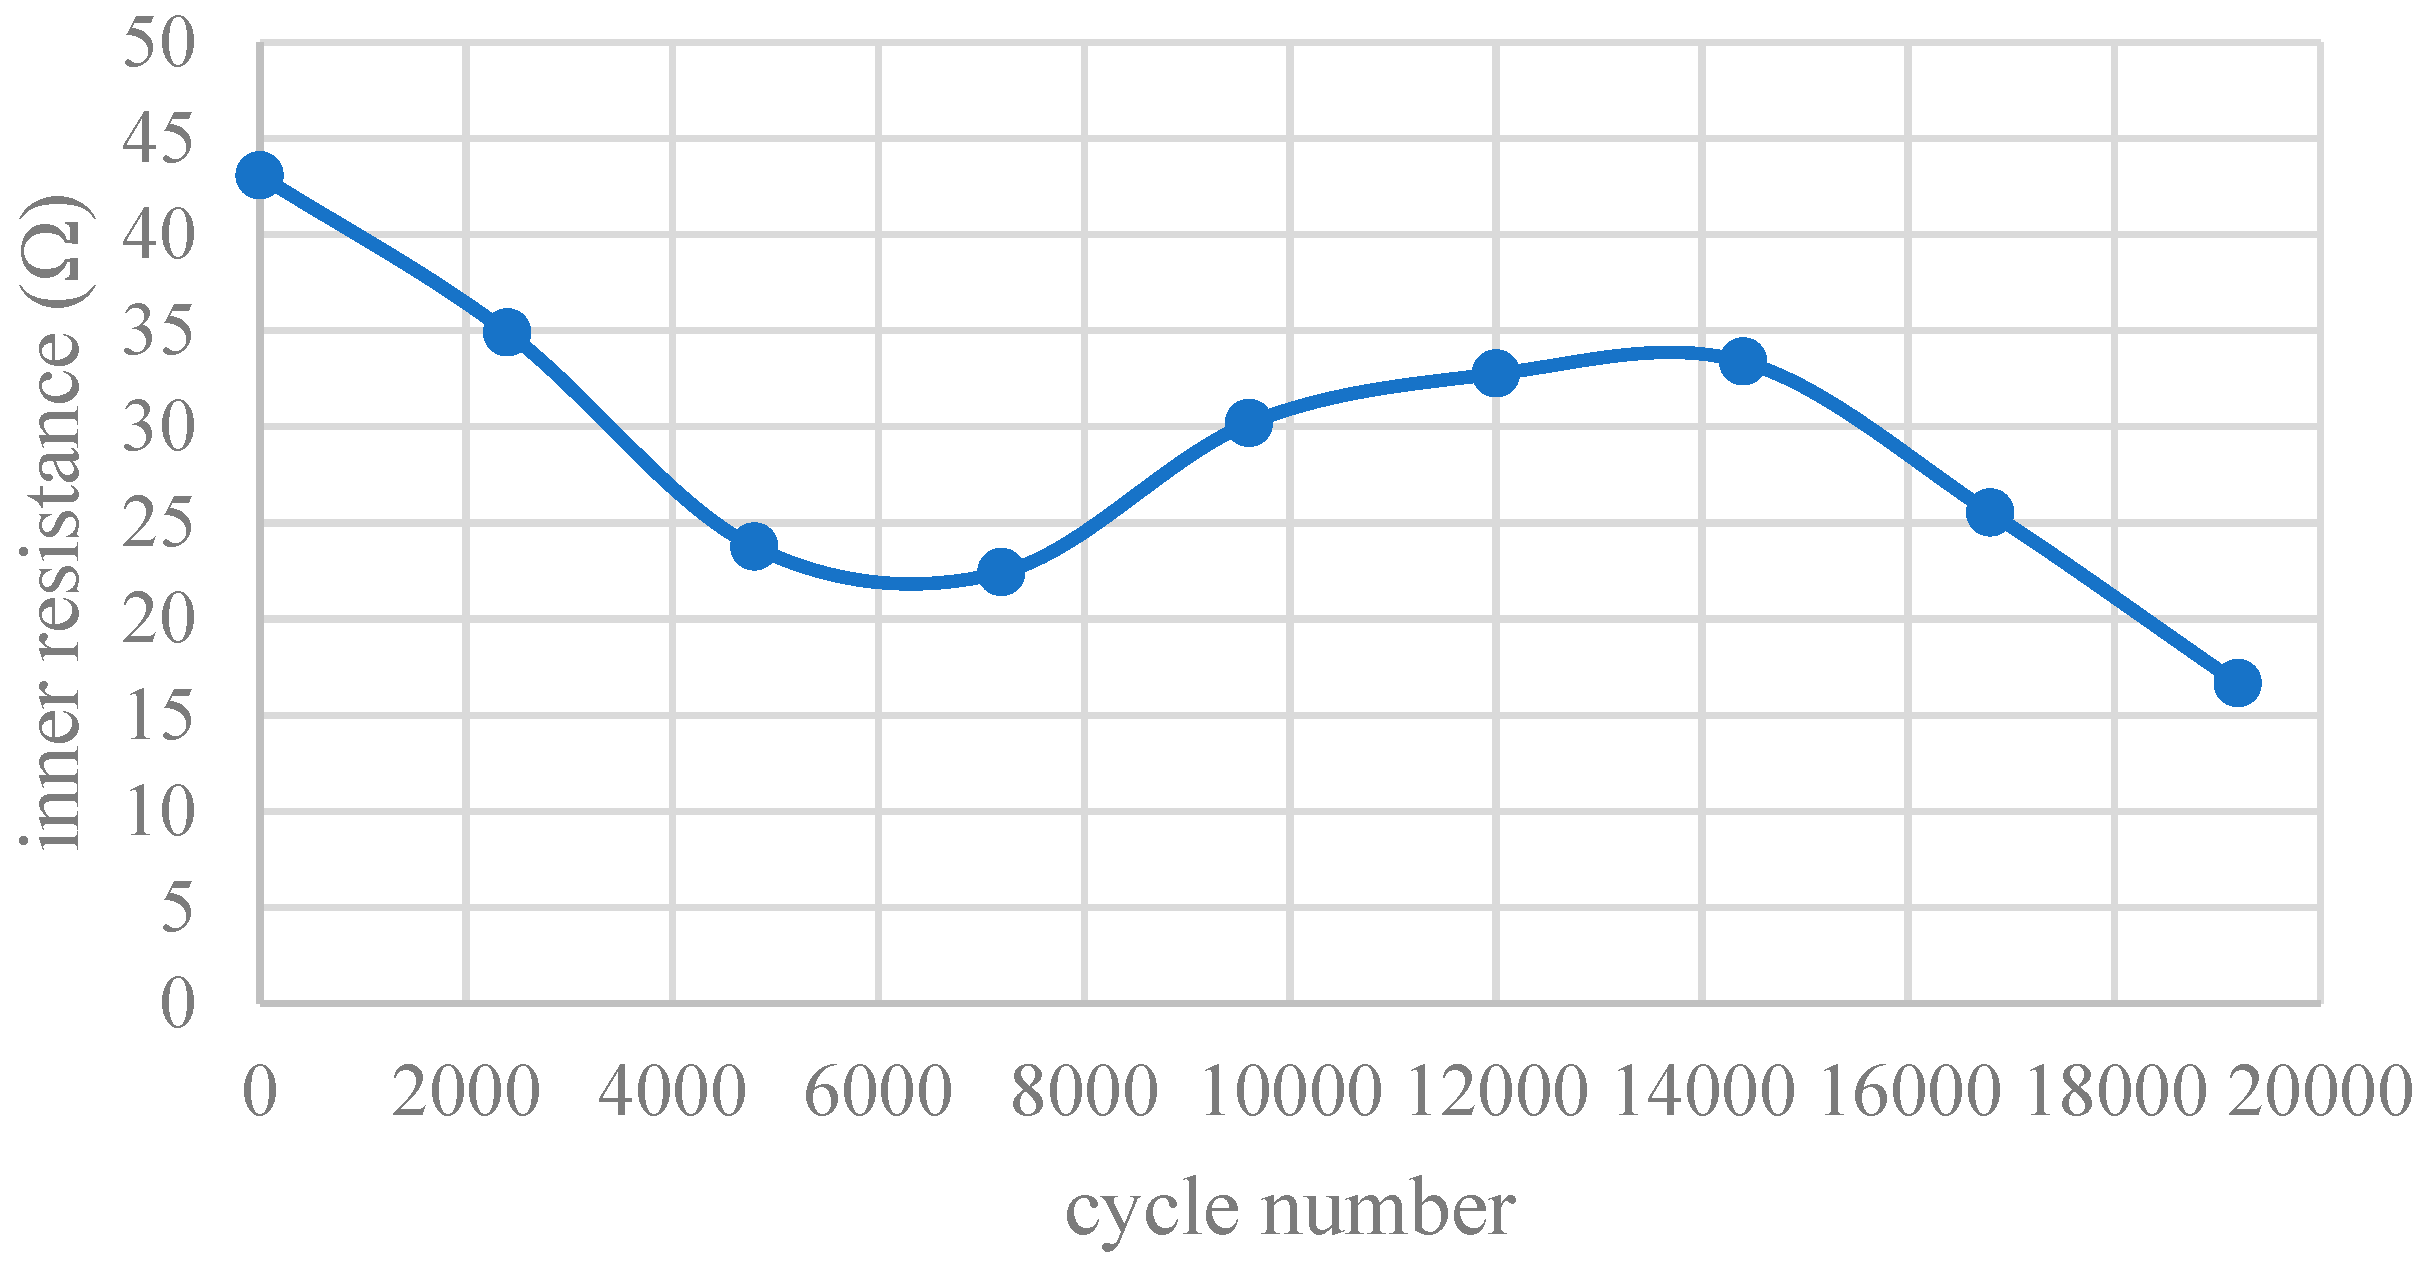
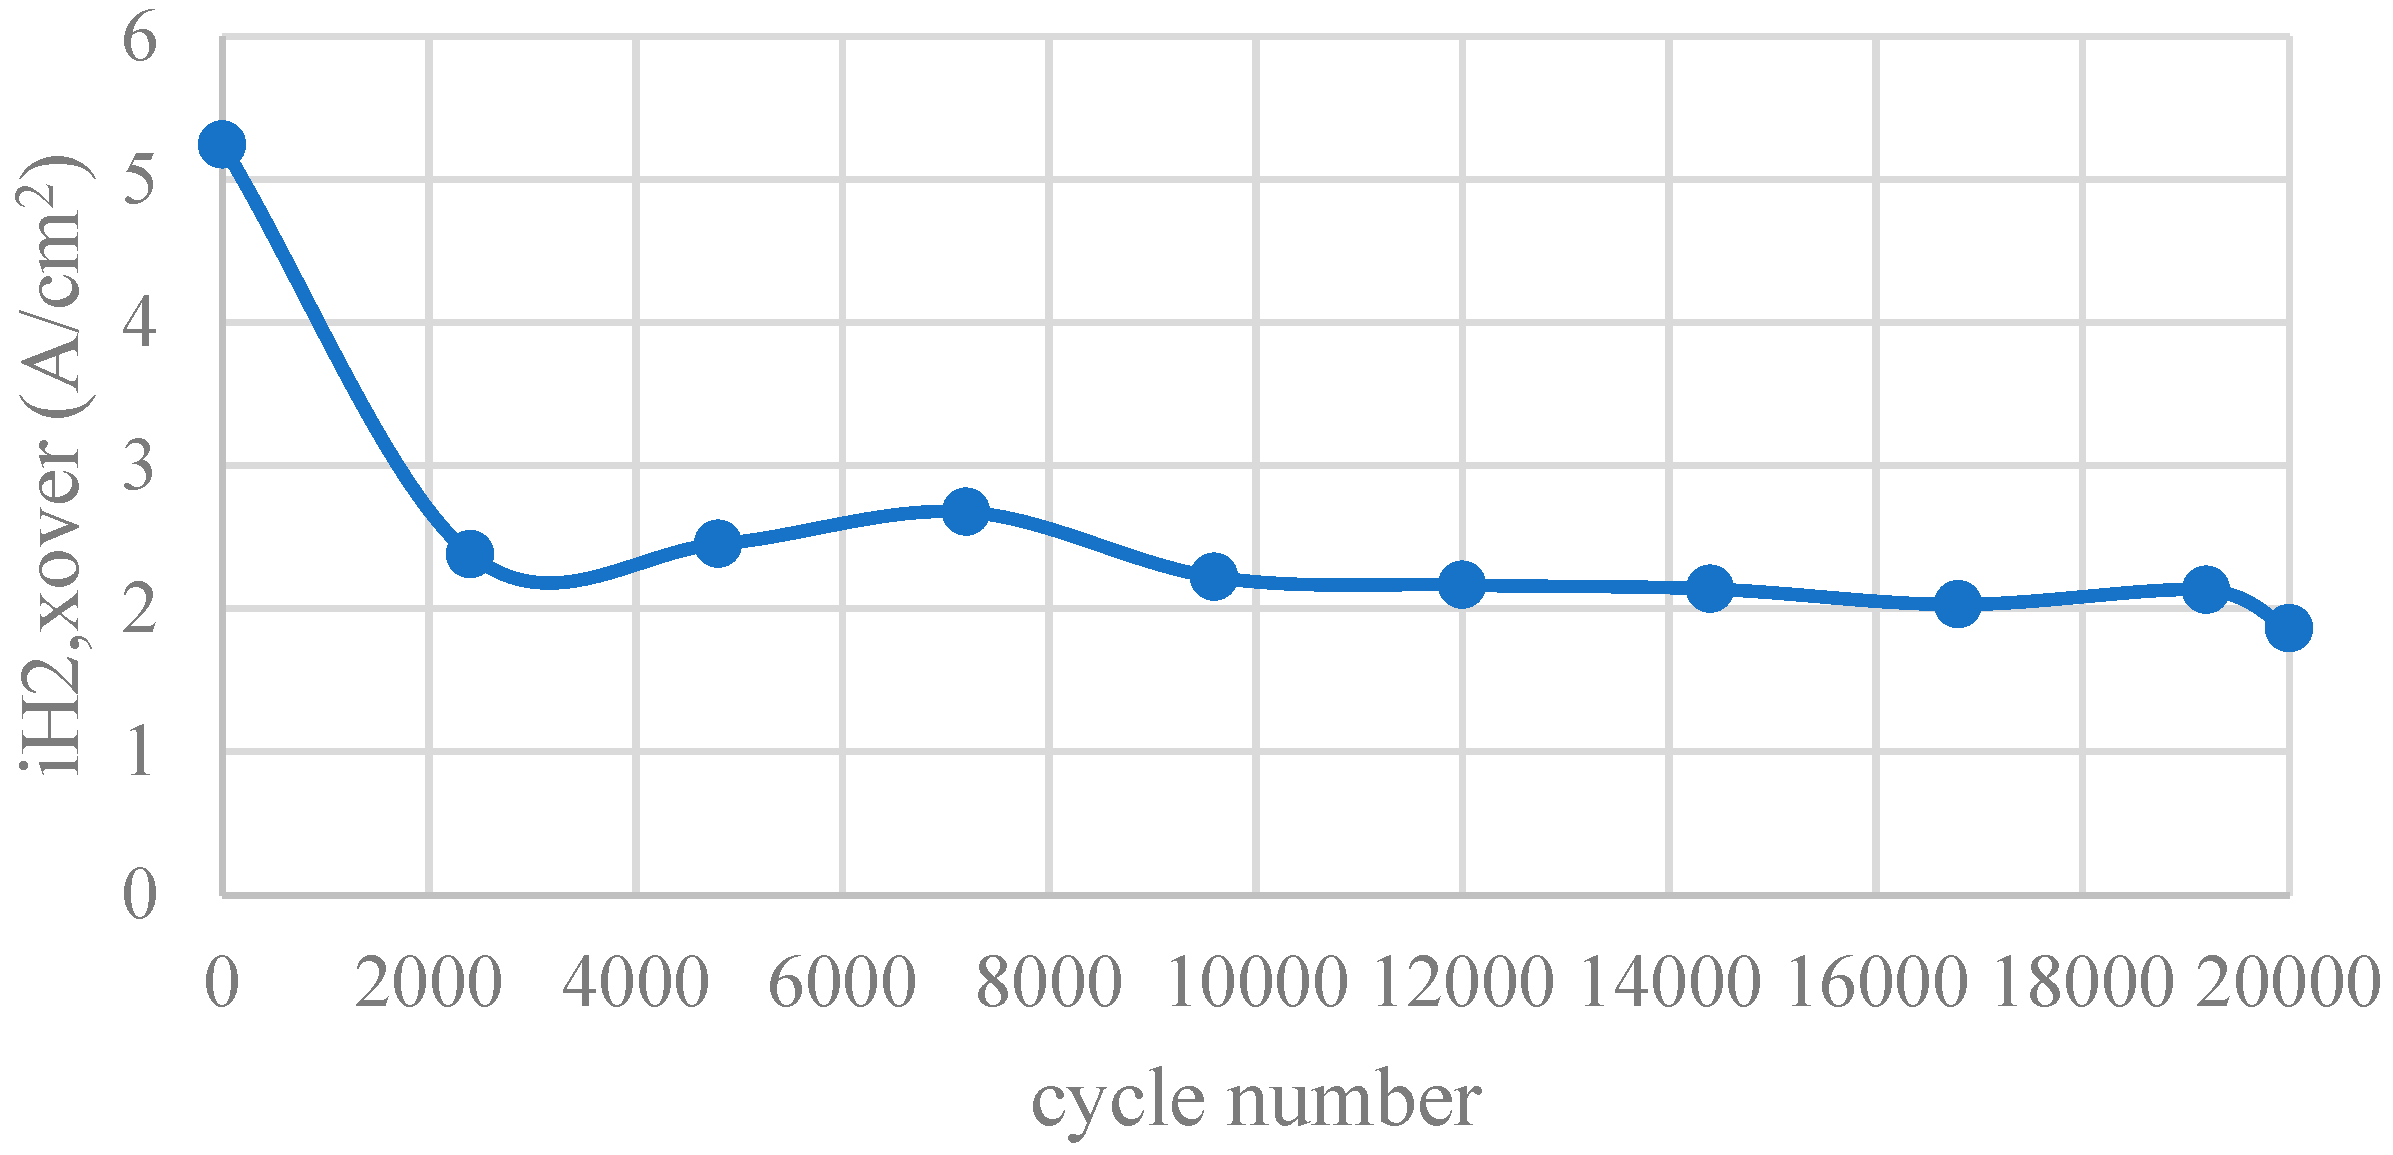
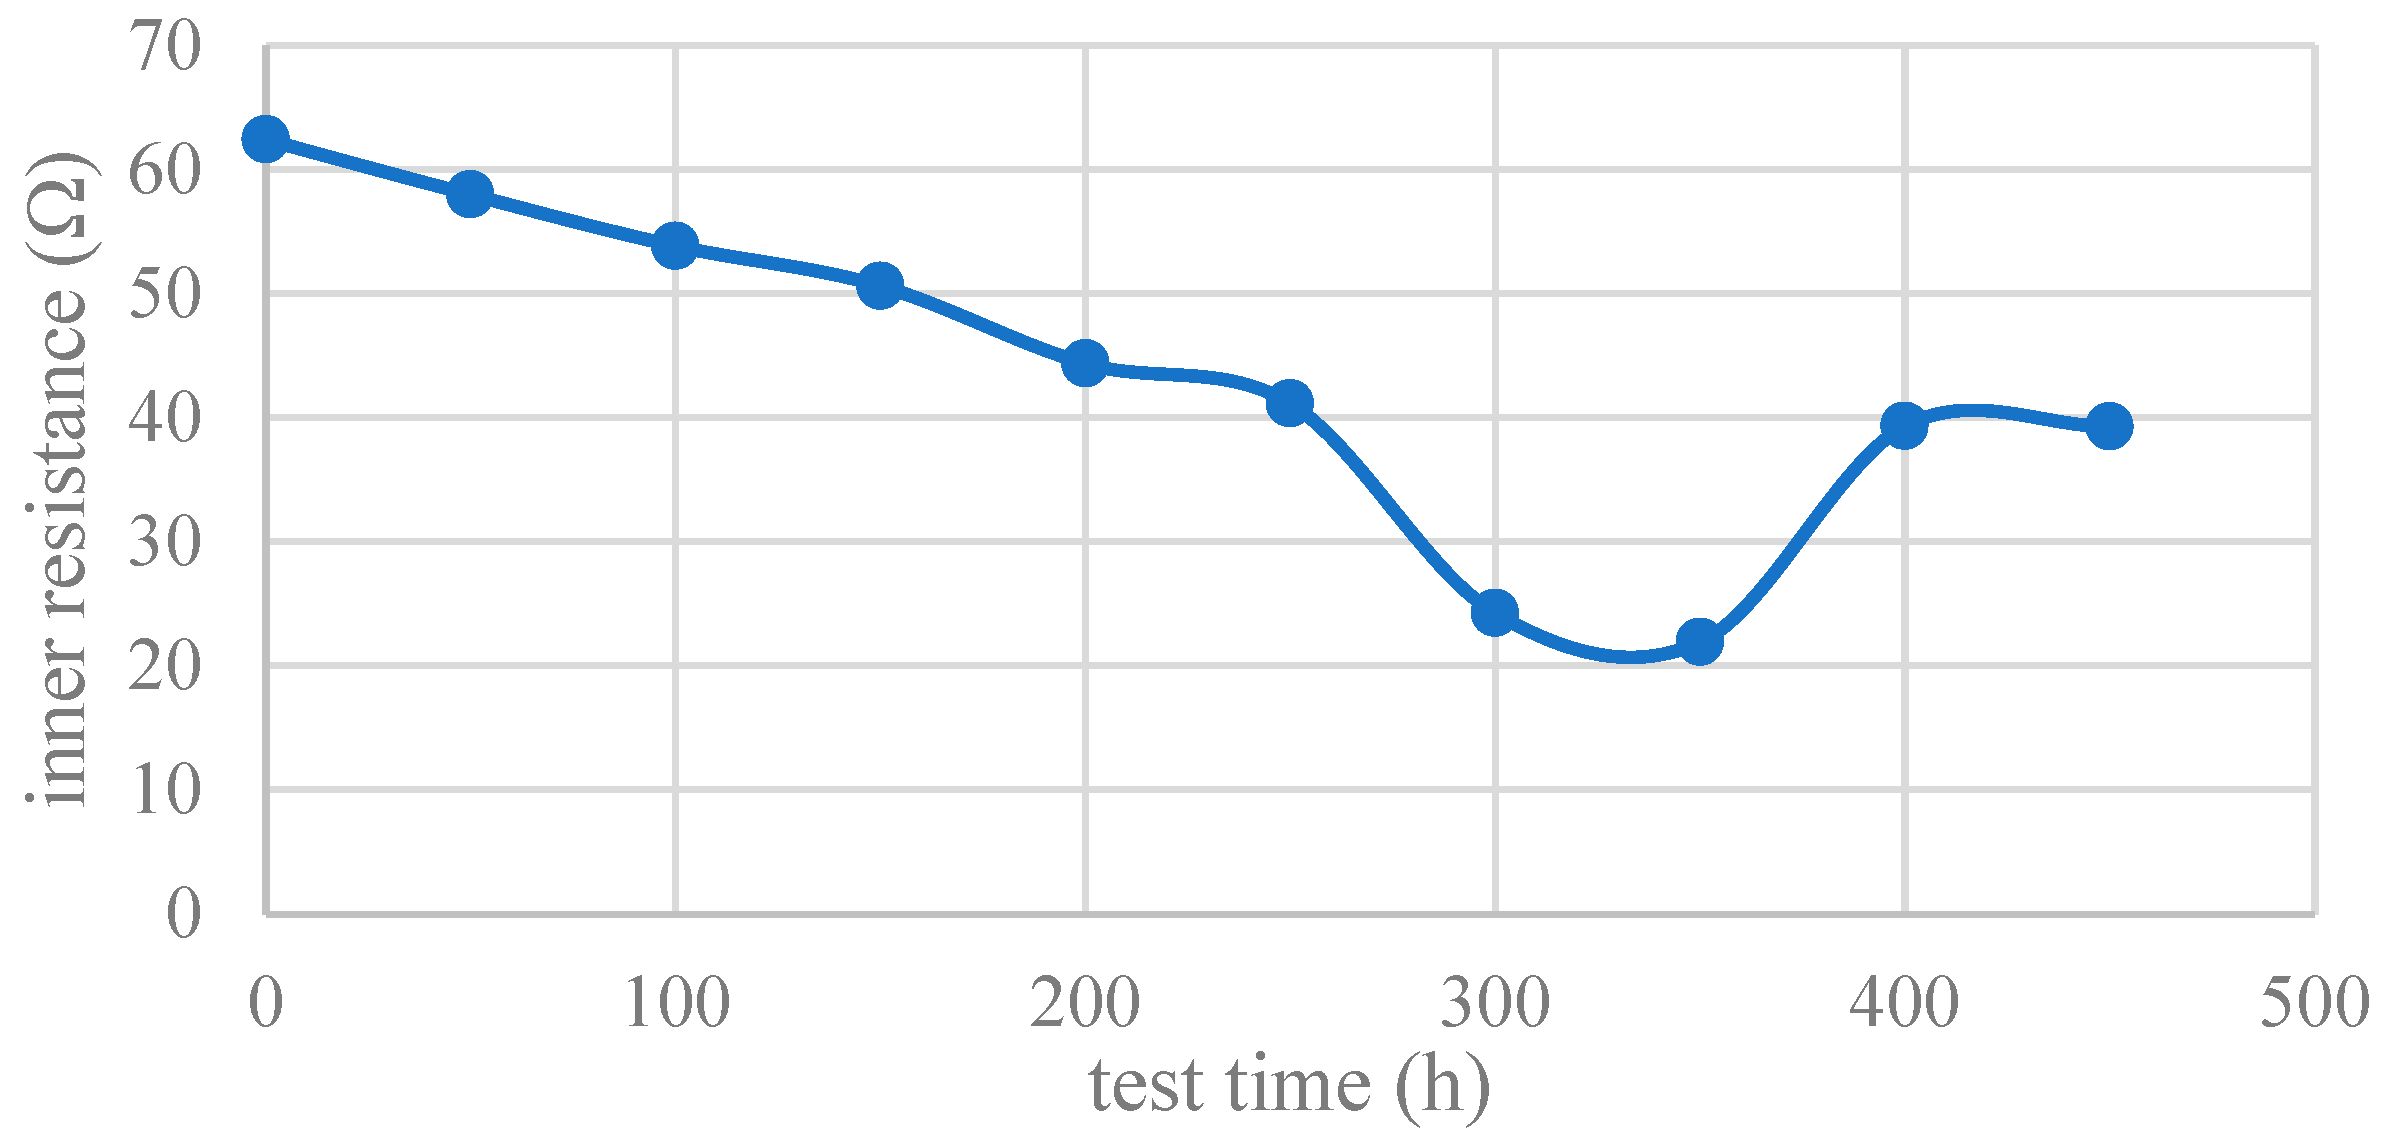
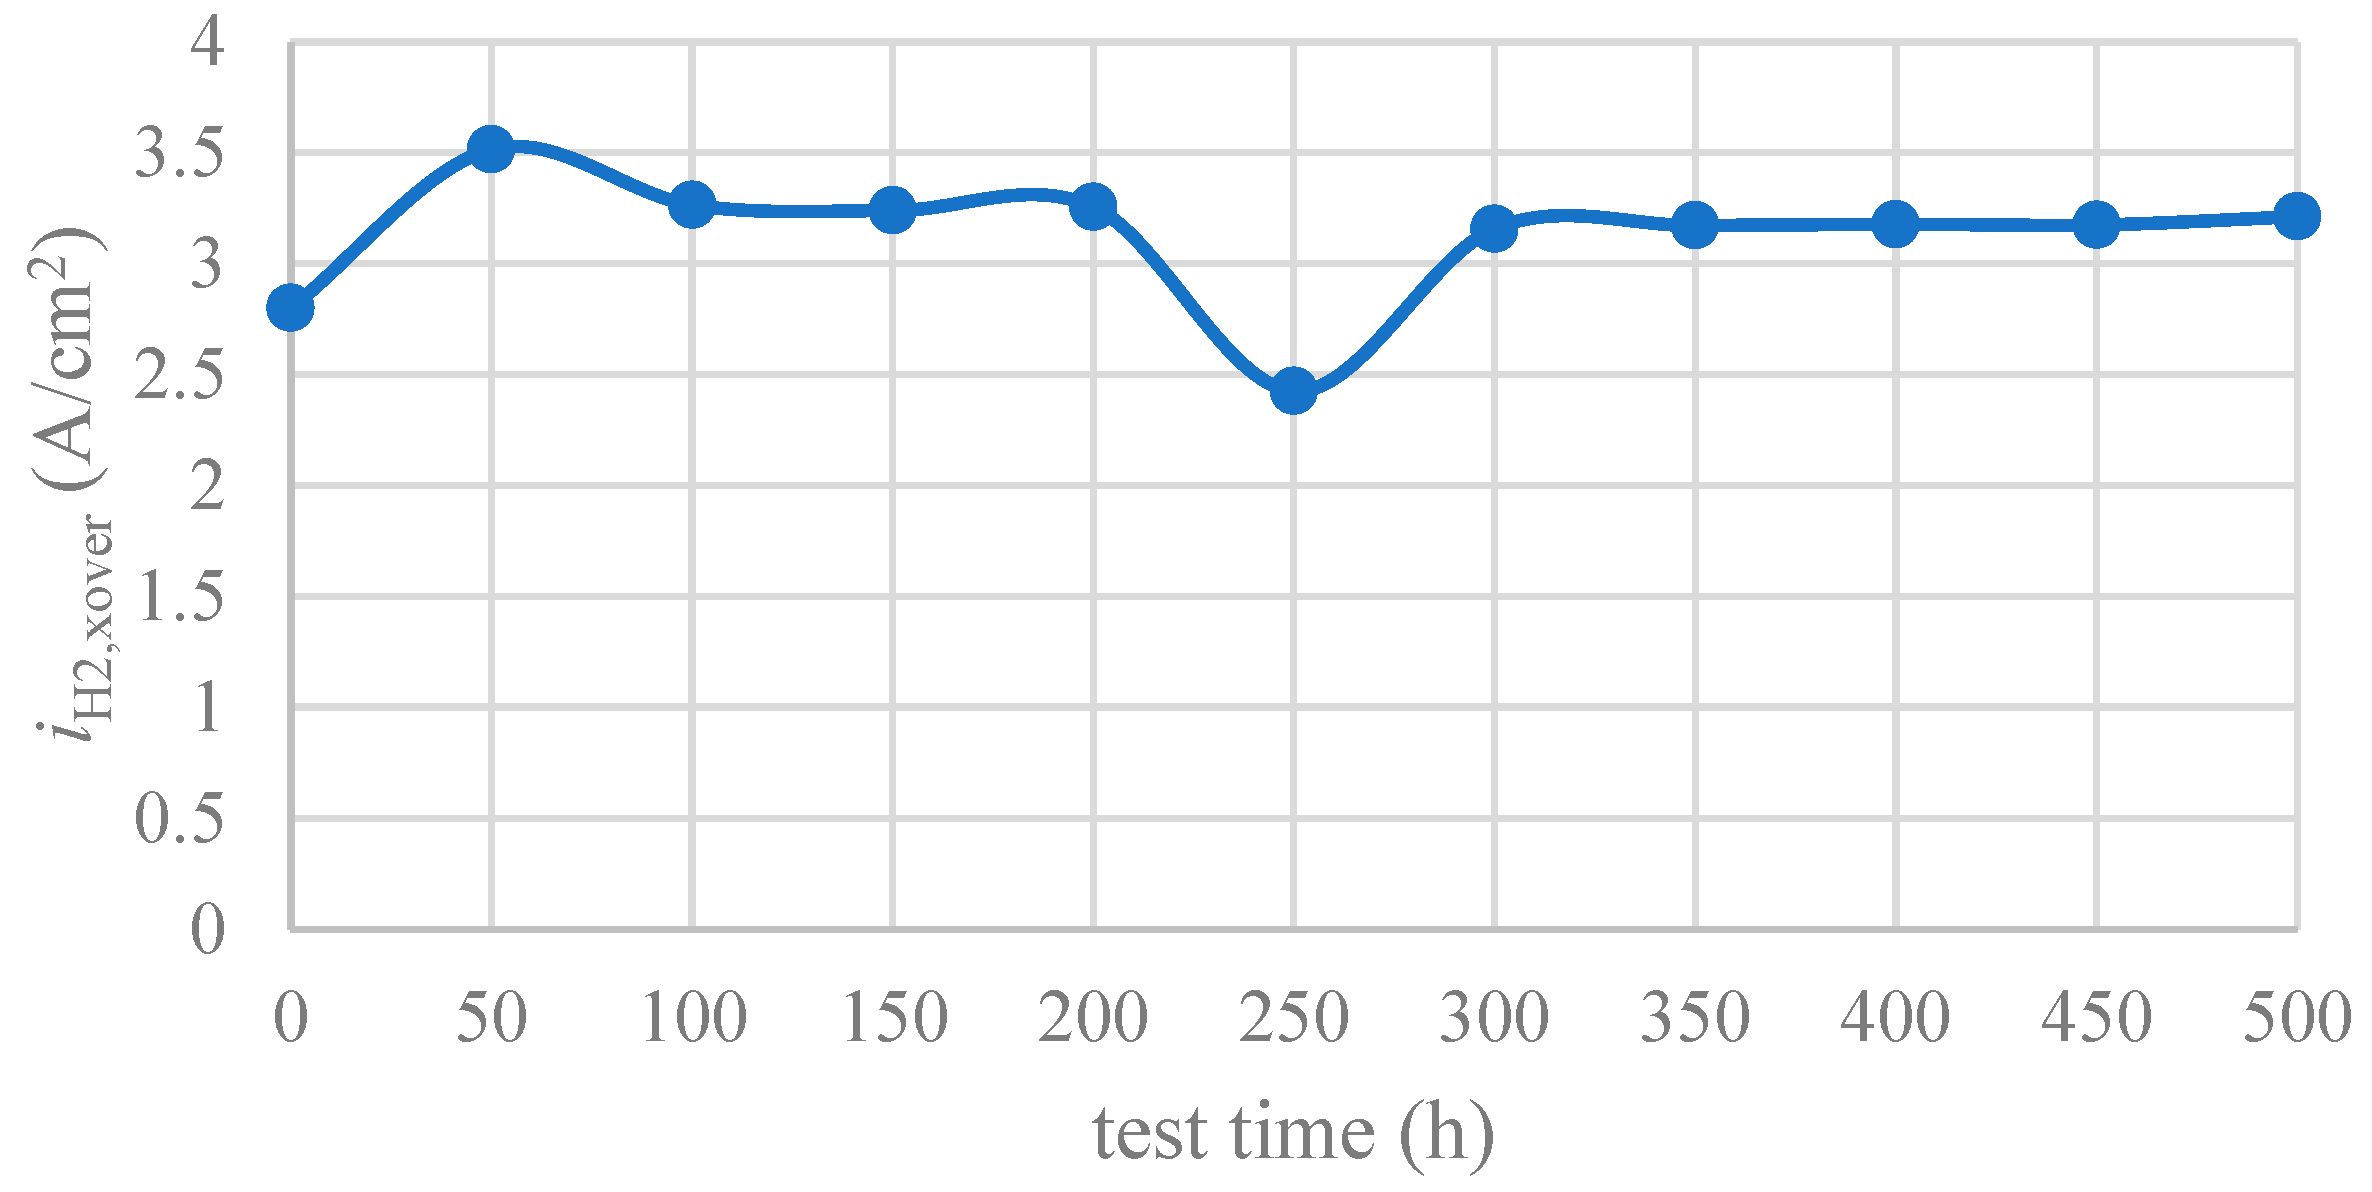
- Compared to the pure high potential storage, the frequent dry–wet cycle plays a significant role in deteriorating the fuel cell open circuit voltage as much as 14%. However, the degradation of the catalyst coated membrane (CCM) is alleviated under the dry–wet cycle; for instance, the decline of inner resistance is as high as 61%, whereas it is 37% under pure high potential running. In addition, the hydrogen crossover current is improved, reflected by the declining , whereas the value increases under the pure high potential running;
- During the 20,000 dry–wet cycles, the CCM experiences catalyst degradation, crack, and platinum transfer towards the membrane;
- The dry–wet cycles could also humidify the membrane, and, to some extent, the moisture could heal the crack so as to improve the activation effect;
- From the perspective of open circuit voltage, we should avoid storing fuel cells at frequently changing humidities.
Author Contributions
Funding
Data Availability Statement
Conflicts of Interest
References
- Zhang, H.; Sun, C.; Ge, M. Review of the Research Status of Cost-Effective Zinc–Iron Redox Flow Batteries. Batteries 2022, 8, 202. [Google Scholar] [CrossRef]
- Li, Y.; Yang, F.; Chen, D.; Hu, S.; Xu, X. Thermal-physical modeling and parameter identification method for dynamic model with unmeasurable state in 10-kW scale proton exchange membrane fuel cell system. Energy Convers. Manag. 2023, 276, 116580. [Google Scholar] [CrossRef]
- Li, B.; Wan, K.; Xie, M.; Chu, T.; Wang, X.; Li, X.; Yang, D.; Ming, P.; Zhang, C. Durability degradation mechanism and consistency analysis for proton exchange membrane fuel cell stack. Appl. Energy 2022, 314, 119020. [Google Scholar] [CrossRef]
- Ren, P.; Pei, P.; Li, Y.; Wu, Z.; Chen, D.; Huang, S. Degradation mechanisms of proton exchange membrane fuel cell under typical automotive operating conditions. Prog. Energy Combust. Sci. 2020, 80, 100859. [Google Scholar] [CrossRef]
- Guan, W.; Du, Z.; Wang, J.; Jiang, L.; Yang, J.; Zhou, X. Mechanisms of performance degradation induced by thermal cycling in solid oxide fuel cell stacks with flat-tube anode-supported cells based on double-sided cathodes. Int. J. Hydrogen Energy 2020, 45, 19840–19846. [Google Scholar] [CrossRef]
- Wang, D.; Hu, J.; Liu, B.; Hou, H.; Yang, J.; Li, Y.; Zhu, Y.; Liang, S.; Xiao, K. Degradation of refractory organics in dual-cathode elec-tro-Fenton using air-cathode for H2O2 electrogeneration and microbial fuel cell cathode for Fe2+ regeneration. J. Hazard. Mater. 2021, 412, 125269. [Google Scholar] [CrossRef]
- Kovtunenko, V.A.; Karpenko-Jereb, L. Study of voltage cycling conditions on Pt oxidation and dissolution in polymer elec-trolyte fuel cells. J. Power Sources 2021, 493, 229693. [Google Scholar] [CrossRef]
- Okonkwo, P.; Ige, O.; Barhoumi, E.; Uzoma, P.; Abdullah, A. Platinum degradation mechanisms in proton exchange membrane fuel cell (PEMFC) system: A review. Int. J. Hydrogen Energy 2021, 46, 15850–15865. [Google Scholar] [CrossRef]
- Takahashi, T.; Kokubo, Y.; Murata, K.; Hotaka, O.; Hasegawa, S.; Tachikawa, Y.; Nishihara, M.; Matsuda, J.; Kitahara, T.; Lyth, S.M.; et al. Cold start cycling durability of fuel cell stacks for commercial automotive applications. Int. J. Hydrogen Energy 2022, 47, 41111–41123. [Google Scholar] [CrossRef]
- Hara, M.; Lee, M.; Liu, C.; Chen, B.; Yamashita, Y.; Uchida, M.; Uchida, H.; Watanabe, M. Electrochemical and Raman spectroscopic evaluation of Pt/graphitized carbon black catalyst durability for the start/stop operating condition of polymer electrolyte fuel cells. Electrochim. Acta 2012, 70, 171–181. [Google Scholar] [CrossRef]
- Wang, G.; Huang, F.; Yu, Y.; Wen, S.; Tu, Z. Degradation behavior of a proton exchange membrane fuel cell stack under dynamic cycles between idling and rated condition. Int. J. Hydrogen Energy 2018, 43, 4471–4481. [Google Scholar] [CrossRef]
- Liu, Z.; Xu, S.; Guo, S. High-potential control for durability improvement of the vehicle fuel cell system based on oxygen partial pressure regulation under low-load conditions. Int. J. Hydrogen Energy 2022, 47, 32607–32627. [Google Scholar] [CrossRef]
- Eskin, M.G.; Yeşilyurt, S. Anode bleeding experiments to improve the performance and durability of proton exchange mem-brane fuel cells. Int. J. Hydrogen Energy 2019, 44, 11047–11056. [Google Scholar] [CrossRef]
- Li, Y.; Pei, P.; Ma, Z.; Ren, P.; Huang, H. Analysis of air compression, progress of compressor and control for optimal energy efficiency in proton exchange membrane fuel cell. Renew. Sustain. Energy Rev. 2020, 133, 110304. [Google Scholar] [CrossRef]
- Lapicque, F.; Belhadj, M.; Bonnet, C.; Pauchet, J.; Thomas, Y. A critical review on gas diffusion micro and macroporous layers degradations for improved membrane fuel cell durability. J. Power Sources 2016, 336, 40–53. [Google Scholar] [CrossRef]
- Sun, X.; Xu, H.; Zhu, Q.; Lu, L.; Zhao, H. Synthesis of Nafion®-stabilized Pt nanoparticles to improve the durability of proton exchange membrane fuel cell. J. Energy Chem. 2015, 24, 359–365. [Google Scholar] [CrossRef]
- Gómez, M.A.; Navarro, A.J.; Giner-Casares, J.J.; Cano, M.; Fernández-Romero, A.J.; López-Cascales, J.J. Electrodes based on nafion and epoxy-graphene composites for improving the performance and durability of open cathode fuel cells, prepared by electrospray deposition. Int. J. Hydrogen Energy 2022, 47, 13980–13989. [Google Scholar] [CrossRef]
- Chen, D.; Pei, P.; Meng, Y.; Ren, P.; Li, Y.; Wang, M.; Wang, X. Novel extraction method of working condition spectrum for the lifetime prediction and energy management strategy evaluation of automotive fuel cells. Energy 2022, 255, 124523. [Google Scholar] [CrossRef]
- Li, J.; Yang, L.; Yang, Q.; Wei, Z.; He, Y.; Lan, H. Degradation adaptive energy management with a recognition-prediction method and lifetime competition-cooperation control for fuel cell hybrid bus. Energy Convers. Manag. 2022, 271, 116306. [Google Scholar] [CrossRef]
- Um, S.; Wang, C.Y. Computational study of water transport in proton exchange membrane fuel cells. J. Power Sources 2005, 156, 211–223. [Google Scholar] [CrossRef]
- Darvishi, Y.; Hassan-Beygi, S.R.; Zarafshan, P.; Hooshyari, K.; Malaga-Toboła, U.; Gancarz, M. Numerical Modeling and Evaluation of PEM Used for Fuel Cell Vehicles. Materials 2021, 14, 7907. [Google Scholar] [CrossRef] [PubMed]
- Osmieri, L.; Cullen, D.A.; Chung, H.T.; Ahluwalia, R.K.; Neyerlin, K.C. Durability evaluation of a Fe–N–C catalyst in polymer elec-trolyte fuel cell environment via accelerated stress tests. Nano Energy 2020, 78, 105209. [Google Scholar] [CrossRef]
- Wan, N. Durability study of direct methanol fuel cell under accelerated stress test. J. Power Sources 2023, 556, 232470. [Google Scholar] [CrossRef]
- Zhao, J.; Shahgaldi, S.; Li, X.; Liu, Z.S. Experimental Observations of Microstructure Changes in the Catalyst Layers of Proton Exchange Membrane Fuel Cells under Wet-Dry Cycles. J. Electrochem. Soc. 2018, 165, F3337. [Google Scholar] [CrossRef]
- Ishikawa, H.; Teramoto, T.; Ueyama, Y.; Sugawara, Y.; Sakiyama, Y.; Kusakabe, M.; Miyatake, K.; Uchida, M. Use of a sub-gasket and soft gas diffusion layer to mitigate mechanical degradation of a hydrocarbon membrane for polymer electrolyte fuel cells in wet-dry cycling. J. Power Sources 2016, 325, 35–41. [Google Scholar] [CrossRef]
- Vichard, L.; Petrone, R.; Harel, F.; Ravey, A.; Venet, P.; Hissel, D. Long term durability test of open-cathode fuel cell system under actual operating conditions. Energy Convers. Manag. 2020, 212, 112813. [Google Scholar] [CrossRef]
- Sabharwal, M.; Büchi, F.N.; Nagashima, S.; Marone, F.; Eller, J. Investigation of the transient freeze start behavior of polymer electrolyte fuel cells. J. Power Sources 2020, 489, 229447. [Google Scholar] [CrossRef]


| (a) MEA chemical Stability and Metrics (Test Using an MEA) | ||
| Test condition | Steady-state OCV, single cell | |
| Sample | Catalyst coated membrane from Gore with 12 μm thickness, and 50 mm × 50 mm area. Carbon paper from SGL. | |
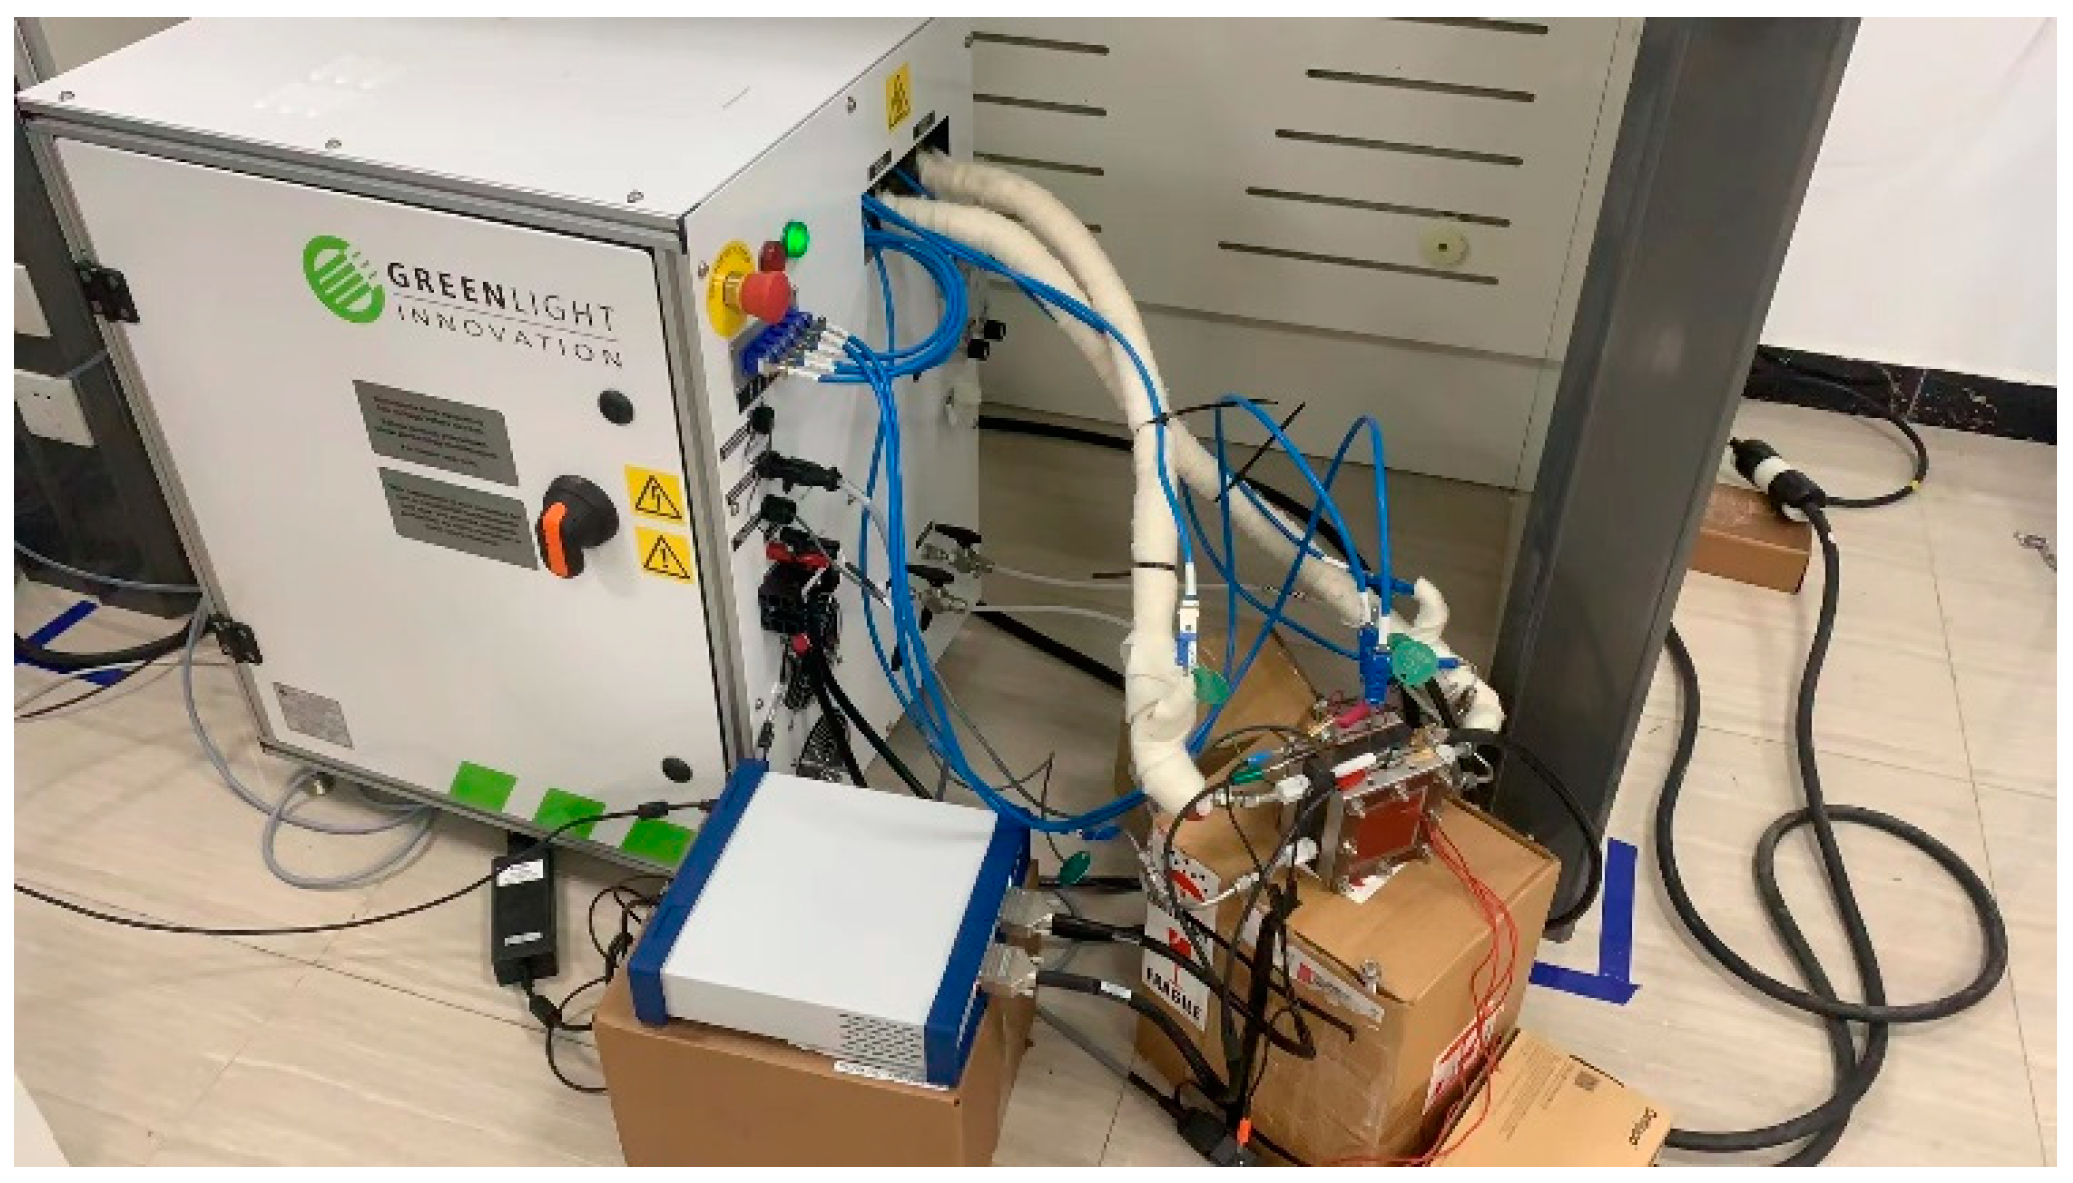
| Test bench | Test system from Green Light, Canada. Electrochemical workstation from Gamy. | |
| Total time | 500 h | |
| Fuel cell operating temperature | 80 °C | |
| Anodic/cathodic flow rate: | 1.5/4.0 SLPM | |
| Relative humidity | Anode/cathode 30/30% | |
| Fuel/oxidant | H2/air at stoics of 10/10 at 0.2 A/cm2 equivalent flow; 99.999% H2 | |
| Pressure, outlet kPa abs | Anode/cathode 150/150 kPa | |
| Metric | Frequency | Target |
| F-release or equivalent for nonfluorinated membranes | At least every 24 h | No target-for monitoring |
| Hydrogen crossover (mA/cm2) | Every 24 h | ≤15 mA/cm2 |
| OCV | Continuous | Initial OCV ≥ 0.95V, <20% OCV decrease during test |
| High-frequency resistance | Every 24 h at 0.2 A/cm2 | No target-for monitoring |
| Shorting resistance | Every 24 h | >1000 ohm cm2 |
| (b) Membrane chemical/Mechanical Cycle and Metrics (Test Using an MEA) | ||
| Sample | Catalyst coated membrane from Gore with 12 μm thickness, and 50 mm × 50 mm area. Carbon paper from SGL. | |
| Cycle | Cycle 0% RH (30 s) to 90 °C dew point (45 s), single cell | |
| Total time | Until crossover > 15 mA/cm2 or 20,000 cycles | |
| Fuel cell operating temperature | 80 °C | |
| Relative humidity | Cycle from 0% RH (30 s) to 90 °C dew point (45 s) | |
| Fuel/oxidant | H2/air at 40 sccm/cm2 on both sides; 99.999% H2 | |
| Pressure | Ambient or no back pressure | |
| Metric | Frequency | Target |
| F-release or equivalent for nonfluorine membranes | At least every 24 h | No target-for monitoring |
| Hydrogen crossover (mA/cm2) | Every 24 h | ≤15 mA/cm2 |
| OCV | Continuous | Initial wet OCV ≥ 0.95V, <20% OCV decrease during test |
| High-frequency resistance | Every 24 h at 0.2 A/cm2 | No target-for monitoring |
| Shorting resistance | Every 24 h | >1000 ohm cm2 |
Disclaimer/Publisher’s Note: The statements, opinions and data contained in all publications are solely those of the individual author(s) and contributor(s) and not of MDPI and/or the editor(s). MDPI and/or the editor(s) disclaim responsibility for any injury to people or property resulting from any ideas, methods, instructions or products referred to in the content. |
© 2023 by the authors. Licensee MDPI, Basel, Switzerland. This article is an open access article distributed under the terms and conditions of the Creative Commons Attribution (CC BY) license (https://creativecommons.org/licenses/by/4.0/).
Share and Cite
Wang, D.; Min, H.; Sun, W.; Zeng, B.; Wu, H. Durability Study of Frequent Dry–Wet Cycle on Proton Exchange Membrane Fuel Cell. Energies 2023, 16, 4284. https://doi.org/10.3390/en16114284
Wang D, Min H, Sun W, Zeng B, Wu H. Durability Study of Frequent Dry–Wet Cycle on Proton Exchange Membrane Fuel Cell. Energies. 2023; 16(11):4284. https://doi.org/10.3390/en16114284
Chicago/Turabian StyleWang, Dan, Haitao Min, Weiyi Sun, Bin Zeng, and Haiwen Wu. 2023. "Durability Study of Frequent Dry–Wet Cycle on Proton Exchange Membrane Fuel Cell" Energies 16, no. 11: 4284. https://doi.org/10.3390/en16114284