Article

Conversion of a Small-Size Passenger Car to Hydrogen Fueling: Evaluating the Risk of Backfire and the Correlation to Fuel System Requirements through 0D/1D Simulation

by
Adrian Irimescu
1,*,
Bianca Maria Vaglieco
1,
Simona Silvia Merola
1,
Vasco Zollo
2 and
Raffaele De Marinis
2
1
Science and Technology Institute for Sustainable Energy and Mobility STEMS—CNR, Via G. Marconi 4, 80125 Napoli, Italy
2
Demax SRL, Strada Statale 7 Appia km 251, 82014 Ceppaloni, Italy
*
Author to whom correspondence should be addressed.
Energies 2023, 16(10), 4201; https://doi.org/10.3390/en16104201
Submission received: 1 April 2023 / Revised: 1 May 2023 / Accepted: 17 May 2023 / Published: 19 May 2023
(This article belongs to the Special Issue Internal Combustion Engine: Research and Application)

Abstract

:
Hydrogen is an effective route for achieving zero carbon dioxide emissions, with a contained cost compared to electric powertrains. When considering the conversion of spark ignition (SI) engines to H2 fueling, relatively minor changes are required in terms of added components. This study looks at the possibility of converting a small-size passenger car powered by a turbocharged SI unit. The initial evaluation of range and peak power showed that overall, the concept is feasible and directly comparable to the electric version of the vehicle in terms of powertrain performance. Injection phasing effects and cylinder imbalance were found to be potential issues. Therefore, the present work applied an 0D/1D simulation for investigating the effects of hydrogen fueling with respect to the likelihood of backfire. A range of engine speeds and load settings were scrutinized for evaluating the possibility of achieving the minimal risk of abnormal combustion due to pre-ignition. Ensuring the correct flow was predicted to be essential, especially at high loads and engine speeds. Fuel delivery phasing with respect to valve intake and closing events was also found to be a major factor that influenced not only backfire occurrence but conversion efficiency as well. Interactions with the electronic control unit were also evaluated, and additional requirements compared to standard conversion kits for LPG or CNG fueling were identified.

1. Introduction

Battery electric vehicles are foreseen to be the dominant choice of propulsion for the passenger car sector [1,2], while heavy-duty applications may have an important component that will feature hydrogen-fueled internal combustion engines (ICEs) [3]. Nonetheless, small-size passenger cars powered by H2 ICEs could be a valid approach for achieving zero greenhouse gas emissions (given the use of a carbon-free fuel) in a cost-effective manner and with reduced environmental impact [4].
There are several issues that need to be covered when considering the use of hydrogen in ICEs, be it spark ignition (SI) or compression ignition units [5,6]. These range from component failure-related phenomena [7] to dual-fuel-specific interactions [8] and even safety issues [9]. Combustion properties are one of the defining aspects for H2 [5]; high laminar flame speed can provide improvements in efficiency and better stability [10], but also limits the power density due to pressure rise rate constraints [11]. Reduced volumetric efficiency is another aspect that needs to be considered [12], with direct effects on ancillaries such as turbo- or super-chargers. Direct injection can partially mitigate this shortcoming [13,14] and significantly reduce the risk of backfire [15]. On the other hand, this reduces the possibility of maximizing fuel tank emptying or requires a dedicated high-pressure pump. The placement of injectors also exerts an important influence on mixture formation in port fuel injection (PFI) mode [16], and extensive efforts may be required for optimizing the energy balance [17], especially for avoiding abnormal combustion phenomena [18]. All these aspects highlight several difficulties of applying hydrogen fueling in ICEs. There are even aspects related to flame-oil film interactions that can result in a negative influence on emissions [19,20]. Nonetheless, SI units are relatively easy to convert to hydrogen fueling (even if not as straightforward as fuels such as compressed natural gas [21]), and a demonstration of close-to-commercial H2 vehicles [22] has shown that achieving practically zero emissions is possible.
Within this context, the present study looks at the conversion of a small-size passenger car to H2 operation. Specifically, the risk of backfire and how it correlates with fuel system requirements were investigated. The main goal was to identify the injection flow characteristics required for operating the SI power unit converted to hydrogen as safely as possible. Several operating conditions were examined from this point of view by applying a 0D/1D simulation. Compared to the previous versions of the model [23,24], the injection rate was taken as a variable for gaseous fuels, and the combustion characteristics of methane and propane were also implemented. A control-oriented approach ensured the modeling requirements for defining the boundary conditions for calculating the H2 concentrations in the intake port at the intake valve opening (IVO). This parameter was deemed as the defining condition for evaluating the risk of backfire. Fuel delivery rate was found to be the main factor that needs to be considered when developing the H2 injection system. Furthermore, the study looked at cylinder-to-cylinder variations in the air–fuel ratio so as to cover this possible issue as well. The correct choice of the start of injection can bring significant advantages throughout the range of conditions encountered during urban and highway driving of a small-size passenger car.

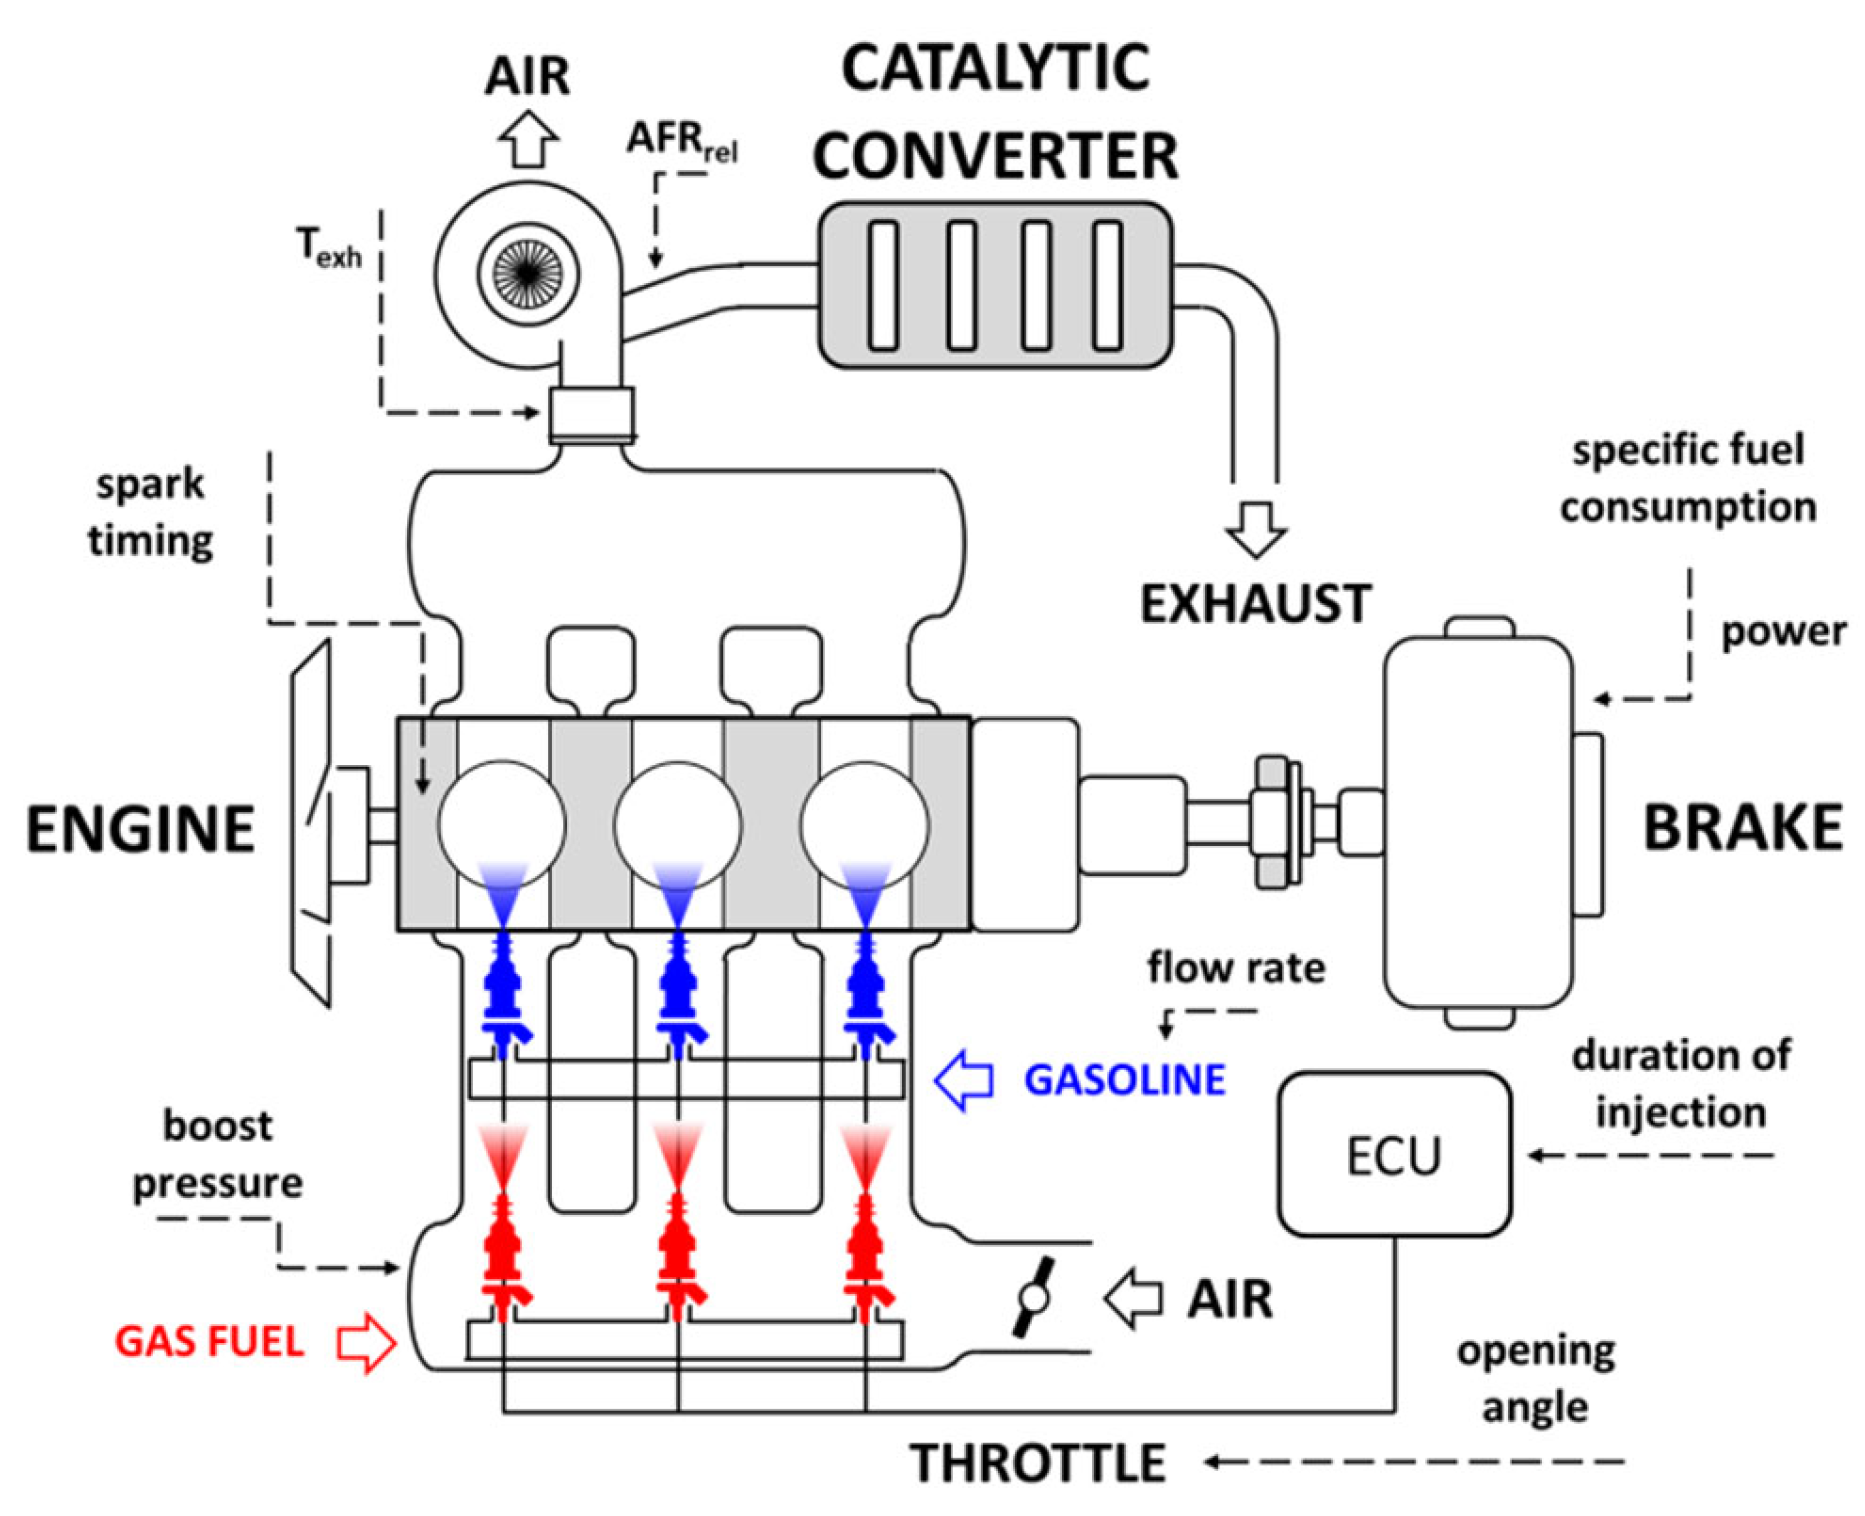
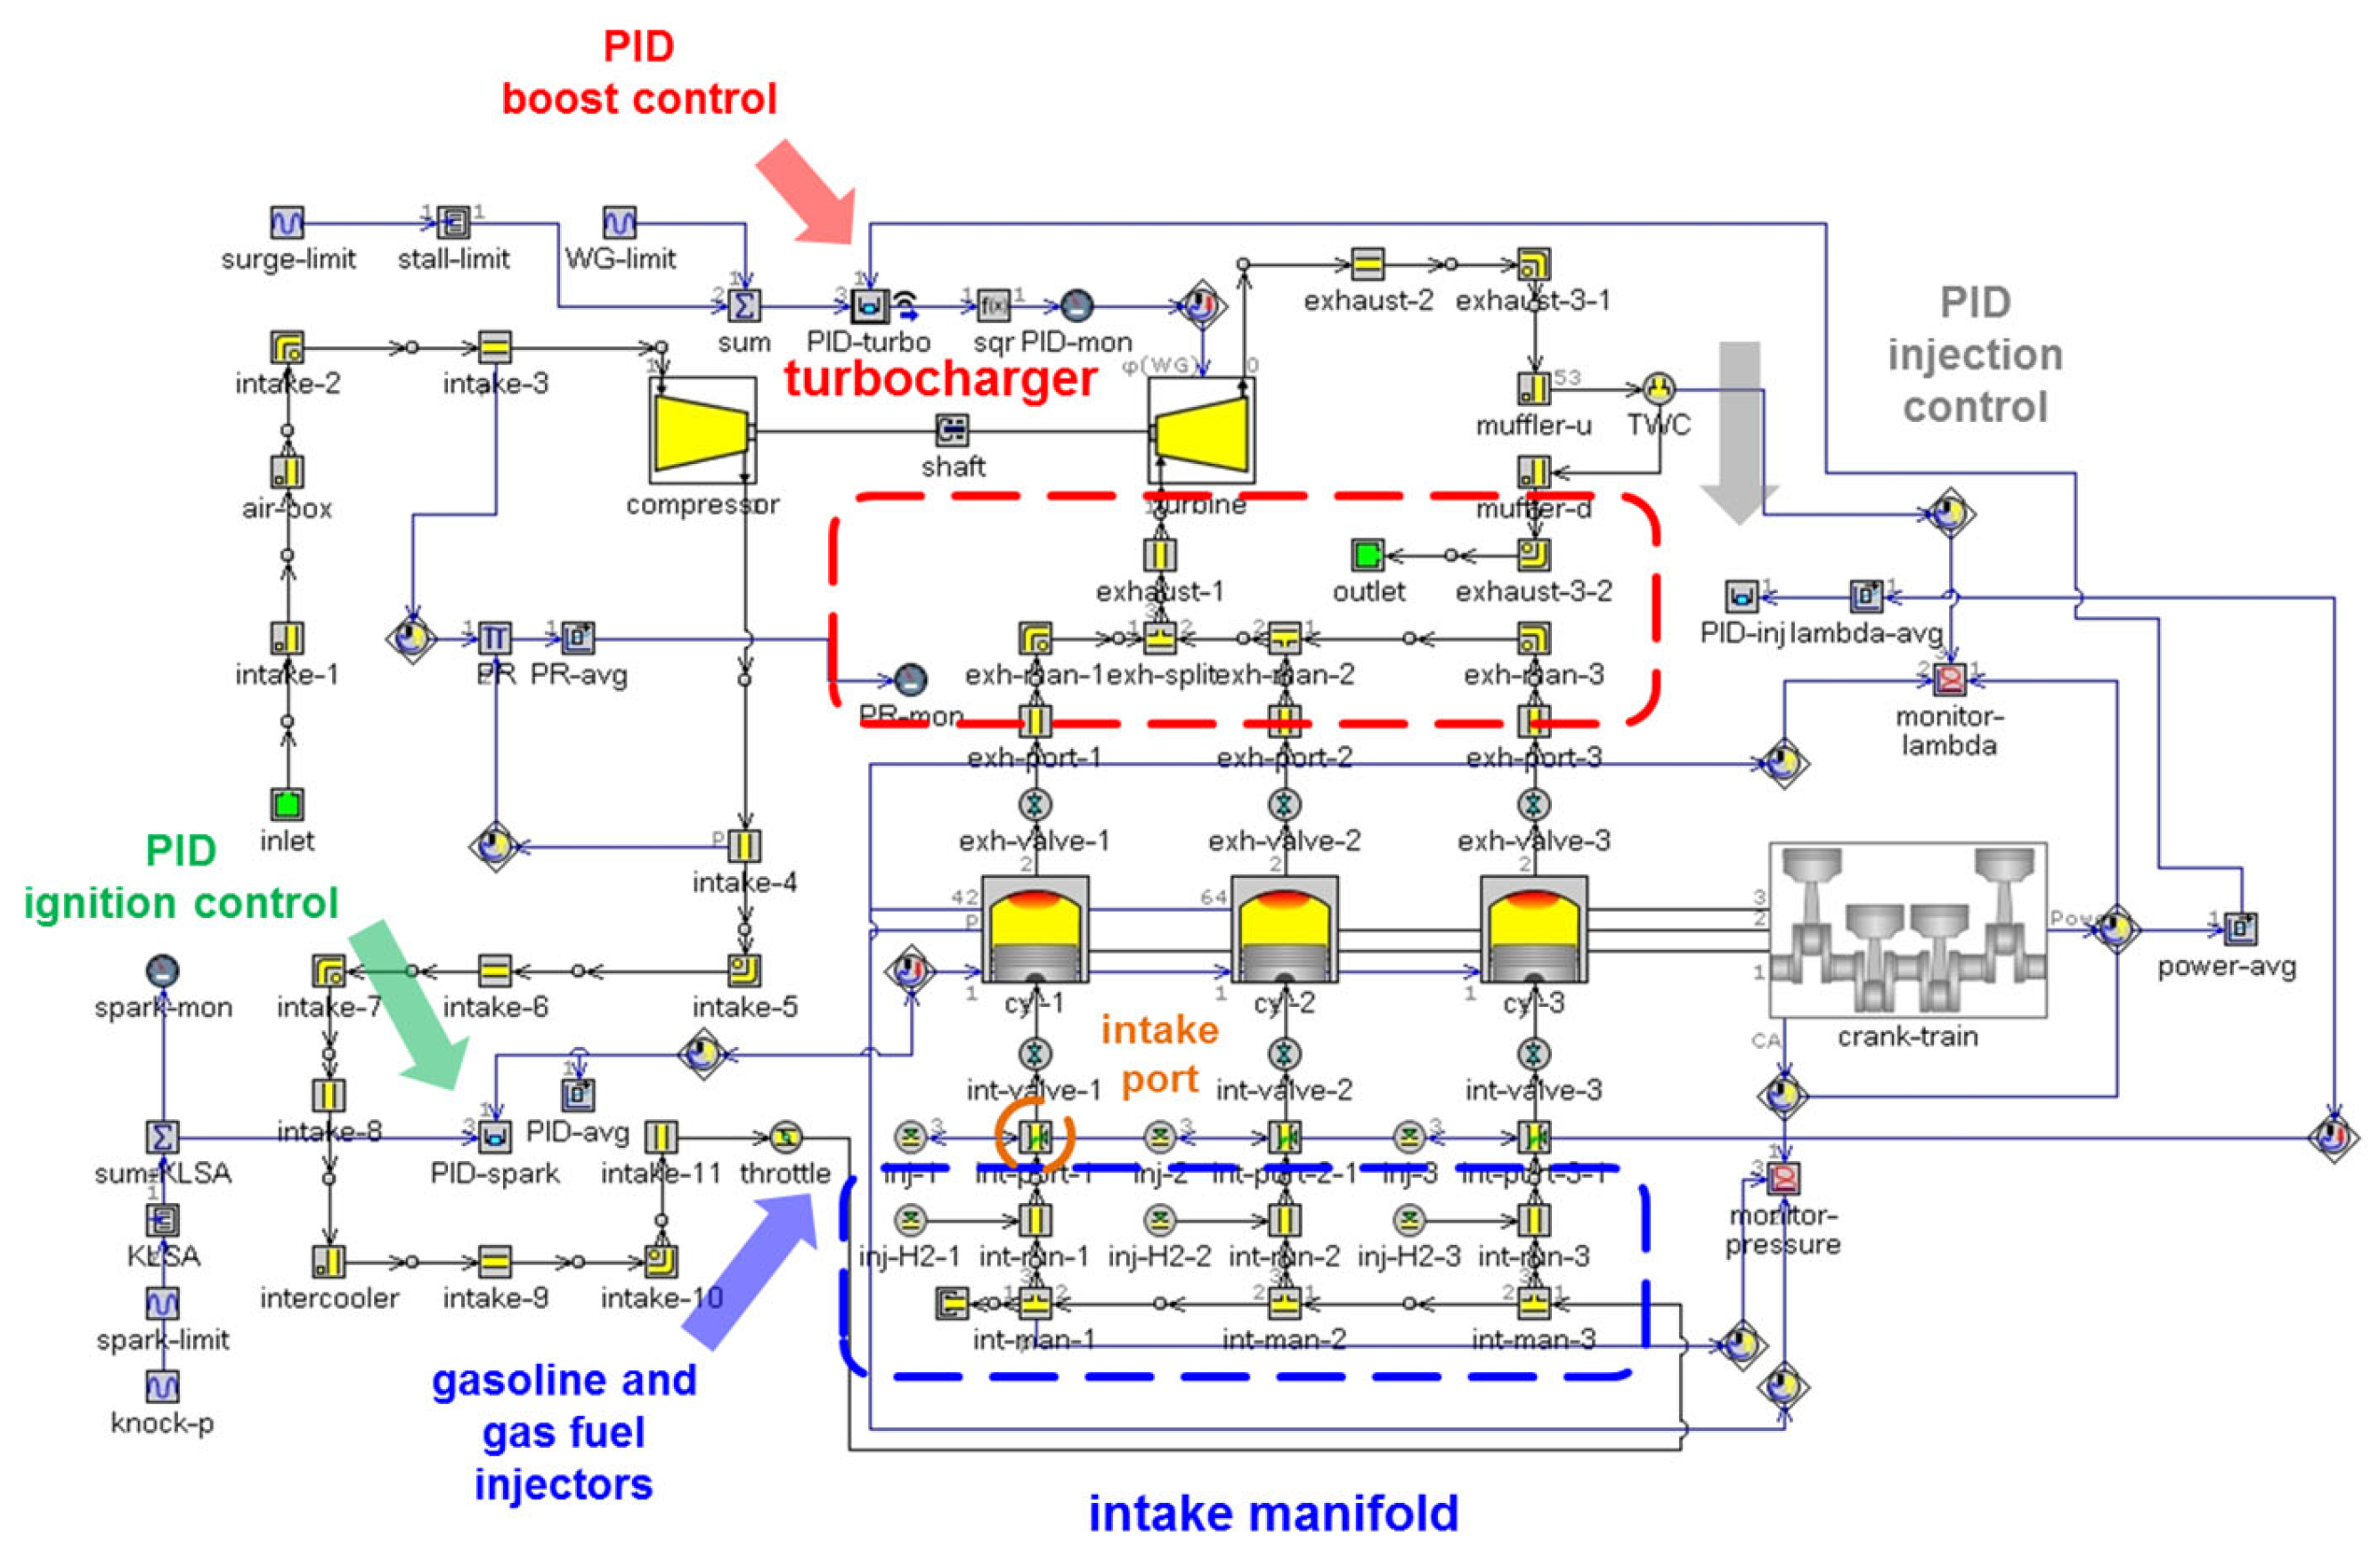
2. Materials and Methods

A two-seater vehicle weighing 720 kg was considered for the study; in the entry segment its power unit featured a peak power of 40 kW with gasoline fueling and ensured a top speed of 135 km/h. It can be taken as representative of small-size passenger car segments. Overall, the concept feasibility in terms of conversion to H2 was previously validated with respect to driving range and peak power operation [23]. The main conclusion was that adding a 30 L H2 container at 700 bar (alongside a 22 L gasoline tank) would ensure around a 100 km range of the gaseous fuel. Complete substitution of the liquid fuel tank would increase the H2 range to around 170 km, which is completely comparable with the 130 km range figure of the electric version of the vehicle [25].
One of the first steps in propulsion design is to size the unit for peak requirements. As previously mentioned, H2 fueling was found to be compatible with the rated power figure recorded with gasoline [23]. In the current study, liquefied petroleum gas (LPG) and compressed natural gas (CNG) operation was also considered (by simulating propane and methane combustion) so as to give an idea of gaseous fuel requirements in terms of rated flow. It should be noted that the engine load (i.e., in terms of overall indicated/brake mean effective pressure, or IMEP/BMEP) was the same for all fuel types. Apart from the peak power condition, urban and highway use were also considered, by calculating equivalent engine output at vehicle speeds of 30, 50, 90 and 130 km/h. A gear-shift strategy around 3000 rpm was taken as representative for the automated manual gearbox fitted to the vehicle. With the combination of possible transmission ratios, engine speed was calculated for each of the four points, and the load was modeled so as to ensure constant vehicle speed; more details are available in [24].
Figure 1 shows an overall layout of the engine (only for illustration purposes, even if efforts were taken to reflect the real setup with respect to air and exhaust gas paths) that was considered for the analysis, while Table 1 shows its main specifications (TDC stands for top dead center and a/b prefixes stand for after/before; reference is made to the firing TDC). The gas injectors are shown as located upstream in the intake runners (only for illustration purposes), but the actual location in the simulations was considered close to the intake port (i.e., at the end of the intake runner). Several parameters that are usually employed as the basis for developing control strategies are also indicated close to the component in which they are monitored.
The simulation framework included the development a 0D/1D model [26] in which components were designated as combinations of simple volumes (e.g., the ports were taken as round pipes, while the intake manifold was considered as equivalent to a series of T-elements; pressure drop across the air filter, which was of the order of mbar [27,28,29] was included as a restriction; etc.). Figure 2 illustrates this concept, as well as the control-oriented approach, for which injection, ignition and wastegate actuation were performed by proportional-integral-derivative (PID) controllers. Most model specifics are available in [23]. In addition to the previous version of the model, a compressor surge limit was implemented in the PID-turbo component that actuates the wastegate opening, as well as adding a PID-spark element that featured a target of 9 deg aTDC for the 50% mass fraction burned (MFB) combustion phasing parameter. A reduction in the spark advance was implemented as a limit in the PID controller when knocking was predicted.
The specifications listed in Table 1 were used as direct input values for the model. Several were identified in a workshop repair manual (e.g., full-load torque curve, connecting rod length, etc.), while others were measured directly on a disassembled unit (e.g., the valve lift profiles). Unfortunately, there were no in-cylinder pressure measurements available for model validation. Nonetheless, the fact that the compressor pressure ratio was modeled very close to the 1.5 turbocharger original equipment manufacturer (OEM) value specified for gasoline operation at peak power can be seen as partial validation. Furthermore, simulations of MFB10-90 and pressure rise rate at full load, 2000 rpm, resulted in relative H2-gasoline differences completely in line with the findings reported in [14] at a similar engine load; this can also be seen as (at least) partial validation of the relative differences when considering different fuels.
Other settings were kept within the same concept of stoichiometric operation with gaseous fuels (as compared to lambda 0.9 for gasoline at high load), while the combustion sub-model was implemented by choosing the default laminar flame speed correlations for methane (taken as representative for CNG) and propane (that can be considered as representative for LPG). More to the point, for gasoline, methane and propane, the choice was straightforward by simply using the data built into the software, while for hydrogen, the correlation found in [30] was implemented as a combination of look-up tables. This choice was based on the fact that the measurements in [30] are close to conditions usually found during combustion in SI engines (i.e., a rapid compression machine was employed); the fact that the resulting correlation was successfully used in computational fluid dynamics (CFD) simulations to accurately model H2 combustion in stoichiometric and lean conditions [31] is another reason for the aforementioned choice.

3. Results and Discussion

A basic approach when considering the conversion of a power unit to hydrogen must include an evaluation of the fluid flow through the engine. As initial constraints, the injectors need to provide enough fuel to ensure the intended air–fuel ratio, within the minimum dwell time given by the maximum engine rpm. Following this logic and considering the 5250 rpm as the rated engine speed, a minimum flow rate of around 62 g/min results for gasoline. Comparing this figure with the 91.5 g/min n-heptane OEM flow at 3 bar rail pressure, a dwell margin of almost 40% is ensured. Similar considerations for propane and methane (by hypothesizing the same conversion efficiency as with gasoline) result in 52 and 48 g/min minimum flow requirements with zero dwell margin. With H2 fueling, an additional constraint was set a priori so as to reduce the risk of backfire; specifically, the entire injection event would need to be completed during the intake stroke, thus resulting in a minimum flow of 96 g/min.
All these calculations are straightforward and can be taken as a first step for developing a conversion solution to H2 fueling. A more detailed analysis is, however, required for covering other specific aspects that highlight the complexity of fluid dynamics phenomena and combustion. Simulations were performed for all the intended conditions of load and fuel type. Starting with the peak power flow rate requirements, the model was applied for each fuel.

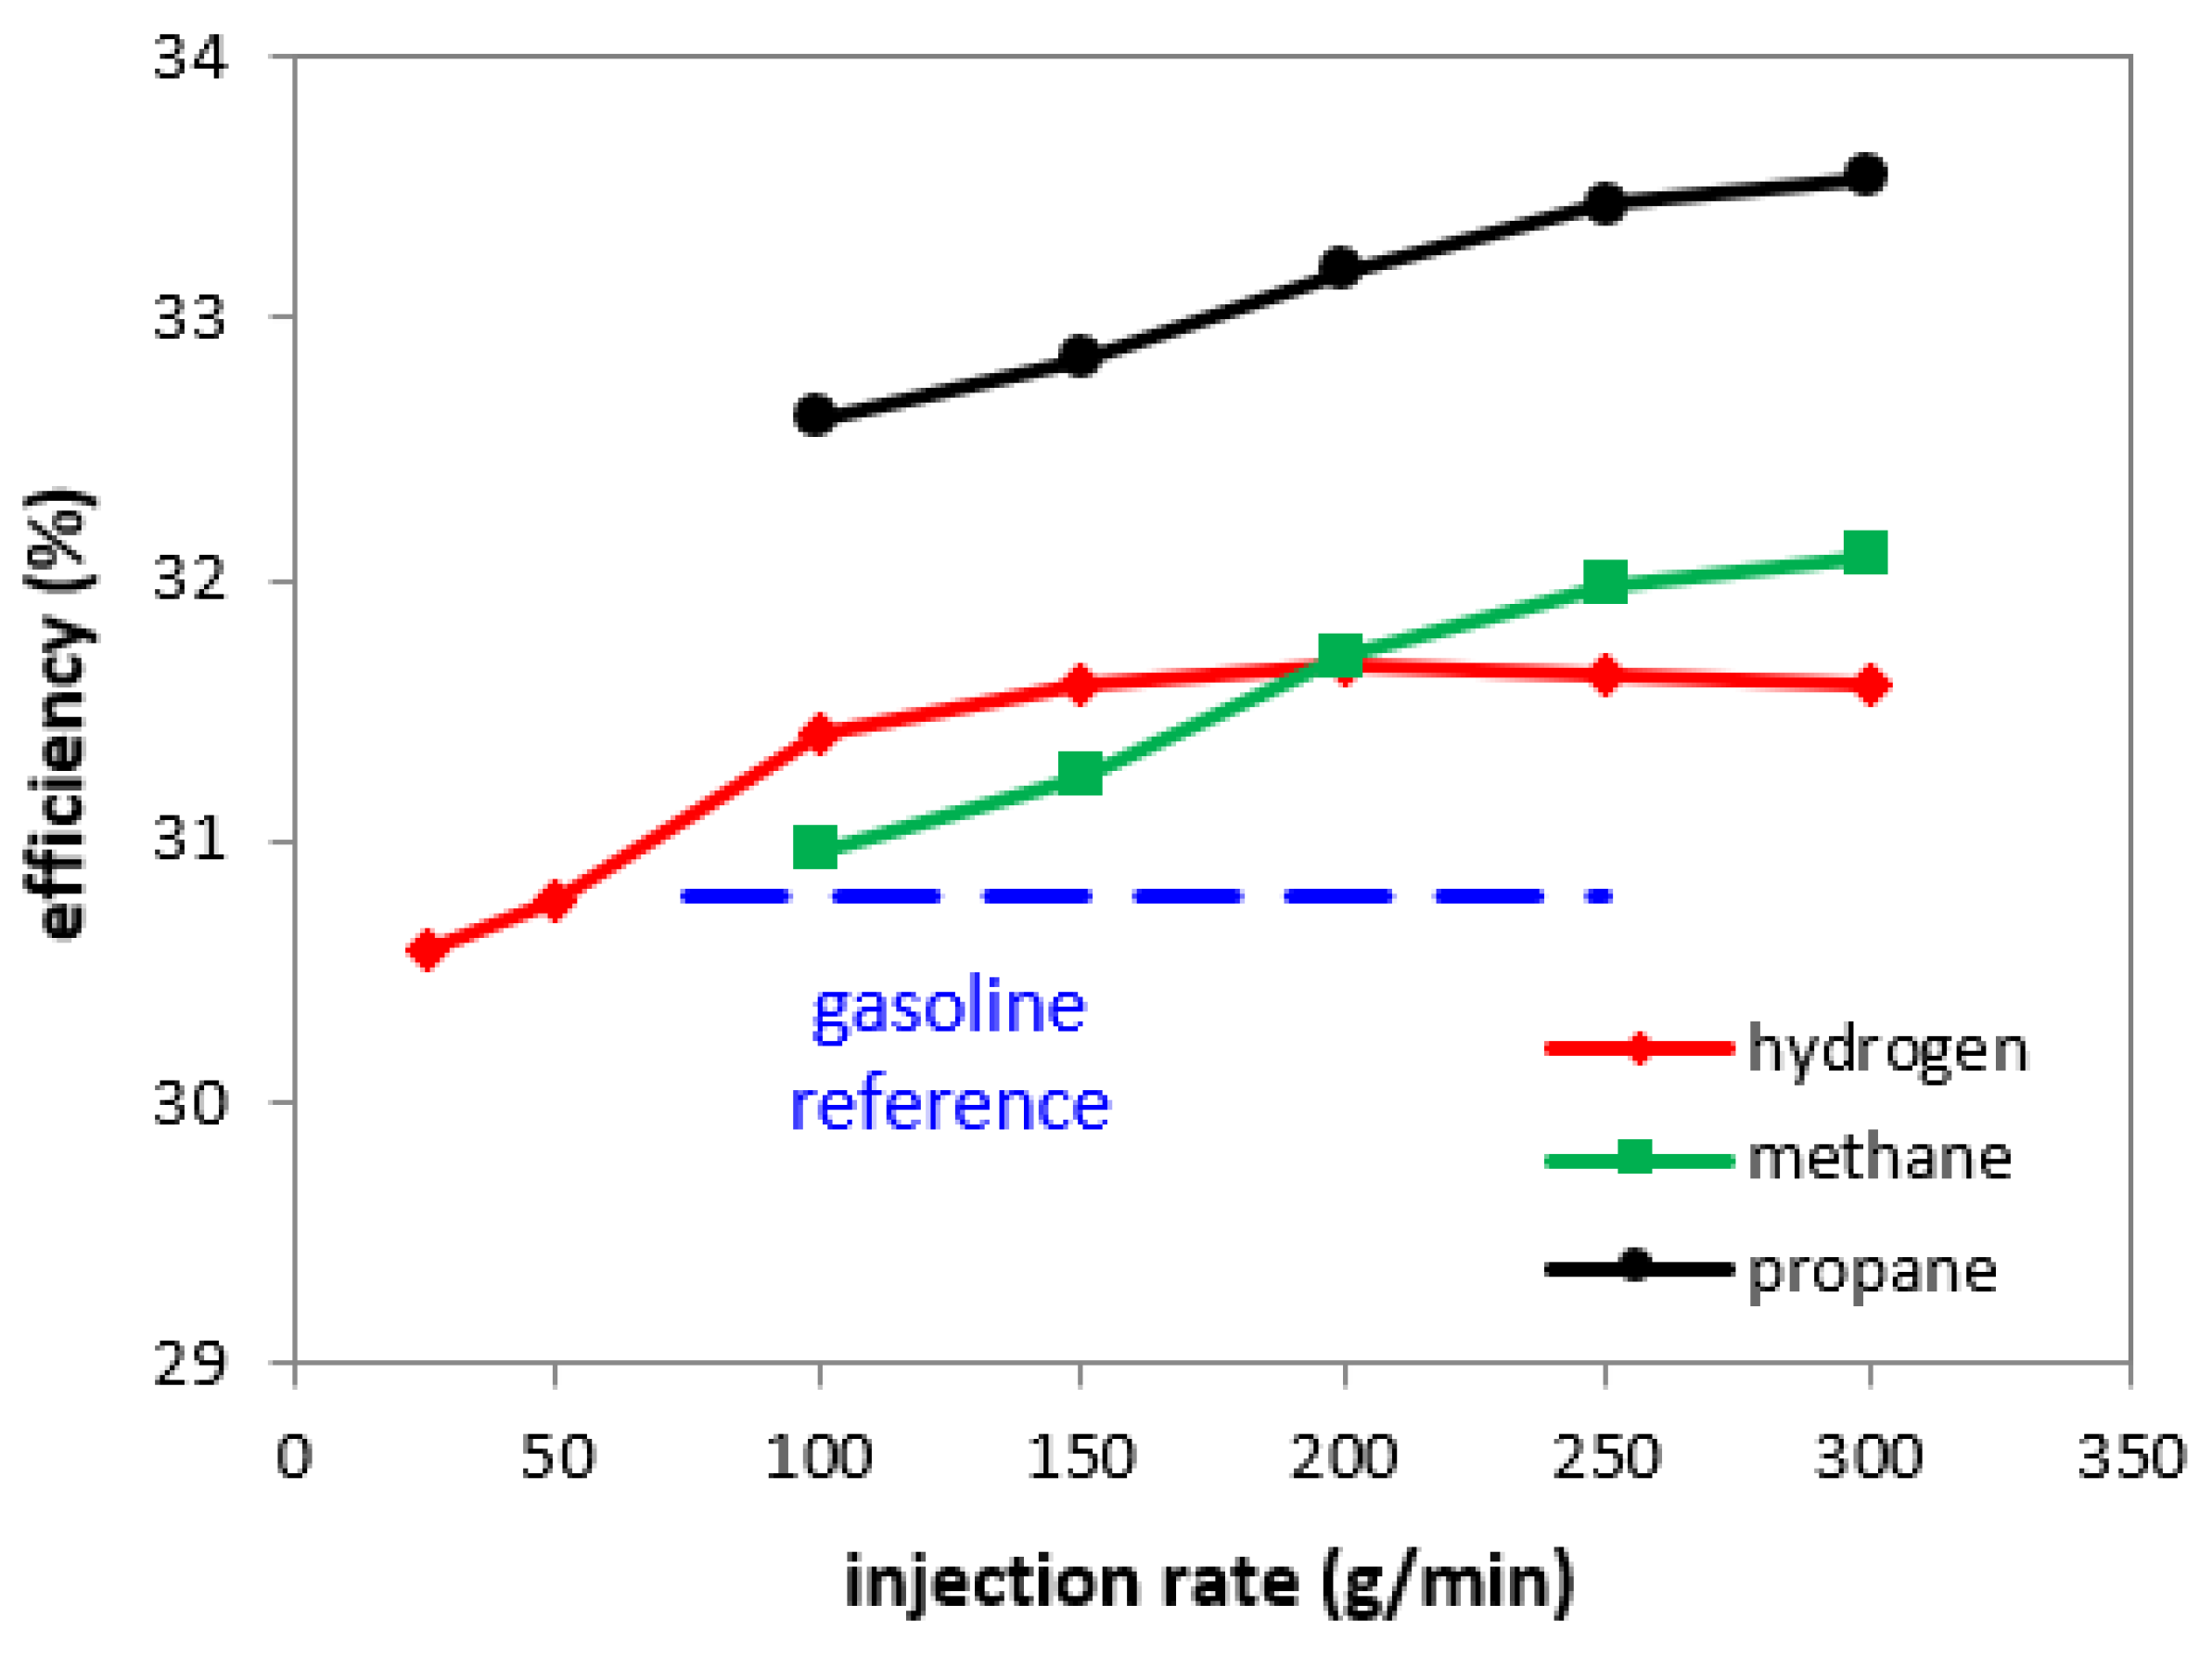
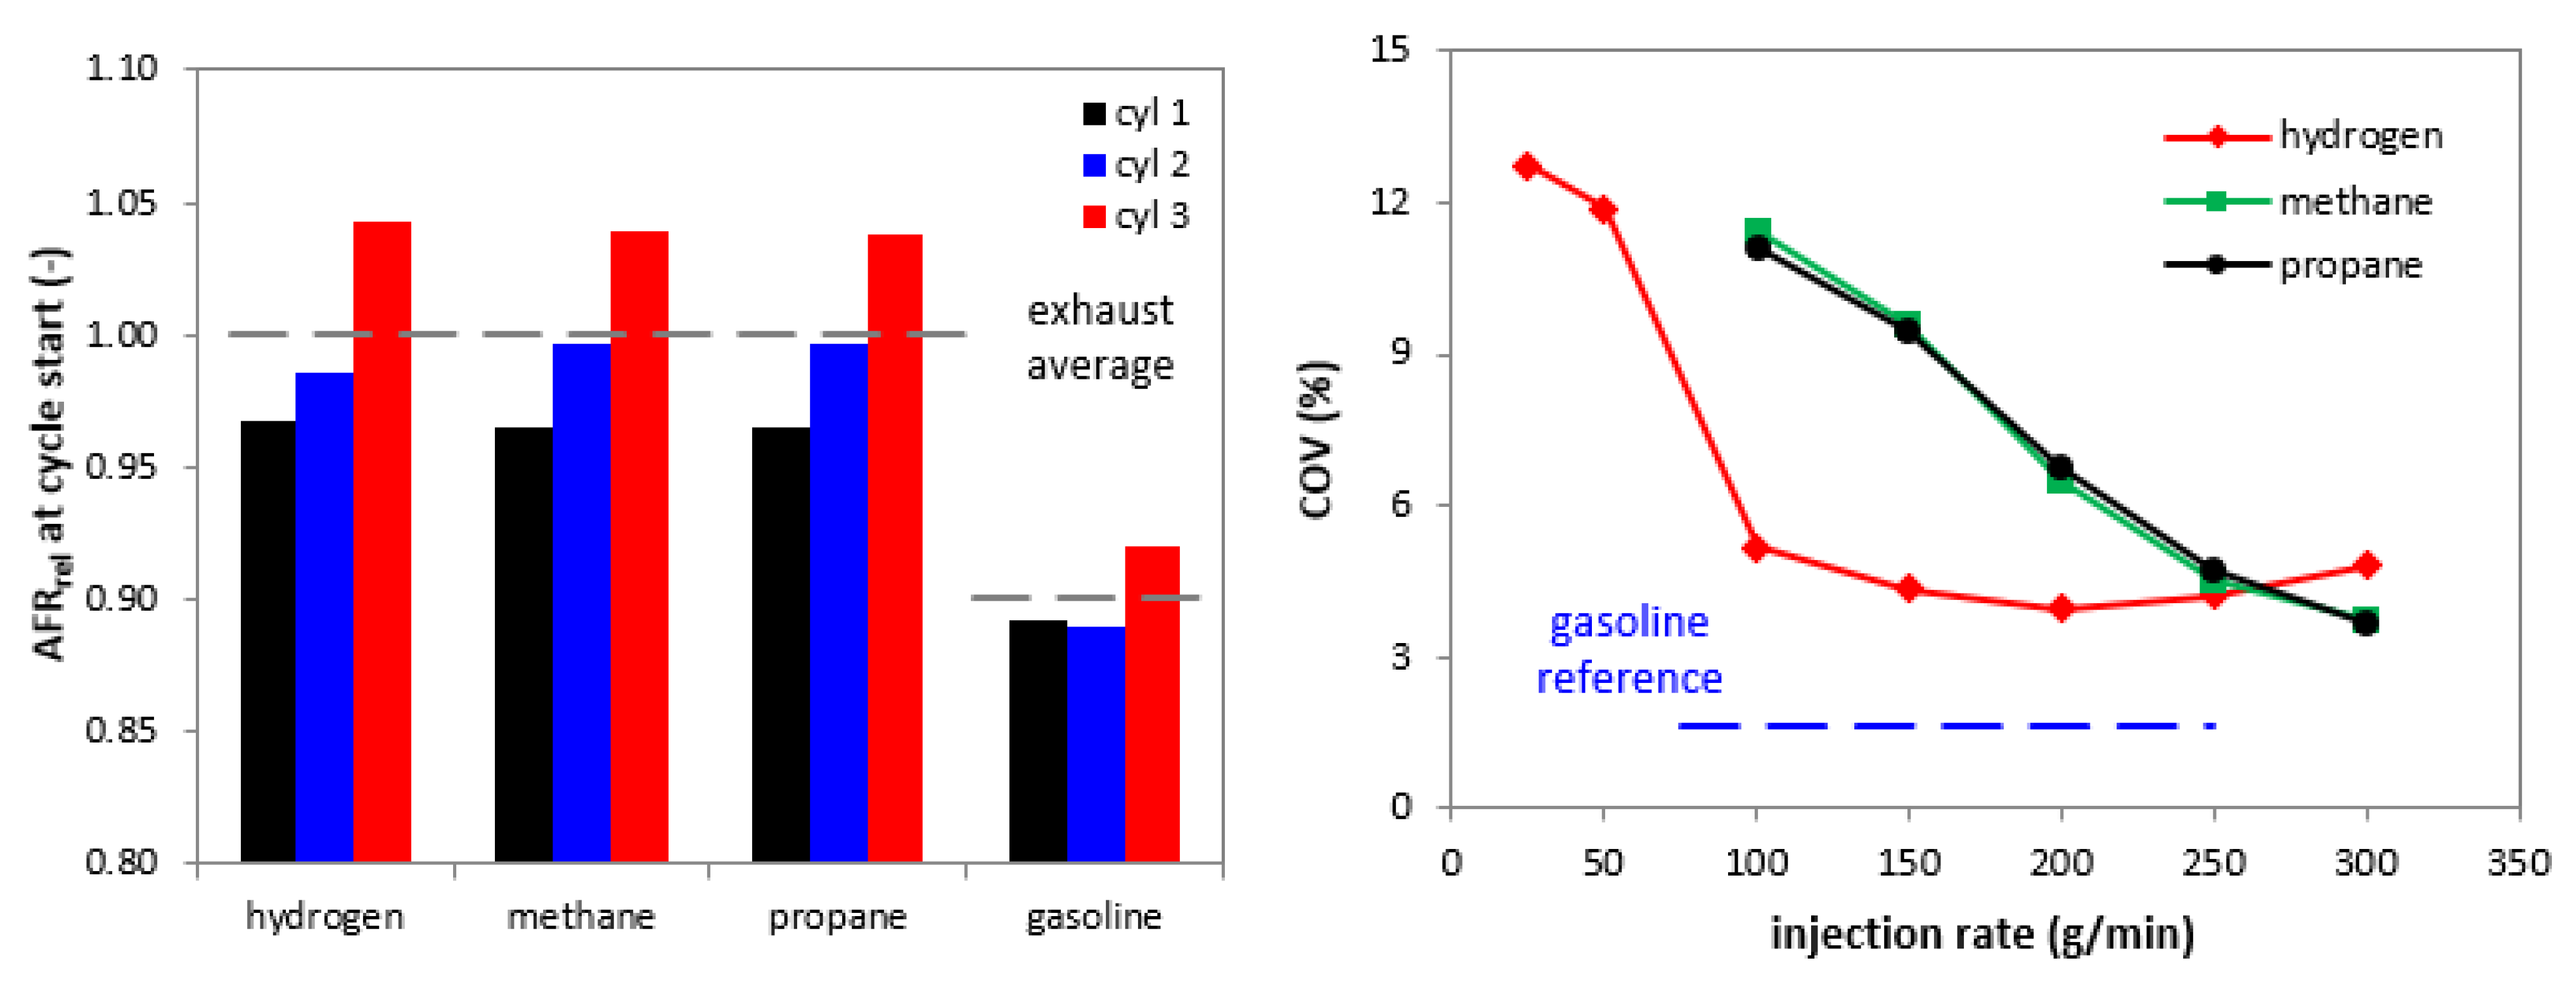
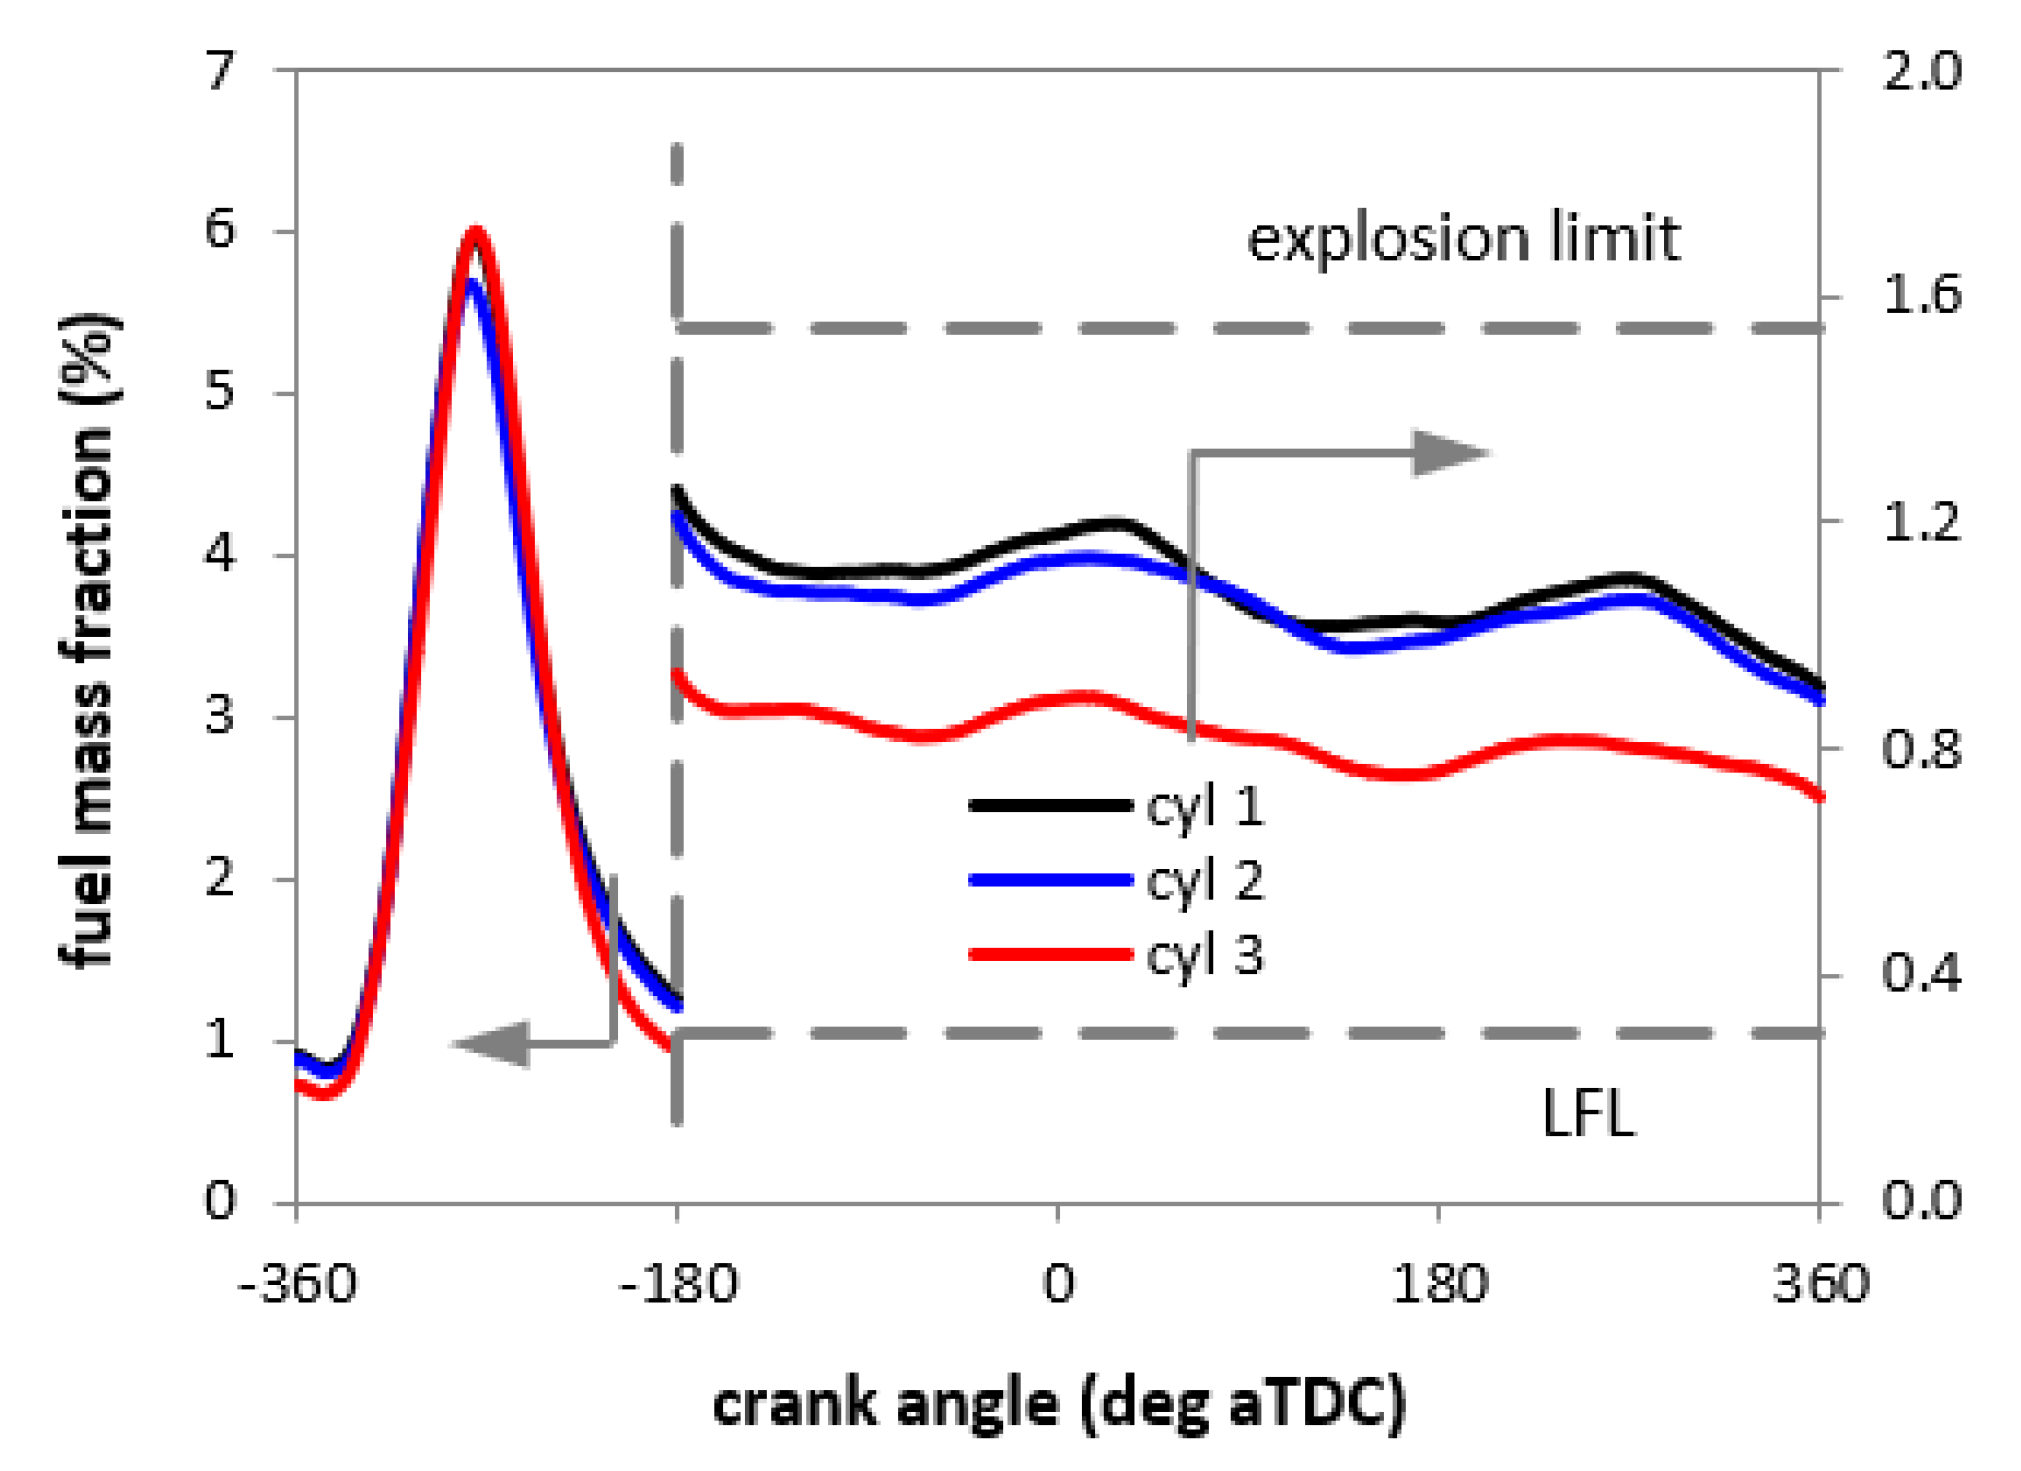
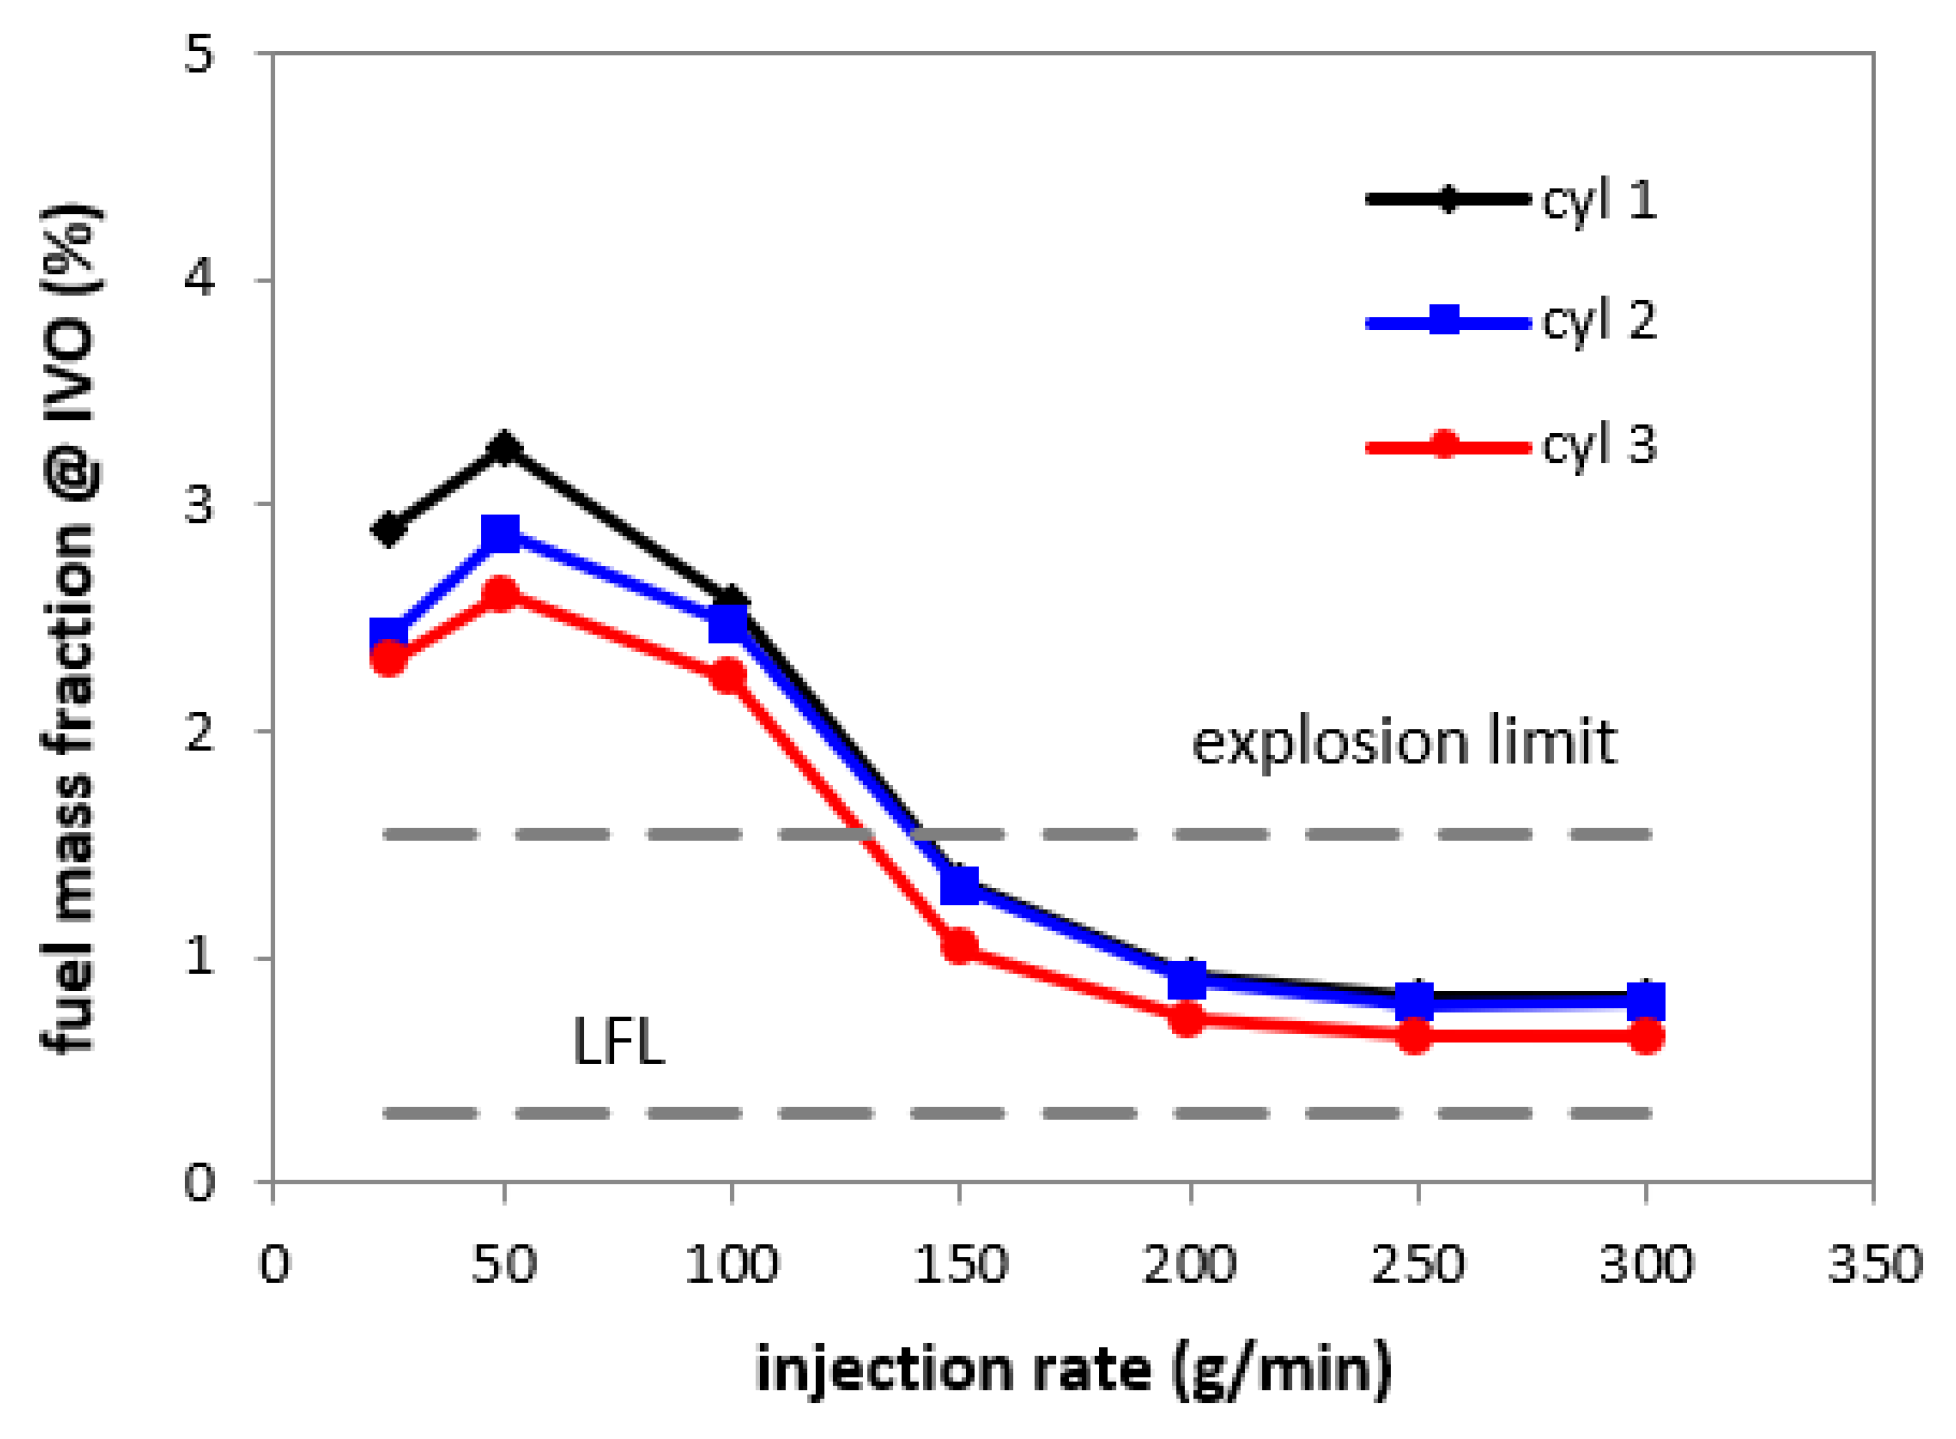
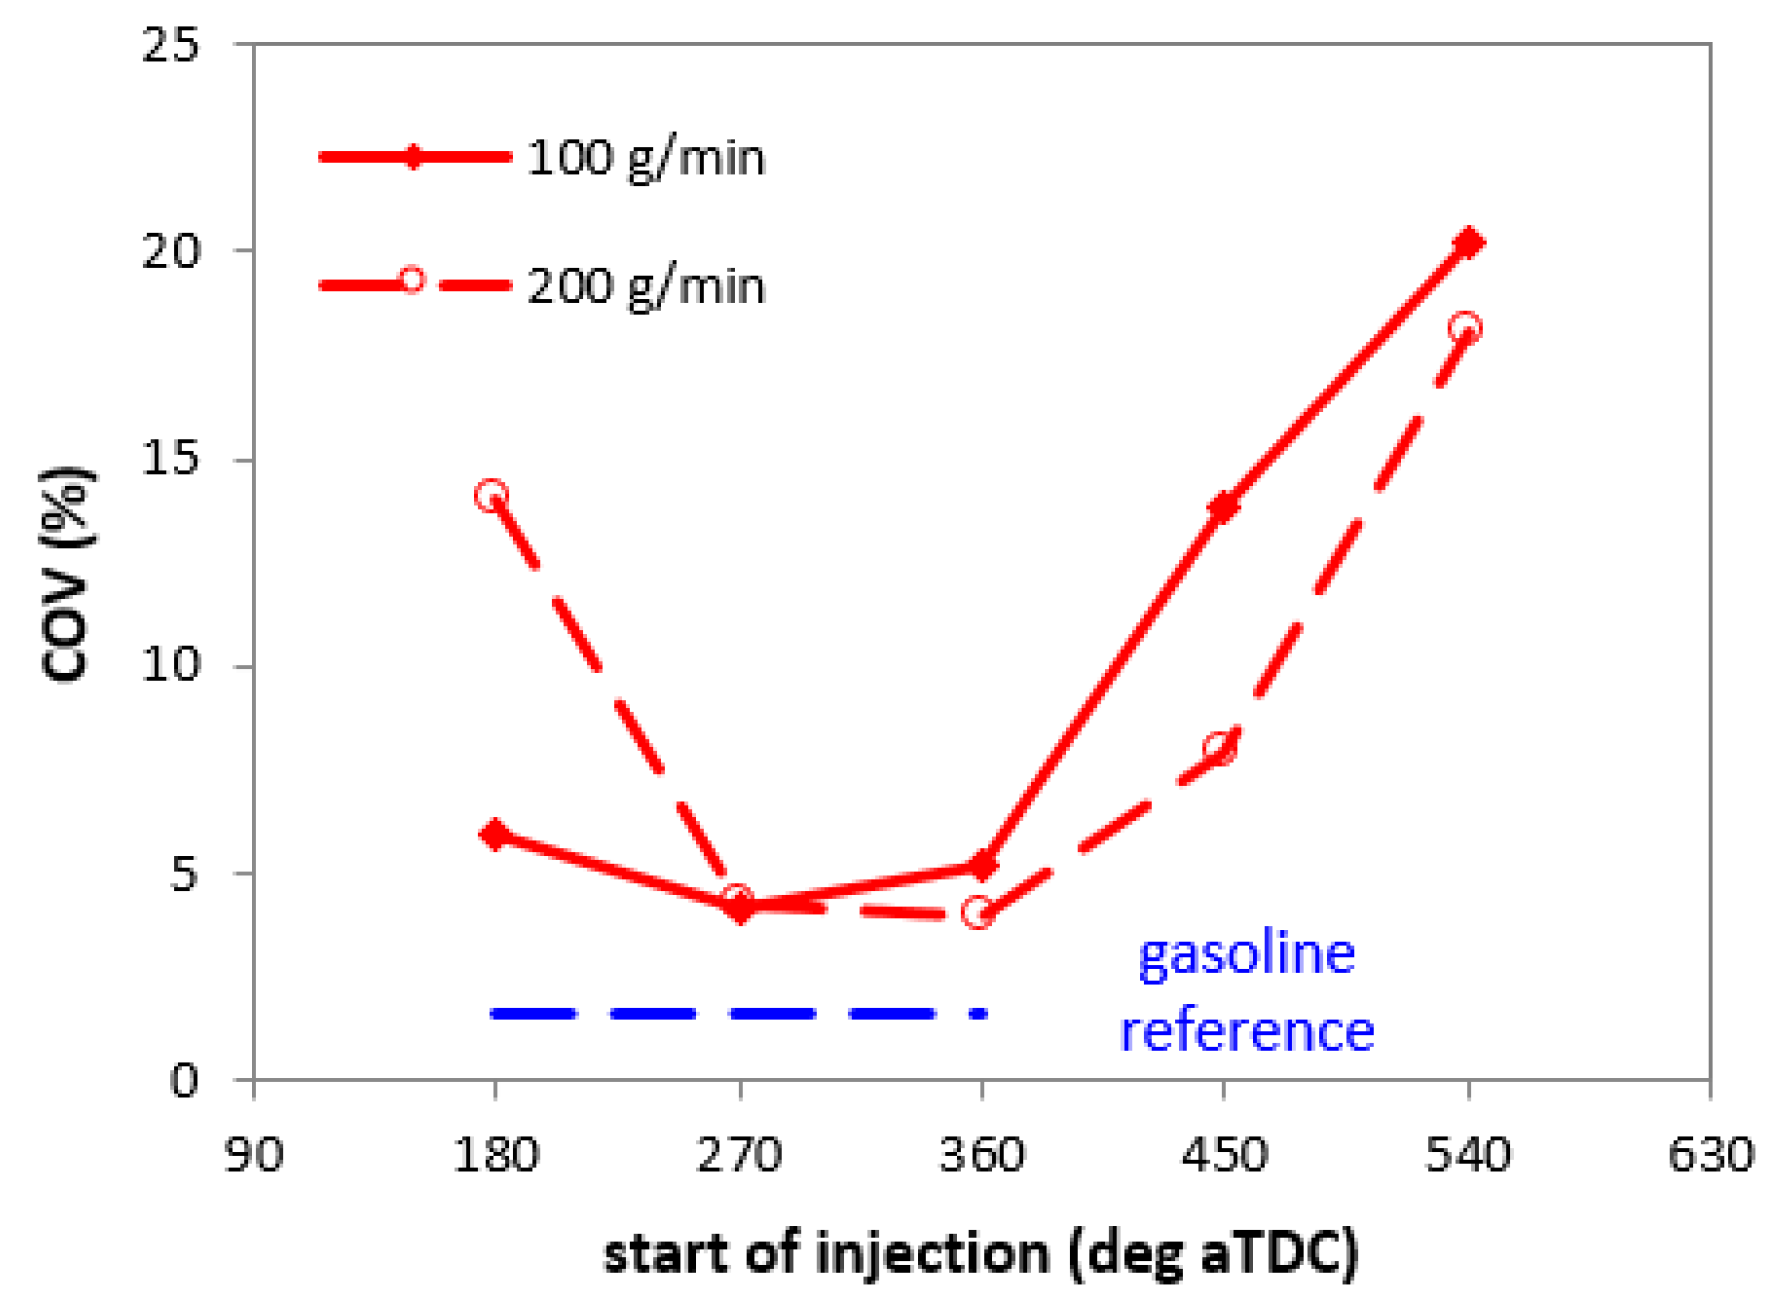
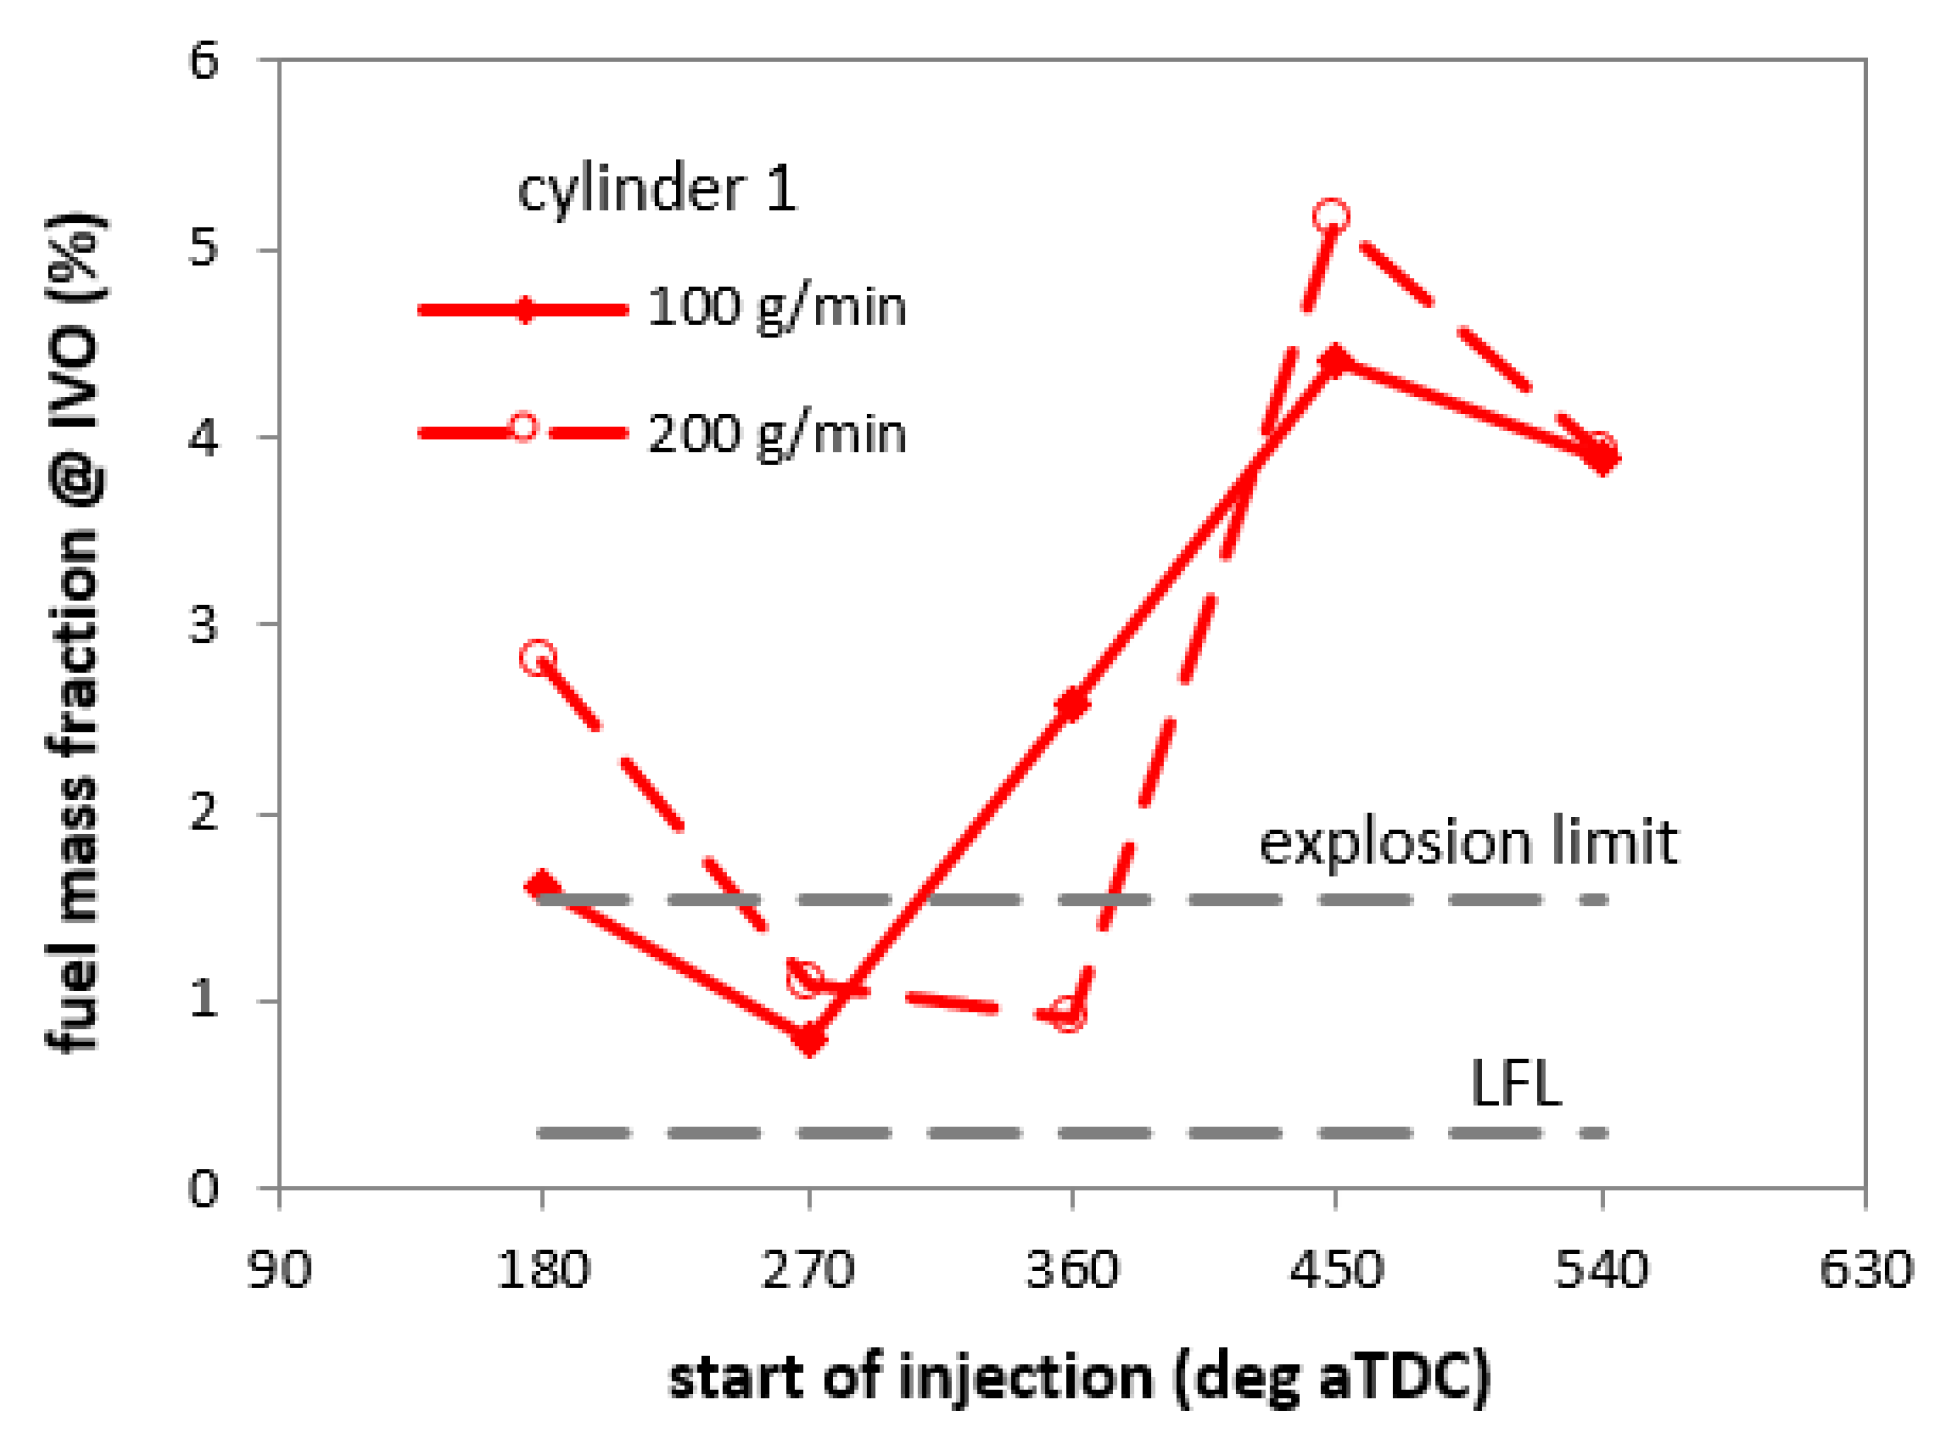
3.1. Effect of Injector Rate of Delivery

Starting with the flow figures determined with the rule-of-thumb approach, simulations were performed within a wide range of injector flows so as to scrutinize the effect of this parameter at peak engine power. In an initial hypothesis, all cases were considered to feature start-of-injection settings (SOI) of 360 deg bTDC. Figure 3 shows the predicted fuel conversion efficiency (please note that this figure is intended as brake fuel conversion efficiency [32] and will be referred to simply as efficiency throughout the text) when using the three gaseous fuels; gasoline data is also shown as a baseline figure. An important observation is that increasing the injector flow brings significant improvements in efficiency, i.e., tripling the rating can result in an improvement of over three percentage points.
One surprising outcome is the relatively low values obtained for methane and H2. Nonetheless, there is an improvement for both fuels with respect to the baseline gasoline case for flow rates over 100 g/min. At a first glance, these results may seem counterintuitive, meaning that a base improvement would be expected, given the hypothesis of stoichiometric fueling compared to gasoline. This seems to be confirmed only for propane, which, indeed, showed significant gain in efficiency. Increased heat loss was identified as a decisive factor for hydrogen [23], while for methane, this should not be an issue. Upon a closer look, this was found to be mainly due to a cylinder imbalance that practically resulted in rich fueling (and, thus, incomplete combustion) of one of the three cylinders. This result highlights one of the main issues that can arise when converting a gasoline engine to gaseous operation.
Figure 4 shows the spark timing and boost pressure ratio predicted for the four fuel types, so as to give an idea of the changes that would be expected when considering gasoline substitution. These results were obtained for the maximum efficiency case, i.e., with injector flow ratings of 200 g/min with hydrogen, and 300 g/min for propane and methane. Again, the fact that the compressor pressure ratio (PR) was predicted practically at the same level as the OEM data can be seen as partial validation of the model.
An immediate observation is that the model predicted that propane fueling would require practically the same spark timing as that for gasoline, further emphasizing the straightforward conversion to this gaseous fuel. Indeed, most LPG conversion kits feature a liquid fuel injector cut-off and no changes in the ignition control. Methane, on the other hand, would require significant modification in terms of advancing the ignition point (this is well-known due to methane’s lower laminar flame speed [33]), while on the contrary, the spark timing would have to be retarded for H2. Another aspect is that calculated boost pressure for propane is only about 9% higher compared to gasoline. Therefore, even in the hypothesis that no changes would be performed to the target boost map within the electronic control unit (ECU), the power loss would be less than 10% for propane compared to gasoline. The required boost pressure was instead predicted to be much higher for methane and hydrogen.
Taking a closer look at the cylinder imbalance previously identified as the main cause for changes in efficiency, the air–fuel ratio was evaluated for each fuel. Figure 5 shows the simulated lambda value at the intake valve closure (IVC), also defined as the start of the cycle, for the four fuel types. It is evident that cylinder 3 tended to feature an improvement in volumetric efficiency, thus resulting in higher relative air–fuel ratio (AFRrel) values. This effect was minimal for gasoline, with less than a 3% difference between cylinders, mainly due to port fuel film dynamics.
On the other hand, gaseous fuels resulted in cylinder-to-cylinder differences of over 7%; cylinder 3 was always predicted to run lean, while cylinder 1 ran rich, even if the overall exhaust AFRrel was close to stoichiometric. Hydrogen featured the largest difference, with lambda values of 0.97, 0.99 and 1.05 for cylinders 1, 2 and 3, respectively. The coefficient of variation (COV) shows that the flow rating for maximum efficiency also coincided with the minimum cylinder-to-cylinder variation. The gasoline figure is well below a general 5% threshold usually encountered in multi-cylinder engines [32].
Given the propensity of hydrogen to backfiring, a more detailed analysis was performed for this fuel in terms of the concentration in the intake port. Figure 6 shows the fuel mass fraction calculated for H2 (LFL stands for lower flammability limit) in the int-port-1, 2 and 3 components identified in Figure 2. Please note the different scales on the y axis for the intake part (left hand) and the rest of the working cycle (right hand). These results illustrate that for peak power conditions, the H2 concentration was below the explosion limit [34] throughout the closed-valve part of the cycle with the 200 g/min injector flow rating. The fact that cylinder 3 tended to feature better volumetric efficiency in these conditions confirms a slightly lower equivalence ratio compared to the other two cylinders.
Looking at a single point of the working cycle, the IVO event is crucial for H2 PFI operation, meaning that any hot residual gas that is transferred from the cylinder to the intake port may ignite the air–fuel mixture in the intake manifold if the concentration of hydrogen is high enough. Figure 7 can be seen as representative of the risk of backfire, in terms of H2 concentration in the intake port of each cylinder at the instant of the intake valves’ opening. The results clearly show a significant influence of the fuel flow up to 200 g/min; above this rating, no significant benefits were predicted. One interesting observation is that even if the flow at half of the optimized value, i.e., 100 g/min, featured only a minor penalty with respect to efficiency, it is definitely above the explosion limit; therefore, using this injector rating with an SOI setting of 360 deg bTDC will result in an increased probability of backfire. Cylinder 1 tended to feature the highest concentration of Hw2 in the intake port, in line with the AFR results shown in Figure 5. These aspects highlight the multi-objective development that needs to be implemented when approaching the design of the H2 fuel system.
As an overall conclusion, the analysis at peak engine power output revealed a significant influence of the injector flow ratings when using gaseous fuels. The values that ensured the best efficiency also resulted in the lowest cylinder imbalance. For hydrogen in particular, a value of 200 g/min was identified as the rating that ensures maximum efficiency and complies with the requirement of a H2 concentration below the explosion limit in the intake port at the IVO (with an SOI setting of 360 deg bTDC).

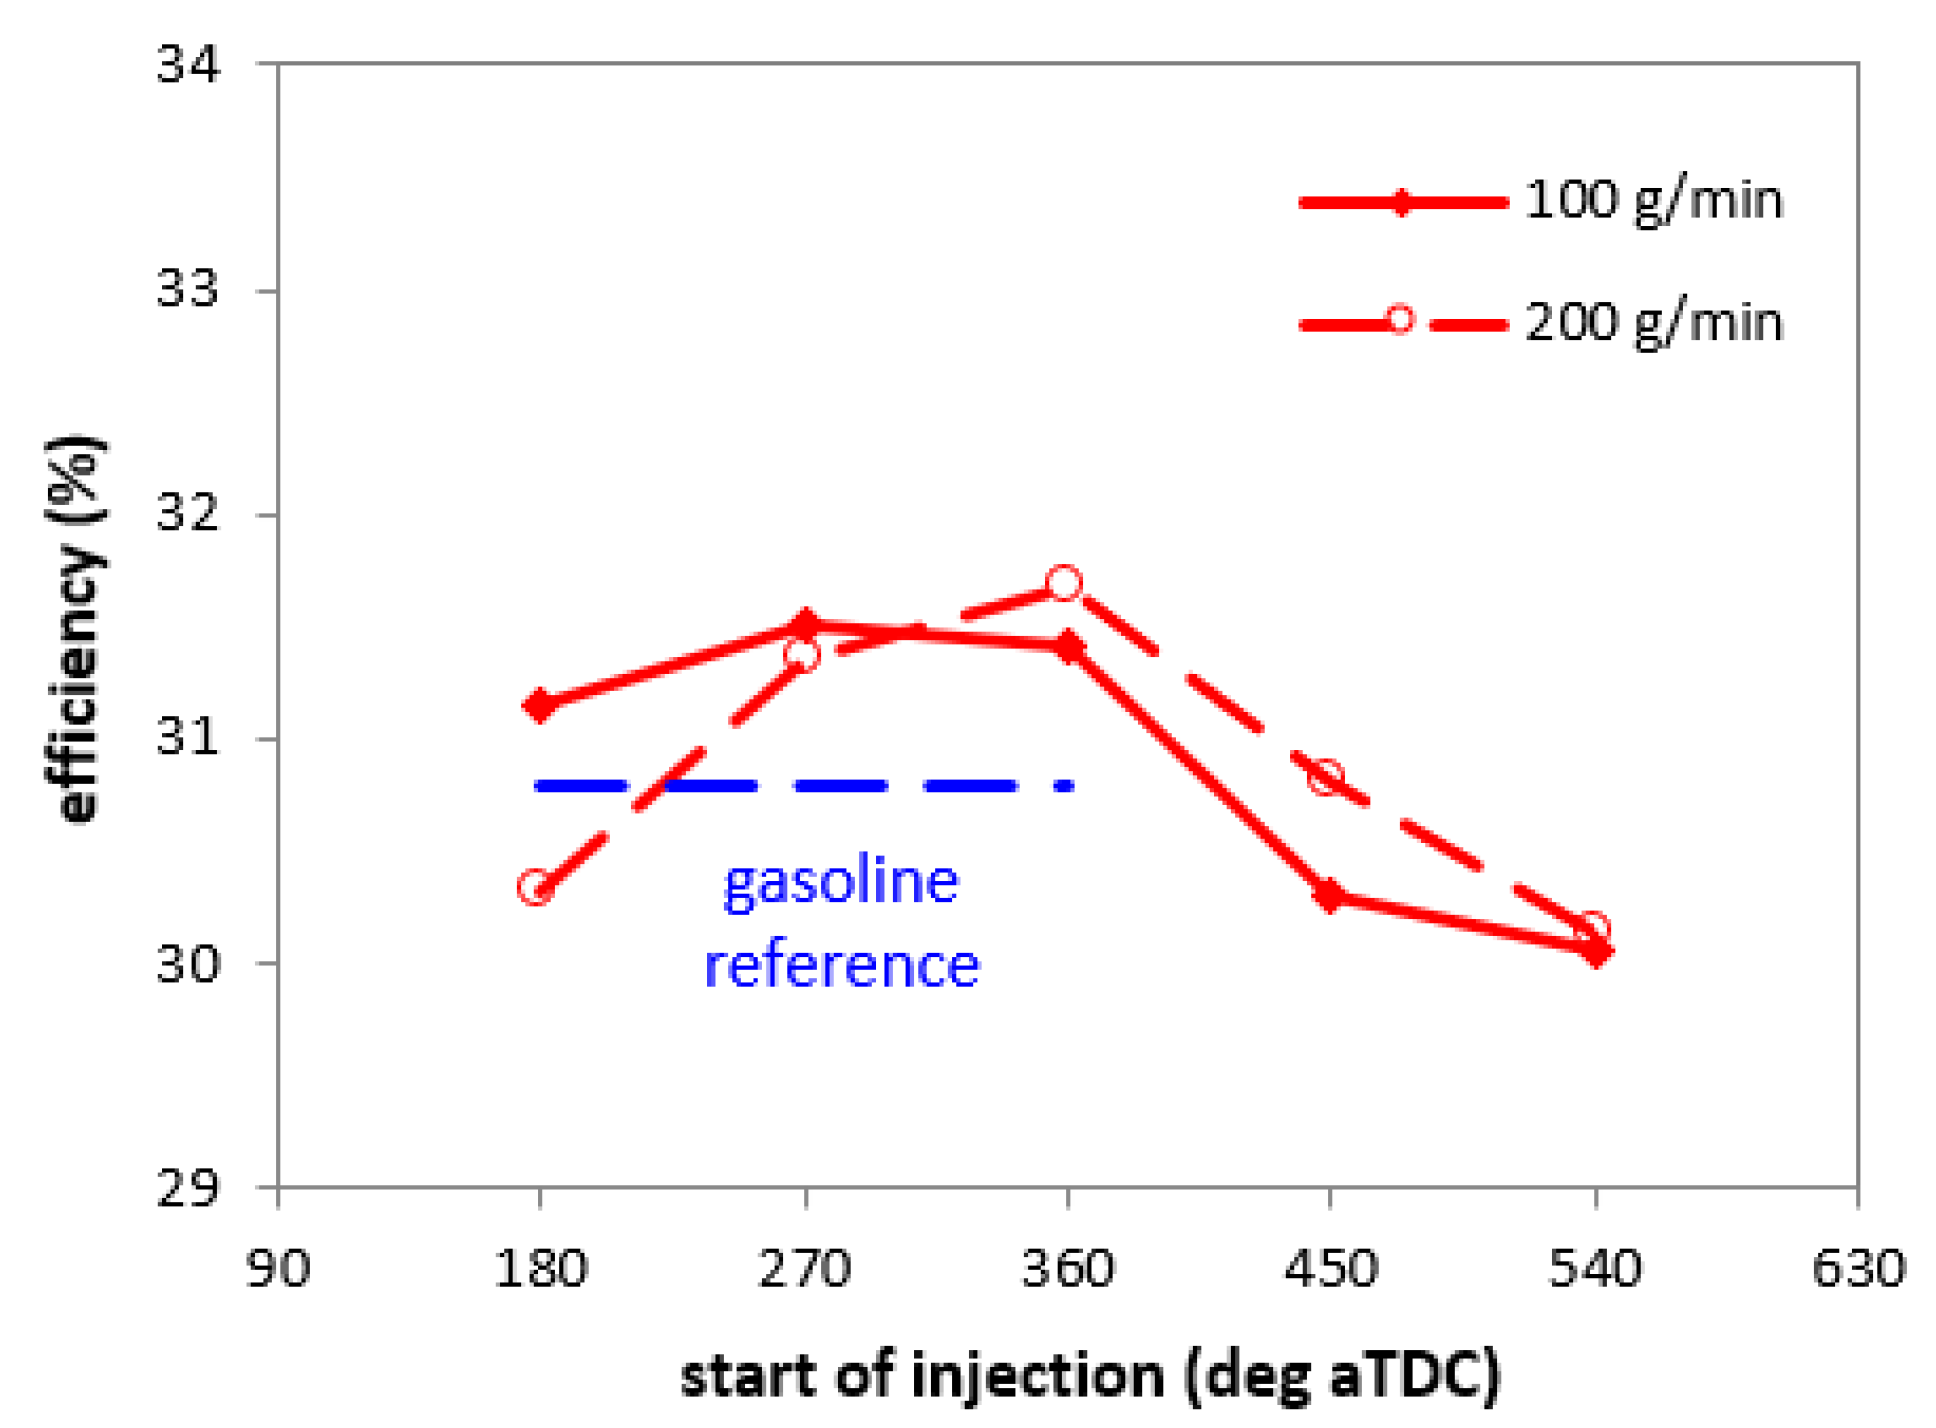
3.2. Start-of-Injection Effects for H2 Fueling

Two of the H2 injector flow ratings, i.e., 100 and 200 g/min, were chosen for investigating start-of-injection effects. The higher value of 200 g/min was characterized by maximum efficiency, and it complied with the explosion limit requirement, while the 100 g/min figure ensured only the efficiency criteria (meaning that a penalty of less than 1% was recorded with respect to the optimal value). These ratings should, however, be considered in terms of volumetric flow as well. For propane and methane, the 300 g/min values would be 55 and 148 L/min and would require injector hole diameters of around 2.5 and 3.1 mm, respectively (assuming a discharge coefficient of 0.75). In the case of hydrogen, the 200 g/min rating would result in a volumetric flow of over 1160 L/min and a minimum injector hole diameter of over 4 mm; this dimension would be reduced to slightly over 3 mm if the rated flow is halved, thus rendering it completely comparable to that required for methane. Consequently, the 100 and 200 g/min values were investigated with respect to SOI settings.
Previous peak power simulations revealed that starting the injection during the exhaust stroke can be more beneficial with respect to the intake [23], and, therefore, a range of 180–540 deg aTDC was considered for this part of the investigation. Figure 8 shows the effect of the SOI settings on efficiency. With a 100 g/min flow rating, the maximum efficiency was obtained when starting the fuel delivery at 270 deg aTDC, while roughly the same peak efficiency was obtained with the SOI at 360 deg aTDC when the flow was 200 g/min. This result appears to indicate that with correct choice of injection phasing, it would be possible to obtain the benefit of high efficiency even if half the rated flow was imposed. In terms of injector design, this would represent a significant advantage.
Figure 9 also confirms that practically the same cylinder imbalance characteristics can be obtained with both injector flow characteristics if the fuel delivery is advanced for the 100 g/min situation. Of course, starting the flow of H2 during the intake stroke would further reduce the possibility of backfire, but again, the significant reduction in the instant fuel flow could be a significant advantage. Keeping in mind the risk of backfire, the results of the simulated fuel concentrations in the intake port were also investigated. Indeed, the SOI360 setting ensured compliance with the explosion limit condition only if the fuel delivery rate was augmented up to 200 g/min (Figure 10; only cylinder 1 is shown, as it featured the highest H2 concentrations in the intake port at IVO). Instead, if the injection phasing was advanced by 90 deg, both the flow figures ensured fuel concentrations below the explosion threshold. This further emphasizes that if the optimization of SOI settings is included, safe and efficient engine operation can be obtained even with contained rated flow characteristics.

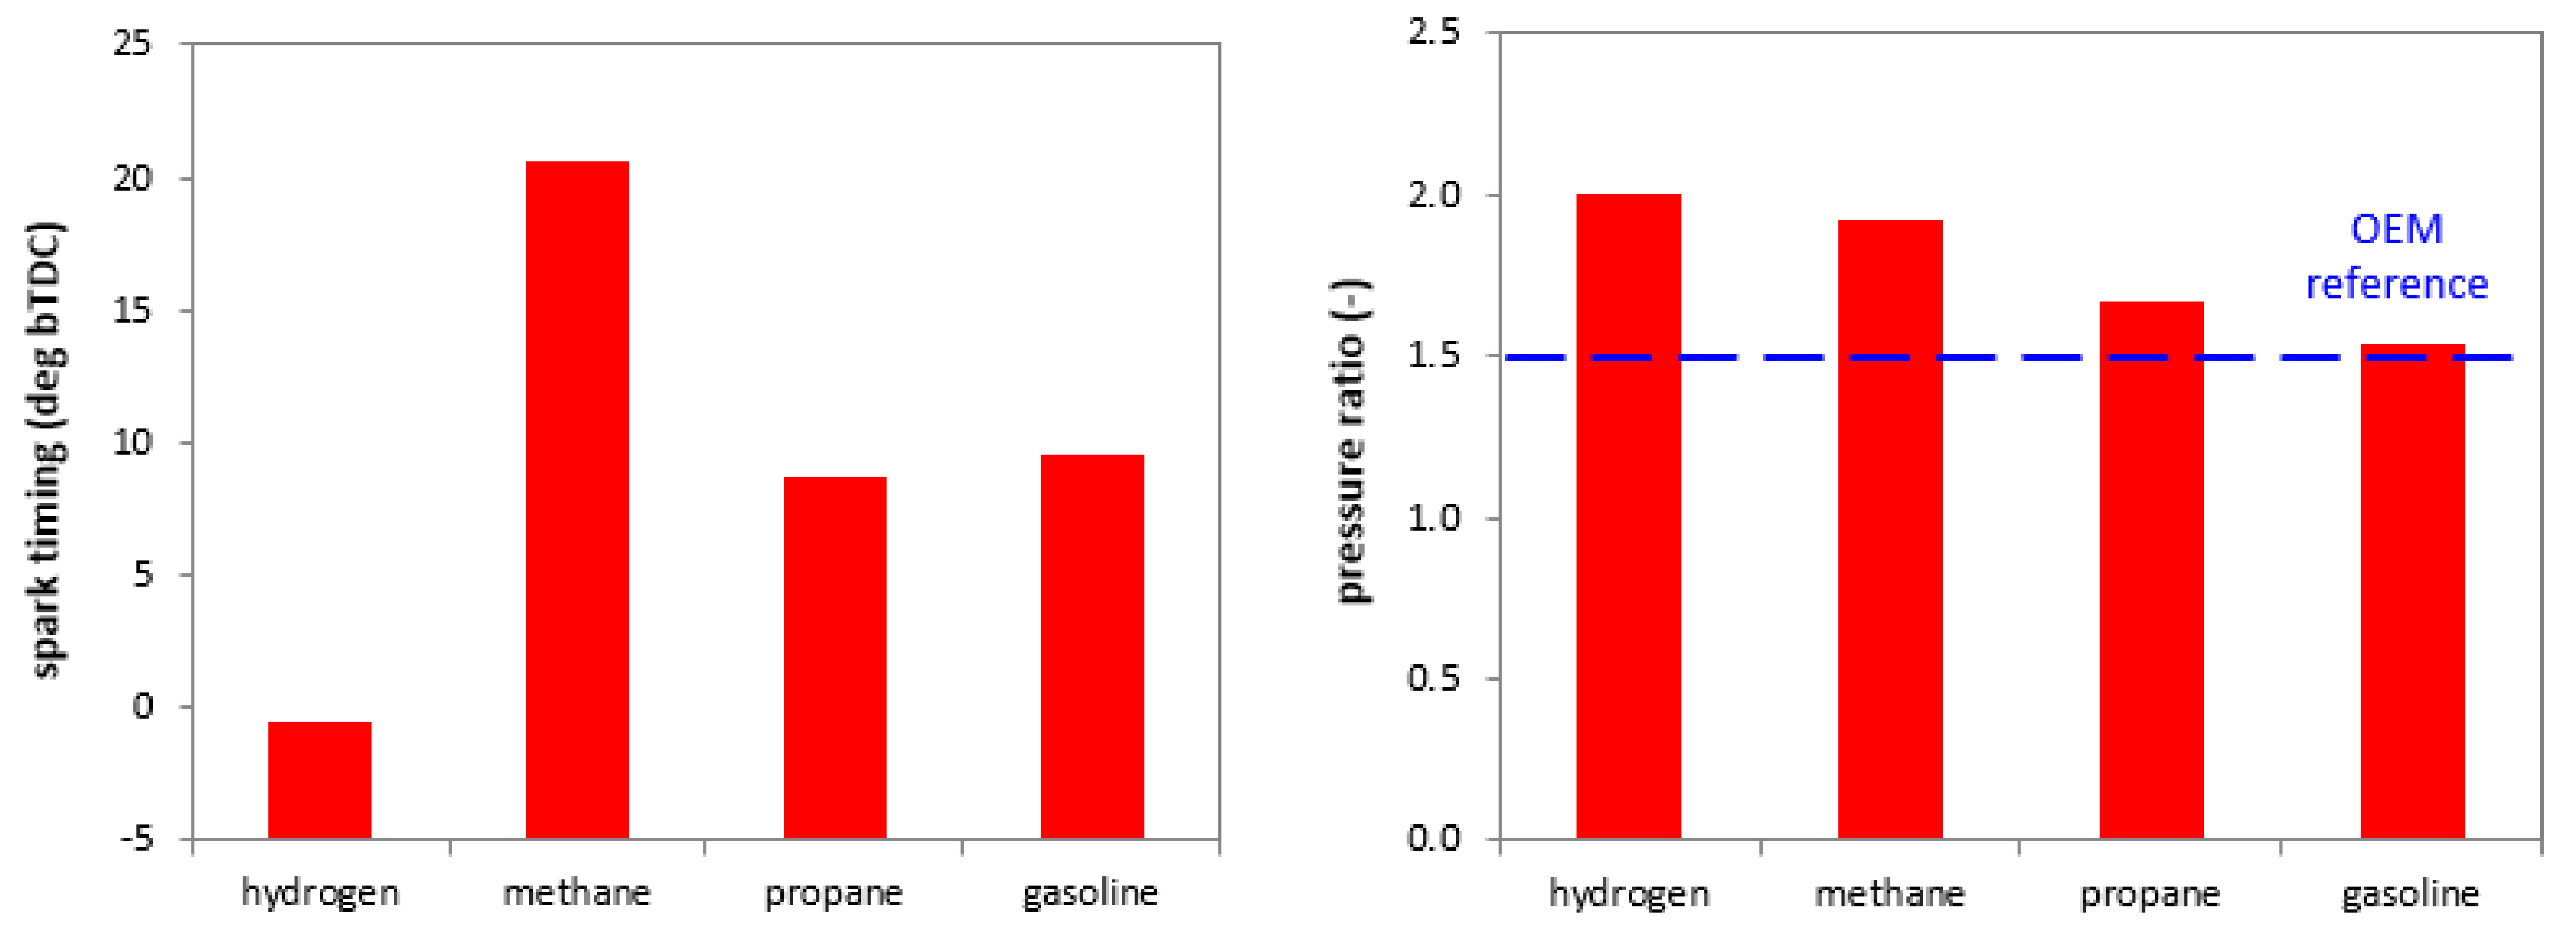
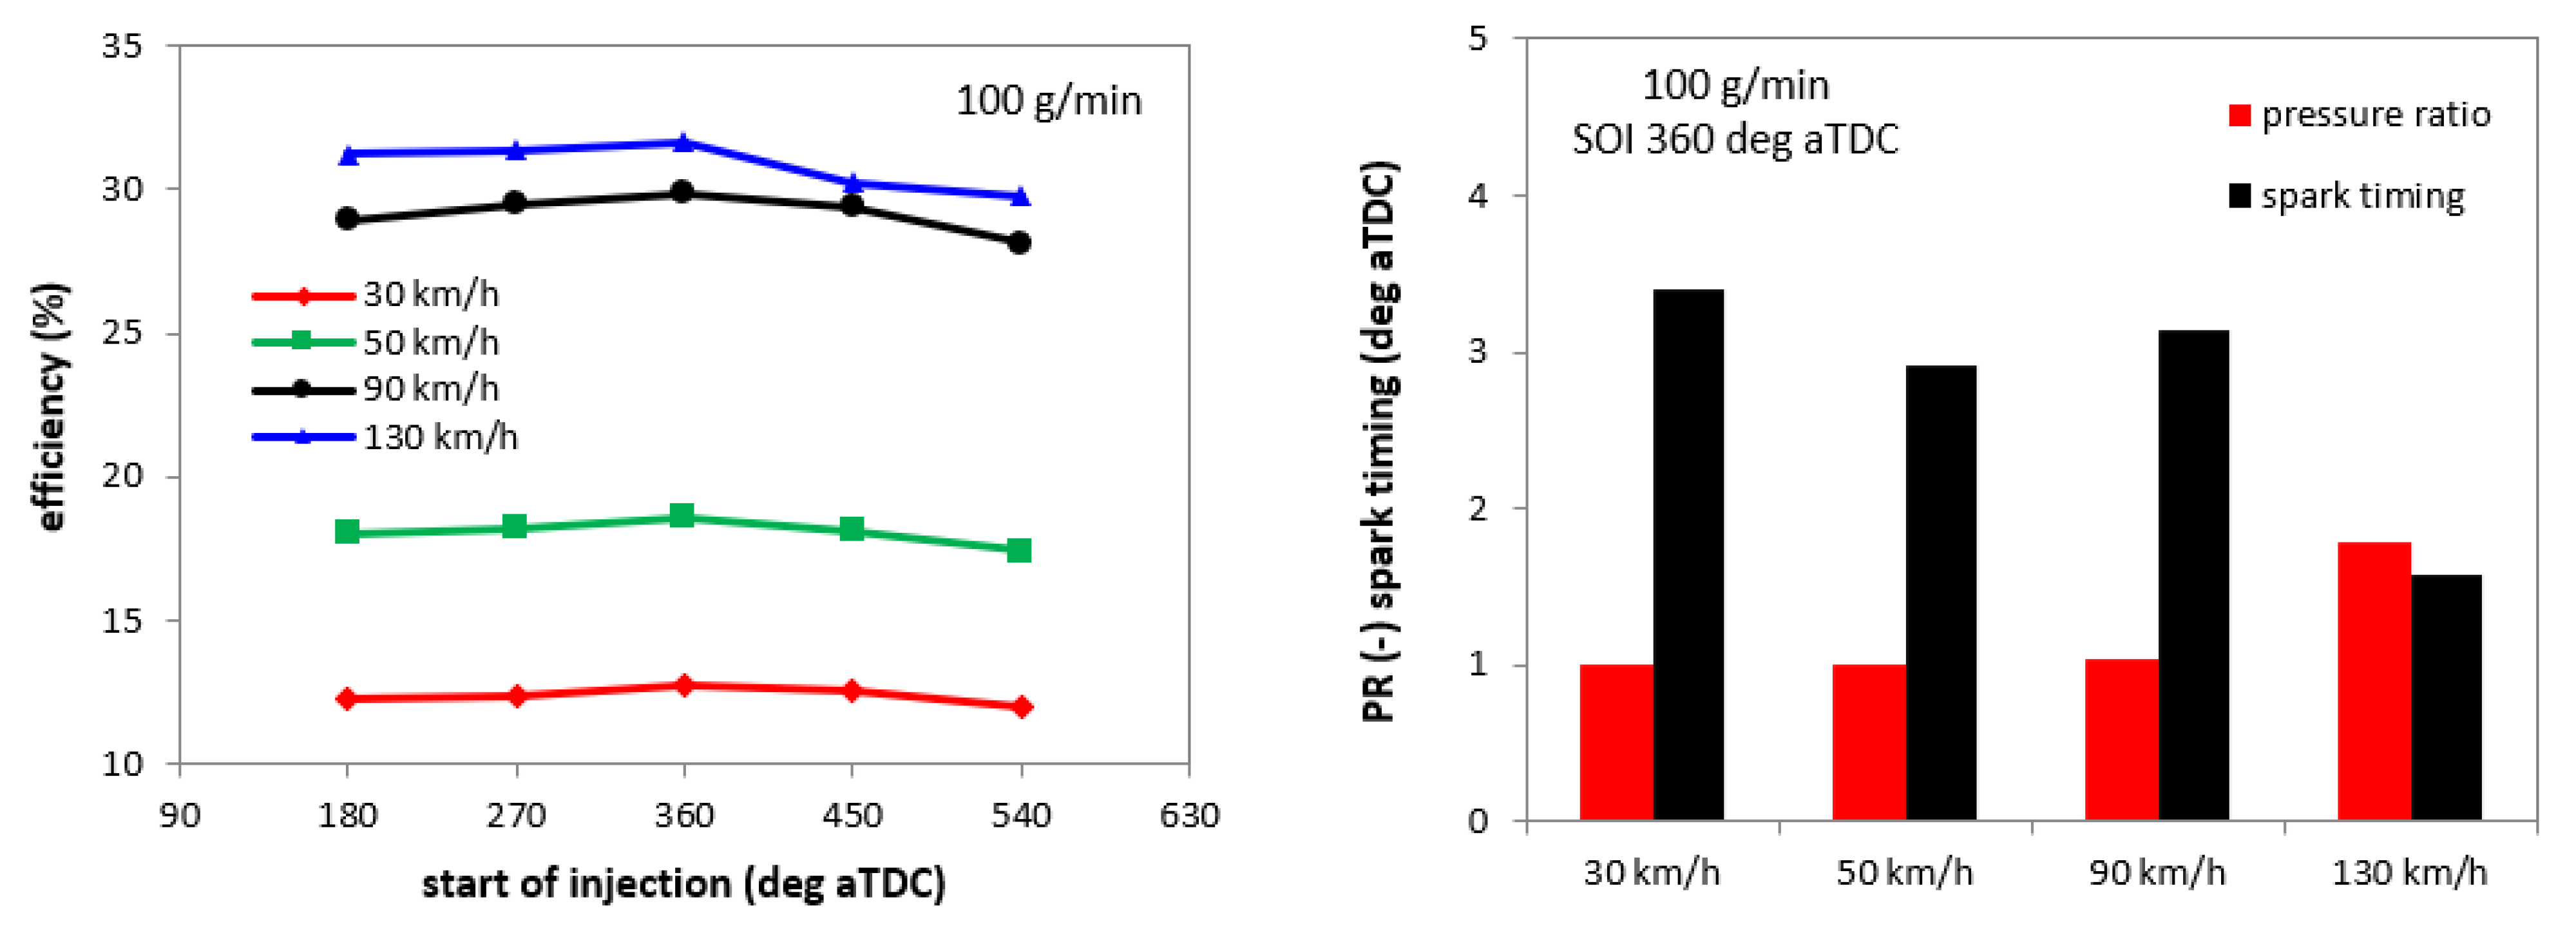
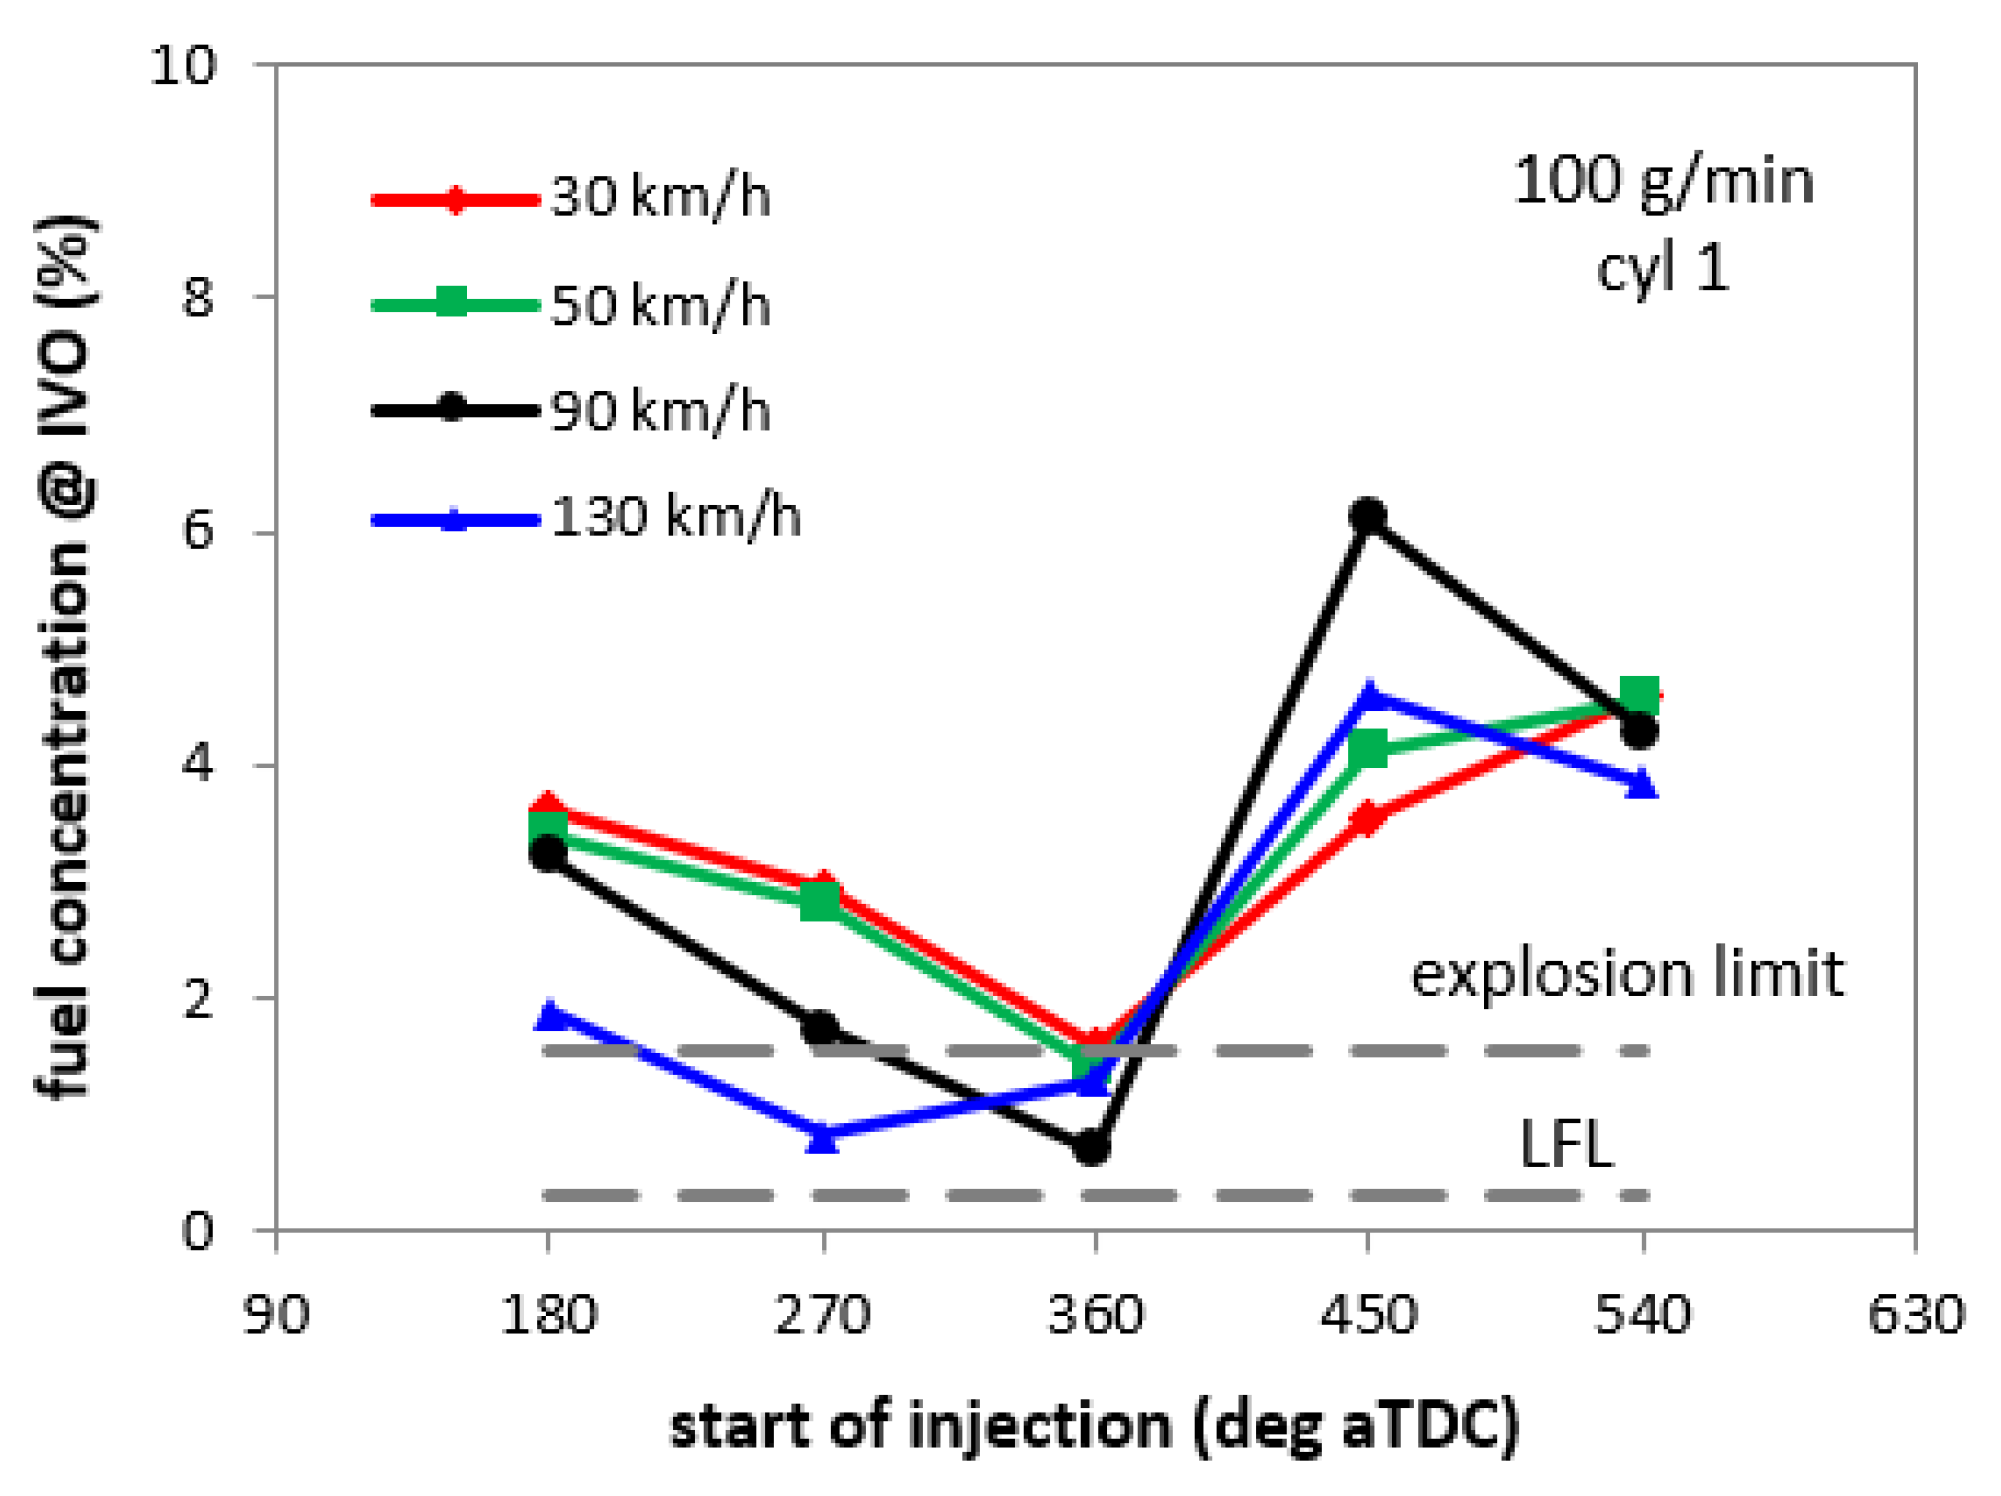
3.3. Selected Part-Load Operating Points with H2 Fueling

With the chosen injection rate of 100 g/min (given that it would require a lower injector nozzle diameter compared to the 200 g/min rating), several engine operating points were investigated with H2 fueling with respect to the optimized SOI settings at part load. These points were taken as representative for urban use, i.e., 30 and 50 km/h, and long-distance cruising, i.e., 90 and 130 km/h. They correspond to 1.3 kW at 2500 rpm, 3.2 kW at 3150 rpm, 12.5 kW at 2950 rpm and 33.2 kW at 4250 rpm, respectively.
The model predicted that significant benefits of close to 7% can be obtained in terms of efficiency when optimizing the SOI (Figure 11). Even if not immediately evident in terms of absolute values, changing the phasing of the fuel delivery resulted in quite similar variations in efficiency in terms of relative difference. This was somewhat unexpected, especially for the throttled conditions for which the injected quantity is relatively low. Nonetheless, it further emphasizes the need to approach the conversion to H2 fueling as a multi-objective problem. A positive aspect is that all four conditions featured the same optimal SOI setting, at 360 deg aTDC.
One interesting result is that the predicted optimal spark timing was within a relatively narrow range and quite close to the TDC. Another important aspect is that the 90 km/h condition required slight boosting, as opposed to the gasoline fueling that was throttled.
Figure 12 gives a more detailed insight into the risk of backfire. Again, only the results for cylinder 1 are shown, given that the other two featured lower fuel concentrations for all SOI settings. As an immediate observation, for the highest load condition (vehicle speed 130 km/h), the minimum risk condition was predicted to be with SOI270, as opposed to the other three that consistently showed lower H2 concentrations for SOI360. This can be explained by the fact that the highest load was closer to peak power operation and also featured SOI270 as the optimal setting. One unexpected result is that the model predicted a fuel concentration slightly over the explosion limit for the 30 km/h case. Given the low quantity and reduced load, as well as the temperature levels and relatively high residual gas fraction, the actual effects of a backfire phenomenon would most likely be minimal. Another fact that should be noted is that the model predicted H2 concentrations over the limit only for cylinder 1, thus further reducing the actual risk of backfire. It does, however, raise a potential issue that needs to be tackled in the development phase to avoid unwanted behavior.

4. Conclusions

The main goal of the study was to identify fuel system requirements in the context of converting a gasoline-powered small-size passenger car to hydrogen operation. Even if the approach is not limited to small-size powertrains (e.g., the same methodology could be used for scrutinizing the conversion of heavy-duty diesel engines), this category of vehicles presents the additional challenge of much more constrained cost margins. Evaluating the risk of backfire was an essential feature of the study, given that PFI was considered so as to maximize cost effectiveness. The overall concept was found to be feasible in terms of range, and the engine output was also directly comparable to the levels obtained with gasoline.
The fuel flow requirements were found to be more demanding with respect to other gaseous fuels such as propane and methane, especially in terms of volumetric flow. A H2 flow rating of 200 g/min was identified as the best choice with respect to fuel conversion efficiency, cylinder-to-cylinder variability of the volumetric efficiency and compliance with imposed fuel concentration limits at the IVO. Further augmenting the flow rating over the 200 g/min threshold did not provide significant benefits.
Cylinder imbalance was identified as a possible issue directly related to the use of gaseous fuels. If this parameter was found to be well within the 5% threshold usually accepted for SI units for gasoline, the COV was even at over 10% for all three gaseous fuels. Increasing the injector flow rates was found to significantly diminish this shortcoming.
When adding the SOI settings as an additional margin for control, the injector’s rated flow could be reduced to 100 g/min. Optimizing the fuel delivery phasing was found to ensure efficiency and a risk of backfire completely comparable to the previously identified optimal figure of 200 g/min.
Apart from the peak power condition, the SOI was found to exert an important effect during part-load operation as well. Four different vehicle speed settings showed that the optimal SOI in terms of efficiency was 360 deg aTDC. The explosion limit constraint revealed that the injection needs to be advanced at the highest load point at 130 km/h. Another surprising result is that the model predicted fuel concentrations at the IVO that were slightly over the explosion limit for the lowest vehicle speed of 30 km/h. Even if this situation was calculated only for one of the three cylinders, it does highlight the complexity of a seemingly straightforward conversion for the complete substitution of gasoline with H2.

Author Contributions

Conceptualization, A.I. and R.D.M.; methodology, A.I., B.M.V. and V.Z.; formal analysis, A.I. and V.Z.; data curation, A.I., S.S.M. and R.D.M.; writing—original draft preparation, A.I. and S.S.M.; writing—review and editing, A.I., B.M.V. and S.S.M.; supervision, B.M.V. All authors have read and agreed to the published version of the manuscript.

Funding

This research received no external funding.

Data Availability Statement

Not applicable.

Conflicts of Interest

The authors declare no conflict of interest.

References

  1. Hydrogen Council. Roadmap towards Zero Emission: BEVs and FCEVs, 10/21. Available online: www.hydrogencouncil.com (accessed on 20 December 2022).
  2. Sacchi, R.; Bauer, C.; Cox, B.; Mutel, C. When, where and how can the electrification of passenger cars reduce greenhouse gas emissions? Renew. Sustain. Energy Rev. 2022, 162, 112475. [Google Scholar] [CrossRef]
  3. Mills, S.J. Heavy duty hydrogen ICE: Production realization by 2025 and system operation efficiency assessment. In Powertrain Systems for Net-Zero Transport, 1st ed.; CRC Press: Boca Raton, FL, USA, 2021; ISBN 9781003219217. [Google Scholar]
  4. Candelaresi, D.; Valente, A.; Iribarren, D.; Dufour, J.; Spazzafumo, G. Comparative life cycle assessment of hydrogen-fuelled passenger cars. Int. J. Hydrogen Energy 2021, 46, 35961–35973. [Google Scholar] [CrossRef]
  5. Verhelst, S.; Wallner, T. Hydrogen-fueled internal combustion engines. Progress Energy Combust. Sci. 2009, 35, 490–527. [Google Scholar] [CrossRef]
  6. Liu, X.; Seberry, G.; Kook, S.; Nian Chan, Q.; Hawkes, E.R. Direct injection of hydrogen main fuel and diesel pilot fuel in a retrofitted single-cylinder compression ignition engine. Int. J. Hydrogen Energy 2022, 47, 35864–35876. [Google Scholar] [CrossRef]
  7. Zucca, G.; Mocci, A.; Tirilló, J.; Bernabei, M.; De Paolis, F. Hydrogen Embrittlement and Fatigue Fracture of a Crankshaft of an Internal Combustion Engine. Procedia Eng. 2015, 109, 202–209. [Google Scholar] [CrossRef]
  8. Rorimpandey, P.; Lung Yip, H.; Srna, A.; Zhai, G.; Wehrfritz, A.; Kook, S.; Hawkes, E.R.; Nian Chan, Q. Hydrogen-diesel dual-fuel direct-injection (H2DDI) combustion under compression-ignition engine conditions. Int. J. Hydrogen Energy 2023, 48, 766–783. [Google Scholar] [CrossRef]
  9. Janarthanam, S.; Blankenship, J.; Soltis, R.; Szwabowski, S.; Jaura, A.K. Architecture and Development of a Hydrogen Sensing and Mitigation System in H2RV—Ford’s Concept HEV Propelled with a Hydrogen Engine; SAE Technical Paper 2004-01-0359; SAE International: Warrendale, PA, USA, 2004. [Google Scholar]
  10. Kosmadakis, G.M.; Rakopoulos, D.C.; Rakopoulos, C.D. Assessing the cyclic-variability of spark-ignition engine running on methane-hydrogen blends with high hydrogen contents of up to 50%. Int. J. Hydrogen Energy 2021, 46, 17955–17968. [Google Scholar] [CrossRef]
  11. Irimescu, A.; Cecere, G.; Sementa, P. Combustion Phasing Indicators for Optimized Spark Timing Settings for Methane-Hydrogen Powered Small Size Engines; SAE Technical Paper 2022-01-0603; SAE International: Warrendale, PA, USA, 2022. [Google Scholar] [CrossRef]
  12. Stępień, Z.A. Comprehensive Overview of Hydrogen-Fueled Internal Combustion Engines: Achievements and Future Challenges. Energies 2021, 14, 6504. [Google Scholar] [CrossRef]
  13. Wallner, T.; Ciatti, S.; Bihari, B. Investigation of Injection Parameters in a Hydrogen DI Engine Using an Endoscopic Access to the Combustion Chamber; SAE Technical Paper 2007-01-1464; SAE International: Warrendale, PA, USA, 2007. [Google Scholar] [CrossRef]
  14. Fischer, M.; Sterlepper, S.; Pischinger, S.; Seibel, J.; Kramer, U.; Lorenz, T. Operation principles for hydrogen spark ignited direct injection engines for passenger car applications. Int. J. Hydrogen Energy 2021, 47, 5638–5649. [Google Scholar] [CrossRef]
  15. Gao, J.; Wang, X.; Song, P.; Tian, G.; Ma, C. Review of the backfire occurrences and control strategies for port hydrogen injection internal combustion engines. Fuel 2022, 307, 121553. [Google Scholar] [CrossRef]
  16. Yang, Z.; Zhang, F.; Wang, L.; Wang, K.; Zhang, D. Effects of injection mode on the mixture formation and combustion performance of the hydrogen internal combustion engine. Energy 2018, 147, 715–728. [Google Scholar] [CrossRef]
  17. Luo, Q.; Sun, B. Experiments on the effect of engine speed, load, equivalence ratio, spark timing and coolant temperature on the energy balance of a turbocharged hydrogen engine. Energy Convers. Manag. 2018, 162, 1–12. [Google Scholar] [CrossRef]
  18. Diéguez, P.M.; Urroz, J.C.; Sáinz, D.; Machin, J.; Arana, M.; Gandía, L.M. Characterization of combustion anomalies in a hydrogen-fueled 1.4 L commercial spark-ignition engine by means of in-cylinder pressure, block-engine vibration, and acoustic measurements. Energy Convers. Manag. 2018, 172, 67–80. [Google Scholar] [CrossRef]
  19. Thawko, A.; Tartakovsky, L. The Mechanism of Particle Formation in Non-Premixed Hydrogen Combustion in a Direct-Injection Internal Combustion Engine. Fuel 2022, 327, 125187. [Google Scholar] [CrossRef]
  20. Thawko, A.; Eyal, A.; Tartakovsky, L. Experimental comparison of performance and emissions of a direct-injection engine fed with alternative gaseous fuels. Energy Convers. Manag. 2022, 251, 114988. [Google Scholar] [CrossRef]
  21. Duc, K.N.; Duy, V.N.; Hoang-Dinh, L.; Viet, T.N.; Le-Anh, T. Performance and emission characteristics of a port fuel injected, spark ignition engine fueled by compressed natural gas. Sust. Energy Technol. Assess. 2019, 31, 383–389. [Google Scholar] [CrossRef]
  22. Wallner, T.; Lohse-Busch, H.; Gurski, S.; Duoba, M.; Thiel, W.; Martin, D.; Korn, T. Fuel economy and emissions evaluation of BMW Hydrogen 7 Mono-Fuel demonstration vehicles. Int. J. Hydrogen Energy 2008, 33, 7607–7618. [Google Scholar] [CrossRef]
  23. Irimescu, A.; Vaglieco, B.M.; Merola, S.; Zollo, V.; De Marinis, R. Conversion of a Small Size Passenger Car to Hydrogen Fueling: Focus on Rated Power and Injection Phasing Effects; SAE Technical Paper 2022-24-0031; SAE International: Warrendale, PA, USA, 2022. [Google Scholar] [CrossRef]
  24. Irimescu, A.; Vaglieco, B.M.; Merola, S.S.; Zollo, V.; De Marinis, R. Conversion of a Small-Size Passenger Car to Hydrogen Fueling: Simulation of CCV and Evaluation of Cylinder Imbalance. Machines 2023, 11, 135. [Google Scholar] [CrossRef]
  25. Smart EQ ForTwo. Available online: www.smart.mercedes-benz.com (accessed on 17 November 2022).
  26. Gamma Technologies. GT-SUITE Flow Theory Manual; Version 7.4; Gamma Technologies: Westmont, IL, USA, 2013. [Google Scholar]
  27. Thomas, J.; West, B.; Huff, S. Effect of Air Filter Condition on Diesel Vehicle Fuel Economy; SAE Technical Paper 2013-01-0311; SAE International: Warrendale, PA, USA, 2013. [Google Scholar] [CrossRef]
  28. Dziubak, T.; Boruta, G. Experimental and Theoretical Research on Pressure Drop Changes in a Two-Stage Air Filter Used in Tracked Vehicle Engine. Separations 2021, 8, 71. [Google Scholar] [CrossRef]
  29. Dziubak, T.; Karczewski, M. Experimental Study of the Effect of Air Filter Pressure Drop on Internal Combustion Engine Performance. Energies 2022, 15, 3285. [Google Scholar] [CrossRef]
  30. Gerke, U.; Steurs, K.; Rebecchi, P.; Boulouchos, K. Derivation of burning velocities of premixed hydrogen/air flames at engine-relevant conditions using a single-cylinder compression machine with optical access. Int. J. Hydrogen Energy 2010, 35, 2566–2577. [Google Scholar] [CrossRef]
  31. Rakopoulos, C.D.; Kosmadakis, G.M.; Demuynck, J.; De Paepe, M.; Verhelst, S. A combined experimental and numerical study of thermal processes, performance and nitric oxide emissions in a hydrogen-fueled spark-ignition engine. Int. J. Hydrogen Energy 2011, 36, 5163–5180. [Google Scholar] [CrossRef]
  32. Heywood, J.B. Internal Combustion Engine Fundamentals; McGraw Hill: New York, NY, USA, 1988. [Google Scholar]
  33. Irimescu, A. Comparison of combustion characteristics and heat loss for gasoline and methane fueling of a spark ignition engine. Proc. Rom. Acad. Ser. A 2013, 14, 161–168. [Google Scholar]
  34. Office of Energy Efficiency and Renewable Energy—Hydrogen and Fuel Cell Technologies. Available online: www.energy.gov (accessed on 5 March 2022).
Figure 1. Overall layout of the engine considered for simulations.
Energies 16 04201 g001
Figure 2. Overview of the 0D/1D simulation model, with selected components highlighted.
Energies 16 04201 g002
Figure 3. Brake fuel conversion efficiency predicted at peak power for a range of fuel delivery rates.
Energies 16 04201 g003
Figure 4. Optimized ignition settings and boost requirements at peak power.
Energies 16 04201 g004
Figure 5. Simulated relative air–fuel ratios at cycle start for the injection rate that featured maximum efficiency (left) and effect of injection rate on cylinder imbalance (right).
Energies 16 04201 g005
Figure 6. Fuel mass fraction in the intake port during H2 fueling, calculated throughout the working cycle at peak engine power and with the 200 g/min injector flow rating.
Energies 16 04201 g006
Figure 7. Hydrogen mass fraction in the intake port simulated at intake valves’ opening in peak power operating conditions.
Energies 16 04201 g007
Figure 8. Simulated efficiency with two flow ratings for identifying SOI effects at peak power output.
Energies 16 04201 g008
Figure 9. Calculated cylinder-to-cylinder variation in air–fuel ratio at IVC at peak power for two injector flow ratings.
Energies 16 04201 g009
Figure 10. Simulated fuel mass fraction in the intake port at peak power for two injector flow ratings.
Energies 16 04201 g010
Figure 11. Simulated efficiency, pressure ratio and spark timing settings at four vehicle speed values.
Energies 16 04201 g011
Figure 12. Simulated fuel concentrations in the intake port of cylinder 1 at four different levels of engine load.
Energies 16 04201 g012
Table 1. Engine specifications.
Description
Displacement599 cm3
Number of cylinders3
Rated power40 kW @ 5250 rpm
Rated torque80 Nm @ 2000–4400 rpm
Bore × stroke63.5 mm × 63.0 mm
Connecting rod length114 mm
Compression ratio9.5:1
Number of valves2 per cylinder
Intake valves’ opening/closure363/164 deg bTDC
Exhaust valves’ opening/closure157/349 deg a/bTDC
Fuel systemport fuel injection at 3.5 bar for gasoline and 5 bar for hydrogen
Ignitioninductive discharge, 2 spark plugs per cylinder
Disclaimer/Publisher’s Note: The statements, opinions and data contained in all publications are solely those of the individual author(s) and contributor(s) and not of MDPI and/or the editor(s). MDPI and/or the editor(s) disclaim responsibility for any injury to people or property resulting from any ideas, methods, instructions or products referred to in the content.

