Article

Improving the Electrochemical Performance of Core–Shell LiNi0.8Co0.1Mn0.1O2 Cathode Materials Using Environmentally Friendly Phase Structure Control Process

1
School of Mechanical and Automotive Engineering, Liaocheng University, Liaocheng 252000, China
2
School of Chemistry and Chemical Engineering, Liaocheng University, Liaocheng 252000, China
3
Shandong Yellow Sea Science and Technology Innovation Research Institute, Rizhao 262306, China
*
Authors to whom correspondence should be addressed.
Energies 2023, 16(10), 4149; https://doi.org/10.3390/en16104149
Submission received: 28 March 2023 / Revised: 10 May 2023 / Accepted: 12 May 2023 / Published: 17 May 2023

Abstract

:
The phase structure of the precursor is crucial for the microstructure evolution and stability of Ni-rich cathode materials. Using sodium lactate as a green complexing agent, cathode electrode materials with different phase structures and unique core–shell structures were prepared by the co-precipitation method in this study. The influence of the phase structure of the nickel-rich precursor on the cathode electrode materials was studied in depth. It was found that α-NCM811 had large interlayer spacing, which was beneficial for the diffusion of lithium ions. In contrast, β-NCM811 had smaller interlayer spacing, a good layered structure, and lower ion mixing, resulting in better cycling performance. The core–shell-αβ-NCM811 with α-NCM811 as the core and β-NCM811 as the shell was prepared by combining the advantages of the two different phases. The core–shell-αβ-NCM811 showed the highest discharge capacity of 158.7 mAh/g at 5 C and delivered excellent rate performance. In addition, the β-NCM811 shell structure with smaller layer spacing could prevent corrosion of the α-NCM811 core by the electrolyte. Thus, the capacity retention rate of the core–shell-αβ-NCM811 was still as high as 86.16% after 100 cycles.

1. Introduction

With the development of new energy vehicles, adjustments of the energy structure will continue and a sound economic system of green and low-carbon circular development will be established on a global scale. As is known, range anxiety and the potential safety hazards of new energy vehicles (NEVs) are at the heart of restricting large-scale application of NEVs [1,2,3]. LiNixCoyMnzO2 (NCMxyz) materials have been considered as a prospective power energy carrier material due to the coordination between Ni, Co, and Mn elements. Increasing the nickel content in layered oxide cathode materials is the main strategy to increase the energy density of lithium batteries. Therefore, NCM811 cathode material is considered to be the most promising power energy carrier material. However, the structure of nickel-rich layered cathode materials is very unstable due to oxygen evolution and phase structure changes during the charging and discharging processes [4] (Figure 1). The discharge capacity is increased with nickel-rich materials, but the capacity retention and safety properties decrease when the nickel content increases. This problem leads to frequent safety accidents with power batteries, and their safety has always been a hot but difficult topic in the industry of lithium battery research [5].
At present, ion doping (Mg [6], Nb [7]) and surface coating (SnO2 [8], Al2O3 [9]) are commonly used to improve the electrochemical performance of materials. Ion doping can effectively inhibit the mixing of Li+/Ni2+ and improve the structural stability of the materials [10]. However, ion doping cannot prevent the corrosion of the electrode by the electrolyte [11]. Surface coating modification can prevent direct contact by providing a physical barrier between the cathode material and electrolyte, thus greatly reducing the occurrence of negative reactions [12]. However, most coating materials have low capacity and voltage platforms that cannot meet the requirements of high capacity and high energy density [13]. The precursor structure is the key determinant of the stability and energy storage properties of the ternary cathode material. The electrochemical properties of the cathode material can be changed by controlling the precursor composition, morphology, and microstructure [14,15].
The nickel-rich ternary precursors only form a solid solution phase of nickel hydroxide, and a single phase of Co or Mn with low content cannot be formed by the co-precipitation process. Therefore, the stability of the precursor structure is affected by the nickel hydroxide lattice. As is known, Ni(OH)2 has two different structural forms: α-Ni(OH)2 and β-Ni(OH)2. The structure of α-Ni(OH)2 has a large interlayer space because of the interlayering of water, nitrate, and carbonate. The α-Ni(OH)2 phase can effectively reduce the internal stress of the material by means of its helical structure during the oxidation process [16,17]. The α-Ni(OH)2 lattice is apt to rotate along the c-axis in strong alkali or at high temperature. Then, with the loss of some crystal water and interlayer metal ions, the α-Ni(OH)2 phase transforms into β-Ni(OH)2, with smaller interlayer spacing [18,19,20]. Liang et al. [21] successfully covered β-Ni(OH)2 on α-Ni(OH)2 using the two-step hydrothermal method. The study showed that the β-Ni(OH)2 had nano size and strong stability under alkaline conditions, whereas the α-Ni(OH)2 had a large specific surface and good electrical conductivity. Therefore, there were various synergistic effects between the β-Ni(OH)2 shell and the α-Ni(OH)2 core, and excellent electrochemical performance of the electrode was obtained.
At present, research on the nickel hydroxide phase structure is mainly focused on the nickel–hydrogen battery and supercapacitor, but there is no report of nickel-rich ternary cathode materials and their precursors as related to phase structure. Herein, cathode electrode materials with different phase structures and unique core–shell structures were synthesized using a green co-precipitation method, and the effects of precursor phase structure and core–shell structure on the cathode electrode materials were studied in depth.

2. Experimental Procedures

2.1. Preparation of Cathode Material

The Ni0.8Co0.1Mn0.1(OH)2 precursors were synthesized using the co-precipitation method. First, NiSO4·7H2O (Xilong scientific Co., Ltd., Shantou, China), CoSO4·6H2O (Foshan Xilong Chemical Co., Ltd., Foshan, China), and MnSO4·H2O (Tianjin Zhiyuan Chemical Reagent Co., Ltd., Tianjin, China) were configured in a molar ratio of 8:1:1 in 250 mL of aqueous solution with a concentration of 2 mol/L. To the above aqueous solution, 250 mL of sodium lactate solution (Tianjin Damao Chemical Reagent Factory, Tianjin, China) was added to obtain mixed solution A, with a molar ratio of sodium lactate to metal salt of 1:1. Mixed solution A and 4 mol/L sodium hydroxide (Yantai Yuandong Fine Chemicals Co., Ltd., Yantai, China) were added to the reactor under an N2 atmosphere at the same time, and the temperature, pH value, and stirring speed of the co-precipitation system were controlled at 55 °C, 10, and 800 r/min, respectively. After intense stirring for 14 h and allowing it to stand for 12 h, the precursor was obtained after filtration, washing, and drying, and the precursor was named Q1. Subsequently, 400 mL of mixed solution A and 4 mol/L sodium hydroxide were added into the reactor at the same time under an N2 atmosphere, and the temperature, pH value, and stirring speed of the co-precipitation system were controlled at 55 °C, 10, and 800 r/min, respectively. After the reaction for 2 h, the temperature and pH value of the co-precipitation system were adjusted to 65 °C and 11.5, respectively. At the same time, 100 mL of deionized water was added into the reactor, stirred vigorously for 12 h, and left for 12 h. The precursor was obtained by filtration, washing, and drying, and then named Q2. Next, 400 mL of mixed solution A and 4 mol/L sodium hydroxide were added into the reactor at the same time under an N2 atmosphere, and the temperature, pH value, and stirring speed of the co-precipitation system were controlled at 55 °C, 10, and 800 r/min, respectively. After the reaction for 2 h, the temperature and pH value of the co-precipitation system were adjusted to 65 °C and 11.5, respectively. At the same time, the remaining 100 mL of mixed solution A was added into the reactor, stirred vigorously for 12 h, and left for 12 h. The precursor was obtained by filtration, washing, and drying, and then named Q3. The mixed solution A and 4 mol/L sodium hydroxide were added into the reactor at the same time under an N2 atmosphere, and the temperature, pH value, and stirring speed of the co-precipitation system were controlled at 65 °C, 11.5, and 800 r/min, respectively. The precursor was obtained by stirring vigorously for 14 h and then standing for 12 h. As seen in Figure 2, the precursor was obtained by filtration, washing and drying, and then named Q4. The preparation process of the samples is described in Table 1.
All the prepared precursors were respectively mixed with lithium hydroxide (Xilong scientific Co., Ltd.) at a molar ratio of 1:1.05, and then the mixed samples were sintered in a tube furnace. First, pre-sintering was carried out at a rate of 2 °C/min to 500 °C for 5 h. After cooling to room temperature, the pre-sintering products were taken out and ground, and then put back into the tubular furnace to be sintered at a rate of 5 °C/min to 750 °C for 12 h. It should be noted that the whole calcination process was carried out under an oxygen-enriched atmosphere [22]. Finally, the corresponding cathode materials were obtained, respectively.

2.2. Characterization of Structure and Morphology

The crystal structure of the material was analyzed by X-ray diffraction (XRD) and tested using a German Bruker D8 Advance transtarget diffractometer. The scanning range was 5°~85°, the step size was 0.02°, and the scanning rate was 5°/min (λ = 0.15406 nm). The parameters of the Rietveld refinement structure were analyzed using Jade 6.0. The surface morphology was observed using a ZEISS SIGMA300 scanning electron microscope (SEM).

2.3. Electrochemical Performance Test

The cathode electrode material, polyvinylidene fluoride (SaiBo Electrochemical Material), and acetylene black (SaiBo Electrochemical Material) were weighed according to the mass ratio of 8:1:1 and mixed well. Then, a certain amount of N-methyl-pyrrolidone (SaiBo Electrochemical Material) was added, ground into a uniform slurry, evenly coated on aluminum foil, and then put in a 100 °C vacuum drying oven for 12 h to make the cathode electrode sheet. The cathode electrode sheet was stamped into φ12 mm electrode sheets using a slicing machine and they were weighed. Half battery assembly was carried out in a vacuum glove box protected by argon, with the lithium metal sheet as the negative electrode, LiPF6 (EC:DEC = 1:1) as the electrolyte, and Celgard 2400 polymer film as the separator. The CR2032-type button cell was assembled.
The blue electric battery test system (LandCT2001A) was used to test the charge–discharge performance of the battery. The temperature was 25 °C, the voltage range was 3.0–4.3 V, and the charge–discharge rate was 0.1–5.0 C (1 C = 200 mA/g). The cyclic voltammetry (CV) and alternating current impedance (EIS) of the battery were measured by the electrochemical workstation (CHI660E). The scanning rate was 0.1 mV/s, the voltage amplitude was 5 mV, and the scanning frequency was 10 mHz~100 kHz. The diffusion coefficient of lithium ions was measured using the intermittent constant current charge–discharge technique (GITT), which was applied at 0.1 C for 10 min and left standing for 60 min.

3. Results and Discussion

3.1. Thermodynamic Model of Co-Precipitation of Precursors

The reaction equations and their equilibrium constants in the co-precipitation system, which involve ionization, complexation, and precipitation reactions, are shown in Table 2.
In the calculations, the activity of the ion is approximately replaced by its concentration, and the total concentrations of nickel, cobalt, manganese and sodium lactate in the solution are represented by [Ni]T, [Co]T, [Mn]T, and [L]T, respectively. [Ni2+], [Co2+], [Mn2+], [L], [OH], and [HL] are the equilibrium concentrations of Ni2+, Co2+, Mn2+, C3H5O3, OH, and C3H6O3. S represents the saturation. If the system is in precipitation–dissolution equ-librium, there are:
[ Ni 2 ] [ OH ] 2 = K spNi
[ Co 2 ] [ OH ] 2 = K spCo
[ Mn 2 ] [ OH ] 2 = K spMn
[ Ni ] T = [ Ni 2 + ] ( 1 + n = 1 3 β Ni ( n ) [ OH ] + K NL [ L ] )
[ Co ] T = [ Co 2 + ] ( 1 + n = 1 4 β Co ( n ) [ OH ] + K CL [ L ] )
[ Mn ] T = [ Mn 2 + ] ( 1 + n = 1 3 β Mn ( n ) [ OH ] + K ML [ L ] )
[ L ] T = [ HL ] + [ L ] ( 1 + K NL [ Ni 2 + ] + K CL [ Co 2 + ] + K ML [ Mn 2 + ] )
S = [ M ] [ OH ] 2 K sp   ( [ M ]   is   the   concentration   of   metal   ions )
Based on the thermodynamic analysis of the solution system, the solubility of the target under different conditions is calculated, and the relationship between the residual metal ions in the solution and the pH value (pH-lg[M]T) is drawn. This is a common method used to determine the optimal pH range of co-precipitation [24]. However, the curve of pH-lg[M]T only describes the equilibrium state at the end of precipitation, whereas the co-precipitation process is carried out under the supersaturation state. The supersaturation of the system under different conditions has a significant effect on the particle size, morphology, and crystal form of the products [25]. Therefore, building a thermodynamic simulation of the supersaturation state of the co-precipitation system and discussing the evolution law of the supersaturation of the system under different conditions have more guiding significance for the synthesis of inorganic powders by the liquid co-precipitation method.
In the simulation, the temperature and ionic strength were assumed to be 25 °C and 0, respectively. As can be seen in Table 3, the precipitation equilibrium constants of Ni(OH)2 and Co(OH)2 were relatively higher than that of Mn(OH)2 before the addition of the complexing agent. Additionally, the precipitation rates of Ni(OH)2 and Co(OH)2 were nearly 1000 times that of Mn(OH)2. Thus, the ideal co-precipitation effect of the ternary precursor could not be obtained. Using sodium lactate as the co-precipitation complexing agent not only reduced the precipitation rates of Ni2+, Co2+, and Mn2+, but it also effectively balanced the precipitation rates of Ni2+, Co2+, and Mn2+. This indicated that using sodium lactate as a complexing agent was feasible in theory. It was assumed that the reaction system was in the stage of co-precipitation induction, and the combination reactions of metal ions and C3H5O3 with the dissociation reactions of C3H6O3 had reached an equilibrium state. The relationship between the saturation S and pH value was calculated by Equations (1)–(8). Figure 3a shows the maximum difference between pH-lgS, and Figure 3b shows the maximum saturation difference curve. In Figure 3, saturation S increased with the increase in pH value, and the nucleation rate of the precursor accelerated. This meant that the grain size decreased with the increase in pH value. When the pH value was 10.9, the difference value of S was the smallest. This indicated that the precipitation rates of Ni2+, Co2+, and Mn2+ tended to be the same value. Thus, the co-precipitation pH values of Ni2+, Co2+, and Mn2+ could be fixed at 10.9.

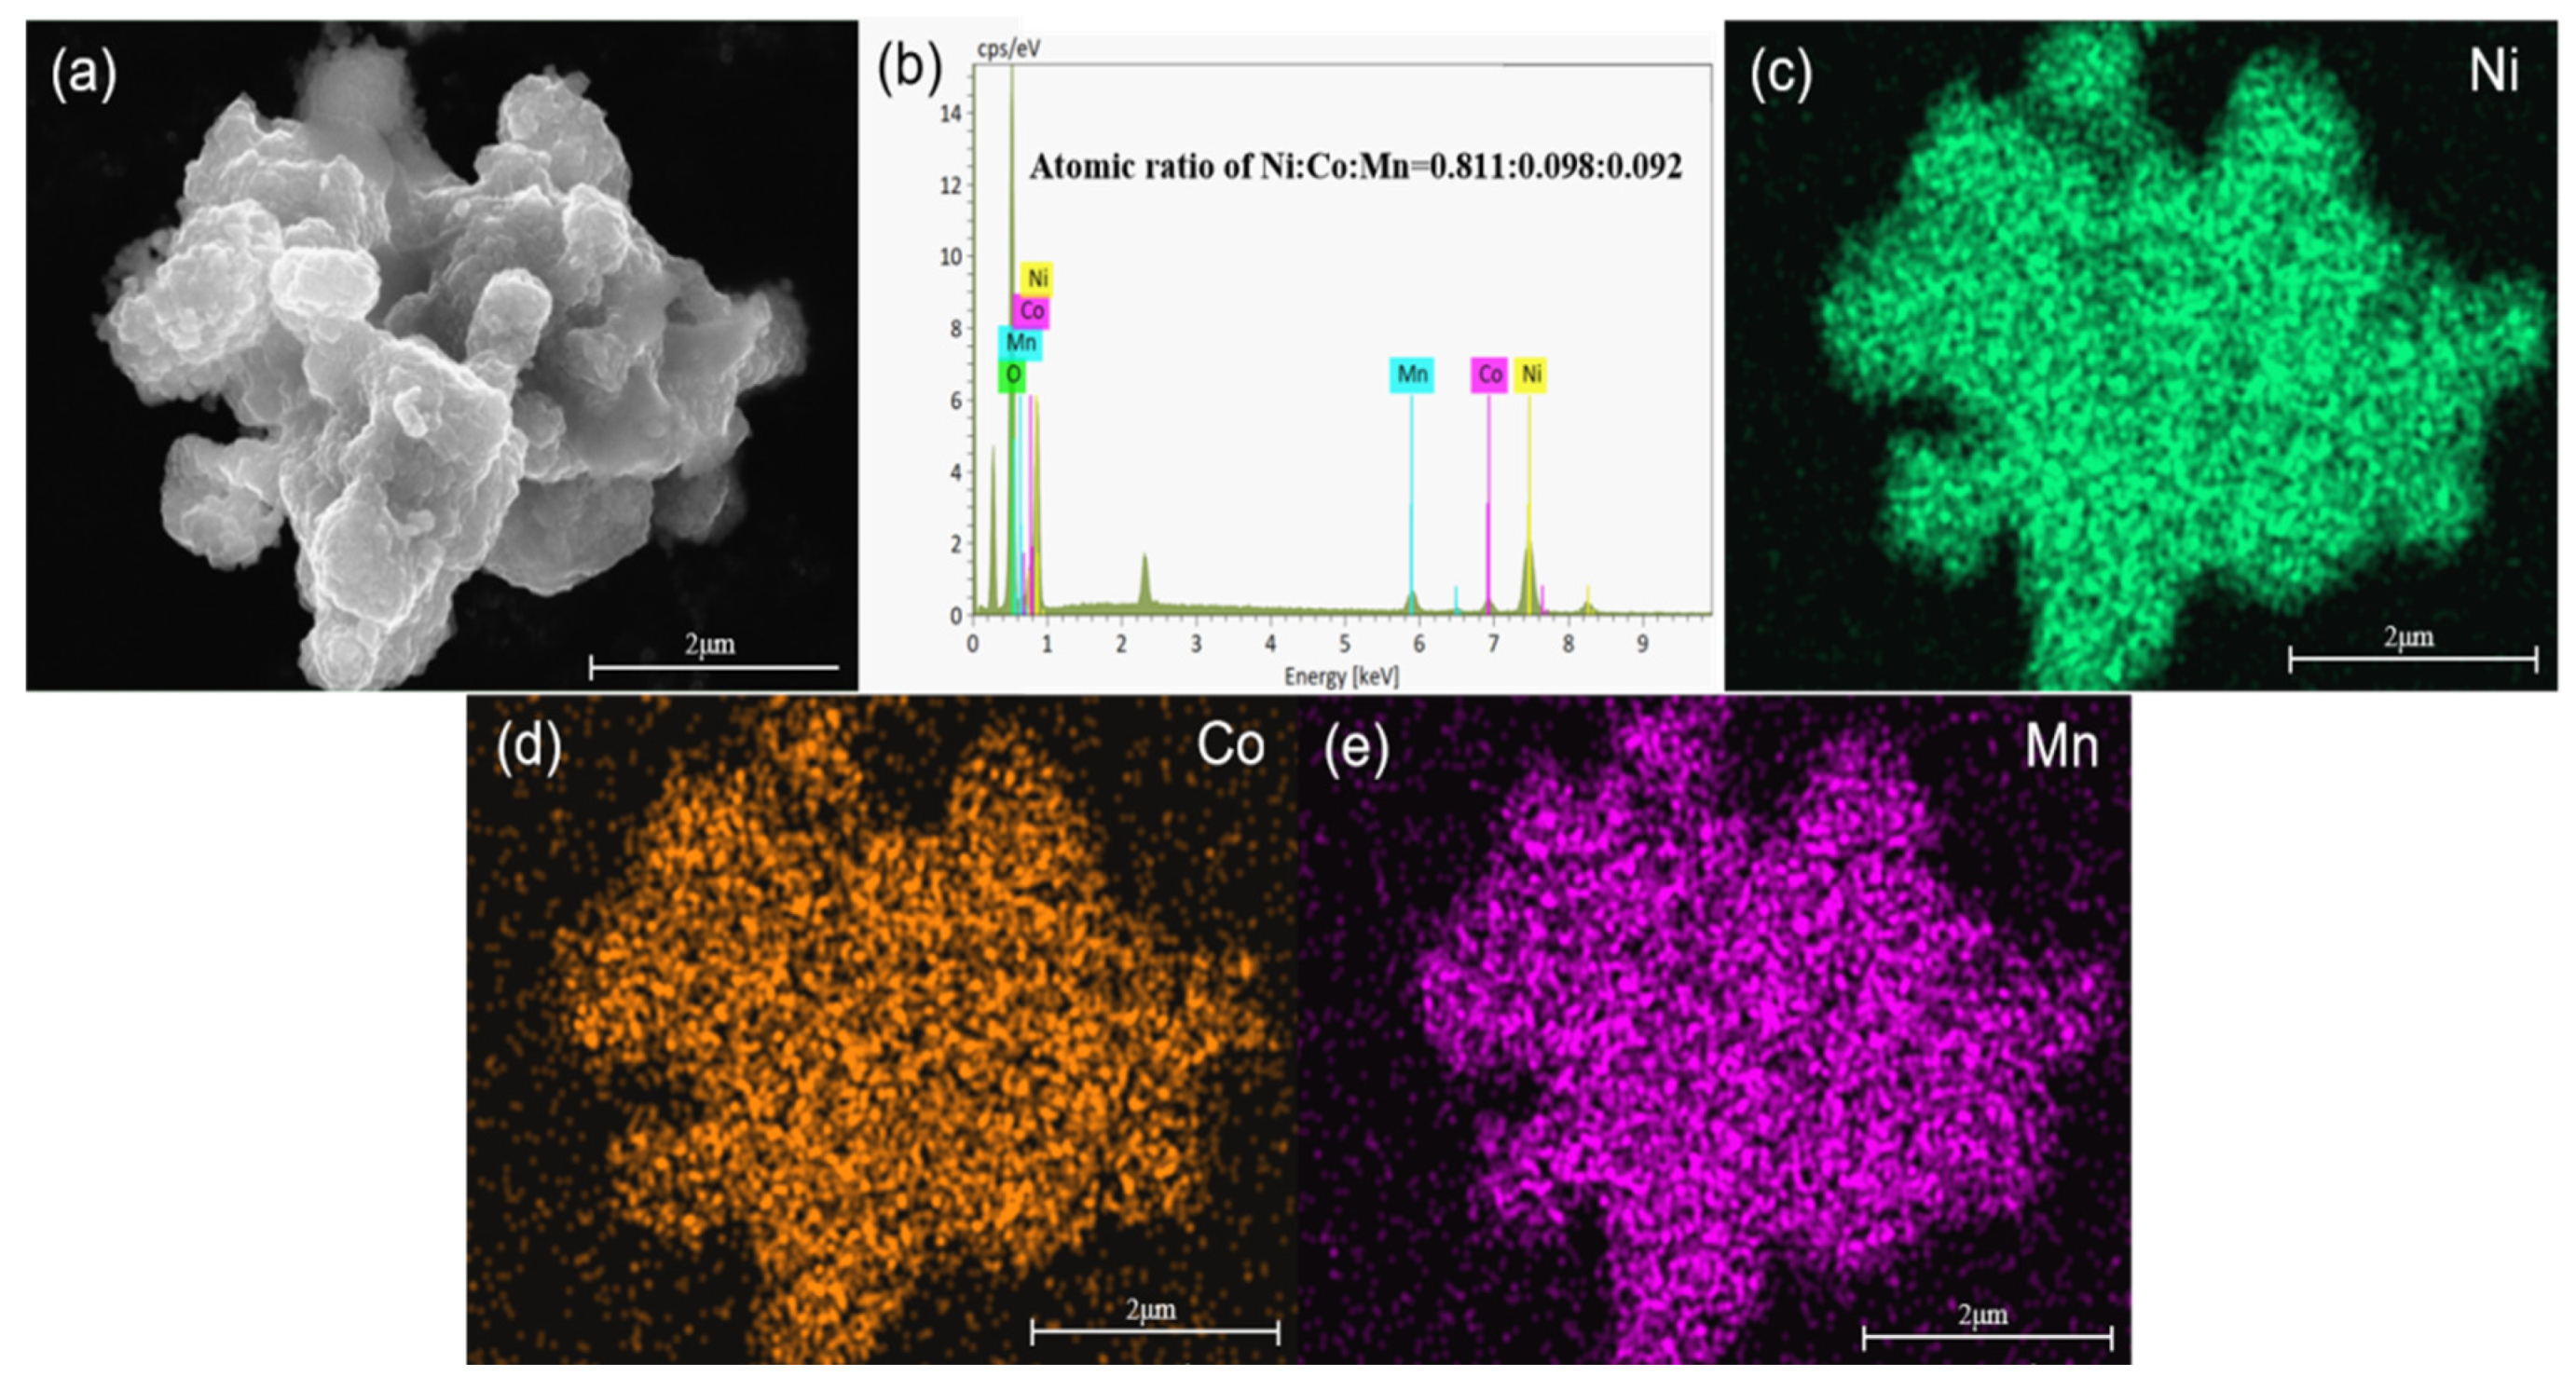
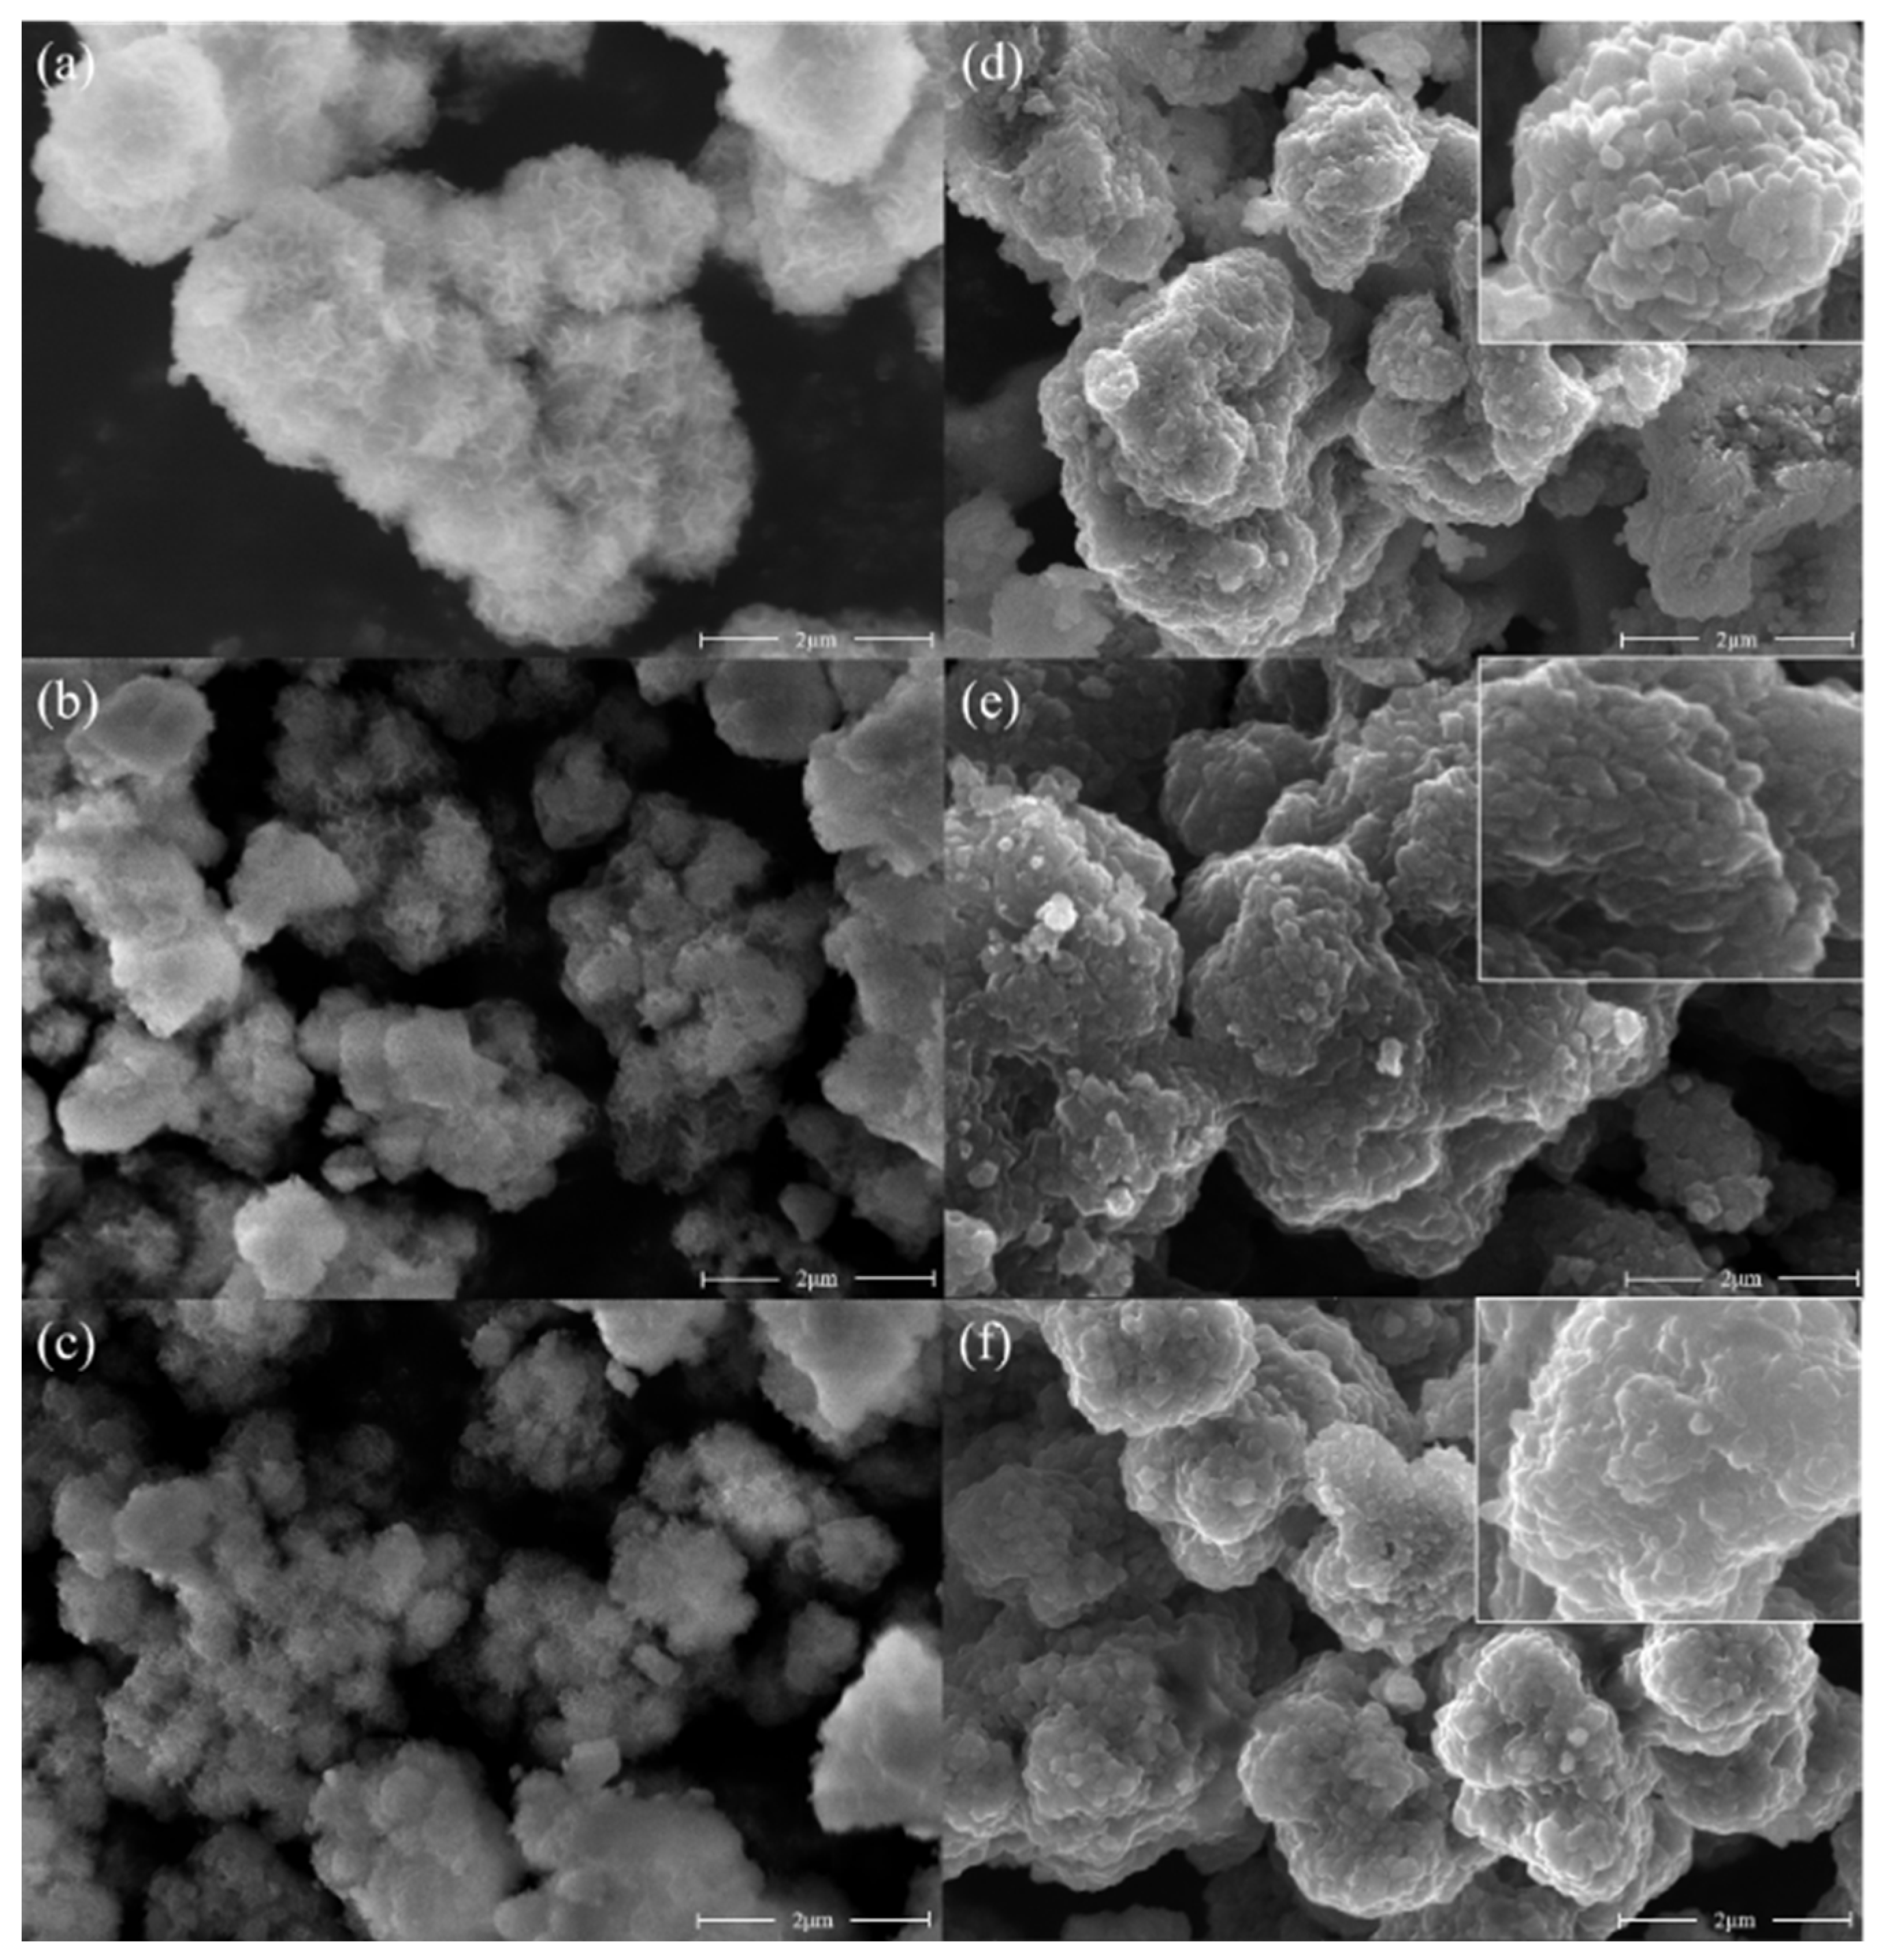
3.2. Analysis of Structure and Surface Morphology of Precursor and Cathode Materials

Figure 4a shows the XRD patterns of the precursors prepared under different conditions. Through the comparison of the characteristic diffraction peaks and corresponding PDF cards, it could be seen that the diffraction angle 2θ of the strongest diffraction peak (003) of Q1 was about 11°, while the 2θ of the strongest diffraction peak (001) of Q4 was about 19°. Since the layer spacing of the α-Ni(OH)2 phase is greater than that of the β-Ni(OH)2 phase [26], the diffraction angle of the strongest diffraction peak of β-Ni(OH)2 shifted to a lower diffraction angle. Meanwhile, comparison with the PDF cards indicated that Q1 had a typical α-Ni(OH)2 structure, which could be labeled as α-Ni0.8Co0.1Mn0.1(OH)2, while Q4 had a typical β-Ni(OH)2 structure, which could be labeled as β-Ni0.8Co0.1Mn0.1(OH)2. The synthesis conditions for Q2 were initially identical to those of Q1. However, after a 2 h reaction, the conditions were adjusted to be the same as those used in the synthesis of Q4. From the XRD patterns, it could be seen that Q2 had a α-Ni(OH)2 structure, which indicated that the prophase reaction had a great influence on the precursor structure. The initial synthesis conditions of Q3 were consistent with those of Q1, and after 2 h of the initial reaction, the regulatory reaction conditions were consistent with those of Q4, and the remaining 100 mL of solution A was added. As can be seen from the XRD, Q3 had a mixture of α-Ni(OH)2 and β-Ni(OH)2 structures. Since the synthesis conditions of Q3 in the early stage were the same as those of Q2, which had a α-Ni(OH)2 structure, it was believed that the nuclei synthesized in Q3 in the early stage also had a α-Ni(OH)2 structure, and the synthesis conditions in the late stage were consistent with those of Q4. The shell was considered to have a β-Ni(OH)2 structure. Formula (9) was used to calculate the content of each phase of the precursor [27]:
I α I β = K α K β × w α w β
where I is the diffraction intensity of characteristic peak, K is the reference intensity ratio (RIR) of the phase in the PDF card, and w is the mass fraction of the phase.
The α-phase contents of Q1, Q2, Q3, and Q4 were calculated to be 97.2%, 94.9%, 73.3%, and 1.3%, respectively. Due to the high content of α-phase, Q1 was considered to be pure α-phase, whereas Q4 was considered to be pure β-phase. The α-phase content of Q3 was about 73.3%, less than the 80% of the added raw material, which was due to the high temperature and pH value later in the process. Part of the α-phase was converted to β structure under high temperature and pH conditions [28]. This was consistent with the reason for the reduction of α-phase content in Q2. Figure 4b displays the XRD patterns of the prepared NCM811 cathode materials. It can be seen that the characteristic diffraction peaks in the diffraction patterns of all samples were obvious, all belonging to the layered α-NaFeO2 structure of the rhombic R-3M space group, and no obvious impurity phase was detected [11].
Table 4 shows the crystallographic parameters of the NCM811 cathode materials after finishing. The maximum c/a value of α-NCM811 was 4.9651, and the c/a value of the samples gradually decreased with the increase in β-phase content, which indicated that the α-phase had larger layer spacing than the β-phase. The lower the value of I(006 + 102)/I(101), the better the order of the hexagonal dense-arrangement structure [29]. Obviously, α-NCM811 showed the worst hexagonal dense structure, with the lowest value of I(003)/I(104), which indicated the highest cationic mixing [30]. The analysis showed that the α-phase had a higher layered structure than the β-phase. Additionally, under high-temperature sintering, the Ni2+ is more likely to migrate to the Li layer, resulting in Li+/Ni2+ mixing. Meanwhile, the β-phase layer spacing was small, the structure was stable, and the degree of mixing was small. The results of XRD analysis showed that β-NCM811 had a lower degree of mixing, better ordered hexagonal dense structure than α-NCM811, and smaller layer spacing. Meanwhile, the core–shell-αβ-NCM811 had the highest value of I(003)/I(104) and higher c/a values among all samples. The results showed that the core–shell structure had the least cation mixing and higher layered structure, which indicated that it had potential for excellent electrochemical performance.
As can be seen from Figure 5, Ni, Co, and Mn were clearly visible and evenly distributed in the selected target region. As shown in Figure 5b, the atomic ratio of Ni:Co:Mn in the cathode electrode material was 0.811:0.098:0.092, which was close to the target composition of 8:1:1. This indicated that sodium lactate was a better complexing agent and exerted a co-precipitation effect. Figure 6 displays SEM images of the precursor and cathode material samples. As can be seen from Figure 6, the morphological characteristics of all cathode electrode material samples indicated an agglomerated mass of irregular shape composed of primary particles, and the morphologies of the sample particles had no obvious changes [31,32].
As can be seen from Figure 6d–f, the primary particles of the cathode material prepared at a low pH value were larger, the size of the primary particles gradually decreased with the increase in pH value, and the grain boundary gradually became blurred. Figure 6a shows that the morphology of the Q1 grain, which was composed of small hexagonal lamellar primary grains with a coarse surface and abundant pore structure. Additionally, the porous structure could increase the contact area with lithium hydroxide and promote contact [33], which was beneficial for uniform embedding and diffusion of Li+ during the high-temperature sintering stage. Thus, the α-NCM811 cathode electrode material had a good layered structure. In Figure 6c, the surface of the Q4 particles was smooth and the surface area was small. In addition, the layered structure of β-NCM811 obtained by high-temperature sintering was poor. This phenomenon could be attributed to the effect of pH on the co-precipitation reaction system. When the pH value was low, the supersaturation of nickel, cobalt, and manganese was also low, which favored the growth of crystal nuclei. As a result, the primary particles tended to be thicker and larger. However, with an increase in pH, there was a continuous increase in saturation, consequently accelerating the nucleation rate of the precursor. This led to a continuous decrease in grain size. This conclusion was verified in Figure 3a. A small abnormality in precursor particle size could be seen in Figure 6b, which was due to the sudden increase in pH during the synthesis of the core–shell precursor, and a small amount of abnormal precipitation of precursor microparticles was observed [25].

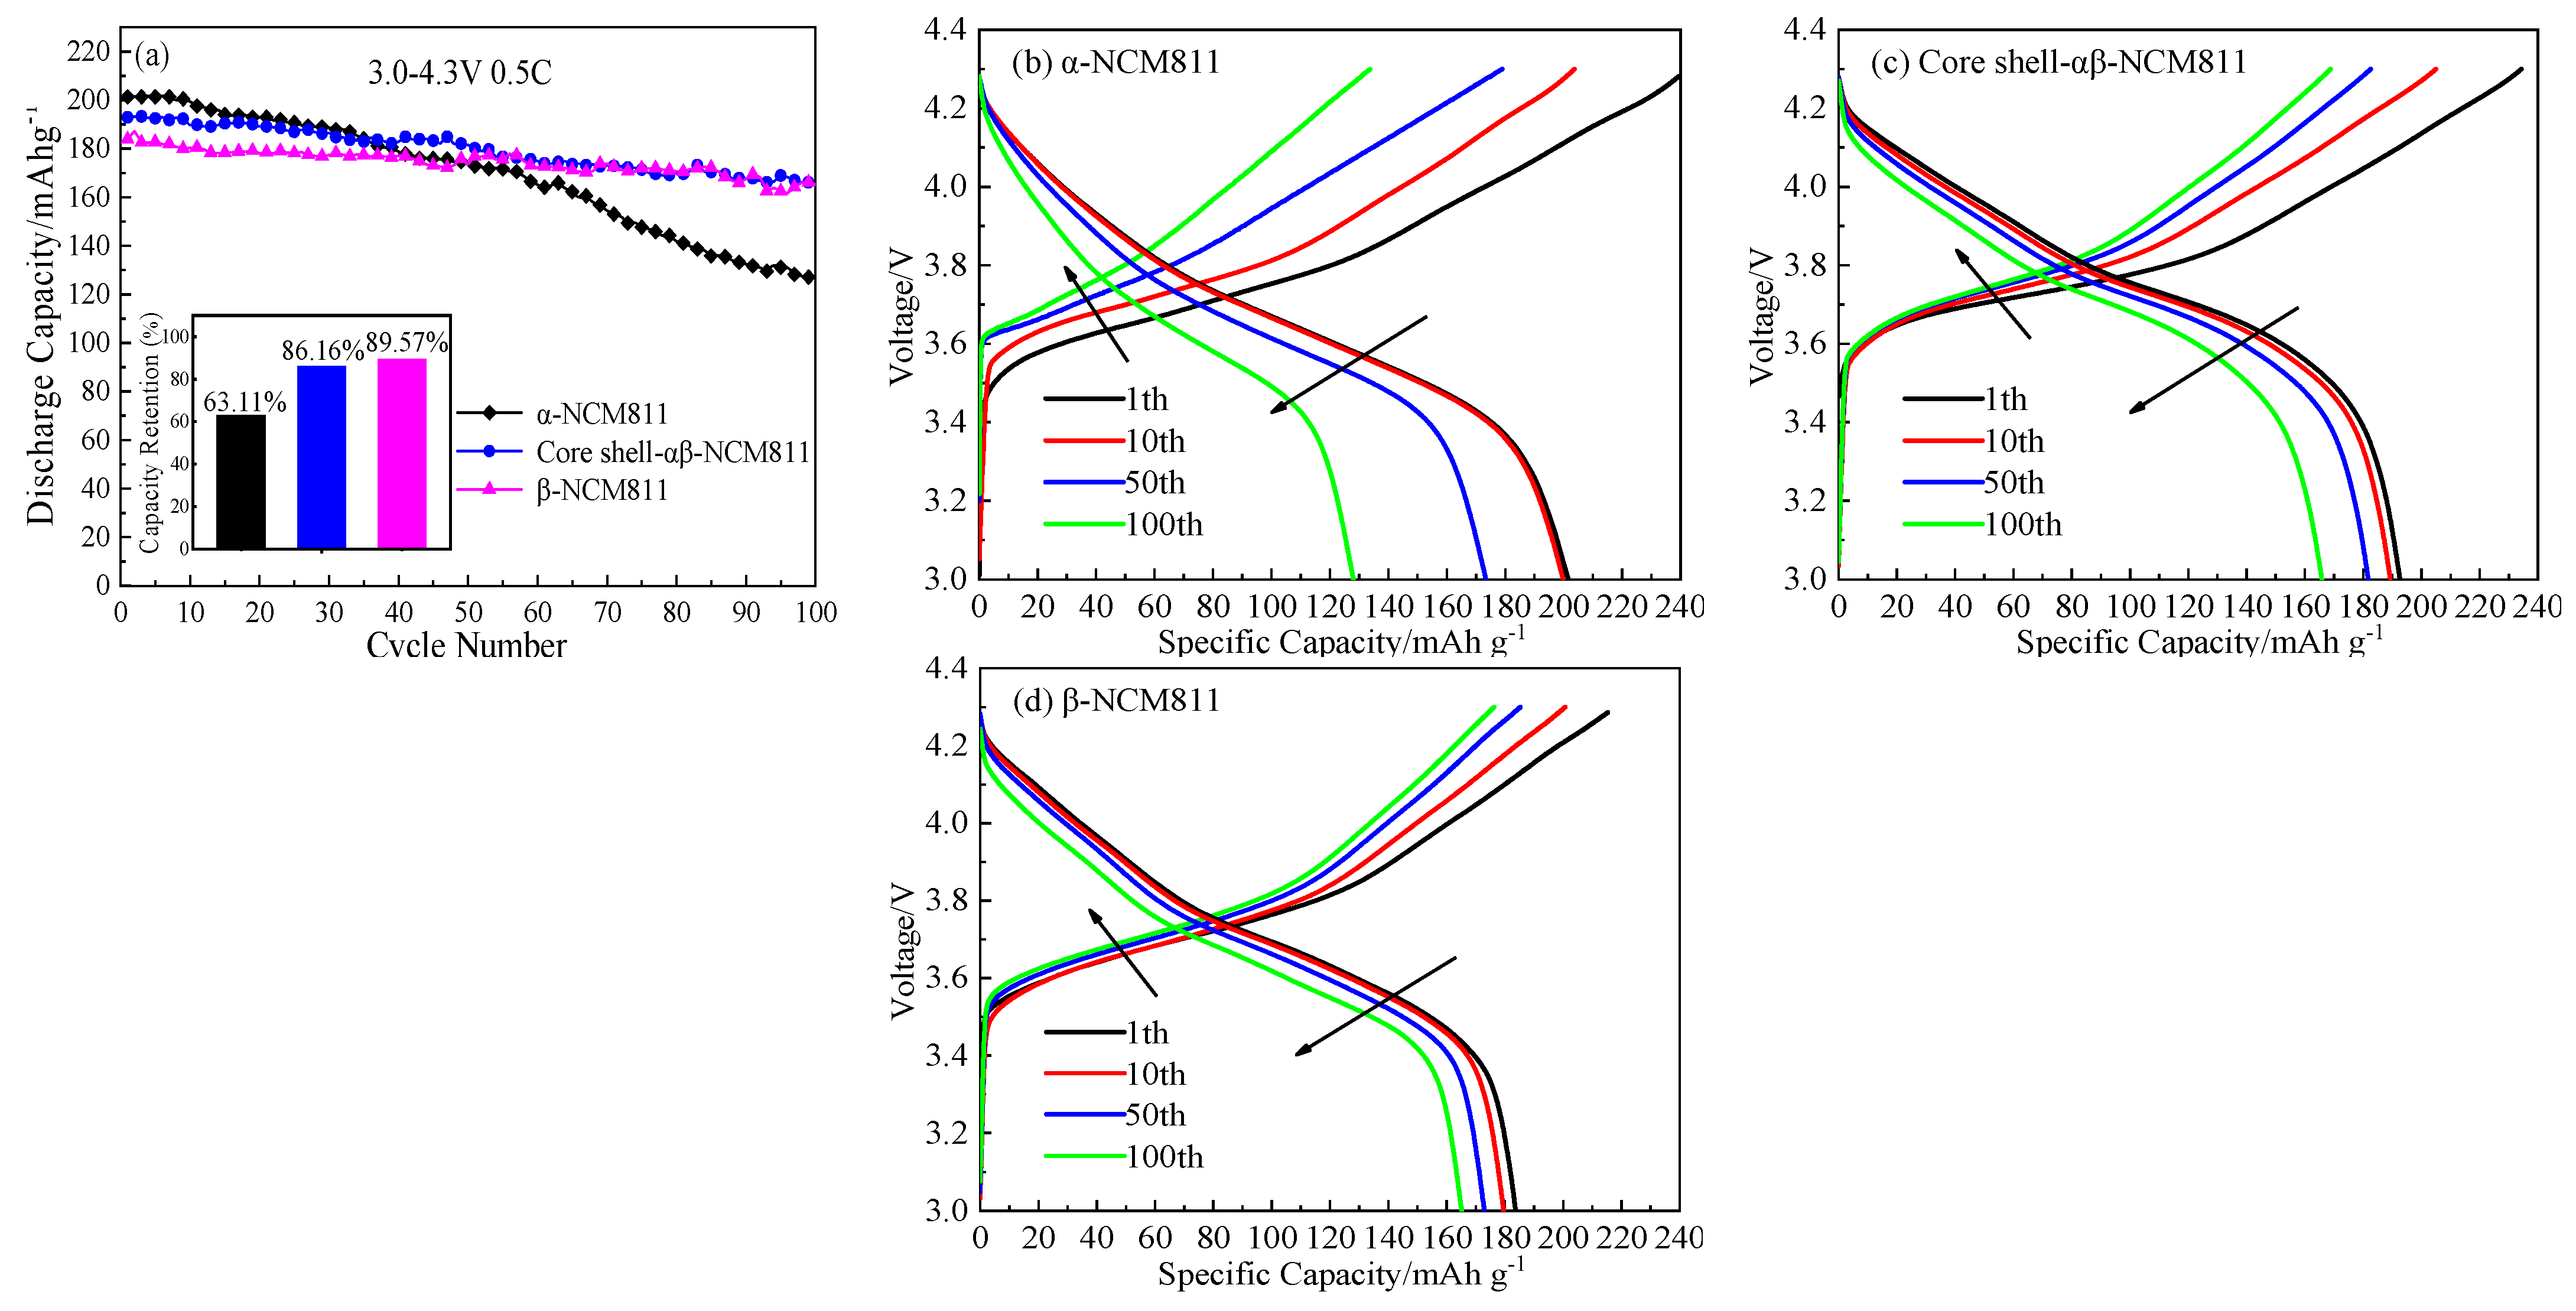
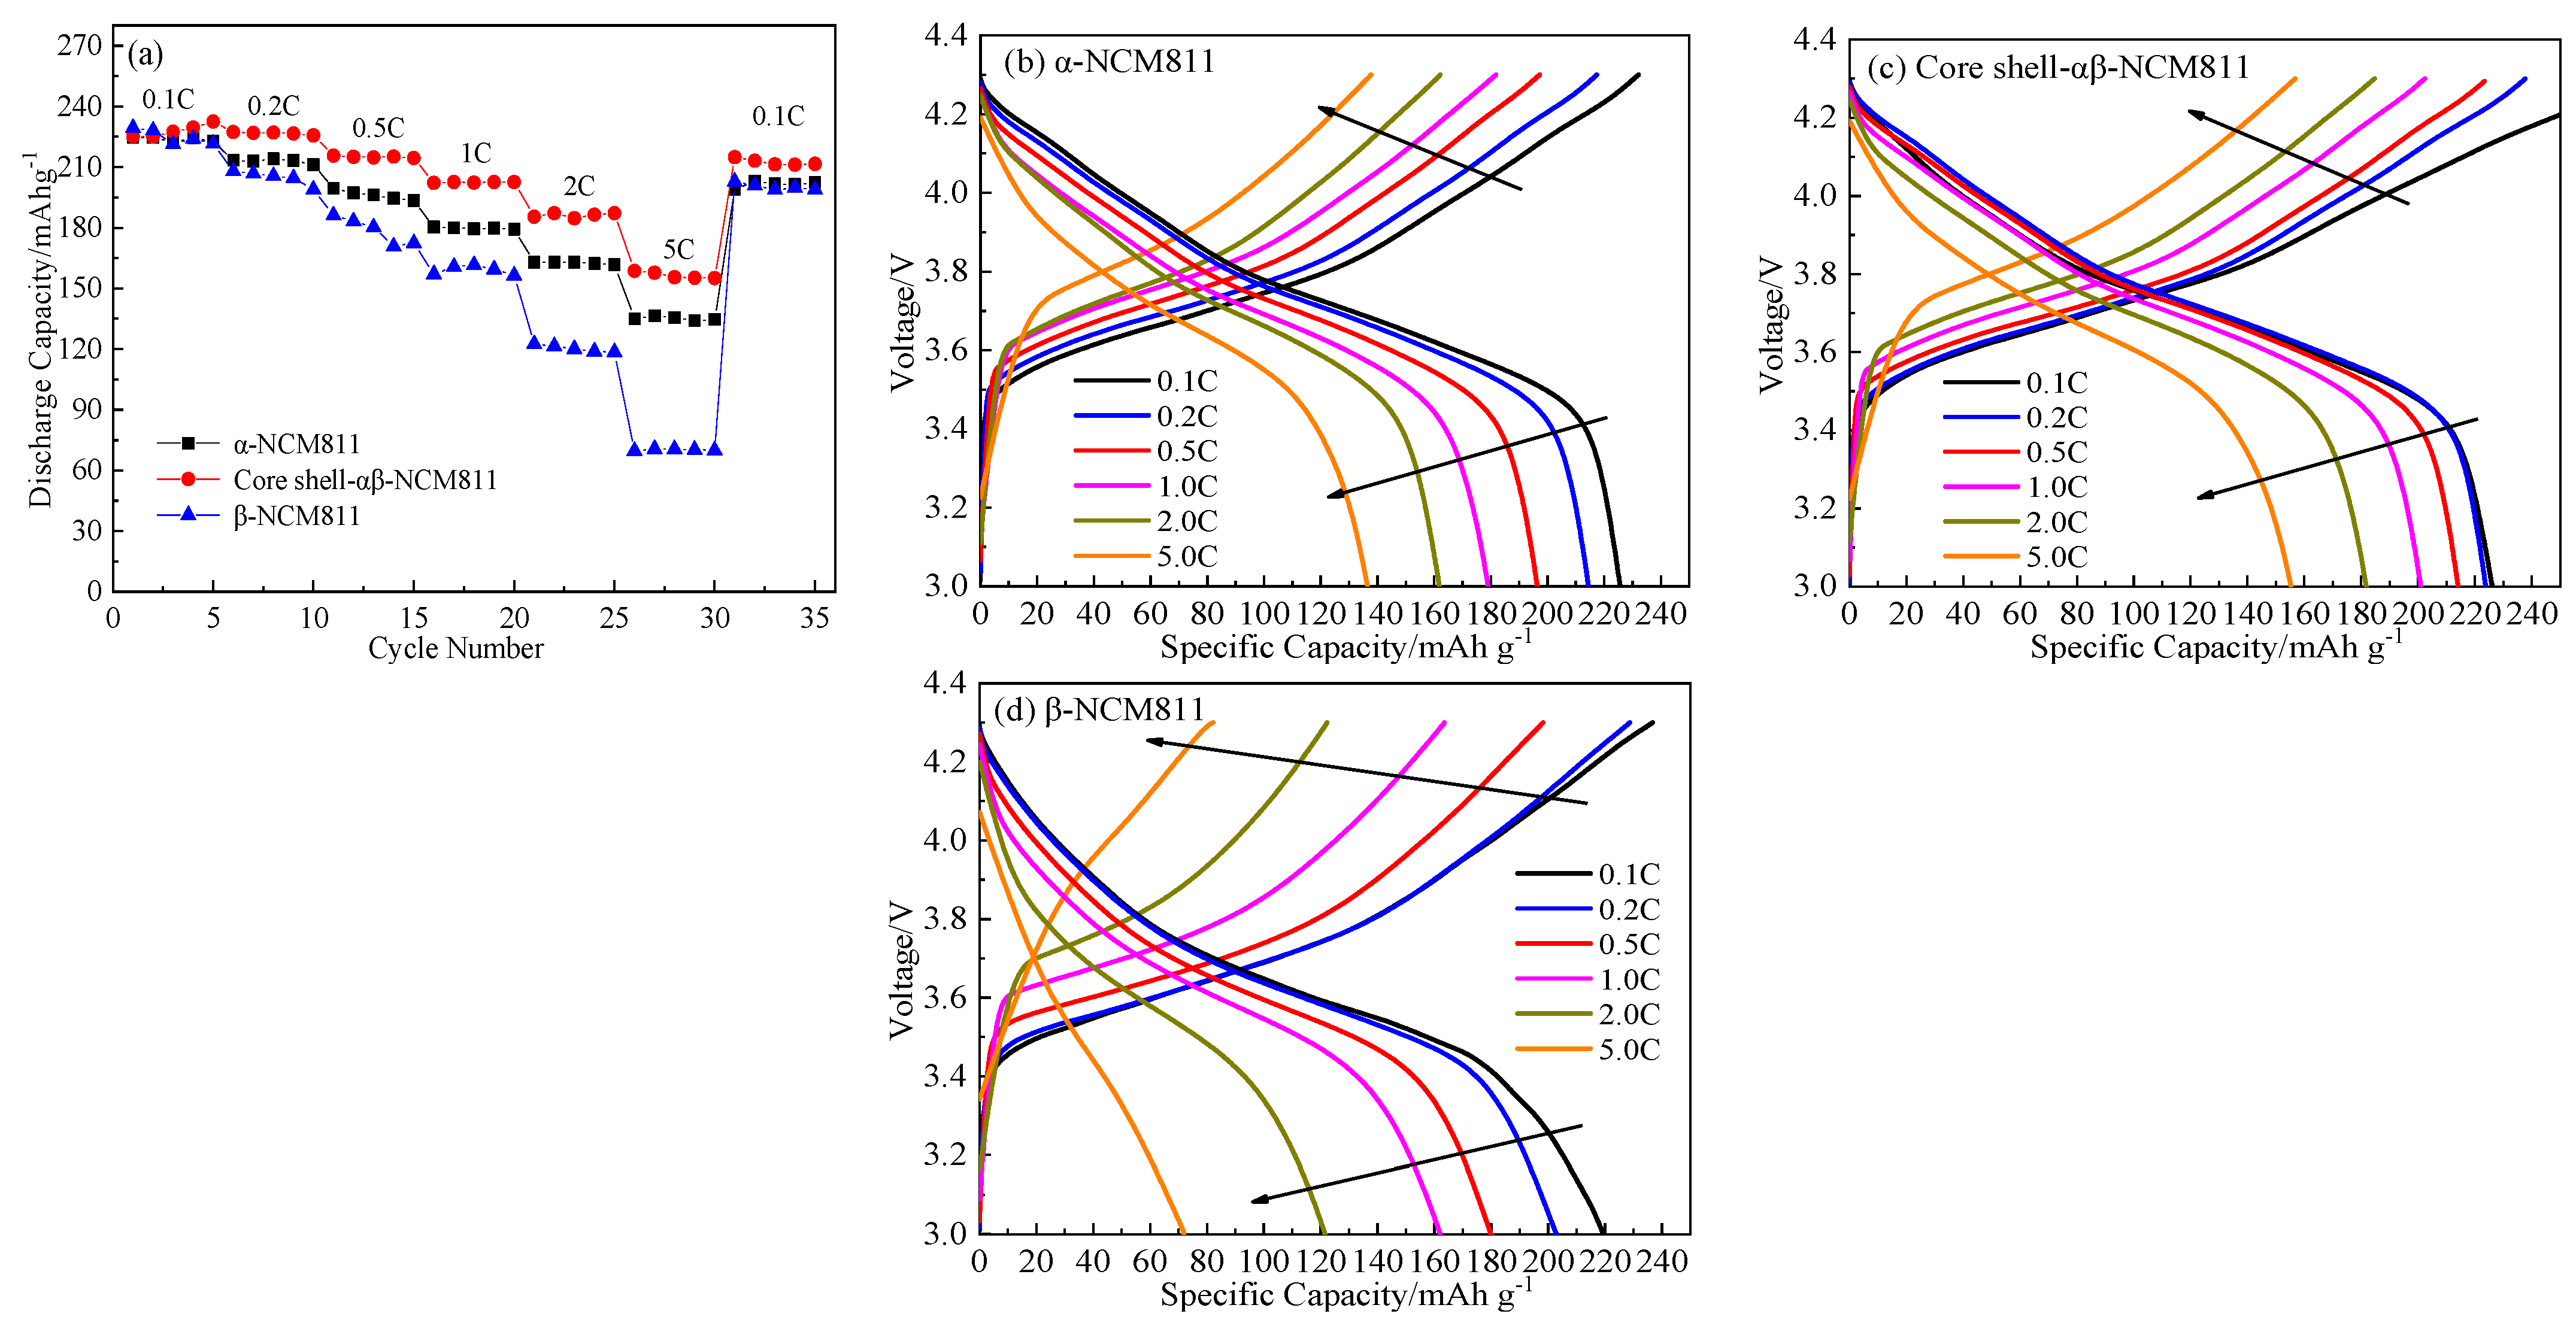
3.3. Electrochemical Properties of LiNi0.8Co0.1Mn0.1O2 Samples

In order to show the effects of different phase structures and core–shell structures on the electrochemical properties of the cathode materials, related electrochemical tests were carried out. Figure 7a shows the cycle curves of cathode electrode materials with different structures at 0.5 C and 3.0–4.3 V. As can be seen from Figure 7a, the α-NCM811 cathode material had the highest initial discharge capacity at 201.4 mAh/g, but the capacity significantly decreased to 127.1 mAh/g after 100 cycles, and the capacity retention rate was only 63.11%. The initial capacities of the core–shell-αβ-NCM811 and β-NCM811 were 192.9 and 183.9 mAh/g, respectively. After 100 cycles, each capacity also decreased to 165.2 and 165.3 mAh/g, respectively. The capacity retention rates were 86.16% and 89.57%, respectively, which were much higher than that of the α-NCM811 cathode material. Compared with the α-NCM811 cathode material, the β-NCM811 cathode material had better cycling performance. This was due to the poor order and structural stability of the α-NCM811 cathode material, which led to rapid capacity decay, whereas the β-phase had small layer spacing, which hindered electrolyte penetration and improved corrosion resistance. At the same time, the particle surface of the cathode material was smooth, which reduced the contact area between the electrolyte and the cathode material, reduced the negative reactions, and improved the capacity retention rate. The core–shell-αβ-NCM811 was designed to combine the advantages of both the α- and β-phase structures. The core contained more α-phase, which enhanced the discharge capacity of the cathode material, while the shell was predominantly composed of β-phase, which acted as a barrier to prevent electrolyte penetration and corrosion of the α-phase core. This resulted in improved cycling performance of the cathode material. Figure 7b–d displays the charge–discharge curves of all samples with different cycling times. It can be seen that the initial capacity of β-NCM811 was the lowest, but the first coulomb efficiency was up to 84.16%, which was greater than that of the α-NCM811 cathode material (79.95%). This was mainly due to the dense particles of β-type hydroxide precursors forming smaller primary grains during high-temperature sintering. The special structure of β-NCM811 shortened the path of Li+ diffusion and thus improved the efficiency of the first discharge [34]. With an increase in the number of cycles, the charge voltage platform moved toward a higher potential and the discharge voltage platform gradually moved toward a lower potential. This trend indicated that the internal resistance of the cathode material was increased and the polarization phenomenon gradually intensified [35].
Figure 8a shows the charge–discharge curves of each cathode material at different magnifications, from 3.0 to 4.3 V. The discharge capacity of all samples decreased very little at 0.1 and 0.2 C. However, with the increase in current density, the capacity of the β-NCM811 cathode material rapidly decreased. The discharge-specific capacity of the β-NCM811 cathode material was the lowest, at about 70.6 mAh/g at 5 C. This was mainly because the small interlayer spacing of the β-NCM811 cathode material impeded Li+ transport at high current densities, which resulted in severe polarization phenomena (Figure 8d). The discharge capacity of α-NCM811 and the core–shell-αβ-NCM811 were 136.5 and 158.7 mAh/g at 5 C, respectively. The superior rate performance of α-NCM811 was mainly attributed to its larger layered structure, which facilitated the transmission of Li+ ions. In addition, it is worth noting that the core–shell-αβ-NCM811 had the highest capacity retention rate of 93.01% when the current density was restored to 0.1 C. As shown in Figure 8b–d, the core–shell-αβ-NCM811 had low polarization and a flat charge–discharge voltage platform. This could be attributed to the large internal layer spacing of the α-NCM811 core structure, which reduced resistance during lithium ion transport and enhanced the high-power discharge performance of the cathode material. Despite the β-NCM811 shell having smaller layer spacing, which may have hindered the transport of lithium ions, this obstruction was limited to the diffusion of lithium ions in the surface layer of the thin shell structure. As is known, the lithium ions are embedded into the cathode material during the discharge process. The structure of the core–shell-αβ-NCM811 material changed to accommodate more lithium ions during the discharge process. Thus, the core–shell-αβ-NCM811 showed higher discharge capacity at high current density. In addition, the β-shell structure with smaller layer spacing and lower surface area prevented the infiltration of electrolyte, providing protection to the α-core structure and improving the stability of the material.
In order to understand in more detail the effect of different microstructures on the electrochemical properties of the cathode materials during the charge–discharge cycle, Figure 9 shows the CV curves of the activation stages of each cathode material. It can be seen that all of the CV scanning curves had three pairs of distinct redox peaks, corresponding to the three phase transitions of H1-M, M-H2, and H2-H3 [36], respectively. The oxidation and reduction peaks of the α-NCM811 sample in the first cycle were 3.856 and 3.690 V, respectively, and the potential difference was 0.166 V, while the potential differences of the core–shell-αβ-NCM811 and β-NCM811 samples were 0.106 and 0.085 V, respectively. This indicated that the α-NCM811 sample had a larger capacity loss and lower coulomb efficiency during the initial SEI film formation, which was consistent with the results of the charge -discharge tests (Figure 7). With the increase in the number of cycles, the oxidation peak positions of all samples gradually moved to low voltage and the reduction peak positions all moved to high voltage. The difference between the two peak positions gradually decreased, and the polarization gradually weakened. The difference between α-NCM811 and the core–shell-αβ-NCM811 was the smallest, which may have been due to the fact that the core–shell-αβ-NCM811 contained more nuclear α-NCM811. As shown in Table 5, the cyclic scanning area of the sample of core–shell-αβ-NCM811 was 2.016 × 10⁻⁴, which was the highest among all samples at the third scanning. The results also corresponded with the charge–discharge test results at 0.1 C. In addition, the core–shell-αβ-NCM811 exhibited a negligible H2-H3 phase transition with a minimal volume change during cycling [37]. This characteristic promoted cathode material stability and significantly enhanced the cycling performance.
Figure 10 shows the impedance maps of all materials after the 5th and 50th cycles at 25 °C. It was clear that all of the curves consisted of two semicircles and a slash. The cross-sectional length of the curves represents the ohmic impedance (R1). The semicircle in the high-frequency region represents the interface film impedance (Rf) of the cathode material. The semicircle in the middle frequency region represents the charge transfer impedance (Rct). Additionally, the low-frequency region is a straight line segment representing the Warburg impedance (W0) of Li+ diffusion in the cathode material [38,39,40]. The impedance data obtained by calculation and fitting are shown in Table 6. The R1 and Rf values of the three samples were relatively small and remained stable during the cycling, which meant that the SEI films formed by the three samples were stable [41]. The Rct and W0 values rapidly increased with the increase in the number of cycles. After 50 cycles, the Rct value of β-NCM811 increased from 92.48 to 188.7 Ω and the Rct value of α-NCM811 also increased from 38.03 to 93.25 Ω. Obviously, the Rct value of β-NCM811 was significantly higher than that of α-NCM811, but the rate of increase was lower. The increase in Rct throughout the cycling indicated the degradation of surface active sites. Therefore, α-NCM811 had high capacity but poor cycling performance during the charge–discharge process, which corresponded with the electrochemical test results. It is worth noting that the Rct of the core–shell-αβ-NCM811 was similar to that of β-NCM811, while the Wo was similar to that of α-NCM811. This was because the core (α-NCM811) and shell (β-NCM811) structures of the core–shell-αβ-NCM811 provided the advantages of two different phases, simultaneously resulting in better cycling and rate performances.
Figure 11a displays the GITT curve measured for the sample of core-shell-αβ-NCM811 after five cycles at 0.1 C. The diffusion coefficient of lithium ions (DLi+) was calculated according to Formula 1:
D Li + = 4 π τ ( m B V m M B S ) 2 ( Δ E S Δ E τ ) 2
where τ, mB, Vm, MB, S, ∆Es, and ∆Eτ denote the pulse duration, mass of active substance, molar volume, molar mass, contact area between cathode electrode material and electrolyte, voltage change due to pulse, and voltage change due to constant current discharge, respectively.
Figure 11b displays the change curves of log (DLi+) at different voltages for all samples. It can be seen that the lithium ion diffusion coefficient of β-NCM811 was the smallest. Compared to the other samples, α-NCM811 and the core-shell-αβ-NCM811 showed higher diffusion coefficients of lithium ions, which indicated that the smaller interlayer spacing of β-NCM811 hindered the transport of lithium ions. The highest DLi+ value of core-shell-αβ-NCM811 was due to its larger interlayer spacing and lower cation mixing, which facilitated lithium ion diffusion [42]. This was consistent with the results of the CV tests.

4. Conclusions

In this study, precursors with different phase structures and unique core–shell structures were prepared by the co-precipitation method, using sodium lactate as a green complexing agent, and the corresponding cathode materials were prepared by sintering lithium at high temperature. The effects of the phase structure and core–shell structure of the precursor on the surface morphology and electrochemical properties of the cathode materials were investigated in detail. The findings are as follows:
(1) The α-NCM811 material had large layer spacing, which was conducive to the diffusion of lithium ions and suitable for high-power charging and discharging. However, the large layer spacing increased ion mixing and structure instability, which was not conducive to cycling performance.
(2) The β-NCM811 material had smaller interlayer spacing, a good layered structure, and low ion mixing, resulting in excellent cycling performance.
(3) The core-shell-αβ-NCM811 material exhibited the best rate performance and highest lithium ion diffusion coefficient, with a discharge capacity of 158.7 mAh/g at 5 C, which was larger than that of α-NCM811 (134.1 mAh/g) and β-NCM811 (69.7 mAh/g). The core–shell-αβ-NCM811 also showed excellent cycling performance, with a retention rate of 86.16% after 100 cycles. This was because more α-NCM811 in the core structure provided higher energy density and rate performance. Meanwhile, the β-NCM811 in the shell structure, with smaller layer spacing, prevented corrosion by the electrolyte, enhanced the stability of the cathode electrode material, and improved the cycling performance of the cathode material.
In summary, the core–shell-αβ-NCM811 inherited the excellent properties of the α-NCM811 and β-NCM811 structures and had better electrochemical properties. In conclusion, the core–shell-αβ-NCM811 cathode material is an excellent option and warrants consideration for high-power and long-life batteries, thereby promoting the large-scale commercial application of NCM811.

Author Contributions

Conceptualization, L.X. and C.B.; methodology, C.T. and J.Z.; software, C.T.; validation, L.X., C.T. and C.B.; investigation, X.L.; data curation, L.X. and C.T.; writing-original draft preparation, L.X. and C.T.; writing-review and editing, L.X. and C.B.; visualization, X.L.; project administration, X.L.; funding acquisition, C.B. All authors have read and agreed to the published version of the manuscript.

Funding

This research was funded by the National Science and Technology Support Plan (No. 2015BAG02B01) and the Liaocheng University Initiation Fund for Doctoral Research (No. 318051906).

Data Availability Statement

The data presented in this study are available to all readers according to “MDPI Research Data Policies”.

Acknowledgments

We thank all scientific staff and crew members for their survey assistance.

Conflicts of Interest

The authors declare no conflict of interest.

References

  1. Feng, Z.; Rajagopalan, R.; Zhang, S.; Sun, D.; Tang, Y.; Ren, Y.; Wang, H. A three in one strategy to achieve zirconium doping, boron doping, and interfacial coating for stable LiNi0.8Co0.1Mn0.1O2 cathode. Adv. Sci. 2021, 8, 2001809. [Google Scholar] [CrossRef] [PubMed]
  2. Zhang, X.H.; Li, Z.; Luo, L.G.; Fan, Y.L.; Du, Z.Y. A review on thermal management of lithium-ion batteries for electric vehicles. Energy 2022, 238, 121652. [Google Scholar] [CrossRef]
  3. Zhang, X.Y.; Liu, X.; Cheng, F.Y.; Wei, P.; Xu, Y.; Sun, S.X.; Lin, H.; Shen, Y.; Li, Q.; Fang, C.; et al. Building a stabilized structure from surface to bulk of Ni-rich cathode for enhanced electrochemical performance. Energy Storage Mater. 2022, 47, 87–97. [Google Scholar] [CrossRef]
  4. Liu, X.; Xu, G.L.; Yin, L.; Hwang, I.; Li, Y.; Lu, L.G.; Xu, W.Q.; Zhang, X.Q.; Chen, Y.B.; Ren, Y.; et al. Probing the thermal-driven structural and chemical degradation of Ni-rich layered cathodes by Co/Mn exchange. J. Am. Chem. Soc. 2020, 142, 19745–19753. [Google Scholar] [CrossRef] [PubMed]
  5. Tian, F.; Ben, L.B.; Yu, H.L.; Ji, H.X.; Zhao, W.W.; Liu, Z.Z.; Monteiro, R.; Rogerio, M.R.; Zhu, Y.M.; Huang, X.J. Understanding high-temperature cycling-induced crack evolution and associated atomic-scale structure in a Ni-rich LiNi0.8Co0.1Mn0.1O2 layered cathode material. Nano Energy 2022, 98, 107222. [Google Scholar] [CrossRef]
  6. Tao, J.L.; Mu, A.N.; Geng, S.J.; Xiao, H.; Zhang, L.T.; Huang, Q.S. Influences of direction and magnitude of Mg2+ doping concentration gradient on the performance of full concentration gradient cathode material. J. Solid State Electrochem. 2021, 25, 1959–1974. [Google Scholar] [CrossRef]
  7. Chu, M.H.; Huang, Z.; Zhang, T.; Wang, R.; Shao, T.; Wang, C.Q.; Zhu, W.M.; He, L.H.; Chen, J.; Zhao, W.G.; et al. Enhancing the electrochemical performance and structural stability of ni-rich layered cathode materials via dual-site doping. ACS Appl. Mater. Interfaces 2021, 13, 19950–19958. [Google Scholar] [CrossRef]
  8. Liu, W.; Li, X.F.; Hao, Y.C.; Sari, H.M.; Qin, J.; Xiao, W.; Wang, X.J.; Yang, H.J.; Li, W.B.; Kou, L.; et al. An ionic conductive interface boosting high performance LiNi0.8Co0.1Mn0.1O2 for lithium ion batteries. ACS Appl. Energy Mater. 2020, 3, 3242–3252. [Google Scholar] [CrossRef]
  9. Kimura, N.; Seki, E.; Tooyama, T.; Nishimura, S. STEM-EELS analysis of improved cycle life of lithium-ion cells with Al2O3-coated LiNi0.8Co0.1Mn0.1O2 cathode active material. J. Alloys Compd. 2021, 869, 159259. [Google Scholar] [CrossRef]
  10. Chen, M.M.; Zhao, E.Y.; Chen, D.F.; Wu, M.M.; Han, S.B.; Huang, Q.Z.; Yang, L.M.; Xiao, X.L.; Hu, Z.B. Decreasing Li/Ni disorder and improving the electrochemical performances of Ni-Rich LiNi0.8Co0.1Mn0.1O2 by Ca doping. Inorg. Chem. 2017, 56, 8355–8362. [Google Scholar] [CrossRef]
  11. Zhang, J.D.; Wu, F.Z.; Dai, X.Y.; Mai, Y.; Gu, Y.J. Enhancing the High-Voltage cycling performance and rate capability of LiNi0.8Co0.1Mn0.1O2 cathode material by codoping with Na and Br. ACS Sustain. Chem. Eng. 2021, 9, 1741–1753. [Google Scholar] [CrossRef]
  12. Li, J.W.; Wang, J.J.; Lu, X.H.; Jiang, H.Y.; Zhang, Q.H.; Wang, B.; Lai, C.Y. Enhancing high-potential stability of Ni-rich LiNi0.8Co0.1Mn0.1O2 cathode with PrF3 coating. Ceram. Int. 2021, 47, 6341–6351. [Google Scholar] [CrossRef]
  13. Wang, H.Y.; Lin, J.; Zhang, X.D.; Wang, L.C.; Yang, J.B.; Fan, E.; Wu, F.; Chen, R.J.; Li, L. Improved electrochemical performance of LiNi0.8Co0.1Mn0.1O2 cathode materials induced by a facile polymer coating for lithium-ion batteries. ACS Appl. Energy Mater. 2021, 4, 6205–6213. [Google Scholar] [CrossRef]
  14. Huang, Y.; Wang, Z.X.; Li, X.H.; Guo, J.X.; Wang, J.X. Synthesis of Ni0.8Co0.1Mn0.1(OH)2 precursor and electrochemical performance of LiNi0.8Co0.1Mn0.1O2 cathode material for lithium batteries. Trans. Nonferrous Met. Soc. China 2015, 25, 2253–2259. [Google Scholar] [CrossRef]
  15. Moon, J.; Jung, J.Y.; Hoang, T.D.; Rhee, D.Y.; Lee, H.B.; Park, M.S.; Yu, J.S. The correlation between particle hardness and cycle performance of layered cathode materials for lithium-ion batteries. J. Power Sources 2021, 486, 229359. [Google Scholar] [CrossRef]
  16. Yao, J.H.; Li, Y.W.; Pan, G.L.; Jin, X.Y.; Luo, K.; Le, S.W. Electrochemical property of hierarchical flower-like α-Ni(OH)2 as an anode material for lithium-ion batteries. Solid State Ion. 2021, 363, 115595. [Google Scholar] [CrossRef]
  17. Qin, R.Y.; Pan, Y.P.; Duan, Z.A.; Su, H.H.; Ren, K.L.; Wang, W.F.; Li, Y.; Xi, N.; Wang, Y.; Zhang, L.; et al. Achieving high stability and rate performance using spherical nickel-zinc layered double hydroxide in alkaline solution. J. Electrochem. Soc. 2021, 168, 70539. [Google Scholar] [CrossRef]
  18. Xu, L.P.; Zhou, F.; Kong, J.Z.; Zhou, H.B.; Zhang, Q.C.; Wang, Q.Z.; Yan, G.Z. Influence of precursor phase on the structure and electrochemical properties of Li(Ni0.6Mn0.2Co0.2)O2 cathode materials. Solid State Ion. 2018, 324, 49–58. [Google Scholar] [CrossRef]
  19. Niu, X.D.; Liang, F.; Shen, Y.B.; Cheng, Y.; Wang, C.L.; Wang, C.L.; Yin, D.M.; Yan, H.Z.; Zou, B.L.; Wang, L.M. Manganese coating α-Ni(OH)2 as high-performance cathode material for Ni-MH battery. Ionics 2022, 28, 1265–1272. [Google Scholar] [CrossRef]
  20. Yao, J.H.; Huang, R.S.; Jiang, J.Q.; Xiao, S.H.; Li, Y.W. Lithium storage performance of α-Ni(OH)2 regulated by partial interlayer anion exchange. Ionics 2021, 27, 1125–1135. [Google Scholar] [CrossRef]
  21. Liang, W.J.; Wang, S.L.; Zhang, Y.X.; Gu, J.; Zhu, K.D.; Zhong, J.; Wang, X.R. β-Ni(OH)2 nanosheets coating on 3D flower-like α-Ni(OH)2 as high-performance electrodes for asymmetric supercapacitor and Ni/MH battery. J. Alloys Compd. 2020, 849, 156616. [Google Scholar] [CrossRef]
  22. Zhou, H.B.; Zhou, F.; Liu, Y.C.; Kong, J.Z.; Jin, C.G.; Xu, X.M. Enhanced electrochemical performances of LiNi0.8Co0.1Mn0.1O2 synthesized using the new green and low cost preparation process. J. Alloys Compd. 2020, 816, 152563. [Google Scholar] [CrossRef]
  23. Dean, J.A. Lange’s Handbook of Chemistry; McGraw-Hill Professional Publishing: New York, NY, USA, 2003; pp. 8.5–8.104. [Google Scholar]
  24. Xu, L.P.; Zhou, F.; Kong, J.Z.; Chen, Z.G.; Chen, K.M. Synthesis of Li(Ni0.6Co0.2Mn0.2)O2 with sodium DL-lactate as an eco-friendly chelating agent and its electrochemical performances for lithium-ion batteries. Ionics 2018, 24, 2261–2273. [Google Scholar] [CrossRef]
  25. Zhang, H.W.; Cen, T.; Tian, Y.H.; Zhang, X.J. Synthesis of high-performance single-crystal LiNi0.8Co0.1Mn0.1O2 cathode materials by controlling solution super-saturation. J. Power Sources 2022, 532, 231037. [Google Scholar] [CrossRef]
  26. Tahmasebi, S.; Jahangiri, S.; Mosey, N.J.; Jerkiewicz, G.; Mark, A.F.; Cheng, S.; Botton, G.A.; Baranton, S.; Coutanceau, C. Remarkably stable nickel hydroxide nanoparticles for miniaturized electrochemical energy storage. ACS Appl. Energy Mater. 2020, 3, 7294–7305. [Google Scholar] [CrossRef]
  27. Chung, F.H. Quantitative interpretation of X-ray diffraction patterns of mixtures. II. Adiabatic principle of X-ray diffraction analysis of mixtures. J. Appl. Crystallogr. 1974, 7, 526–531. [Google Scholar] [CrossRef]
  28. Lei, Y.K.; Ai, J.J.; Yang, S.; Jiang, H.Y.; Lai, C.Y.; Xu, Q.J. Effect of flower-like Ni(OH)2 precursors on Li+/Ni2+ cation mixing and electrochemical performance of nickel-rich layered cathode. J. Alloys Compd. 2019, 797, 421–431. [Google Scholar] [CrossRef]
  29. Yu, J.; Peng, J.X.; Huang, W.L.; Wang, L.J.; Wei, Y.B.; Yang, N.X.; Li, L.B. Inhibition of excessive SEI-forming and improvement of structure stability for LiNi0.8Co0.1Mn0.1O2 by Li2MoO4 coating. Ionics 2021, 27, 2867–2876. [Google Scholar] [CrossRef]
  30. Feng, L.W.; Liu, Y.; Wu, L.; Qin, W.C.; Yang, Z.B. Enhancement on inter-layer stability on Na-doped LiNi0.6Co0.2Mn0.2O2 cathode material. Powder Technol. 2021, 388, 166–175. [Google Scholar] [CrossRef]
  31. Huang, M.Z.; Xu, Z.; Hou, C.; Wang, S.Q.; Zhuang, Y.; Jia, H.L.; Guan, M.Y. Intermediate phase α-β-Ni1-xCox(OH)2/carbon nanofiber hybrid material for high-performance nickel-zinc battery. Electrochim. Acta 2019, 298, 127–133. [Google Scholar] [CrossRef]
  32. Zhang, L.; Qin, R.Y.; Pan, Y.P.; Duan, Z.A.; Li, Y.; Xi, N.; Jian, L.; Han, S.M. Boosting discharge capability of α-Ni(OH)2 by cobalt doping based on robust spherical structure. Int. J. Hydrogen Energy 2022, 47, 1083–1091. [Google Scholar] [CrossRef]
  33. Ding, Y.; Wang, R.; Wang, L.; Cheng, K.L.; Zhao, Z.K.; Mu, D.B.; Wu, B.R. A short review on layered LiNi0.8Co0.1Mn0.1O2 cathode electrode material for lithium-ion batteries. Energy Procedia 2017, 105, 2941–2952. [Google Scholar] [CrossRef]
  34. Li, Q.; Dang, R.B.; Chen, M.M.; Lee, Y.L.; Hu, Z.B.; Xiao, X.L. A synthesis method for long cycle life lithium-ion cathode material: Ni-Rich core-shell LiNi0.8Co0.1Mn0.1O2. ACS Appl. Mater. Interfaces 2018, 10, 17850–17860. [Google Scholar] [CrossRef] [PubMed]
  35. Peng, S.Y.; Kong, X.B.; Li, J.Y.; Zeng, J.; Zhao, J.B. Alleviating the storage instability of LiNi0.8Co0.1Mn0.1O2 cathode materials by surface modification with poly (acrylic acid). ACS Sustain. Chem. Eng. 2021, 9, 7466–7478. [Google Scholar] [CrossRef]
  36. Shin, Y.; Maeng, S.; Chung, Y.; Krumdick, G.K.; Min, S. Core–Multishell-Structured Digital-Gradient cathode materials with enhanced mechanical and electrochemical durability. Small 2021, 17, 2100040. [Google Scholar] [CrossRef]
  37. Sun, Q.; Hu, G.R.; Peng, Z.D.; Cao, Y.B.; Zhu, F.J.; Zhang, Y.J.; Gao, H.C.; Du, K. Achieving a bifunctional conformal coating on nickel-rich cathode LiNi0.8Co0.1Mn0.1O2 with half-cyclized polyacrylonitrile. Electrochim. Acta 2021, 386, 138440. [Google Scholar] [CrossRef]
  38. Liu, W.; Li, X.F.; Hao, Y.C.; Xiong, D.B.; Shan, H.; Wang, J.J.; Xiao, W.; Yang, H.J.; Yang, H.; Kou, L.; et al. Functional Passivation Interface of LiNi0.8Co0.1Mn0.1O2 toward Superior Lithium Storage. Adv. Funct. Mater. 2021, 31, 2008301. [Google Scholar] [CrossRef]
  39. Yu, H.F.; Cao, Y.Q.; Chen, L.; Hu, Y.; Duan, X.Z.; Dai, S.; Li, C.Z.; Jiang, H. Surface enrichment and diffusion enabling gradient-doping and coating of Ni-rich cathode toward Li-ion batteries. Nat. Commun. 2021, 12, 4564. [Google Scholar] [CrossRef]
  40. Guo, Z.X.; Jian, Z.Q.; Zhang, S.; Feng, Y.Y.; Kou, W.Z.; Ji, H.M.; Yang, G. The effect of Ni oxidation state on the crystal structure and electrochemical properties of LiNi0.8Co0.1Mn0.1O2 cathode material for highly reversible lithium storage. J. Alloys Compd. 2021, 882, 160642. [Google Scholar] [CrossRef]
  41. Zhang, H.; Zhang, J. An overview of modification strategies to improve LiNi0.8Co0.1Mn0.1O2 (NCM811) cathode performance for automotive lithium-ion batteries. eTransportation 2021, 7, 100105. [Google Scholar] [CrossRef]
  42. He, W.; Guo, W.B.; Wu, H.L.; Lin, L.; Han, X.; Xie, Q.H.; Liu, P.F.; Zheng, H.F.; Wang, L.S.; Yu, X.Q.; et al. Challenges and recent advances in high capacity Li-Rich cathode materials for high energy density lithium-ion batteries. Adv. Mater. 2021, 33, 2005937. [Google Scholar] [CrossRef] [PubMed]
Figure 1. The phase transition behavior of Ni-rich layered cathode materials [4].
Energies 16 04149 g001
Figure 2. Synthesis of core–shell structure precursors and schematic diagram.
Energies 16 04149 g002
Figure 3. pH-lgS curve of the relationship between saturation S and pH value (a); Maximum saturation difference curve (b).
Energies 16 04149 g003
Figure 4. (a) XRD diagrams of the prepared precursors; (b) XRD patterns of the prepared cathode materials; (c) Q3 peak-fitting graph; (d) Refined image of core–shell-αβ-NCM811.
Energies 16 04149 g004
Figure 5. SEM (a), EDS analyses (b) and element map of Ni (c); Co (d); Mn (e) of core-shell-αβ-NCM811.
Energies 16 04149 g005
Figure 6. SEM images of precursor and cathode material samples. (a) Q1; (b) Q3; (c) Q4; (d) α-NCM811; (e) Core–shell-αβ-NCM811; (f) β-NCM811.
Energies 16 04149 g006
Figure 7. Cycling performance (a) and charge-discharge curves of α-NCM811 (b), core-shell-αβ-NCM811 (c) and β-NCM811 (d) at different cycles.
Energies 16 04149 g007
Figure 8. Rate performance (a) and charge-discharge curves of α-NCM811 (b), core–shell-αβ-NCM811 (c) and β-NCM811 (d) at different C-rates.
Energies 16 04149 g008
Figure 9. CV curves of different cathode material samples. (a) α-NCM811; (b) Core-shell-αβ-NCM811; (c) β-NCM811.
Energies 16 04149 g009
Figure 10. Electrochemical impedance of different NCM811 cathode materials at different cycles (a) 5th and (b) 50th.
Energies 16 04149 g010
Figure 11. GITT curve of core-shell-αβ-NCM811 (a); Li+ diffusion coefficients of all samples (b).
Energies 16 04149 g011
Table 1. The preparation process of the four samples.
NameQ1Q2Q3Q4
Reaction time14 h14 h14 h14 h
Reaction condition 1pH = 10
Temperature 55 °C
Stir for 2 h
pH = 10
Temperature 55 °C
Stir for 2 h
pH = 10
Temperature 55 °C
Stir for 2 h
pH = 11.5
Temperature 65 °C
Stir for 2 h
Intermediate stepNothingAdded 100 mL deionized waterAdded 100 mL metal mixed solutionNothing
Reaction condition 2pH = 10
Temperature 55 °C
Stir for 12 h
pH = 11.5
Temperature 65 °C
Stir for 12 h
pH = 11.5
Temperature 65 °C
Stir for 12 h
pH = 11.5
Temperature 65 °C
Stir for 12 h
Table 2. Equilibrium equations and equilibrium constants at 25 °C [23].
No.ReactionlgKB
1H2O = H+ + OHlgKw = −14.00
2HL = L + H+lgKa = −3.858
3Ni2+ + L = NiL+lgKNL = 2.22
4Ni(OH)2(s) = Ni2+ + 2OHlgKspNi = −15.26
5Ni2+ + OH = Ni(OH)+lgβNi1 = 4.97
6Ni2+ + 2OH = Ni(OH)2lgβNi2 = 8.55
7Ni2+ + 3OH = Ni(OH)3lgβNi3 = 11.33
8Co2+ + L = CoL+lgKCL = 1.90
9Co(OH)2(s) = Co2 + +2OHlgKspCo = −14.23
10Co2+ + OH = Co(OH)+lgβCo1 = 4.3
11Co2+ + 2OH = Co(OH)2lgβCo2 = 8.4
12Co2+ + 3OH = Co(OH)3lgβCo3 = 9.7
13Co2+ + 4OH = Co(OH)42−lgβCo4 = 10.2
14Mn2+ + L = MnL+lgKML = 1.43
15Mn(OH)2(s) = Mn2+ + 2OHlgKspMn = −12.72
16Mn2+ + OH = Mn(OH)+lgβMn1 = 3.9
17Mn2+ + 3OH = Mn(OH)3lgβMn3 = 8.3
Table 3. The precipitation equilibrium constants of Ni2+, Co2+, and Mn2+ before and after adding complexing agent.
Ion NameNi2+Co2+Mn2+
Precipitate equilibrium constant (without sodium lactate)1015.261014.231012.72
Precipitation equilibrium constant (with sodium lactate)108.49107.90108.18
Table 4. Crystallographic parameters of different cathode materials.
Samplesa(Å)c(Å)c/aV(Å3)I(003)/I(104)I(006 + 102)/I101
α-NCM8112.864914.22454.9651101.241.64500.4536
core–shell-αβ-NCM8112.865914.21344.9595100.901.89170.4516
β-NCM8112.874714.22214.9474101.781.85940.4018
Table 5. CV curve scan area values.
SamplesA1A2A3
α-NCM8112.091 × 10−42.013 × 10−42.006 × 10−4
core shell-αβ-NCM8112.051 × 10−42.027 × 10−42.016 × 10−4
β-NCM8111.985 × 10−41.961 × 10−41.958 × 10−4
Table 6. Electrochemical impedance fitting results of different NCM811 cathode materials.
SamplesCycle NumberR1RfRctW0
α-NCM8115th5.049.0238.03319.7
50th5.0210.5393.25439.4
core shell-αβ-NCM8115th4.998.4078.73288.8
50th4.968.63174.90512.4
β-NCM8115th4.938.0492.48470.3
50th5.1210.00188.7562.3
Disclaimer/Publisher’s Note: The statements, opinions and data contained in all publications are solely those of the individual author(s) and contributor(s) and not of MDPI and/or the editor(s). MDPI and/or the editor(s) disclaim responsibility for any injury to people or property resulting from any ideas, methods, instructions or products referred to in the content.

