Article

Decarbonisation of Geographical Islands and the Feasibility of Green Hydrogen Production Using Excess Electricity †

Energy and Environment Division, Paul Scherrer Institut, CH-5232 Villigen, Switzerland
*
Author to whom correspondence should be addressed.
This paper is an extended version of our paper published in the IEEE 2nd International Conference on Energy Transition in the Mediterranean Area (SyNERGY MED), Thessaloniki, Greece, 17–19 October 2022.
Energies 2023, 16(10), 4094; https://doi.org/10.3390/en16104094
Submission received: 28 March 2023 / Revised: 21 April 2023 / Accepted: 12 May 2023 / Published: 15 May 2023
(This article belongs to the Special Issue Energy Transition in the Mediterranean Area)

Abstract

:
Islands face limitations in producing and transporting energy due to their geographical constraints. To address this issue, the ROBINSON project, funded by the EU, aims to create a flexible, self-sufficient, and environmentally friendly energy system that can be used on isolated islands. The feasibility of renewable electrification and heating system decarbonization of Eigerøy in Norway is described in this article. A mixed-integer linear programming framework was used for modelling. The optimization method is designed to be versatile and adaptable to suit individual scenarios, with a flexible and modular formulation that can accommodate boundary conditions specific to each case. Onshore and offshore wind farms and utility-scale photovoltaic (PV) were considered to generate renewable electricity. Each option was found to be feasible under certain conditions. The heating system, composed of a biomass gasifier, a combined heat and power system with a gas boiler as backup unit, was also analyzed. Parameters were identified in which the combination of all three thermal units represented the best system option. In addition, the possibility of green hydrogen production based on the excess electricity from each scenario was evaluated.

1. Introduction

Areas that are remote or isolated can face connectivity issues with other regions, making it difficult to supply energy and goods. This can lead to complications and increased costs in securing essential resources. Furthermore, the local energy supply sector can be negatively impacted, resulting in higher energy prices. In some cases, to ensure that residents have access to affordable energy, the price of electricity is subsidized, as was carried out for certain islands, such as Majorca and Lesvos [1]. In contrast, renewable technologies aim to harness natural energy sources available locally. They are often set up as decentralized energy systems, making them suitable for remote and isolated areas. By utilizing renewables, these regions can increase their energy autonomy and reduce the need for expensive infrastructure to connect with neighboring mainland areas. To start the process of decarbonization, islands must reduce their reliance on fossil fuels and transition towards an energy system based on renewables.
The ROBINSON project [2] seeks to showcase an effective and cost-efficient approach to decarbonizing islands by implementing a suite of renewable technologies. The project focuses on three islands located within the European Union: Eigerøy in Norway, Crete in Greece, and the Western Isles in the United Kingdom. The project roadmap outlines the development of a sustainable and self-sufficient energy system on Eigerøy as the first step. Following this, the solution will be tailored to the specific local conditions on Crete and the Western Isles. The ultimate goal of the project is to demonstrate a viable model that can be replicated in other remote or isolated areas around the world, leading to the widespread adoption of sustainable energy systems and a reduction in carbon emissions.
Different projects similar to the ROBINSON project, with the main objective being to contribute to decarbonizing geographical islands, have been identified, such as SMILE (smart island energy system, 2017–2021) [3], GIFT (geographical islands flexibility, 2019–2023) [4], MESHA (Mayotte replication model of smart energy system, 2020–2024) [5], and REACT (renewable energy for self-sustainable island communities, 2019–2023) [6].
Over the past few years, the research and development community has shown a growing interest in the energy-related issues faced by islands, as well as the potential for transitioning their energy systems. To this end, researchers have explored the energy systems of islands, with a particular emphasis on power systems, using a variety of methodologies and perspectives. The existing literature has predominantly focused on theoretical studies and scenario assessments, examining how the integration of renewable energy sources can increase their share of power generation within these energy systems. H. Dorotic et al. [7], using the EnergyPLAN tool, modeled various scenarios for an island energy system that incorporates 100% intermittent renewable energy sources and 100% smart charge vehicles, including electric marine transportation. The model also integrated the power, heating, cooling, and transport sectors.
A. Flessa et al. [8] used an energy–economy system modeling tool (IntE3-ISL) accompanied by plausible decarbonization scenarios to assess the medium- and long-term impacts of energy transition on the energy system, emissions, economy, and society of the island of Mayotte. The findings of the study suggest that transitioning to clean energy sources requires significant investments in capital and technology. However, as the island increases its reliance on renewable energy sources, the average cost of electricity production is expected to decrease, leading to sustainable economic growth, higher consumption, greater investment, and increased employment opportunities. H. Gils et al. [9] presented a scenario pathway to a 100% RE supply in the Canary Islands by 2050. The Canary Islands depend to a high degree on energy imports. Despite its small surface, the isle has a high potential for renewable energy technologies. To plan for a 100% renewable energy supply in the islands, they used a method called “back-casting” which connected two models—Mesap-PlaNet and REMix. The analysis found that there is enough local renewable technology to fully meet the energy demands of the islands for power, heat, and land transport.
This paper, which is the extended version of our conference paper in the IEEE 2nd International Conference on Energy Transition in the Mediterranean Area (SyNERGY MED) [10], focuses on the techno-economic evaluation of possible renewable energy systems deployable on the island of Eigerøy as a master copy for any other geographical island. The optimization method is designed to be versatile and adaptable to suit individual scenarios, with a flexible and modular formulation that can accommodate boundary conditions specific to each case. Eigerøy is a unique location that combines residential and industrial areas. The main industry on the island is Prima Protein, a company that specializes in producing fish-based proteins. Prima Protein is keen to transition towards a more sustainable production process and is looking to reduce its reliance on fossil fuels, such as LNG and propane. In this context, the ROBINSON project aims to fulfill the electricity and high-temperature heat requirements of the industry as well as the electricity demand of the residential area using renewable technologies. The project will explore various options, including photovoltaic panels, onshore and offshore wind farms, and a combined heat and power (CHP) system. To leverage the potential of the local biomass, the project will investigate the use of a micro-gas turbine as the CHP system, integrated with a biomass gasifier. The ultimate goal of the project is to create a self-sustaining energy system that will serve as a model for other islands and remote areas around the world. The success of this project would demonstrate the feasibility and potential benefits of transitioning towards sustainable energy systems. In addition, the excess electricity is used in a green hydrogen system consisting of an electrolyzer and a battery.
P. Stadler [11] developed a mathematical optimization model for Building Energy Systems (BES), describing energy conversion, storage, and solar-based production technologies for single family houses, apartment blocks, and housing districts in Switzerland. His BES model is complete with dynamic operation of units, a heat cascade to describe the heating system integration, and a market cost evaluation of each technology. The BES model uses weather clustering with typical days and a one-hour time-step. Many technologies used in the built environment could be applied to the islands investigated in this work. Therefore, we have used Stadler’s BES model, modified based on the island criteria, and have performed the optimization. The principle of the mass balance equations and resource grids was used, with a highly simplified heat balance. This article shows the impact of a single renewable technology (solar, wind, biomass) on the current energy supply system, and how stable a given solution is concerning a parametric change, indicating also the most economically feasible solution.

2. Methodology

The energy technologies and local grid for each energy carrier are thoroughly described in the project using energy conversion equations that outline inputs, outputs, and any losses, all on an hourly basis. Additionally, financial parameters are taken into account to ensure that the proposed solutions are economically viable. To minimize the total yearly cost of the system, the project utilizes the mixed-integer linear programming (MILP) optimization technique to solve the resulting set of equations. By optimizing the cost, the project aims to find feasible solutions that are both environmentally friendly and economically sound.

2.1. Eigerøy

Eigerøy is an island located in the Eigersund municipality and is primarily known for its industrial sector. The island has a population of approximately 2500 people, with around 800 houses. The northern part of the island is connected to the mainland by a bridge, which facilitates road transportation. The industrial sector is situated in the harbor area, mainly along the eastern strait. In the coming years, an expansion of the fish industry is expected, which will lead to an increase in energy demand on the island. Hourly electricity consumption data for the entire Eigerøy island in 2021 has been collected, while the high-temperature heat demand for the fish factory (Prima Protein) have been recorded on a daily basis, as illustrated in Figure 1. In order to integrate the daily heat demand into the hourly resolution of the model, the daily data have been distributed uniformly over 24 h. This has been carried out to account for the continuous fish processing that occurs in both day and night shifts. The total annual electricity and heat demand for the island are 74 GWh and 40 GWh, respectively. It is worth noting that the electricity demand is not evenly distributed throughout the year, but rather exhibits a strong seasonality.

2.2. Energy Price

The price of electricity in Norway was relatively low before 2020, at an average of 0.04 EUR/kWh. In 2021, the electricity prices were raised almost by a factor of two, as shown in Figure 2 [12], which can further increase in the upcoming years.
At present, Prima Protein has shifted its focus from using liquified natural gas (LNG) to propane in order to meet its process heat demand. As compared to previous years, the cost of LNG for Prima Protein has increased, with the price for 2022 reaching 0.12 EUR/kWh. In contrast, the cost of propane for Prima Protein is lower, with a price of 0.07 EUR/kWh. This cost-effective alternative has allowed Prima Protein to reduce their expenses and continue their operations without incurring a significant financial burden.

2.3. Natural Resource Availability

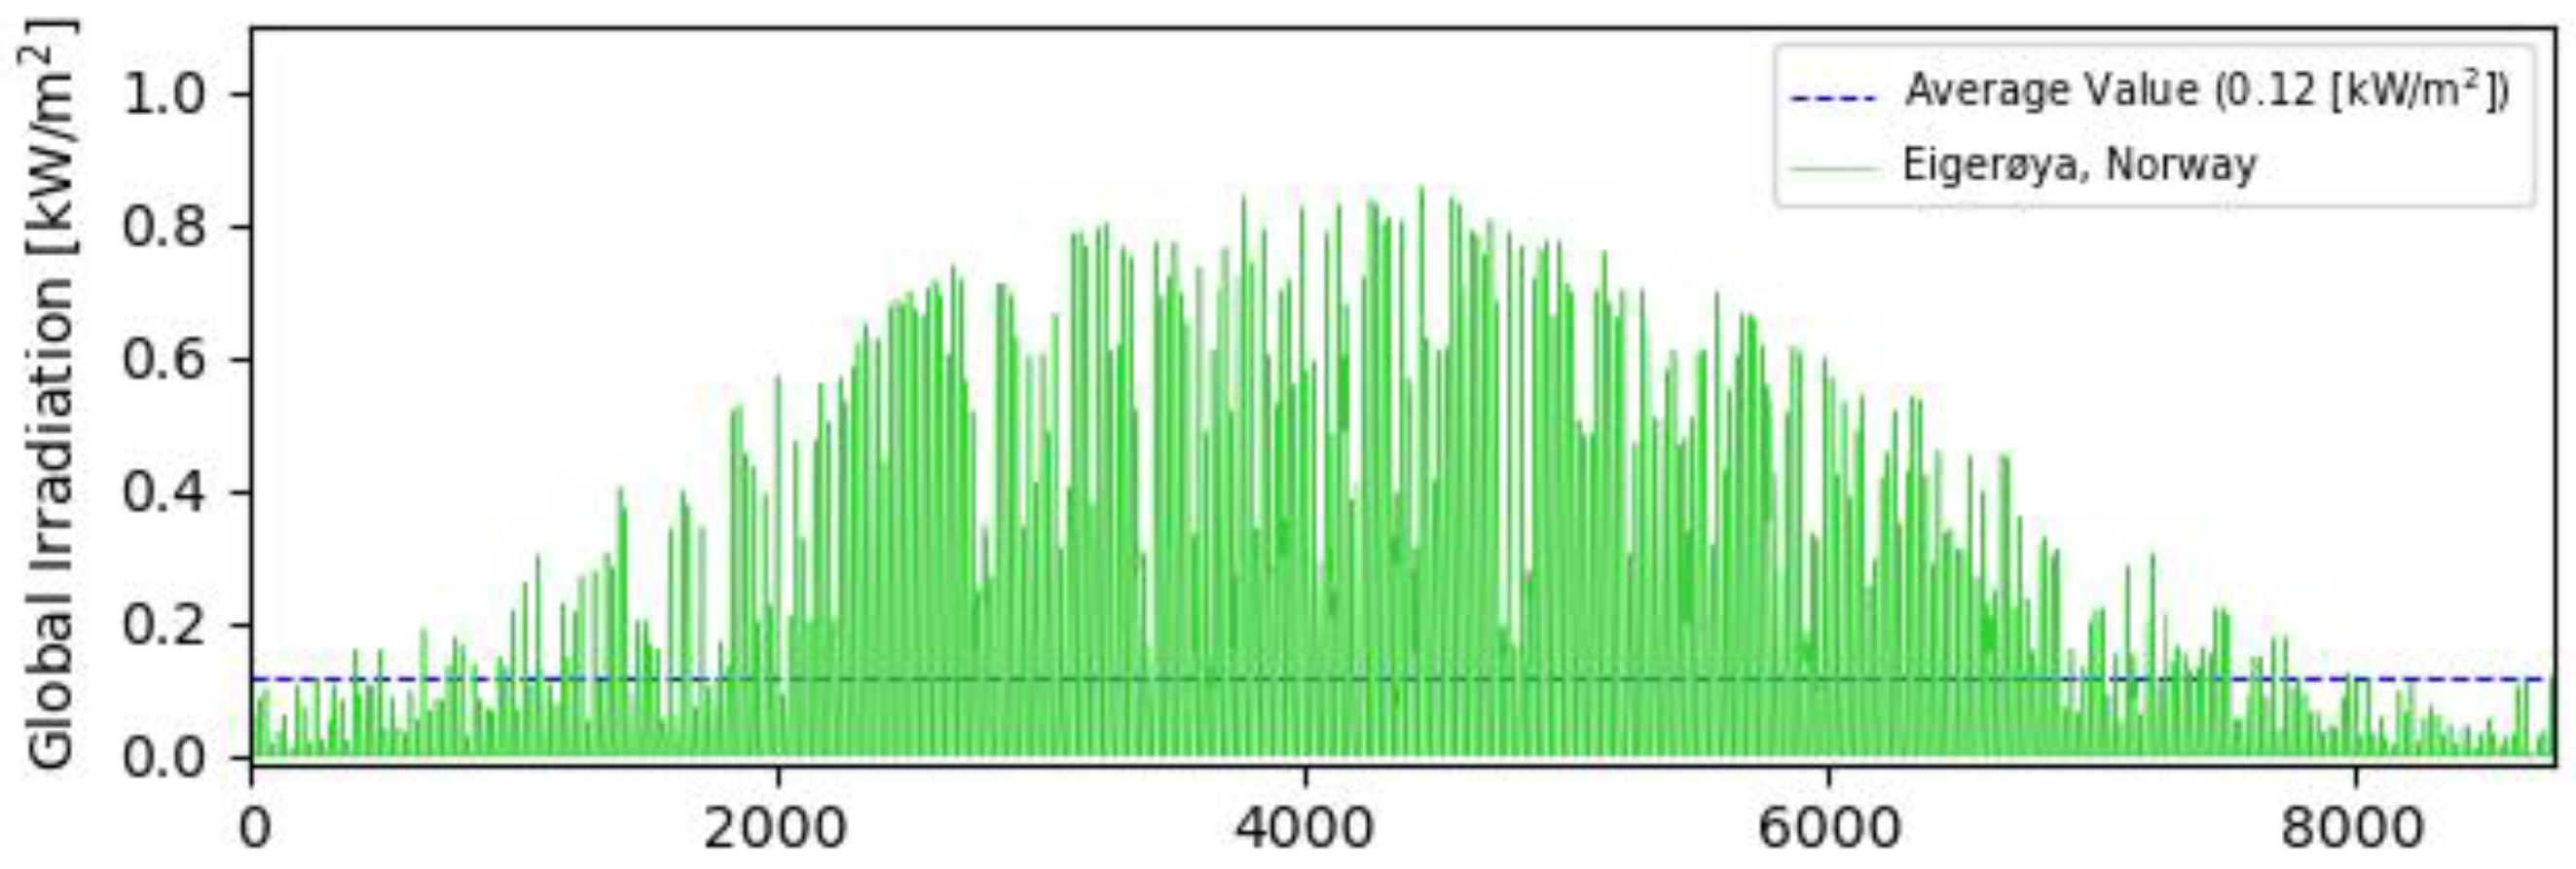
2.3.1. Solar Irradiation

Solar irradiation refers to the electromagnetic radiation that reaches a surface during a specific time period. It is influenced by various factors, such as the angles of the sun’s rays, the latitude and altitude of a location, and the level of atmospheric interference caused by elements, such as clouds, dust, and pollutants. The utilization of solar energy can be critical in fulfilling the energy demands of islands, and this can be achieved through the installation of solar photovoltaic panels on rooftops, carports, or ground-mounted arrays to produce electricity. The global horizontal irradiation (GHI) for Eigerøy can be seen in Figure 3. The mean irradiation power in Eigerøy reaches 0.12 kW/m2, while for Crete (the other evaluated island in the ROBINSON project) the value is almost double, i.e., 0.23 kW/m2. The data were taken from renewables.ninja, a tool for energy source prediction in different parts of the world.

2.3.2. Wind Power

Wind power presents a compelling opportunity for islands to transition towards a sustainable and renewable energy future. Wind power is a cost-effective and environmentally friendly alternative that can significantly reduce carbon emissions and other negative environmental impacts. One of the key advantages of wind power for islands is their unique geographical location and exposure to high wind speeds. Islands are often situated in areas with consistent and strong wind patterns, making them an ideal location for wind turbines to capture the kinetic energy of the wind and convert it into electricity. This makes wind power an attractive option for islands looking to reduce their reliance on imported fossil fuels and establish a more reliable and locally-sourced energy supply. The wind power density in the Eigerøy region is relatively high, creating a potentially advantageous condition for wind farm (WF) installation. We are interested in an evaluation of onshore and offshore wind farms; thus, two sets of data are needed accordingly. The wind speed data are taken from the POWER Project from NASA [13], and are shown in Figure 4.

2.3.3. Biomass Availability

According to estimates, the island has a daily supply of approximately 52 tons of biomass [14]. By utilizing the heating value of wood, which is roughly 3.5 kWh/kg, it is projected that there will be 66 GWh of wood energy that can be utilized for power and heat annually. However, it is important to consider that the use of wood as an energy source comes with a cost. This cost is estimated to be around 5.7 EUR/MWh, and this must be taken into account when considering the feasibility of this energy source on the island.
The ROBINSON project also assesses the potential of biogas as an energy source. Biogas can be blended with syngas and supplied to the CHP system. The projected amount of biogas produced is estimated using an average power production potential of 5 W/person from municipal waste [15], which results in 109 MWh of energy potential for a population of 2500 people annually. Unfortunately, there is a lack of information regarding wastewater from the fish processing industries, and it is not yet factored into the model. As the cost of biogas production is currently negligible in the study, it is regarded as a cost-free resource.

2.3.4. Energy System Modeling

The goal of the model is to satisfy the energy demand with the energy supply system while minimizing the total costs. The resolution of the model is based on an hourly basis, meaning that the energy balances and conversion equations are defined for each hour of the year. Mixed-integer linear programming (MILP) is used in this model. MILP models often use linear constraints; however, they also allow for binary and integer variables. Since the model is optimizing the installed technologies, it has to choose the best option. Binary variables are used for this purpose. The MILP model also allows for the calculation of energy demand and supply for an entire year in a short time (a few minutes). The commercial Gurobi Optimizer [16] is used as the solver.
There are six technologies that define the energy supply system (Figure 5). PV, the off-shore wind farm (offWF), and the onshore wind farm (onWF) generate only electricity; the CHP system generates both electricity and heat, while the gas boiler (GBOI) output only generates heat. A wood gasifier (WG) plays the role of the fuel conversion unit by converting wood into syngas. PVs and WFs use wind and solar irradiation for power production, and CHP and GBOI run on fuels. In our model, the CHP can consume only the available biogas and the syngas produced by the WG, while GBOI consumes only LNG or propane.
The electricity demand, E ˙ i s l a n d , c o n s E L , has to be covered by the power generation units u E L U n i t s E ˙ u , p r o d E L . The EL-Units are PV, on-WF, off-WF, and CHP. Furthermore, the intermittency of the renewables would generate mismatches between the supply and demand: in case of a deficit, electricity can be imported from the grid E ˙ g r i d , i m p E L . The excess electricity, ( E ˙ e x E L ) , is used in a hydrogen production system. The balance of electricity is shown in Equation (1). A condition has to be set so that the E ˙ g r i d , i m p E L has to be zero as soon as E ˙ e x E L is not zero and vice versa. In MILP modeling, this can be achieved by defining a binary helping variable for the variables that should exclude one another, i.e., B g r i d , i m p E L 0,1 and B e x E L 0,1 , as in Equations (2) and (3).
E ˙ g r i d , i m p E L h + u E L U n i t s E ˙ u , p r o d E L ( h ) = E ˙ i s l a n d , c o n s E L h + E ˙ e x E L h , h { h o u r s }
B g r i d , i m p E L h + B e x E L h 1 , h h o u r s
B e x E L h . E ˙ e x E L h = E ˙ e x E L h , h h o u r s
The high-temperature heat demand of Prima Protein, E ˙ P r i m a , c o n s E L , has to be satisfied by the heating units, i.e., the CHP and GBOI, for each hour of the year. The equation is simpler than the electrical grid and does not require defining additional helping variables, and is as follows:
u { C H P , G B O I } E ˙ u , p r o d h e a t ( h ) = E ˙ P r i m a , c o n s h e a t h , h { h o u r s }

2.3.5. Economic Variables

P. Stadler’s work [11] formalized the economic evaluation for the proposed energy system by connecting the deployment of technologies and fueling costs with the physical sizes of the systems and their respective fuel consumption rates. The objective of the model is to minimize the annual total expenditures (TOTEX) [EUR/year], which is a combination of the annualized capital expenditures (CAPEX) and the annual operational expenditures (OPEX) (Equation (5)). This approach considers the lifetime of the systems and spreads out the capital expenditures over their useful life. The model also takes into account the discount rate, which reflects the time value of money, and the inflation rate, which reflects the increase in costs over time. The optimization of TOTEX is performed using a MILP algorithm that ensures the fulfillment of the energy demands, as well as technical and operational constraints. The resulting solution provides a set of optimal system configurations, their associated costs, and the corresponding energy flows.
T O T E X = O P E X + C A P E X
Generally, upfront payment of capital expenditures necessitates a loan with an annual repayment system. Furthermore, each loan is subjected to the weighted average cost of capital (WACC), which is a more comprehensive expression for the interest rate. This condition requires us to consider the annualized capital expenditures, i.e., CAPEX from Equation (6). However, the CAPEX of the entire energy system is a sum over the single annualized capital expenditures of the technologies, or CAPEXu.
C A P E X = u E s y s t e m C A P E X u
The lifetime of the technology τ u should define the maximum period within which the debt can be repaid with a low risk of default. The lifetime and weighted average cost of capital (WACC) are accounted for in the unit annualization parameter a u . With a defined a u , the size specific capital costs CAPEX size (EUR/kW) and the installed size capacity of the unit Su, the unit annualized capital expenditure becomes Equation (8). On the other hand, the OPEX accounts for the fueling and imported electricity costs, as well as for maintenance expenditure (Equation (9)).
a u = W A C C u ( 1 + W A C C u ) τ u ( 1 + W A C C u ) τ u 1
C A P E X u = a u . C A P E X u s i z e . S u
O P E X = u E l , w o o d , L N G O P E X r + u E s y s t e m O P E X u m C A P E X u a u
The operational maintenance expenditure for the units’ O P E X u m is expressed as a percentage of total unit capital expenditure. Having the hourly data for the electricity price P g r i d , i m p u E L ( h ) , the total expenditure on electricity is defined as follows:
O P E X E L = h h o u r s P g r i d , i m p u E L h . E ˙ g r i d , i m p E L h

2.3.6. Green Hydrogen Production

The power supply fluctuations of renewable energy systems arise due to the unpredictable nature of the related weather condition, such as solar irradiation or wind speed, which generate mismatches between the supply and demand. Thus, integration of a hydrogen production system offers a good solution to utilize the excess electricity to produce green hydrogen. The produced hydrogen can be stored in tanks for transportation purpose. A proton exchange membrane (PEM) electrolyzer (H-EL) and a battery (BAT) system are introduced to the model for this purpose.
E ˙ e x c e s s E L h = E ˙ B A T E L h + E ˙ E l e c t r o l y s i s E L h   h h o u r s
The model considers that the hourly excess electricity from the PV and/or wind will be used to operate the PEM electrolyzer. The electrolyzer is sized based on the maximum hourly excess electricity. The battery system is introduced to peak shave the excess electricity and reduce the required capacity of the electrolyzer, thereby lowering the cost of hydrogen production. The objective of the model is to minimize the total expenditures of the hydrogen production system. The model parameters for these units are listed in the Table 1.
To simplify the battery, it is assumed that there are no losses and the state of charge (SOC) is described in the Equation (12). The maximal SOC defines the capacity of the battery.
E B a t , S O C E L h + 1 = E B a t , S O C E L h + t 1 h . E ˙ e x c e s s E L h

3. Scenario Definition

This section focuses on studying the electric system of Eigerøy, analyzing the feasibility of using standalone or combined technological solutions, such as PV, offWF, and onWF. A sensitivity analysis is conducted to determine the conditions under which renewable energy sources become more competitive. For single technology scenarios, four parameters are investigated: the potential of the natural resource, TOTEX, WACC, and electricity price (EL-Price).
  • Scenario Zero represents the current situation of the island, where electricity is imported from the mainland, and a gas boiler, operated on LNG, provides the high-temperature heat demand of the factory. This scenario serves as the reference point.
  • Scenario A evaluates the potential of installing PV in the energy system. Calculations are conducted initially based on reference values (based on literature reviews), followed by sensitivity analysis around these values.
  • Scenario B investigates the role of onWF and offWF. Similar to Scenario A, the role of onshore and off-shore wind farms, individually, at the reference values for the mentioned parameters, are evaluated.
  • Scenario C investigates a combination of PV and WFs. In this scenario, the model takes both PV and WFs (on- and off-shore) into account and provides the optimal economic solution.
  • Scenario D investigates the role of biomass in the decarbonization of the CHP operation.
The excess electricity from the renewable sources is fed into an electrolyzer to produce H2, to be sold in the transportation market or fed into the CHP system (not discussed here).

4. Results and Discussion

4.1. Scenario Zero—Current Situation

The current situation on the island involves complete electric power dependency on the mainland, along with a GBOI that covers the heat demand of Prima Protein. The scenario uses the electricity prices profile of 2021 and the LNG price. The total yearly expenditure is estimated to be 9.05 MEUR/y. The installed capacity corresponds to the maximal heat demand peak of about 18,300 kW. The electric energy supply from the mainland grid follows the same pattern as the energy demand in Figure 1.

4.2. Scenario A—The Role of PV

The sensitivity analysis for PV is performed by varying four parameters: GHI, CAPEX and OPEX, electricity price, and WACC. The outcomes, which are depicted in Figure 6, exhibit distinct behaviors with respect to the variation in these parameters. The total expenditure (TOTEX) presents a gradual change with parameter changes, while the installation of PV capacity is contingent on certain thresholds being met, beyond which the PV capacity expands rapidly. The TOTEX responds to changes in WACC, CAPEX, and GHI only after a certain level of PV capacity has been installed. The impact of electricity price on TOTEX is significant, following a linear trend with a marginally reduced slope (compared to the reference Scenario Zero) once some PV capacity has been deployed. This diminished slope indicates a lower cost of electricity generated from the local PV installed compared to electricity costs supplied by the electric grid. The maximum PV capacity limit for Eigerøy has been set at 20 MW, as this corresponds to the island’s peak electric power demand.
The analysis of the sensitivity of PV installations reveals that the capacity increases as the GHI intensity rises, peaking at approximately 80% and then remaining stable at 10 MW. The variation in the WACC and CAPEX and OPEX are only examined in a decreasing direction, since lower values of these parameters would decrease the relative cost of electricity generated by PVs, making local PV electricity more competitive than electricity supplied by the mainland’s power grid. This analysis shows that local PV becomes an attractive solution with only small changes in the boundary conditions. Specifically, an increase of 15% in electricity price, a decrease of 10% in capital costs, or a 15% increase in GHI would make the business case for PV installations economically viable. These results suggest that investing in PV installations can be a cost-effective strategy for meeting Eigerøy’s energy needs, especially if there are favorable conditions for PV production.

4.3. Scenario B—The Role of onWF and offWF

Results for installed capacity and TOTEX for onWF and offWF are shown in Figure 7. The sensitivity analysis conducted for onWF and offWF exhibits behavior similar to that of PV installations, as previously discussed. However, wind farms have an even greater impact on TOTEX than PV installations, as evidenced by the difference in TOTEX compared to the reference Scenario Zero with increasing EL-Price. The recommended capacity for installation increases linearly from the breaking point to the top floor capacity of 20 MW in a gentler manner than PV. This means that with less installed capacity, it is possible to compensate for the more expensive electricity, resulting in a higher total capacity factor for onWF than for PV. The WACC and CAPEX and OPEX variation are only explored in a decreasing direction, as lowering these parameters reduces the relative cost of electricity produced by wind farms, making local wind electricity competitive against electricity supplied via the mainland’s power grid.
Table 2 summarizes the different thresholds for positive business cases for both onWF and offWF. As previously demonstrated with PV installations, slight adjustments in boundary conditions can significantly impact the economic viability of a project. For instance, a 5% increase in wind speed can be achieved by adjusting the hub height, thereby increasing the power output and improving the profitability of the wind farm. While offshore wind farms are exposed to higher average wind speeds, their CAPEX is more than double compared to onshore wind farms, making them (marginally) less financially attractive. Nevertheless, the total capacity factor for offshore wind farms remains higher compared to onshore wind farms, indicating that they can generate more power for a given capacity.

4.4. Scenario C—Combination of PV and onWF

The analysis of individual technology scenarios reveals that the parameters with the most significant influence are CAPEX and EL-Price. The impact of EL-Price is particularly evident in the evolution of TOTEX and plays a crucial role in determining the optimal technology size. When considering a combination of technologies, the sensitivity analysis is performed exclusively along the EL-Price dimension. Various discrete sets of CAPEX values for the technologies involved are used in the analysis, with a range of ±20% of TOTEX. This approach allows us to determine the impact of different EL-Price values on the combination of technologies with varying capital expenditures. By exploring the relationship between these parameters, we can identify the most cost-effective and efficient technology mix for the given boundary conditions. The impact of CAPEX on the installation capacity of a specific technology can be observed in Figure 8. The figure shows how the installation capacity of a given technology is affected at different rates by an increase in the EL-price, starting from a specific CAPEX. What is interesting to note is that, at some point, even if a technology appears as a standalone solution at a specific EL-price, with further increments in the price, other technologies also become viable. Based on these findings, it is clear that the consideration of both technologies would lead to a cheaper solution (minimum TOTEX) than would be the case for a standalone solution. One of the reasons for this is the seasonality effect. Wind speeds tend to be higher in the winter months than in the summer months, resulting in more electricity generation from wind turbines during the winter and less during the summer. Conversely, the effect is reversed for PV, with more sunlight during the summer months than in winter months. Therefore, the combination of wind and PV technologies could result in a more balanced and stable energy supply throughout the year.

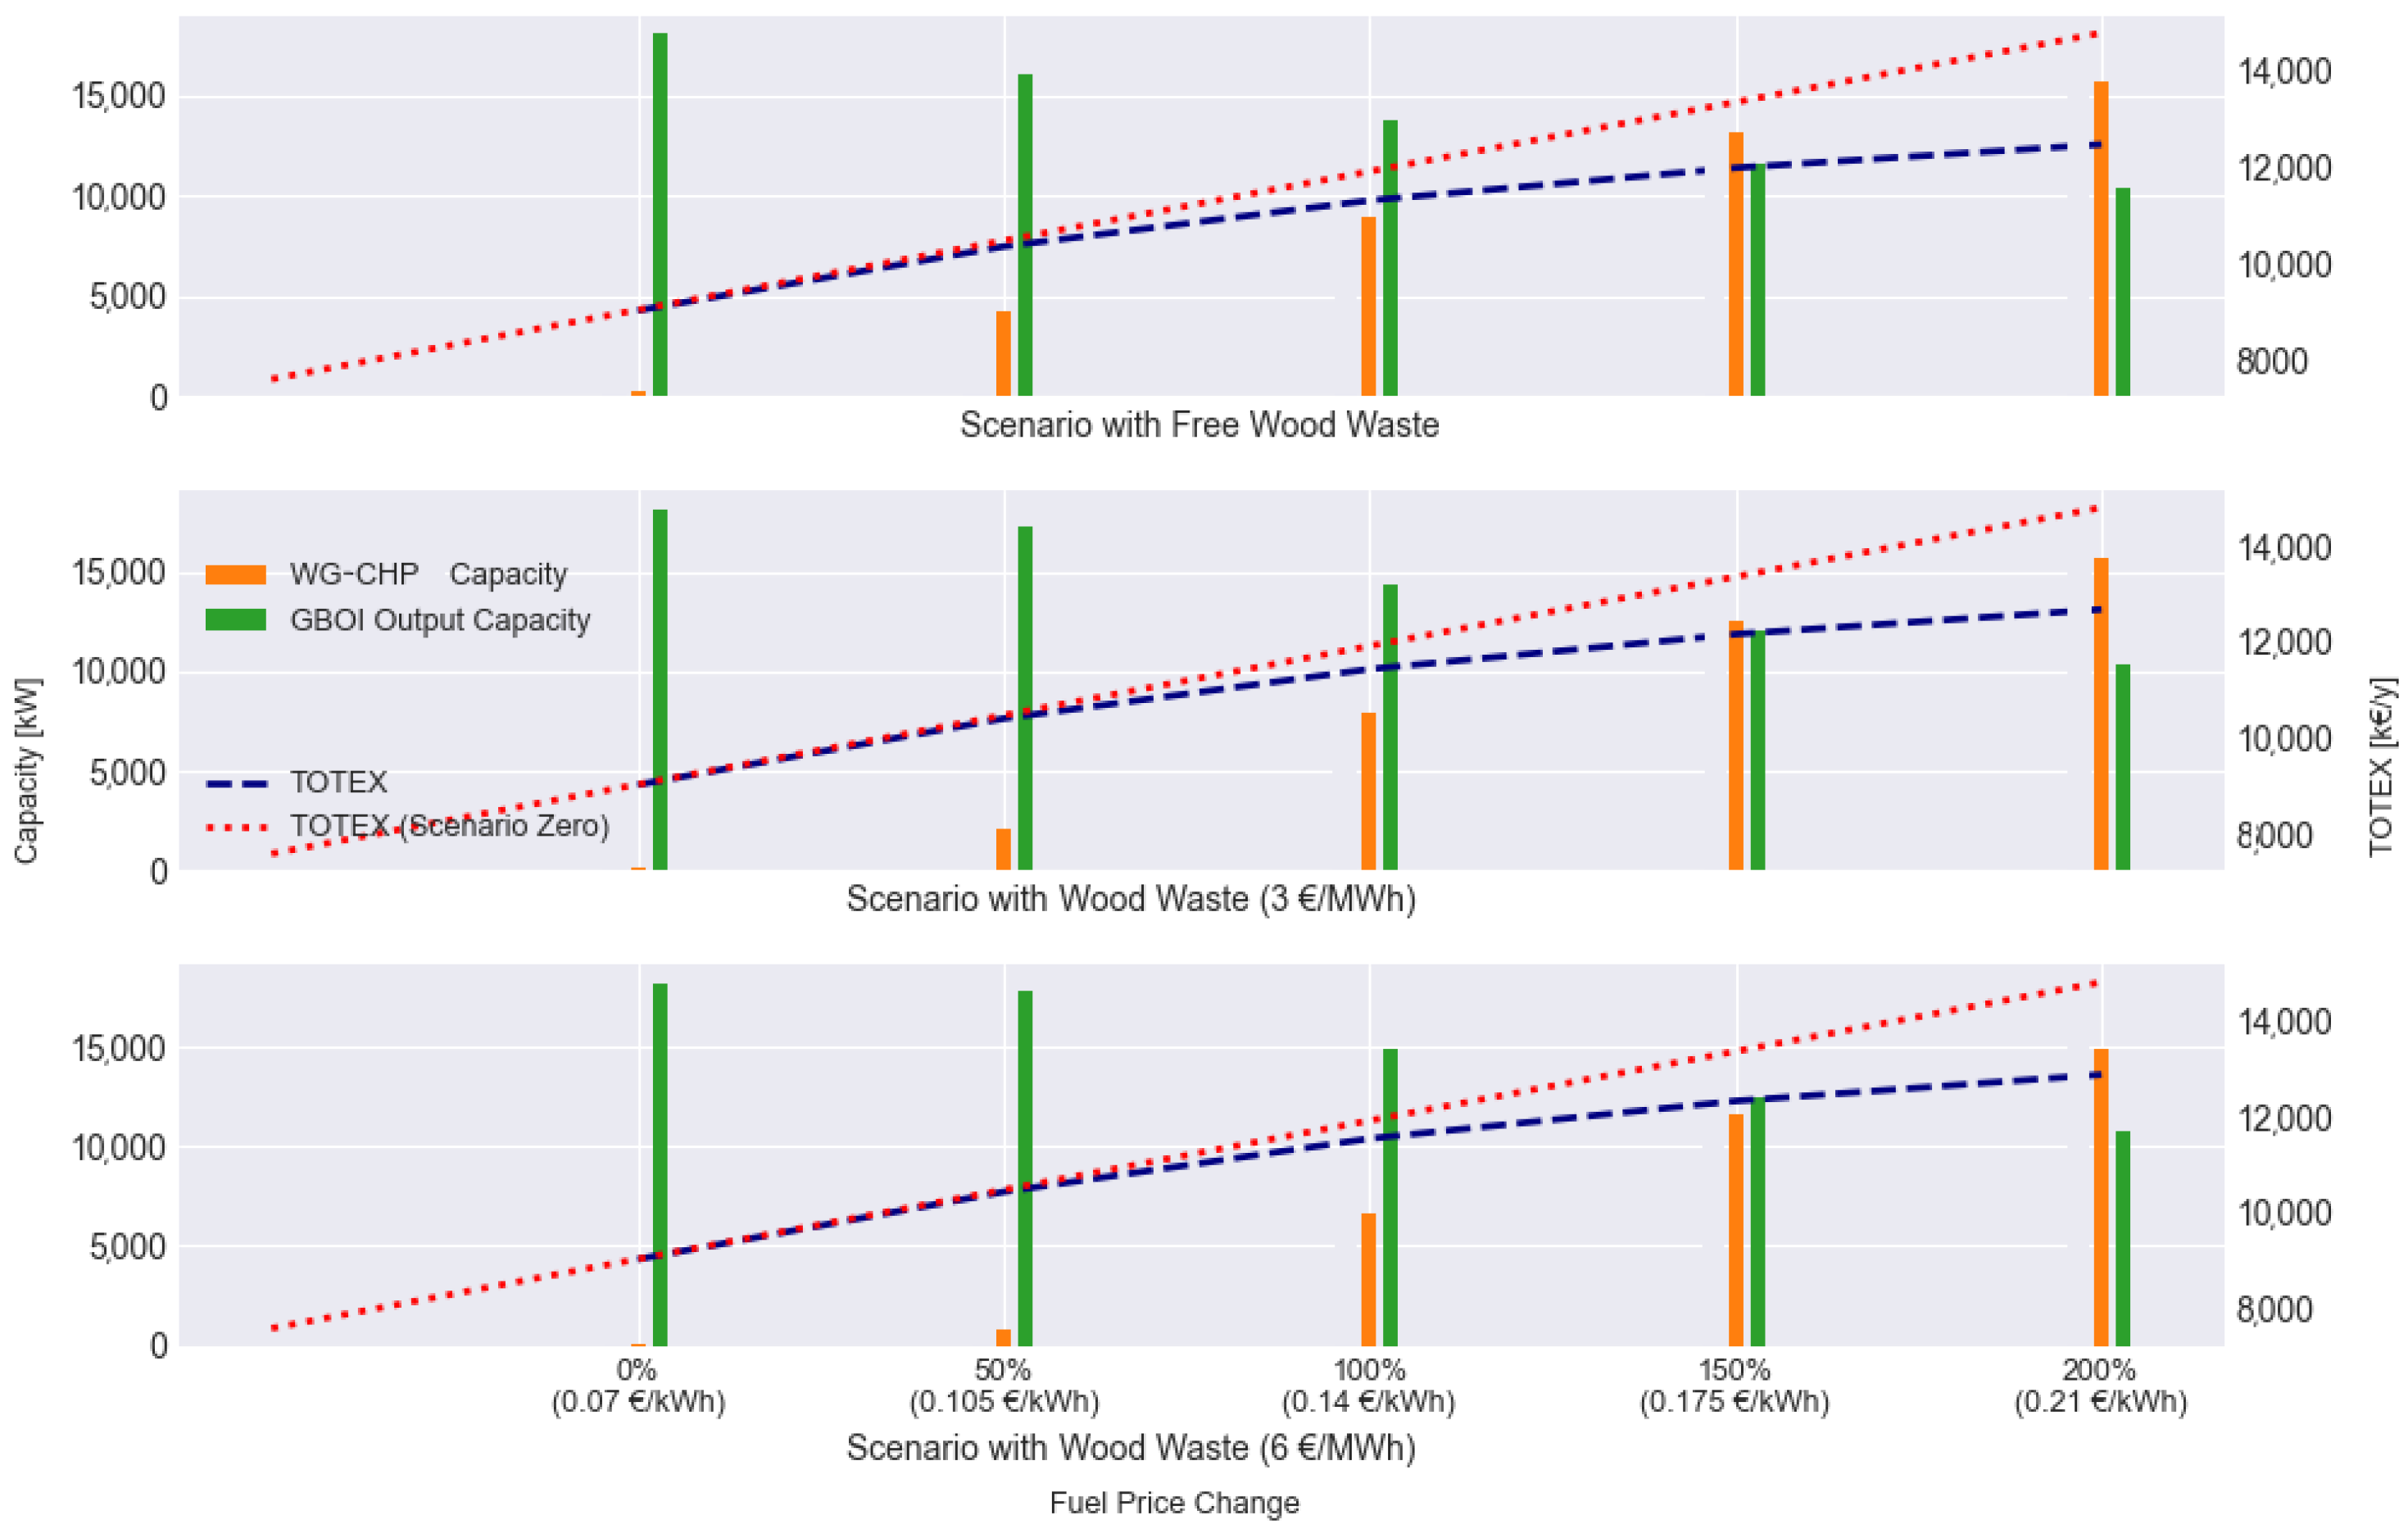
4.5. Scenario D—The Role of Biomass

Prima Protein’s current heating system relies on gas boilers that are powered by either LNG or propane, but the company is seeking a sustainable alternative to reduce carbon emissions. They are exploring the possibility of implementing an integrated wood gasifier with a CHP system, which would be fueled by waste wood. The factory has an annual heat demand of approximately 40 GWh, while the amount of available wood is equivalent to 66.5 GWh per year. Although an industrial WG-CHP system has an average heat efficiency of around 43%, only a portion of the heat demand can be met (71%) with this system. Thus, to ensure that heat demand is met during periods of low and peak demand, a gas boiler that operates on either LNG or propane is planned to be used in conjunction with the WG-CHP system.
At present, Prima Protein relies on propane for its heating system owing to its cost-effectiveness, with the fuel costing 0.07 EUR/kWh, compared to LNG, which is priced at 0.12 EUR/kWh. In the model, the two parameters with the highest degree of uncertainty are the fuel price and biomass costs. To examine the cost-effectiveness of implementing an integrated wood gasifier with a CHP system as an alternative renewable heating source, the model considers different fuel prices and biomass costs. As illustrated in Figure 9, if the fuel prices fall in the range of LNG, it would be viable to install a 5 MW WG-CHP system. Even if the cost of waste wood biomass reaches 6 EUR/MWh, this system would still provide savings.

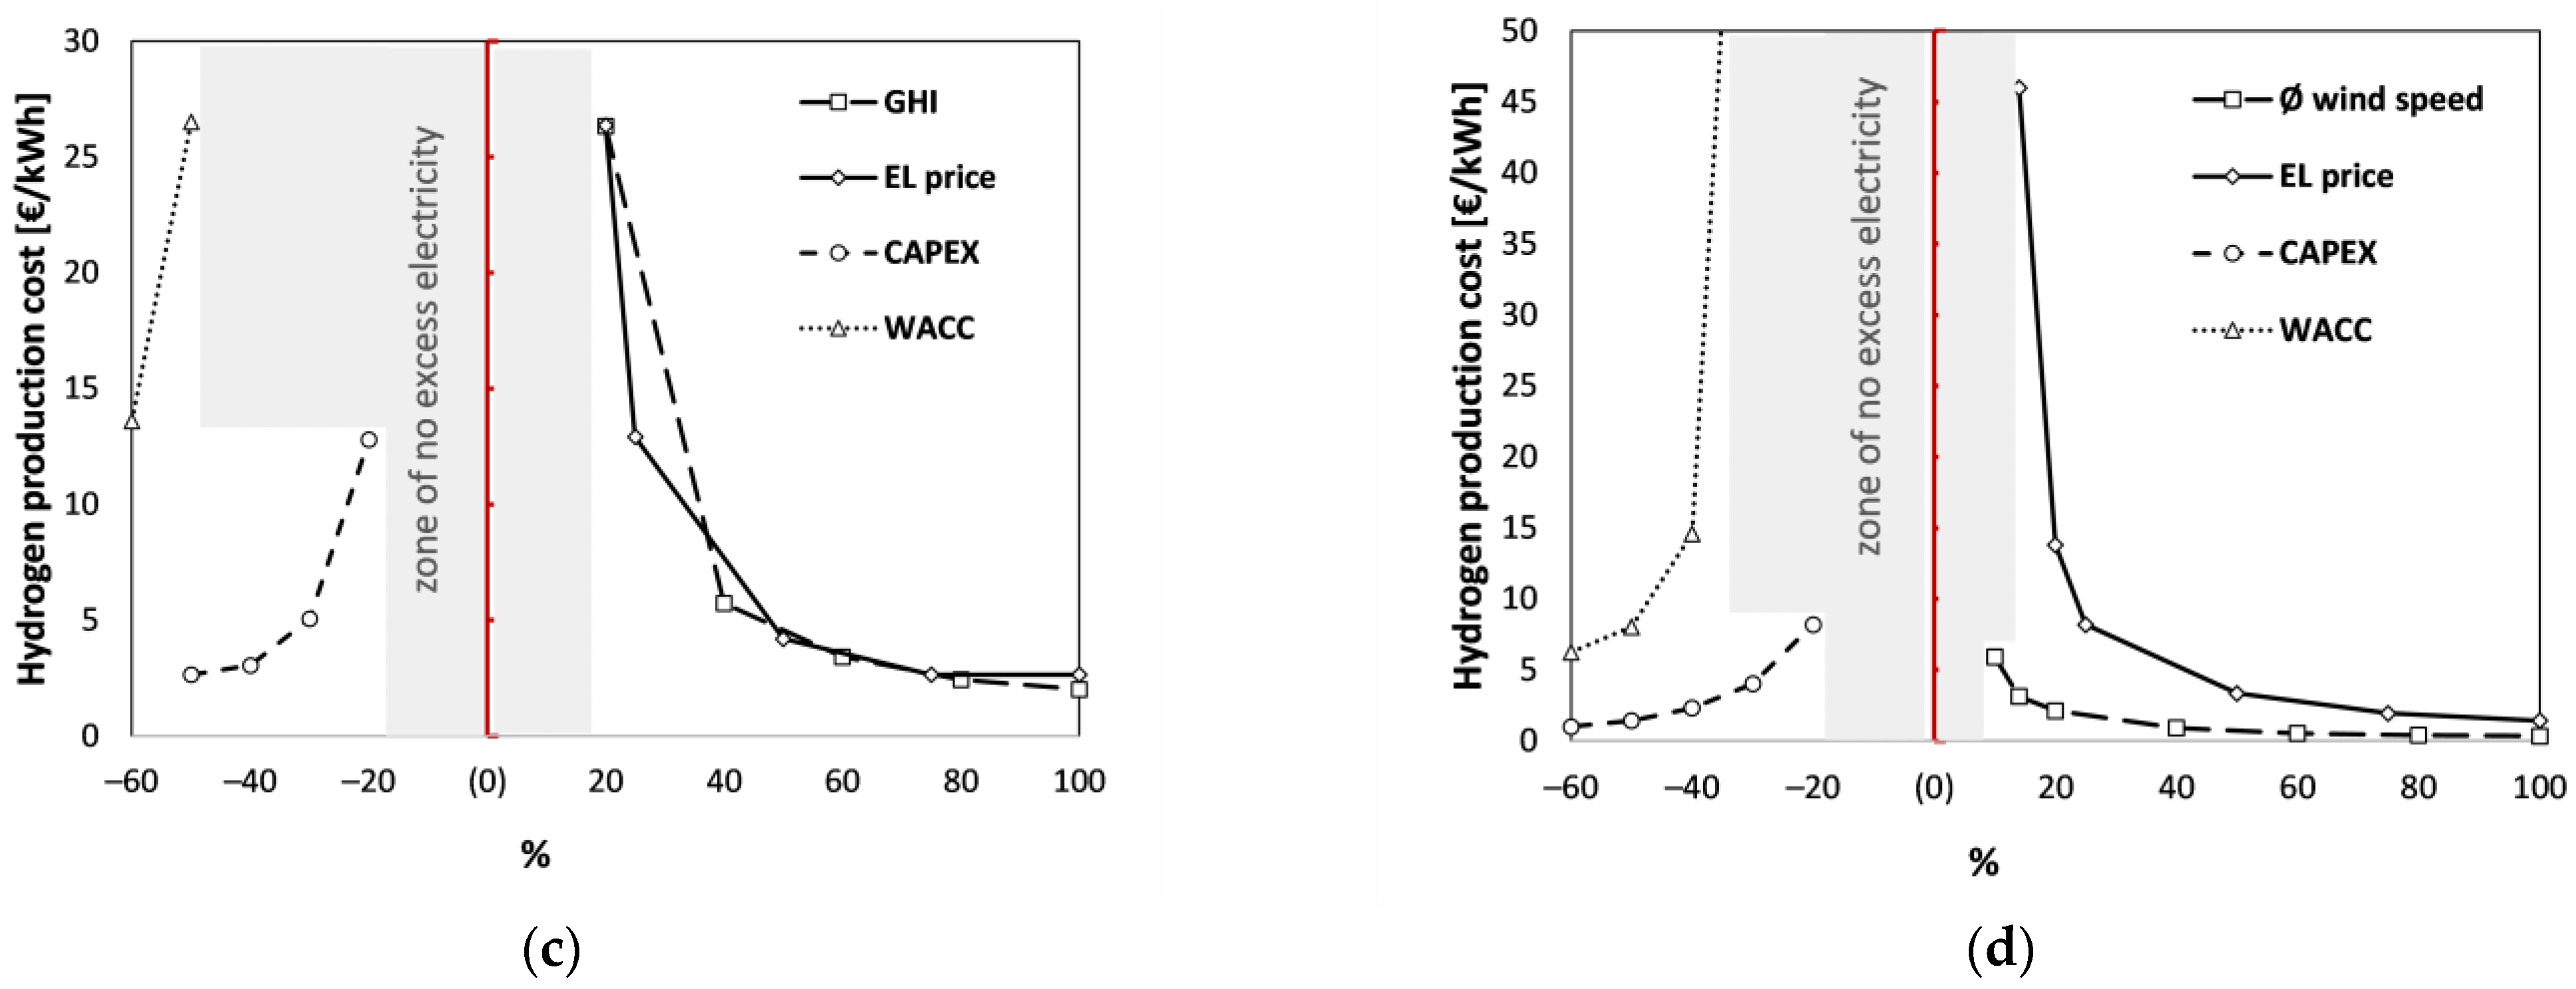
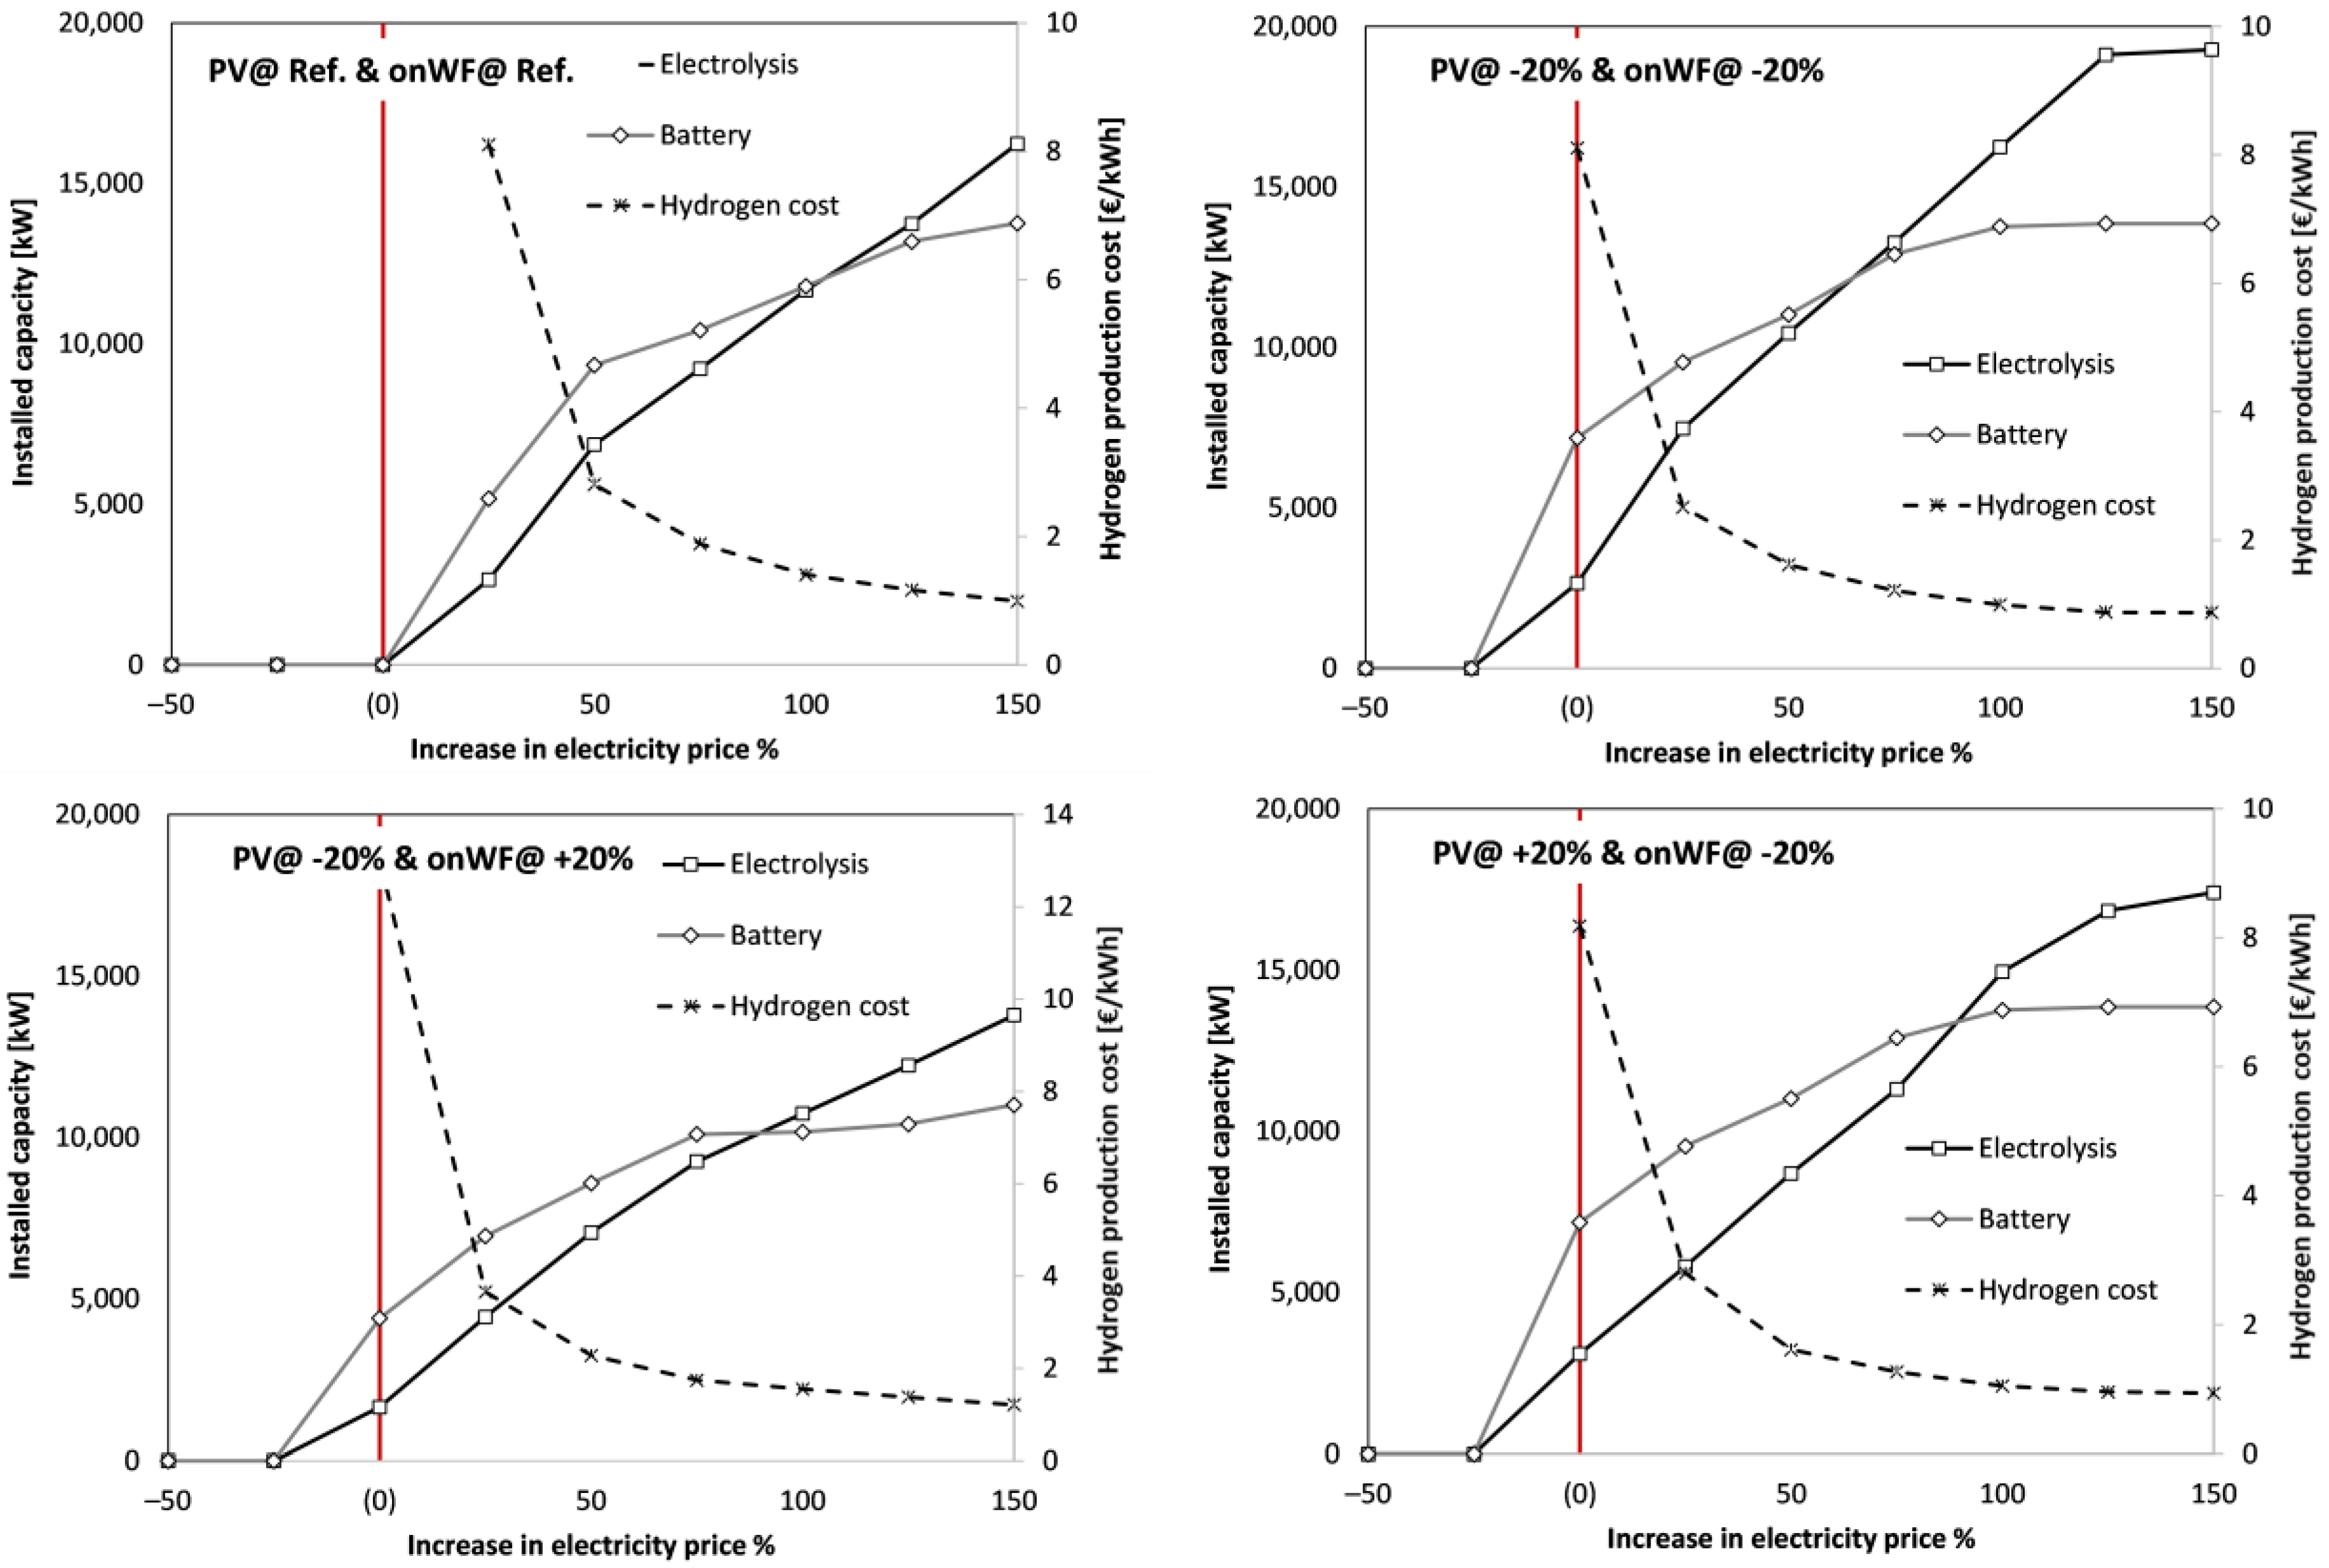
4.6. Green Hydrogen Production

The hydrogen production cost was estimated by taking the total produced hydrogen divided by the cost of the plant. As previously mentioned, only the excess electricity can be used for green hydrogen production. The excess electricity values from all the sensitivity analysis scenarios were calculated to obtain the final cost of hydrogen. Figure 10a,b show the total excess of electricity from Scenario A (PV) and Scenario B (onWF) for the evaluated sensitivity analysis, and the corresponding costs of green hydrogen production are shown in Figure 10c,d, respectively. There are no installations of PV or wind farms up to the breakpoints as discussed in Section 4.2 and Section 4.3; therefore, no excess of electricity is expected. However, as soon as there is an installation of PV or a wind farm, an excess of electricity can be expected. At the low installation capacities, the total amount of excess electricity is low; thus, the hydrogen price are very high, e.g., a 20% decrease in the PV CAPEX leads to hydrogen production cost of 12 EUR/kWh or 400 EUR/kg. It can be seen that the lowest price of hydrogen is at the highest PV installed capacity, i.e., 20 MW.
In the case of the 20 MW PV installation, the corresponding electrolysis size, which is calculated based on the peak of excess electricity, is 5.6 MW. Based on the profile of excess electricity, the electrolysis produces around 30 tons of H2, which results in a price of 2.5 EUR/kWh or 83 EUR/kg. Electrolysis of such a size should be able to produce more than 800 tons H2/year (operation at full load). The high price of hydrogen is due to the low availability of excess electricity generated by the 20 MW PV installation and the electrolysis being operated less than 5% of the times. During the wintertime, only small amount of electricity is produced by the PV installation and there is no excess electricity, which means the electrolysis is off during the winter and most of the inter-seasonal periods and operated at part-loads at other times. The operation profiles of electrolysis, battery, and the excess electricity are provided in the Supplementary Materials.
The hydrogen production costs are estimated following the same logic for the onshore wind farms. The hydrogen cost for the maximum installation size of 20 MW is estimated to be 0.85 EUR/kWh (28 EUR/kg). In this case, the electrolysis size is around 14 MW and it produces around 160 tons of H2. A state-of-the-art PEM electrolysis of 14 MW should be able to produce around 2000 tons of H2 in a year. In this scenario, the electrolysis is operated around 8% of the times, which is the reason for the high hydrogen cost. The operation profiles of the units are provided in the Supplementary Materials.
Similar calculations are performed for Scenario AB, which is a combination of PV and onWF. The excess electricity from the evaluated scenarios of Figure 8 are taken into account for the calculation of hydrogen production costs. The sensitivity analysis is performed along the electricity price for different discrete sets of CAPEX values for the technologies involved (Figure 11). As was seen from Figure 8, CAPEX influences the installation capacity of a specific technology. As the electricity prices increases, the larger size of PV and onWF are suggested by the model, which leads to a larger excess of electricity.
As shown in Figure 11, with an increase in the electricity price, the hydrogen production cost reduces. This is due to the larger installation of PV and onWF when the electricity price increases, which results in more excess electricity being available for hydrogen production. The lowest hydrogen production cost is estimated at around 0.85 EUR/kWh (28 EUR/kg), which is for the largest installation of PV and onWF, both at 20 MW and at 20% lower CAPEX compared to the reference price. The corresponding size of the electrolyzer and battery are also calculated and shown in this figure. At the maximum installation size of PV and onWF (i.e., both 20 MW), the model suggests installing a 19 MW electrolyser and a battery at around 13 MWh capacity. The profile of excess electricity, electrolysis, and battery operations are shown in Figure 12. The highest demand for electricity is during the months of January and February (Figure 1); consequently, there is almost no excess of electricity. In this period, both the electrolyzer and battery are off and there is no hydrogen production. During the summertime, there is more regular solar irradiation and also wind. Therefore, there is some excess electricity available for hydrogen production. The total hydrogen production with such a configuration is estimated at around 280 t/y.
The produced hydrogen can be stored in storage tanks for the transportation sector. The amount of hydrogen that a hydrogen fuel cell car or truck requires per day depends on several factors, such as the size of truck, the efficiency of the fuel cell system, and the distance traveled. On average, a hydrogen fuel cell car can travel about 480 km on a full tank of hydrogen, which typically holds around 5 kg of hydrogen. Therefore, the daily requirement of hydrogen for a fuel cell car can be estimated based on the distance traveled each day. For instance, if a driver travelled 80 km per day, they would require approximately 1 kg of hydrogen per day (365 kg/year). With the production of 280 t/y of hydrogen in the last scenario, 767 cars can be covered over the year.
Hydrogen fuel cell trucks have large fuel tanks compared to passenger vehicles. A typical medium-duty hydrogen fuel cell truck with a payload capacity of 5 to 10 tons can travel 480 to 640 km on a full tank hydrogen, which can hold around 30 to 40 kg of hydrogen. If the truck travels 100 miles (160 km) per day, it may require around 10–15 kg of hydrogen per day. With the production of 280 t/y of hydrogen in the last scenario, 52 (trucks of 10 tons) to 78 (trucks of 5 tons) trucks can be covered over the year.

5. Conclusions

An optimization approach has been developed to be versatile and adaptable, allowing it to be tailored to individual situations through a flexible and modular structure capable of accommodating unique boundary conditions. PV panels and onshore and off-shore wind turbines were analyzed as potential solutions for the renewable energy-based electrification of Eigerøy island. The study investigated both standalone and combined scenarios for these technologies, under the baseline boundary conditions of the current energy system on the island. The results indicated that the installation of PV panels would not be cost-effective under these conditions. However, by adjusting some of the boundary conditions, such as a 15% increase in electricity cost or a 10% decrease in capital cost, PV panels become a more attractive option with a positive business case. Onshore wind turbines also proved to be competitive in terms of electricity production costs. However, the most interesting scenarios for island electrification were those involving combinations of technologies (such as PV, wind, and biomass), which showed significant synergies. In these cases, the total installed capacity was typically lower than that of a single technology, leading to reduced investment costs.
The utilization of biomass is crucial for achieving the decarbonization of industrial processes that require high-temperature heat, such as steam. One attractive option is to partially replace conventionally-fueled gas boilers (LNG, LPG) with biomass-based systems. Based on the analysis conducted for a fish factory located on the island of Eigerøy, it was found that an integrated wood gasification CHP system can offer competitive benefits with just a small increase in fossil fuel prices. As fuel prices continue to rise, the deployment of such a system becomes an increasingly feasible and economically viable option for industries seeking to reduce their carbon footprint. The cost of green hydrogen production from the excess electricity of the evaluated scenarios was estimated. The conditions with the lowest production costs were those with a large installed capacity of renewable technologies, which produced a vast amount of unused electricity. When considering the best cases of each scenario, which often include exaggerated and unrealistic parameters, it is observed that the production costs do not reach the market price levels. The best price obtained was 28 EUR/kg, which was due to the low operation time of electrolysis over the year. From this perspective, it can be concluded that it is not economically feasible to produce green hydrogen from excess electricity in the case of Eigerøy.

Supplementary Materials

The following supporting information can be downloaded at: https://www.mdpi.com/article/10.3390/en16104094/s1.

Author Contributions

Conceptualization, H.M. and D.L.; methodology, H.M. and D.L.; validation, H.M., D.L. and P.J.; formal analysis, H.M.; data curation, D.L.; writing—original draft preparation, H.M.; writing—review and editing, D.L., T.S. and P.J.; visualization, H.M.; supervision, T.S. and P.J.; funding acquisition, P.J. All authors have read and agreed to the published version of the manuscript.

Funding

European Union’s Horizon 2020, grant agreement No 957752.

Data Availability Statement

Data is contained within the article.

Acknowledgments

The Robinson project has received funding from the European Union’s Horizon 2020 research and innovation program under grant agreement No. 957752. This paper reflects only the author’s views, and the European Union is not liable for any use that may be made of the information contained therein.

Conflicts of Interest

The authors declare no conflict of interest.

References

  1. Barney, A.; Polatidis, H.; Haralambopoulos, D. Decarbonisation of islands: A multi-criteria decision analysis platform and application. Sustain. Energy Technol. Assess. 2022, 52, 102115. [Google Scholar] [CrossRef]
  2. European Project ROBINSON. Available online: https://www.robinson-h2020.eu/ (accessed on 12 April 2023).
  3. SMILE H2020. Available online: https://h2020smile.eu/ (accessed on 12 April 2023).
  4. Gift H2020|Geographical Islands Flexibility. Available online: https://www.gift-h2020.eu/ (accessed on 12 April 2023).
  5. Homepage—MAESHA. Available online: https://www.maesha.eu/ (accessed on 12 April 2023).
  6. What Is REACT?—REACT. 2020. Available online: https://react2020.eu/ (accessed on 12 April 2023).
  7. Dorotić, H.; Doračić, B.; Dobravec, V.; Pukšec, T.; Krajačić, G.; Duić, N. Integration of transport and energy sectors in island communities with 100% intermittent renewable energy sources. Renew. Sustain. Energy Rev. 2019, 99, 109–124. [Google Scholar] [CrossRef]
  8. Flessa, A.; Fragkiadakis, D.; Zisarou, E. Decarbonizing the Energy System of Non-Interconnected Islands: The Case of Mayotte. Energies 2023, 16, 2931. [Google Scholar] [CrossRef]
  9. Gils, H.C.; Simon, S. Carbon neutral archipelago—100% renewable energy supply for the Canary Islands. Appl. Energy 2017, 188, 342–355. [Google Scholar] [CrossRef]
  10. Madi, H.; Lytvynenko, D.; Jansohn, P. Decarbonisation of Geographical Islands-The role of Solar, Wind and Biomass. In Proceedings of the 2022 2nd International Conference on Energy Transition in the Mediterranean Area (SyNERGY MED), Thessaloniki, Greece, 17–19 October 2022. [Google Scholar] [CrossRef]
  11. Stadler, P.M. Model-Based Sizing of Building Energy Systems with Renewable Sources. Ph.D. Thesis, École Polytechnique Fédérale de Lausanne, Lausanne, Switzerland, 2019. [Google Scholar] [CrossRef]
  12. Electricity Price Statistics—Statistics Explained. Available online: https://ec.europa.eu/eurostat/statistics-explained/index.php?title=Electricity_price_statistics#Electricity_prices_for_household_consumers (accessed on 23 August 2022).
  13. NASA POWER|Prediction of Worldwide Energy Resources. Available online: https://power.larc.nasa.gov/ (accessed on 24 August 2022).
  14. Smart integRation of Local Energy Sources and Innovative Storage for Flexible, Secure and Cost-Efficient Energy Supply on Industrialized Islands|ROBINSON Project|Results|H2020|CORDIS|European Commission. Available online: https://cordis.europa.eu/project/id/957752/results (accessed on 23 August 2022).
  15. Madi, H. Investigations into the Effects of Biofuel Contaminants on Solid Oxide Fuel Cells. Ph.D. Thesis, École Polytechnique Fédérale de Lausanne, Lausanne, Switzerland, 2016. [Google Scholar] [CrossRef]
  16. Gurobi Optimization. Available online: https://www.gurobi.com/ (accessed on 12 April 2023).
  17. Vartiainen, E.; Masson, G.; Breyer, C.; Moser, D.; Román Medina, E. Impact of weighted average cost of capital, capital expenditure, and other parameters on future utility-scale PV levelised cost of electricity. Prog. Photovolt. Res. Appl. 2020, 28, 439–453. [Google Scholar] [CrossRef]
  18. Sens, L.; Neuling, U.; Kaltschmitt, M. Capital expenditure and levelized cost of electricity of photovoltaic plants and wind turbines—Development by 2050. Renew. Energy 2022, 185, 525–537. [Google Scholar] [CrossRef]
  19. Steffen, B. Estimating the cost of capital for renewable energy projects. Energy Econ. 2020, 88, 104783. [Google Scholar] [CrossRef]
  20. Njiri, J.G.; Beganovic, N.; Do, M.H.; Söffker, D. Consideration of lifetime and fatigue load in wind turbine control. Renew. Energy 2019, 131, 818–828. [Google Scholar] [CrossRef]
  21. Duffy, A.; Hand, M.; Wiser, R.; Lantz, E.; Dalla Riva, A.; Berkhout, V.; Stenkvist, M.; Weir, D.; Lacal-Arántegui, R. Land-based wind energy cost trends in Germany, Denmark, Ireland, Norway, Sweden and the United States. Appl. Energy 2020, 277, 114777. [Google Scholar] [CrossRef]
Figure 1. Electricity (the whole island, top) and heat demand (for Prima Protein only, down) of the Eigerøy island from January to December in hourly base, 2021.
Energies 16 04094 g001
Figure 2. Electricity price in Norway in hourly resolution over for 2019 and 2021.
Energies 16 04094 g002
Figure 3. The GHI intensity in hourly profile, Eigerøy island.
Energies 16 04094 g003
Figure 4. Hourly profiles of wind speed on Eigerøy (onshore) and at a distance of 5 km from the coast (offshore), 2021.
Energies 16 04094 g004
Figure 5. Schematic of the energy supply system on the island.
Energies 16 04094 g005
Figure 6. Sensitivity analysis for Scenario A; (a) installed capacity and (b) TOTEX.
Energies 16 04094 g006
Figure 7. Sensitivity analysis for Scenario B; (a) installed capacity for onWF, (b) TOTEX for onWF, (c) installed capacity for offWF, and (d) TOTEX for offWF.
Energies 16 04094 g007
Figure 8. Sensitivity analysis along EL-price of the coupled PV and onWF energy system.
Energies 16 04094 g008
Figure 9. Sensitivity analysis of an operationally flexible WG-CHP system in combination with the gas boiler.
Energies 16 04094 g009
Figure 10. Excess electricity generated from (a) Scenario A and (b) Scenario B. Hydrogen production cost for the (c) Scenario A and (d) Scenario B.
Energies 16 04094 g010aEnergies 16 04094 g010b
Figure 11. Hydrogen production cost based on the evaluated scenarios of Figure 8 and the corresponding size of the electrolysis and battery system.
Energies 16 04094 g011
Figure 12. The profile of excess electricity, battery, and electrolysis operations for Scenario AB, the case of 20% reduction in CAPEX for both PV and onWF.
Energies 16 04094 g012
Table 1. Summary of the parameters used in the model for each unit.
PV [17,18]onWF [19,20,21]offWFWG [14]CHP [14]GBOIH-ELBAT
CAPEX (EUR/kW)55013003000140014001001300275
OPEX (%)1.72.52.533522.5
WACC (%)57810102.51011
ƞ e l 15---40-70
ƞ t h ----5098-
t o t a l ƞ H H V ---84---
Lifetime2020202020201515
Table 2. Thresholds for onWF and offWF (for positive business cases).
onWFoffWF
Wind speed5% increase
(6.3 m/s)
40% increase
(9.9 m/s)
Electricity price10% increase
(0.09 EUR/kWh)
60% increase
(0.13 EUR/kWh)
CAPEX10% reduction
(1170 EUR/kW)
30% reduction
(2100 EUR/kW)
WACC25% reduction (5.25%)90% reduction (0.8%)
Disclaimer/Publisher’s Note: The statements, opinions and data contained in all publications are solely those of the individual author(s) and contributor(s) and not of MDPI and/or the editor(s). MDPI and/or the editor(s) disclaim responsibility for any injury to people or property resulting from any ideas, methods, instructions or products referred to in the content.

