Article

Citizen Satisfaction with Renewable Energy Investments: A Multi-Criteria Satisfaction Analysis

by
Evangelia Karasmanaki
1,*,
Evangelos Grigoroudis
2,
Spyridon Galatsidas
1 and
Georgios Tsantopoulos
1
1
Department of Forestry and Management of the Environment and Natural Resources, Democritus University of Thrace, Pantazidou 193, 68200 Orestiada, Greece
2
School of Production Engineering and Management, Technical University of Crete, University Campus, 73100 Chania, Greece
*
Author to whom correspondence should be addressed.
Energies 2023, 16(10), 3979; https://doi.org/10.3390/en16103979
Submission received: 18 April 2023 / Revised: 4 May 2023 / Accepted: 7 May 2023 / Published: 9 May 2023

Abstract

:
To reap the potential of renewable energy investments, many states of the European Union have been enacting policies to attract investments from various actors including citizens. Citizen satisfaction with investments has not been examined so far and, consequently, it is unknown whether the implemented policies are correct. Due to its ability to reveal weaknesses that affect satisfaction, satisfaction analysis may serve as a policy decision making tool, while a higher level of citizen satisfaction may build trustful relationships between citizens and governments and enhance citizen acceptance of renewable energy development plans. The aim of this study was to investigate citizen satisfaction with the state’s actions to facilitate investments in renewable energy sources and to detect the weaknesses of the current investment environment. A representative nationwide citizen sample (n = 1536) was recruited in a country of the European Union (Greece) and the MUlticriteria Satisfaction Analysis (MUSA) method analyzed eight criteria related to RES investments. The analysis indicated a low level of citizen satisfaction, while the most prominent weaknesses involved the licensing process and the policies for mitigating fossil fuel monopolies and improving the competitiveness of renewables. Results from this study point to strategic steps that could address weak policy areas that contribute to low citizen satisfaction.

1. Introduction

In order to reach net-zero emissions by 2050, all pillars must exert great efforts to scale up renewable infrastructure. Apart from institutional investors, corporates, and governments, citizens who make investments in renewable energy (RE) can contribute significantly to the diffusion of renewable energy sources (RES) while helping to alleviate issues, such as funding gaps and lock-ins [1]. To reap these benefits, many EU countries have been establishing measures and policies designed to attract investments from citizens.
Back in 2009, the European Union (EU) established the 2020 package which promoted, through binding legislation, the implementation of climate and energy objectives by the year 2020. For the period between 2021 and 2030, however, the EU decided to set more ambitious objectives that involved EU-wide targets such as a minimum of 32% share of renewable energy in the final gross consumption [2,3]. In this context, every EU member-state had to submit its own National Energy and Climate Plan (NECP) which would serve as a strategic schedule for the accomplishment of explicit energy and climate targets by the year 2030. Towards the end of 2019, Greece submitted its revised NECP which established loftier national objectives for 2030 compared to EU targets. These objectives involved an at least 35% share of renewable energy in the final gross energy consumption, a 42% decrease in greenhouse gas emissions in comparison to levels recorded in 1990, and a minimum of 38% energy efficiency in final energy consumption [4]. In line with EU legislation and, in accordance with its national targets, Greece has exerted a considerable effort to promote renewable energy and has striven to establish an attractive investment environment for citizens. As an example, the country has facilitated citizen investments through schemes such as feed-in-tariff (FiT) programs (Law 3468/2006, revised by Law 3851/2010 and Law 4254/2014).
The extant literature has so far examined the influence of financial and certain non-financial factors on citizens’ decision to invest in renewables. Specifically, there is a stream of literature examining the effect of financial factors such as support schemes, return on investments, and payback periods on RES investments [5,6,7,8,9,10,11]. Simultaneously, another literature strand has focused on the profile of investors as well as the effect of sociodemographic variables (such as age, education level, gender, income, and place of residence) and attitudinal variables on investment decisions (such as personal environmental values, climate concerns, acceptance of renewables, previous investment experience, and attitudes towards risky investments) [6,8,10,12,13,14,15,16,17,18,19]. It can be observed that there has been no examination of citizen satisfaction with the states’ actions to facilitate citizen investments in renewable energy despite it being reasonable that satisfied citizens are more likely to proceed to investments [20,21,22].
From a broader perspective, satisfaction with a product or service is regarded as a baseline standard of performance as well as a potential criterion of excellence for every type of organization [23]. Performing studies to measure and analyze satisfaction can detect critical areas of underperformance and overperformance along with the existing strengths and weaknesses meaning that it offers a precise picture of the main policy areas that need to be addressed as well as if changes in resource allocation are required. For this reason, the application of satisfaction analysis on renewable energy investments can become a valuable decision-making tool for actors engaged in RES investments such as policymakers, project developers, and banks as it can simply show whether the implemented policies in relation to RES investments are correct and what needs to be improved.
Another important benefit of addressing citizen satisfaction, however, is that it can alleviate the rough edges of citizen mistrust in policymaking and government decisions. That is, if used as a policy tool, citizen satisfaction is capable of building trust between governments and citizens [24,25,26]. Trust is, in turn, the key to citizen willingness to comply with government policy, and it may also increase citizen tolerance of measures that could appear, at least to some extent, disturbing or disruptive [25]. In the context of RES investments, a foundation of trust between citizens and governments may underlie citizen acceptance of the particularly aggressive RES development plan that is anticipated to occur in Greece in order to achieve the lofty targets of RES penetration [27]. In this respect, the absence of a trustful relationship with citizens can be detrimental not only to RES investments, but also to policy efforts for shaping the legal and regulatory framework in compliance with EU energy legislation.
Turning the attention back to satisfaction with RES investments, a satisfaction analysis can show what needs to be improved in order to correspond to citizens’ expectations and needs. If, however, possible weaknesses remain unaddressed, citizens’ satisfaction will further decrease and a valuable opportunity to increase the capacity of renewable energy will be lost. In addition, such weaknesses do not help build a long-term trusting relationship between citizens and the government. In order to address this problem, this study is aimed at citizen satisfaction with the state’s actions in relation to RES investments, and at detecting the weak points of the current investment situation. The methodology applied to perform this study could be particularly useful to researchers interested in examining whether existing investment environments correspond to potential investors’ expectations and needs. Furthermore, this study proposes a method to test and evaluate citizen satisfaction based on eight criteria that affect satisfaction with renewable energy investments and, building on this study, provides other researchers the opportunity to examine the impact of other criteria on satisfaction.
The remaining part of this paper is structured as follows: The second section provides a brief overview of the policy framework for investments in renewable energy in the study area and discusses the factors affecting citizen decision to invest in renewables. Then, the third section describes in detail the methods followed to perform the study and, afterwards, in the sixth section, the results are discussed. In the last section, conclusions are drawn, and study limitations are stated.

2. Background

2.1. Policy Framework for Investments in Renewable Energy

Greece presents a unique case study because, on the one hand, it deals with a challenging twofold electricity system while, on the other hand, it possesses an impressive potential for renewable energy development [22,28,29]. The country’s twofold electricity system consists of the interconnected mainland system and the non-interconnected island systems. Unlike islands near the mainland, which are connected to the mainland electricity grid network, islands away from the mainland must meet their energy needs through their own power systems, which combust considerable amounts of expensive imported fossil fuels [29,30]. Simultaneously, the country has notable potential for renewable energy production thanks to its climatic conditions, which, inter alia, involve 3000 h of annual sunshine and strong winds [22].
For many years, electricity production was dominated by lignite which has been used strategically to avoid expensive fuel imports [28,29]. In the underground of the country, there are still abundant reserves that suffice to produce electricity for, at least, the next four decades [31]. Apart from being a reliable energy source for many decades, lignite exploitation has also delivered prominent advantages, including energy security and local employment. Nevertheless, in line with the EUs air pollution reduction targets and, in order to comply with the Integrated Emission Directive 2010/75/EU, the country has been implementing a large-scale decommissioning plan, which aims at the total phase-out of lignite. During the period between 2010 and 2016, as much as 913 MW of lignite capacity were decommissioned [31]. The initial deadline for the full decommissioning was the year 2025, while the gap in electricity production is mainly covered by natural gas which serves as a transition fuel. This, however, resulted in a sharp increase in natural gas imports and, in order to hold back the growing dependence on natural gas, an extension for the lignite phase-out has been decided. The new deadline for lignite phase-out has been extended to the year 2028 despite the fact that, in January of 2022, the share of lignite-fueled energy technologies dropped to the historical level of 12% [32].
In relation to the country’s energy mix, it is worthwhile to note that towards the end of 2021 electricity from fossil fuels corresponded to 58.5%, whereas electricity from renewables was as high as 41.5%. More analytically, natural gas accounted for 34.37%, wind energy for 18.77%, lignite for 12.37%, oil for 10.51%, hydropower for 10.44%, solar energy for 9.26%, and other renewable types (such as biomass) for 0.32% [32]. One can easily observe that electricity production remains greatly reliant on imported fossil fuels and this stands in contrast to other EU countries where fossil fuel reliance follows a decreasing trend [32].
Despite the dominance of fossil fuels, Greece has made great strides in the deployment of renewables in just a few years’ time and further increases in the use of renewables could be achieved since the country offers excellent conditions for developing renewable energy sources due to its geographic position [22]. Policies, laws, and regulations promoting renewable energies have been critical in increasing the share of renewables in the energy mix. As an EU member, Greece develops policies in compliance with the European Union’s Energy and Climate Framework which sets lofty goals for renewables, energy efficiency, and decreases in greenhouse gas emission rates. The national policy concerning the energy sector brings into focus these areas and also aims to transform the energy market in order to enhance competition, mitigate the alarming issue of energy poverty, and decarbonize the economy [30,32].
As in other European countries, the Greek state had quite early acknowledged that mechanisms supporting the use and diffusion of renewables could positively affect the overall adoption of renewables [33]. The country has extensively implemented various feed-in-tariff (FiT) schemes for many years through the legal establishment of a series of FiT laws. The FiT mechanism has been the sole support scheme beside capital grants provided from national investment laws, as well as from the EUs structural and investment funds [34,35]. From 2006 to 2015, Greece facilitated renewable energy development through a FiT program, which supported the deployment of renewables [30]. In particular, Law 3468/2006, which was later amended by Law 3851/2010, promoted the installation of residential photovoltaics (PV) and set fixed prices for producers. The response of households to the FiT was such that the country was forced to suspend the licensing of new PV applications from 2012 to 2014 because the set target of 2200 MW had been overachieved. The FiT was, however, later considerably revised by Law 4254/2014, which, inter alia, retroactively estimated downward FiT compensation prices for existing photovoltaics, small hydropower plants, wind, and co-generation installations included in the signed power purchase agreements. This decrease in fixed prices provoked negative reactions among adopters and, due to lower compensation prices, the installation of PV decreased notably.
The legal framework in place for the licensing of renewable installations is a major investment aspect and may be affecting potential investors. It is important to note that, in earlier years, the licensing process in Greece was highly complex and time consuming, and often discouraged potential investors [34,35]. The relevant legislation was later revised, and licensing procedures became somewhat simpler; at present, investments in small-scale renewable systems follow much simpler and quicker procedures than investments in large-scale systems. Through FiT programs, citizens can invest in photovoltaics with a capacity less than 10 kW, which are connected to the low-voltage distribution network. The process that citizens must comply with is the following: First, they must submit to a local office of Public Power Corporation (PPC) (ex-monopolist electricity producer and supplier) a series of documents including a connection application, a formal declaration stating that the criteria are met, the details of the installation, as well as the technical data of the panels and the converter of their system (Greek Government Gazette B’ 1079/2009 established under Law 3468/2006, Article 14, and later revised by Law 3734/2009 Article 27A). Once submitted, the PPC makes a connection offer with the expenditure for the connection works, and then applicants, if they accept the offer, must obtain an “Approval of the execution of small-scale works” from the Urban Planning Service. Next, the PPC (also acting as grid manager) and the applicant sign a connection contract. Finally, an application for the activation of the connection must be submitted to the local service of the PPC, and along with this application the applicant submits a copy of the contract, a formal declaration of an engineer with the necessary supporting documents, and a personal formal declaration stating that during the entire operation of their system all regulations stated by the engineer will not be modified or change in any way [36].
In contrast to the licensing process for small-scale installations described above, applications for larger scale systems (up to 500 kW) follow a quite different procedure. Applicants must first obtain an electricity production license from the Regulatory Agency of Energy as well as a statement regarding the provision of the connection of the power plant to the network from the Public Power Corporation. In addition, applicants need to have an approval of environmental conditions or exclusion of the approval (under certain conditions). Moreover, if the installation of the RES plant is to be installed in, or close to, a forest or forestland, applicants need permission from regional authorities for acquiring the right to use the land. Along with the installation license, applicants need to acquire a construction license and also sign a contract with the PPC concerning the connection of their plant to the system or network, as well as an electricity sales contract with the system operator of the electricity transmission system. Finally, a trial period and issuance of operation license are required from the competent regional services [36]. It can be observed that the licensing processes for small- and large-scale renewable systems have major differences with the latter being much more extensive.

2.2. Factors Affecting Citizen Investment in Renewable Energy

The public sector cannot alone provide the necessary financial resources for energy transition; thus, private financing is necessary to achieve a higher production of renewable energy [6,37]. In some countries, citizens have been providers of significant capital for RES projects [15]. As an example, citizens in Germany own about half of renewable energy production and have driven the country’s energy transition through their participation in feed-in-tariff schemes [9]. From a policy point of view, citizens may play a key role in raising a considerable part of the required financial resources for the deployment of renewables [9,15].
Citizens, however, are very different from professional investors and their decision-making around RES investments requires dedicated research efforts. So far, most of the literature on the subject tends to analyze the decision-making of other investor groups such as incumbent firms [9]. Over the last years, however, there has been a substantial effort to identify what affects citizens’ investment decision. From a broader perspective, proceeding into any investment is a highly involved decision, which people normally undertake only once during their lives, as every investment results from rationally-calculated decision-making [14].
Although it was initially considered that citizens use simpler decision rules in decision-making (i.e., mostly calculation of payback periods), it rather seems that citizens’ decision to invest is much more complex and influenced by a multitude of factors which involve both financial and non-financial variables. In terms of financial factors, citizens take into consideration available support schemes, return on investment, the cost and certainty of the investment, previous experience in investments, financial knowledge, and attitude to risky investments [5,6,7,8,9,10,38]. During the past two decades, citizen investments increased due to the implementation of numerous support schemes, such as feed-in-tariffs, tax exemptions, and tax decreases [39]. Such support schemes exerted a discernibly positive influence on the decision-making process of citizens and drove investments. Indicatively, Vasseur and Kemp [40] found that the provision of incentives was able to induce individuals to adopt photovoltaic systems. In the context of housing retrofit, the analysis of Dolores et al. [41] showed that retrofitting projects with photovoltaic systems are economically viable only if government financial support is available. As years passed, however, the cost of renewable energy production fell notably leading many EU countries to cut back on financial incentives because they proved to be economically unviable [17,39].
Simultaneously, there is considerable research pointing to the effect of perceived barriers on investment decisions. Specifically, findings from relevant studies converge that, for citizens, one of the most prominent aspects of renewable energy investments is the cost which acts as barrier per se [12,16,19]. Indicatively, in the study of Vasseur and Kemp [40], a remarkably high share of respondents (by 58.3%) regarded the investment cost as the most important hindrance to investing in renewables, and 47.8% perceived that the cost must decrease significantly for them to invest while as many as 31.3% would invest only under an attractive subsidy scheme. Likewise, respondents in the study of Broughel and Hampl [19] ranked the lack of financial means as the most important barrier to participation in community projects. The strong effect of cost may explain why individuals with greater financial resources are more willing to invest in renewables [12] and also points to the negative impact of insufficient savings and lack of loan access on investment decisions [38]. Other barriers to investments involve the fear of low energy production and not gaining the anticipated efficiency [16,40].
Moreover, the stability of the regulatory and policy framework is influential in the decision to invest in RES and, if favorable, it can act as a strong driver [38]. In other words, the steady application of RES policies and the consistent existence of institutions provide a sense of ‘safety’ which positively affects investment decisions. It has also been observed that the effectiveness of policies, as well as the existence of policies supporting renewable investments, can attract investment in specific renewable types [42]. Simultaneously, citizens would prefer governments to establish measures aimed at making renewable investments more feasible, such as providing tax benefits, and also take steps towards developing a ‘cleaner’ energy vision with the establishment of objectives [40].
Despite the strong effect of policy and financial factors on citizen investment decisions, citizen decision-making is not only driven by financial or policy factors, but instead extends beyond profit maximization. There is a considerable volume of literature showing that sociodemographic and attitudinal variables influence renewable energy investments. Specifically, investment decisions are affected by individuals’ age, gender, education level, place of residence, and personal attitudes towards the environment and renewables [6,8,10,12,13,14,15,16,17,18,19]. In addition to, financial or investment knowledge and experience, the location of the project, and the acceptance of such projects [10].
Regarding the discussion of factors affecting citizen RES investments, it can be observed that satisfaction over RES investments has not been examined. Although satisfaction being is consistently measured in the setting of other types of investments (such as real estate investments), there is scarce empirical research on satisfaction with investments in renewable energy sources, despite satisfaction being identified as a significant component in investment decisions [21]. Hence, an understudied but promising angle both for understanding and promoting RES investments may be citizen satisfaction. If improved, satisfaction with the investment environment may contribute to unlocking the potential of citizen investment in renewable energy in addition to establishing a relationship of trust between citizens and governments.

3. Materials and Methods

Results presented in this paper comprise part of a nationwide study that was conducted in the year 2021, in Greece, that focused on renewable energy investments. The population under study were all Greek citizens and the study area was defined as the entire territory of Greece with a total population of 10,815,197, according to the national census of 2011 [43]. Greece has a remarkable renewable energy potential and could become a major renewable energy producer. Based on the estimations of various stations throughout the country, Greece is advantageous in terms of its wind and solar energy potential and could become a ‘RES-blessed’ country in the years to come [44].
For the purposes of this research, the structured questionnaire was the research instrument and, in order to decide on the content of the questionnaire items, the findings from the relevant literature were reviewed, while the policy framework of investments in renewable energy in Greece was considered. Specifically, the focus was placed on research works examining investors’ and potential investors’ profile, preferences, as well as barriers to implementing renewable energy investments [6,13,16,17,18,19,40,42,45].
In this research, the reliability of the questionnaire was tested through the performance of a pilot study of 30 Greek citizens who belonged to different age groups, income and occupation categories, and education levels. In compliance with Law 4521/2018 and, in particular, with the provisions set forth in Article 23, the research obtained a permit from the Research Ethics Committee of the Democritus University of Thrace (Decision No. 3/09-12-2019).

3.1. Sampling Method and Sample Size Estimation

To achieve a representative sample, we followed the simple random sampling (SRS) method. SRS requires a low level of knowledge about the target population in comparison to other sampling methods. The size of the citizen sample was calculated by applying the formula of simple random sampling [46]. Specifically, simple random sampling but without replacement was employed. Thus, the factor of finite population correction may be omitted because the size of the sample (n) is relatively modest compared to population size (N) [47].
n = t 2 p ¯ 1 p ¯ e 2 = 1.96 2 0.50 1 0.50 0.025 2 1536
In the above formula, t represents the value of the Student’s t-distribution with (1 − α) = 95.0%, n − 1 degrees of freedom, and e represents the level of precision (i.e., the margin of error). Since the size of pre-sampling is quite high (more than fifty), the value of t is obtained from standard normal distribution tables and, practically, for a probability of 95% the value is 1.96 [47,48]. Moreover, p-bar represents the calculation of proportion and e represents the highest accepted difference between the unknown population mean and the sample mean. Hence, we may accept that e equals to 0.025, that is 2.5%.
To calculate the size of the citizen sample, it was essential to conduct pre-sampling with a sample of fifty subjects and, for each variable, the actual proportion of the population was calculated. It should be noted that the use of questionnaires does not estimate only one variable but a considerable number of variables. Therefore, the sample size for every variable was estimated and the variable ‘Gender’ yielded the greatest sample size. In cases where estimated sample sizes are similar and can be afforded, the highest sample size is chosen. In such a way, the variable with the greatest variability is calculated accurately, while the other variables are calculated more accurately than was intended [48].

3.2. Data Analysis

The analysis was performed with the Statistical Package for the Social Sciences (SPSS). To analyze citizens’ satisfaction with the state’s actions to facilitate investments, however, the questionnaire contained a multivariate question that was explicitly designed to be analyzed with the MUlticriteria Satisfaction Analysis (MUSA) method which is used to measure and analyze satisfaction. In this research, citizens were regarded as potential investors because with the appropriate measures they could become actual investors. From this perspective, analyzing citizen satisfaction is a strategic step towards achieving a greater level of RES investment. Apart from the present research, the MUSA method has already been applied in an impressively wide range of cases. For instance, it has been applied to measure and analyze citizen satisfaction with citizen service centers, as well as satisfaction in the tourism sector, banking sector, and the healthcare and pharmacy sectors [49,50,51,52,53].
Citizen satisfaction is a multicriteria evaluation problem in which citizens’ overall satisfaction is dependent on a set of satisfaction criteria [21,54]. Satisfaction dimensions examined in this study involve: (1) subsidies for investments in RES, (2) investment incentives (such as tax exemptions), (3) investment climate (improved regulatory measures, access to national credit), (4) stability of Greek energy policy, (5) policies and measures for improving the competitiveness of renewables in the energy market, (6) measures for reducing the monopoly of fossil fuels (such as the reduction of subsidies for fossil fuels), (7) licensing process, and (8) the provided information on investments in renewable energy. Citizens rated their satisfaction with the above using a five-point Likert scale (very dissatisfied, dissatisfied, moderately satisfied, satisfied, very much satisfied).
The aim of this method is to aggregate individual judgments into a collective value function, so that the global satisfaction is dependent on n criteria/variables, which represent certain distinguishing dimensions of services or products. MUSA evaluates both global and partial satisfaction functions Y * and X i * , while subjects’ judgments are represented by Y and Xi. It follows the principles of ordinal regression analysis under constraints and uses linear programming techniques [54]. The equation of ordinal regression analysis takes the following form:
Y * = i = 1 n b i X i * with   i = 1 n b i
where n represents the number of criteria and bi is the weight of the criterion i. Additionally, the value functions ( Y * and X i * ) refer to the non-decreasing functions in the ordinal scales Y and Xi that occur in the interval [0, 100] [54].
The citizens’ satisfaction evaluation problem may be considered a linear program (LP) where our aim is to reduce, as much as possible, the errors under the following constraints:
(a)
Ordinal regression Equation (1) applied to every respondent,
(b)
normalization constraints for Y * and X i * .
(c)
Monotonicity constraints are applied for Y * and X i * .
Introducing a set of transformation variables, it is possible to remove the monotonicity constraints and reduce the size of this optimization model. Transformation variables, w i k and z m , represent the consecutive stages of value functions Y * and X i * . The final LP becomes:
min F = j = 1 M σ j + + σ j s u b j e c t t o i = 1 n k = 1 t i j 1 w i k m = 1 t j 1 z m σ j + + σ j = 0 , j m = 1 a 1 z m = 100 i = 1 n k = 1 t i j 1 w i k = 100 z m , w i k , σ j + , σ j 0 i , j , k , m
where M represents the number of citizens. Under the assumption that Y* and Xi* are monotonic and are strictly increasing functions, it is possible to develop a generalized MUSA model. This also enables us to prevent any possible unsteadiness, in which the best solution of LP gives bi = 0, for certain criteria or y*m = y*m + 1, xi*k = xi*k+1. In the following equation, a represents global satisfaction levels whereas ai represents satisfaction levels for the ith criterion. Considering the hypothesis of strict preferences, the following can be stated:
y * m < y * m + 1 y m   y m + 1 ,   for   m = 1 , 2 , , α 1 x i * k < x i * k + 1   x i k x i k + 1 ,   for   k = 1 , 2 , , α i 1   and   i = 1 , 2 , , n
where ≺ means ‘strictly less preferred’. Therefore, the preference conditions become the following [54]:
y * m + 1 y * m γ z m γ ,   for   m = 1 , 2 , , α 1 x i * k + 1 x i * k γ i   w i k γ i ,   for   k = 1 , 2 , , α i 1   and   i = 1 , 2 , , n
The MUSA method yields useful results such as the value/satisfaction functions that indicate the actual value in a normalized interval [0, 100] which citizens attribute to the global or partial ordinal satisfaction scale’s level [54,55]. The shape of the functions shows citizens’ degree of demanding; in other words, the level that citizens are demanding with regard to the provided service/product. More analytically, the value function of neutral citizens takes a linear shape, indicating the higher expressed satisfaction of citizens, and infers that the biggest part of their expectations is met. The value function of demanding citizens is convex, indicating they are dissatisfied unless they receive the highest possible level of service quality. The value function of non-demanding citizens is concave, indicating citizens expressed satisfaction despite that only a small portion of their expectations is met.
Criteria weights (bi) are also very important results of the MUSA method as they indicate the relative importance of the examined satisfaction dimensions, assuming i = 1 n b i = 1 [54].
Moreover, this method yields normalized indices, which allows us to scrutinize the satisfaction measurement problem. Perhaps, the most typical indices involve the average satisfaction indices that indicate the mean value of the overall or marginal satisfaction functions, S and Si, respectively. These can be regarded as the rudimental average performance indices.
The MUSA method also provides the estimation of demanding indices, which refer to the quantitative measure for the concept of citizens’ demanding level.
The normalization of the average demanding indices occurs in the interval [−1, 1] and the following cases apply:
  • D = 1 or Di = 1: Citizens are highly demanding.
  • D = 0 or Di = 0: Citizens are neutral in terms of how demanding they are.
  • D = −1 or Di = −1: Citizens are slightly demanding.
Demanding indices may be used to analyze citizen behavior because they can show how much improvement effort is required; that is, the greater the value of the demanding index, the more the satisfaction level of citizens must be enhanced to correspond to citizens’ needs and expectations.
In addition, this method also estimates improvement indices. Simultaneously, the output for improvement efforts is reliant on the significance of satisfaction dimensions as well as the contribution they make to dissatisfaction. Moreover, the average improvement indices point to the improvement margins for a certain criterion, while they are normalized in the interval [0, 1] and are estimated according to this equation:
I i = b i 1 S i   for   i = 1 , 2 , , n   where
I i = 1 b i = 1   and   S i = 0 I i = 0 b i = 0   or   S i = 1   for   i = 1 , 2 , , n
Through the combination of the above indices, the method develops two highly useful diagrams; that is, action and improvement diagrams. Action diagrams are quite similar to a SWOT analysis and schematically present the strengths, weaknesses, opportunities, and threats of an organization. They can be described as a type of importance-performance analysis. Action diagrams are simple but highly useful as they show the strong and weak points of satisfaction, while pointing to the efforts that are necessary to improve satisfaction [21,54]. In other words, they indicate those satisfaction dimensions that ought to be enhanced.
Action diagrams are four-quadrant diagrams that are based on performance (described as high/or low) and importance (described also as high/or low), and can be used to organize improvement actions. In the status quo quadrant, both performance and importance are low. Criteria located in this quadrant do not call for any particular action for the simple reason that they are not considered important by respondents. That being said, due to the dynamic nature of these diagrams, criteria in this quadrant can also be viewed as potential threats in the future [51].
In the leverage opportunity quadrant, both the performance and the importance are high. As the name of this quadrant suggests, the criteria that are located here should be leveraged as advantages against competition and the high performance of these criteria should be maintained. The action opportunity quadrant presents high importance/low performance. These criteria call for immediate attention and actions must focus on these criteria in order to improve the performance of the organization. Finally, in the transfer resources quadrant, performance is high, but importance is low, meaning that the organization utilizes resources to achieve high importance in criteria that, however, are not significant. For this reason, resources allocated for criteria in this quadrant should be transferred to the criteria in the action opportunity quadrant whose satisfaction dimensions need to be improved.
Action diagrams can show the satisfaction dimensions that must be improved (Figure 1). However, they cannot indicate the level or extent of improvement efforts [21]. The latter task is achieved by the improvement diagrams, which are developed by combining the average effectiveness and demanding indices. Therefore, improvement diagrams can be used to rank improvement priorities [56].
As Figure 2 shows, improvement diagrams are also four-quadrant diagrams and are based on the effectiveness (described as high/or low) and the level that citizens are demanding (described as high/or low). This diagram helps us prioritize improvement priorities, as described in Figure 2.

4. Results

4.1. Sociodemographic Characteristics of the Citizen Sample

Socio-demographic variables collected in the present study include gender, age, occupation, education level, family status, number of children, place of residence, and annual income. In Table 1, it can be observed that women outnumbered (51.6%) their male counterparts by 3.2 percentage units. In terms of age, the most represented age group was 41 to 50 years old (27.9%). Moreover, significant yet lower shares of respondents belonged to the age groups of 31–40 (22.1%), 18–30 (21.9%), and 51–60 (18.3%). As few as 9.8% were older than 60 years.
Concerning occupation, the shares of respondents employed in the private (21.2%) and public (19.9%) sectors were higher compared to other occupations in the sample. In terms of education level, the highest shares of respondents were recorded for university graduates (22.3%) and upper secondary school graduates (20.8%), followed by primary school graduates (17.6%). As for family status, more than half the respondents reported being married (51%) and a substantial share reported having two children (28.3%); while considerable shares reported having one child (14.1%) and three children (10.9%). The section of questions collecting the socio-demographic variables of the sample was completed with respondents’ place of residence and income. The majority of respondents lived in urban areas (64.1%). Finally, 28.5% of respondents reported yearly earnings between 10,001 and 20,000 Euros, and 20.1% reported earning between 5001 and 10,000 Euros per year; whereas only 3.8% earned more than 30,000 Euros per year (Table 1).

4.2. Citizens’ Satisfaction with Renewable Energy Investments

Τhe questionnaire included a multivariate question that examined citizens’ satisfaction with the state in terms of its actions (criteria) to facilitate investments in renewable energy. Descriptive statistics showed that citizens expressed low levels of satisfaction with the examined actions. In particular, citizens were dissatisfied with the stability of the Greek energy policy (64.4%), the licensing process (62.9%), the measures for reducing the monopoly of fossil fuels (61.7%), and the policies and measures for improving the competitiveness of renewables in the energy market (61.2%) (Table 2).
Then, the MUSA method was performed to further scrutinize citizens’ satisfaction with the state. The estimated value functions are among the most significant results of the MUSA, because they indicate the real value (in a normalized interval [0, 100]), which individuals (in this case citizens) ascribe to every level of the global or partial ordinal satisfaction scale. In addition, the shape of the functions shows the degree by which citizens are characterized as demanding. In relation to the examined dimensions, in Figure 3, it can be observed that moving from the lowest level of satisfaction to the next, the value does not increase sharply until the fourth level (‘satisfied’) where an increase is observed. The average index of demanding is 0.280 and, due to the sign of this value, it can be considered that citizens are slightly demanding. This outcome implies that the Greek state could keep citizens satisfied by minimally improving the level of service quality regarding the eight examined criteria.
Regarding the contribution of the eight examined criteria to citizens’ overall satisfaction (Table 3), the analysis showed that, apart from one criterion, most criteria contribute equally to citizen satisfaction. Specifically, most criteria weights were around 10–14%, whereas the licensing process had the highest weight (weight 19.6%) indicating that this criterion contributes mostly to overall satisfaction. This finding suggests that the state should pay attention to all criteria, and somewhat more to the licensing process, because all criteria are important to citizens and determine their satisfaction with the state’s actions for renewable energy investments.
It is also important to describe the results of the average satisfaction indices (Table 3). The average global satisfaction index stands at a fairly low level, around 30%, indicating that overall citizens are not satisfied with the state in terms of the actions it undertook to facilitate citizen investments in RES. The satisfaction indices for the examined criteria indicate the level of partial satisfaction of citizens according to each of the examined criterion. The lowest satisfaction index was recorded for the licensing process (15.3%). Low satisfaction indices were also found for the measures for mitigating the monopoly of fossil fuels (such as the reduction of subsidies for fossil fuels) (21.8%), the policies and measures for improving the competitiveness of renewables in the energy market (25.1%), and the incentives for investing in RES (such as tax exemptions) (25.4%). Citizens expressed slightly higher satisfaction for subsidies for investments in renewable energy and the investment climate (improved regulatory measures, access to national credit), as the satisfaction indices for these criteria were estimated at 29.5% and 29.1%, respectively.
The MUSA method yielded two useful diagrams, the action and improvement diagrams (Figure 4 and Figure 5, respectively). To develop the action diagram, criteria weights and average satisfaction indices were combined (Table 3) whereas, to develop the improvement diagram, the average demanding and effectiveness indices were combined (Table 4).
Based on the action diagram (Figure 4) the following can be observed:
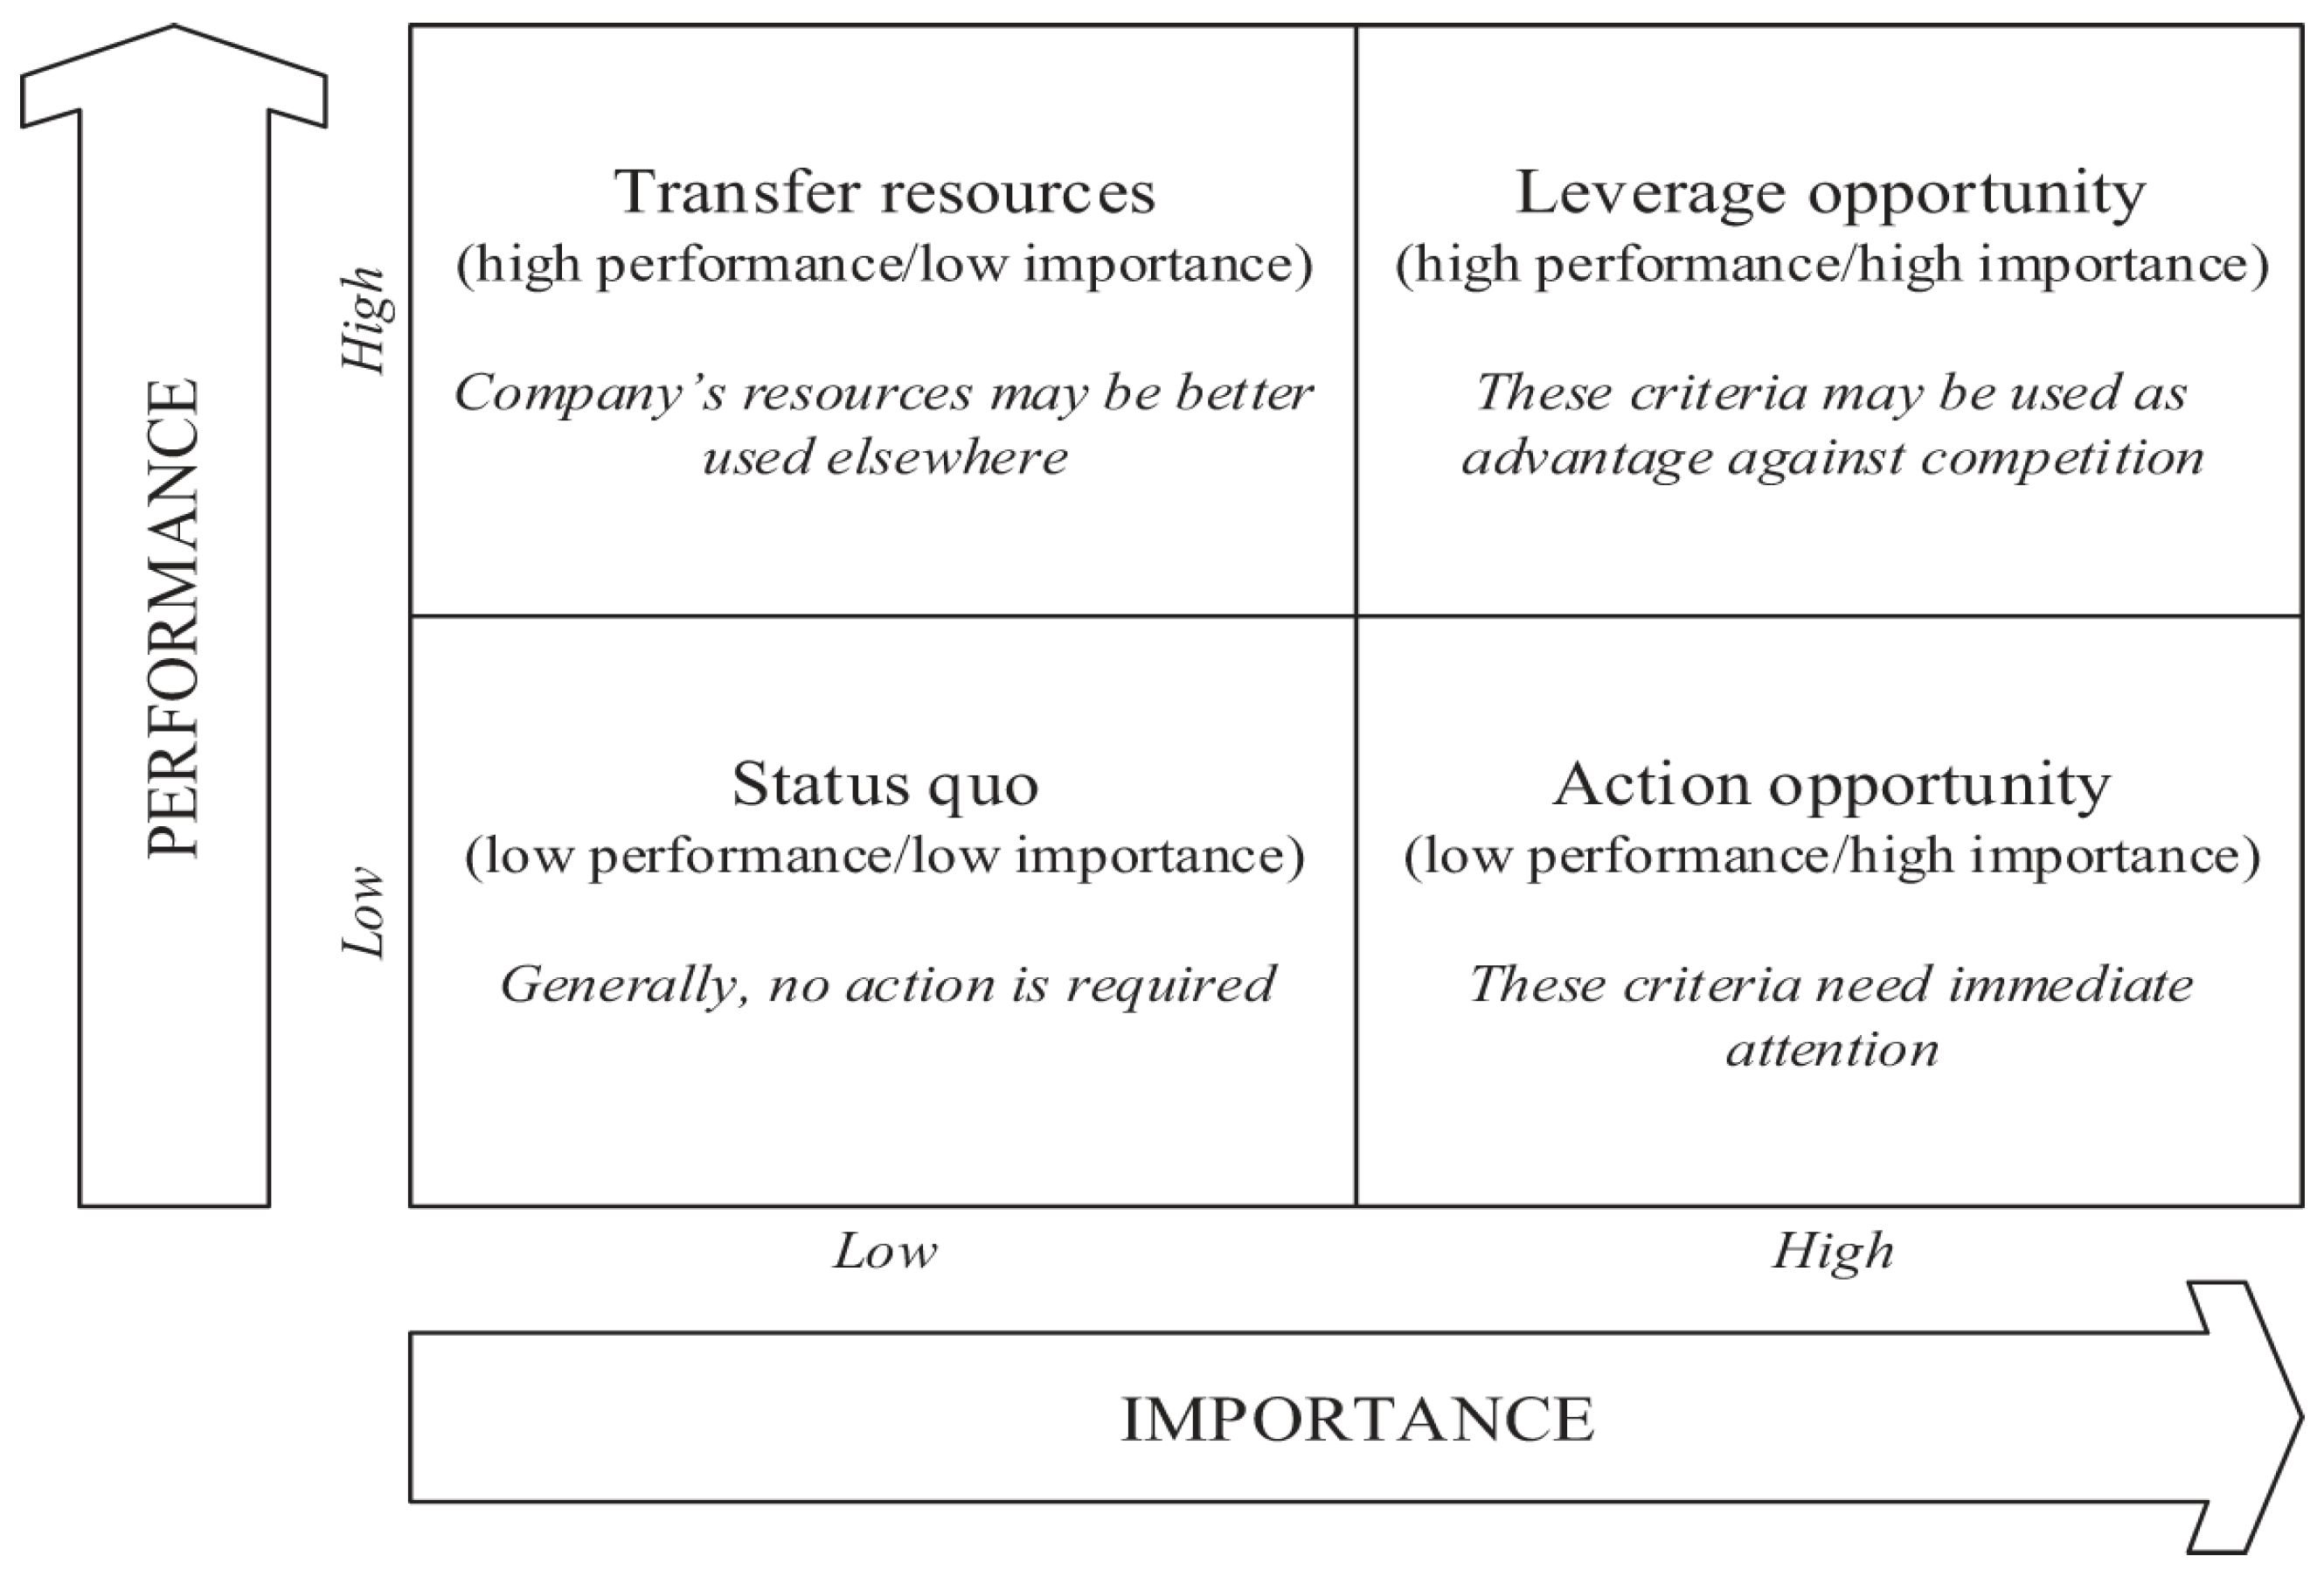
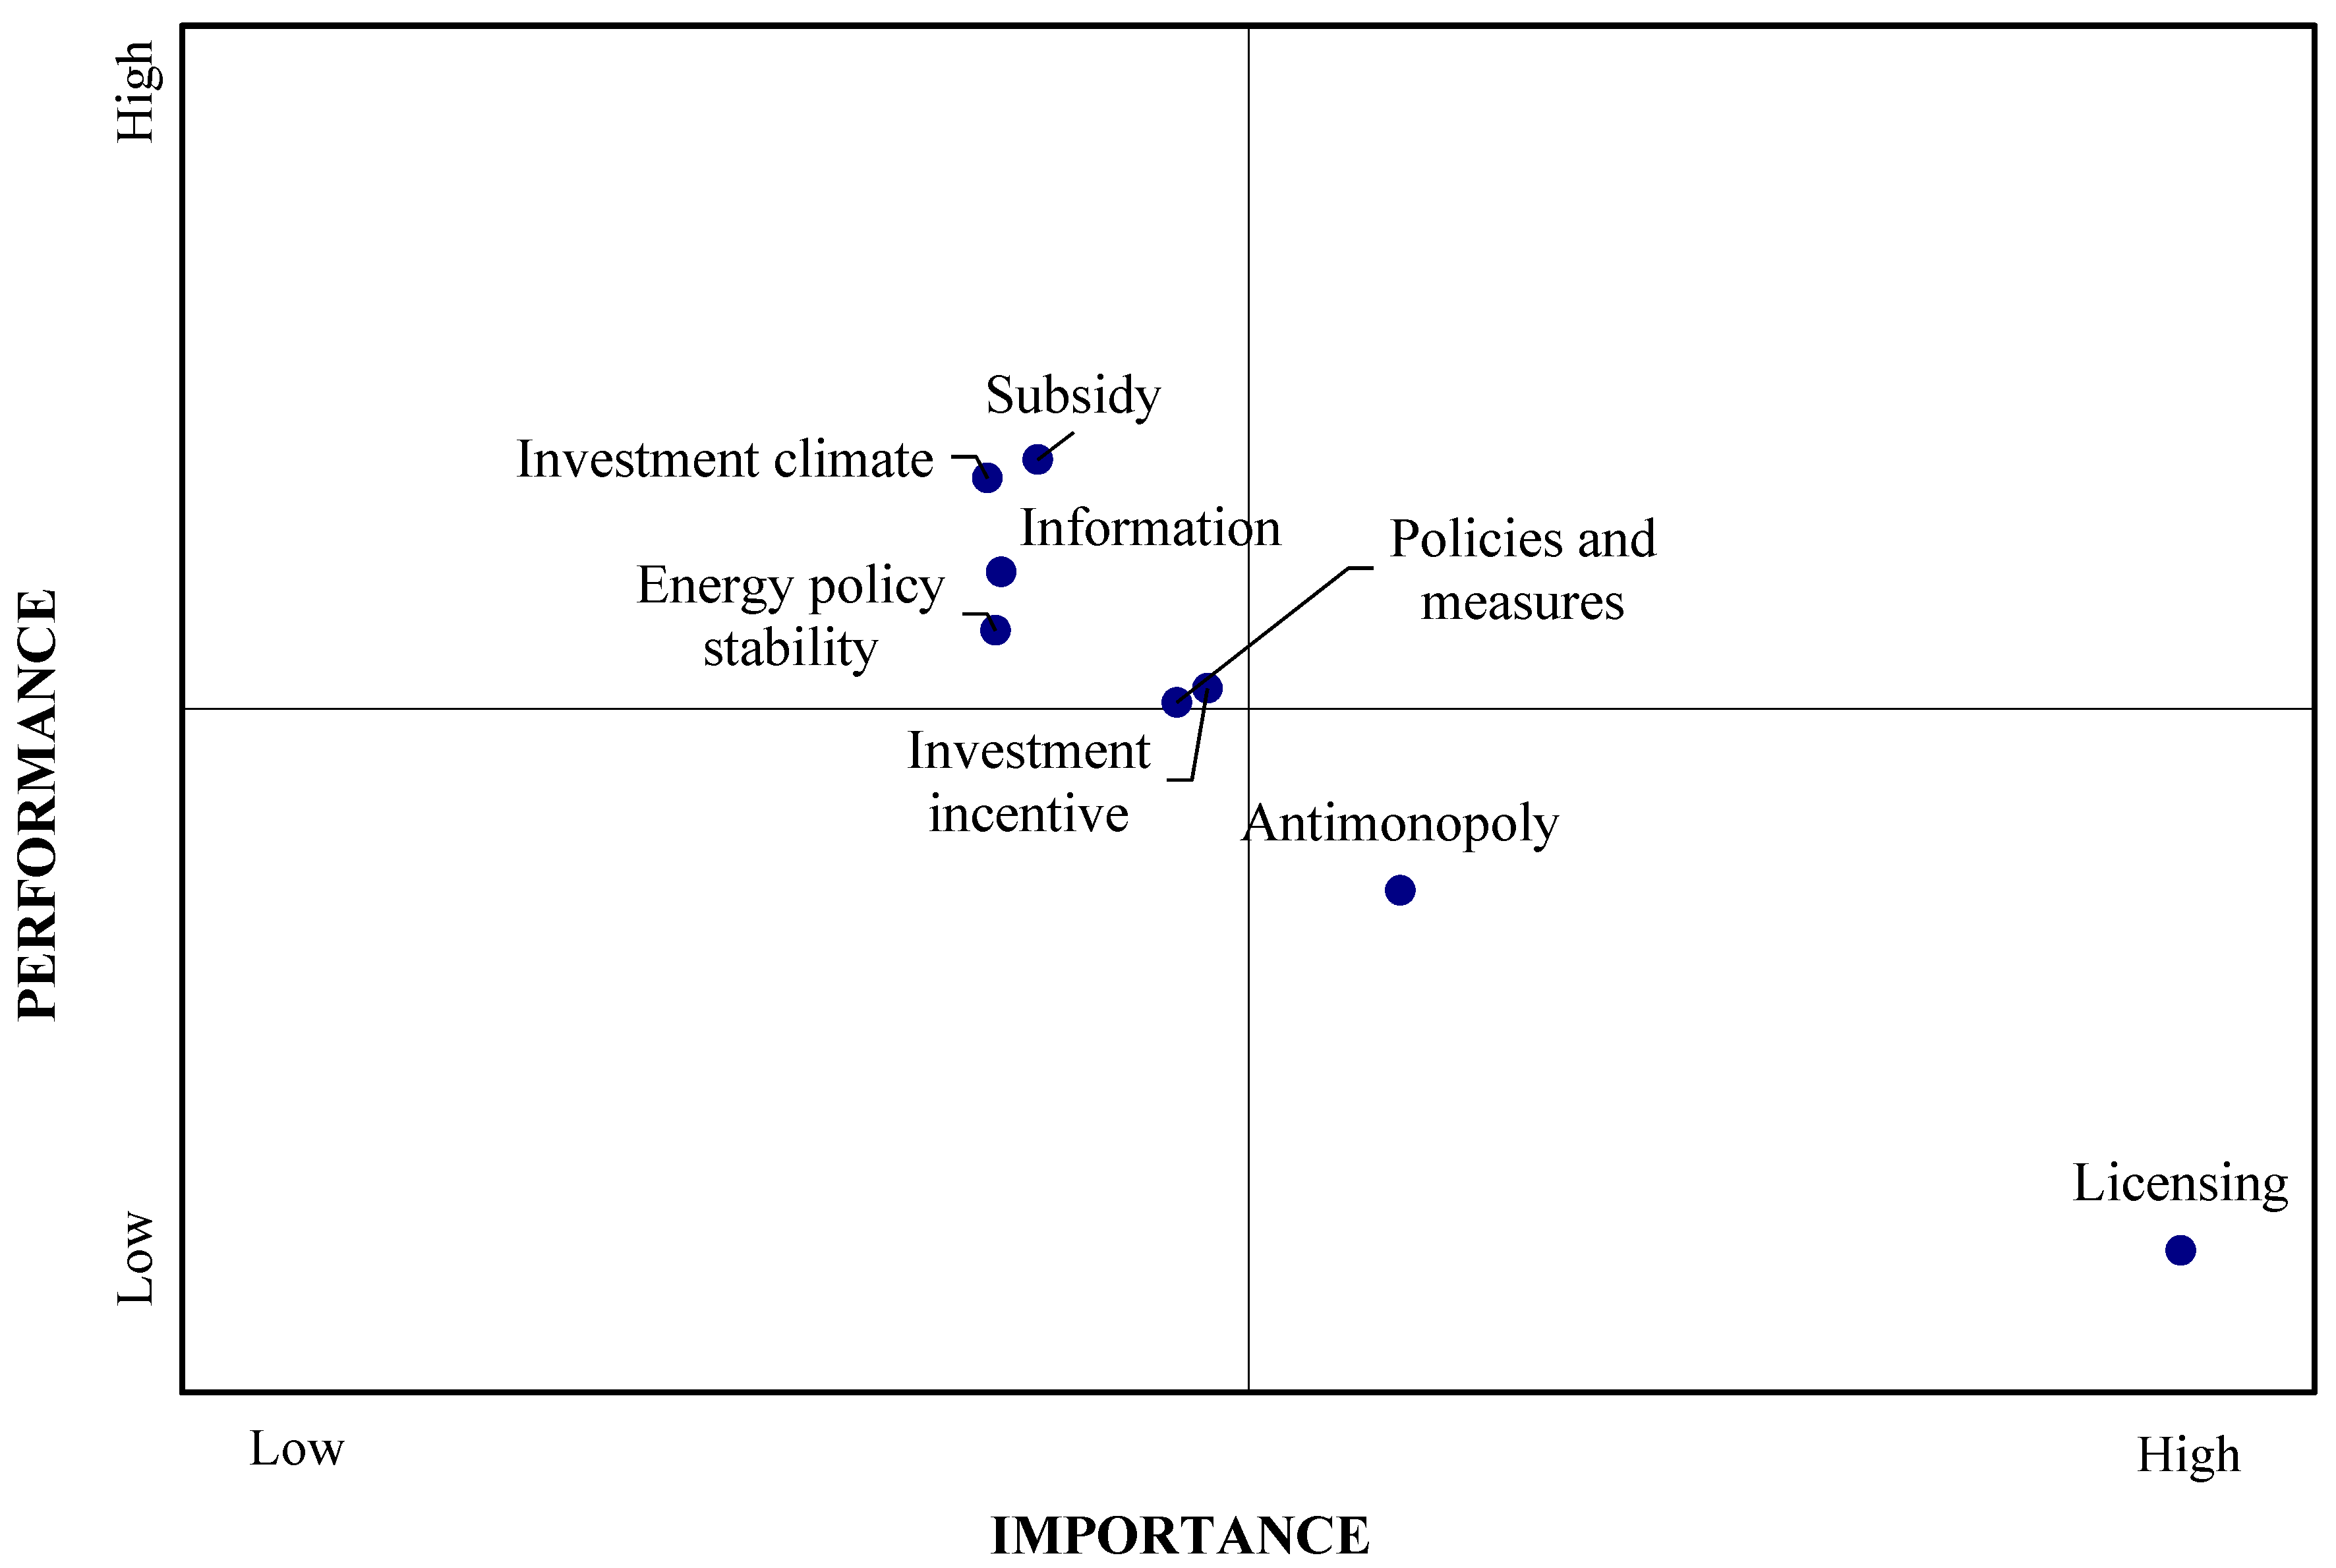
  • Analyzing the area of action opportunity, the analysis brings to the surface the weaknesses regarding the Greek state’s actions to facilitate investments in renewable energy. It can be observed that the licensing process along with the measures for mitigating the monopoly of fossil fuels (such as the reduction of subsidies for fossil fuels) are the only criteria that are located in the action opportunity quadrant (low performance/high importance). This location indicates that it is necessary to pay immediate attention to these particular criteria and improve them because they are critical to citizens’ satisfaction, while presenting the lowest satisfaction indices.
  • Subsidies for investments in RES, the stability of energy policy, the provided information on investments in renewable energy, and the investment climate are clearly located in the transfer resources quadrant, which is characterized by high performance and low importance. This result shows that the state pays attention to criteria that, in comparison to other criteria, are less important for citizens’ satisfaction. Resources that the state allocates to these criteria may be transferred to more important criteria that have low satisfaction indices; that is, resources should be transferred and used for the improvement of criteria that concern the licensing process along with the measures for mitigating the monopoly of fossil fuels. It should also be noted that there are two more criteria but are located too close to the intersection of axes and fall marginally into this quadrant; these criteria involve investment incentives along with policies and measures for improving the competitiveness of renewables in the energy market.
  • It can be observed that there are no criteria in the leverage opportunity quadrant (high performance/high importance) and in the status quo quadrant (low performance/low importance). In relation to the leverage opportunity quadrant, the lack of criteria suggests that there are no strategic advantages that the state could use in the competition against renewable energy investments.
  • Finally, a gap is generally observed. Citizens are highly dissatisfied with the most important criteria and less dissatisfied with the less important criteria.
Based on the improvement diagram (Figure 5), it is possible to rank improvement priorities. More specifically:
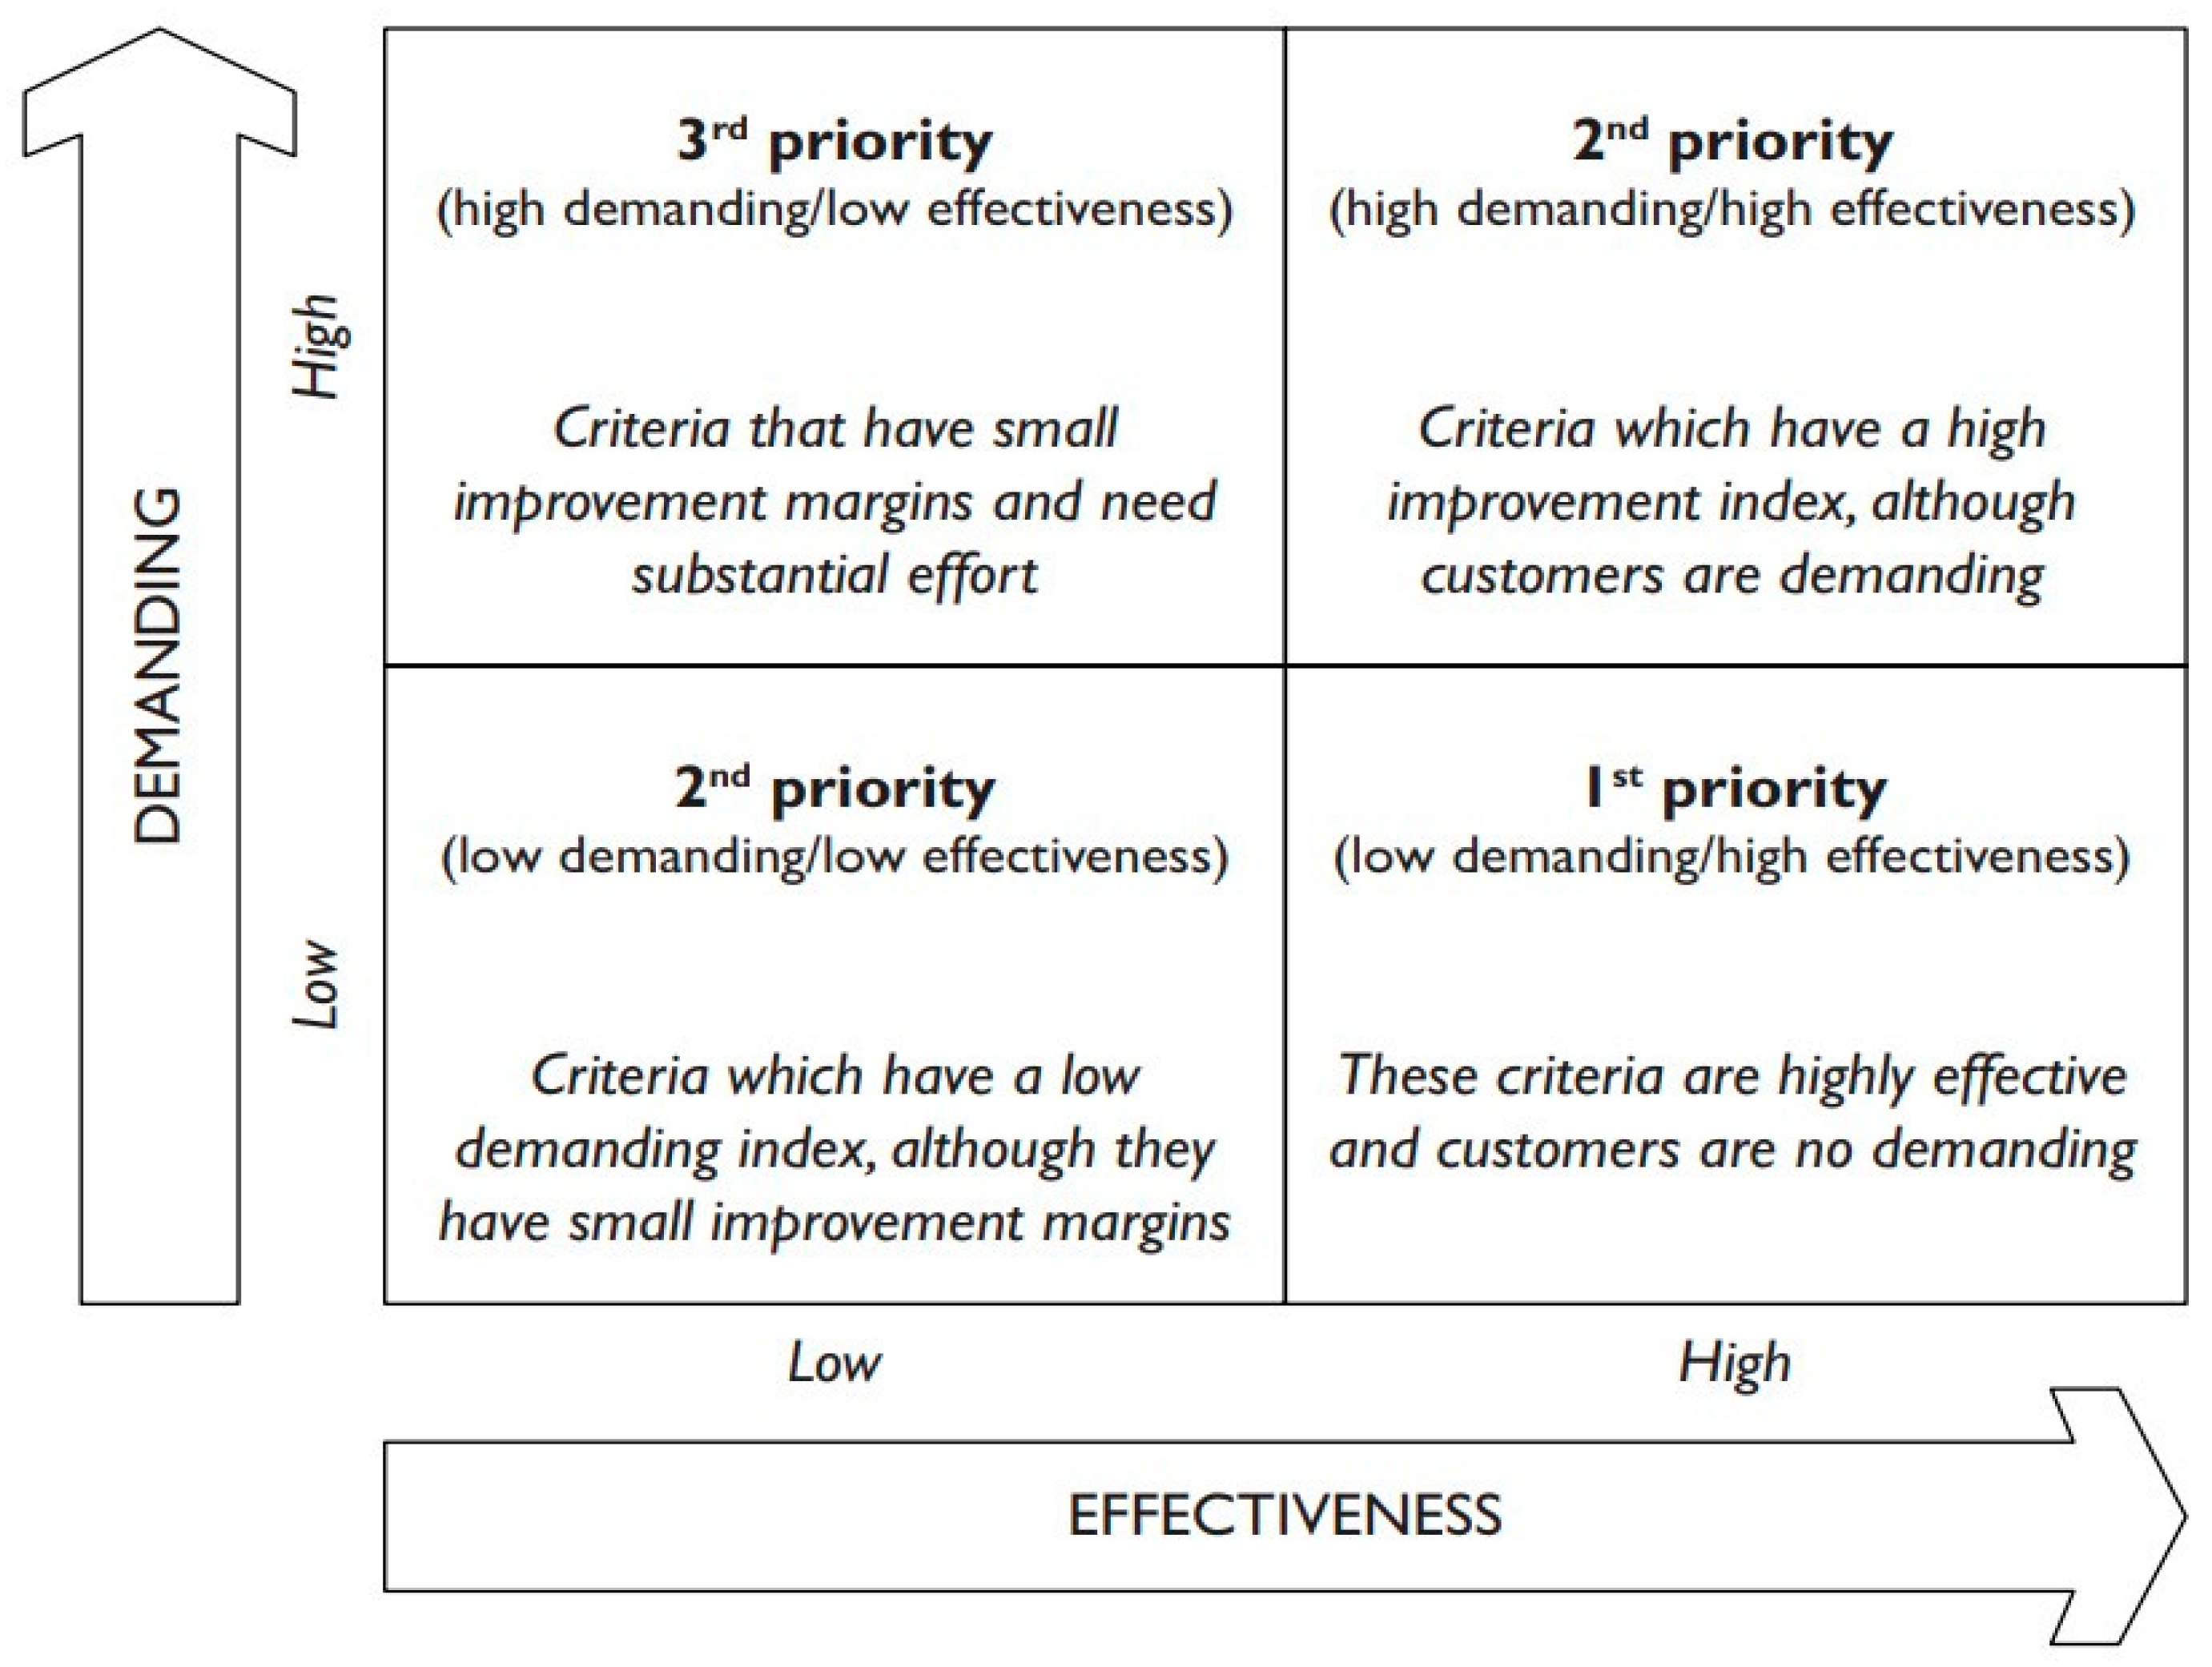
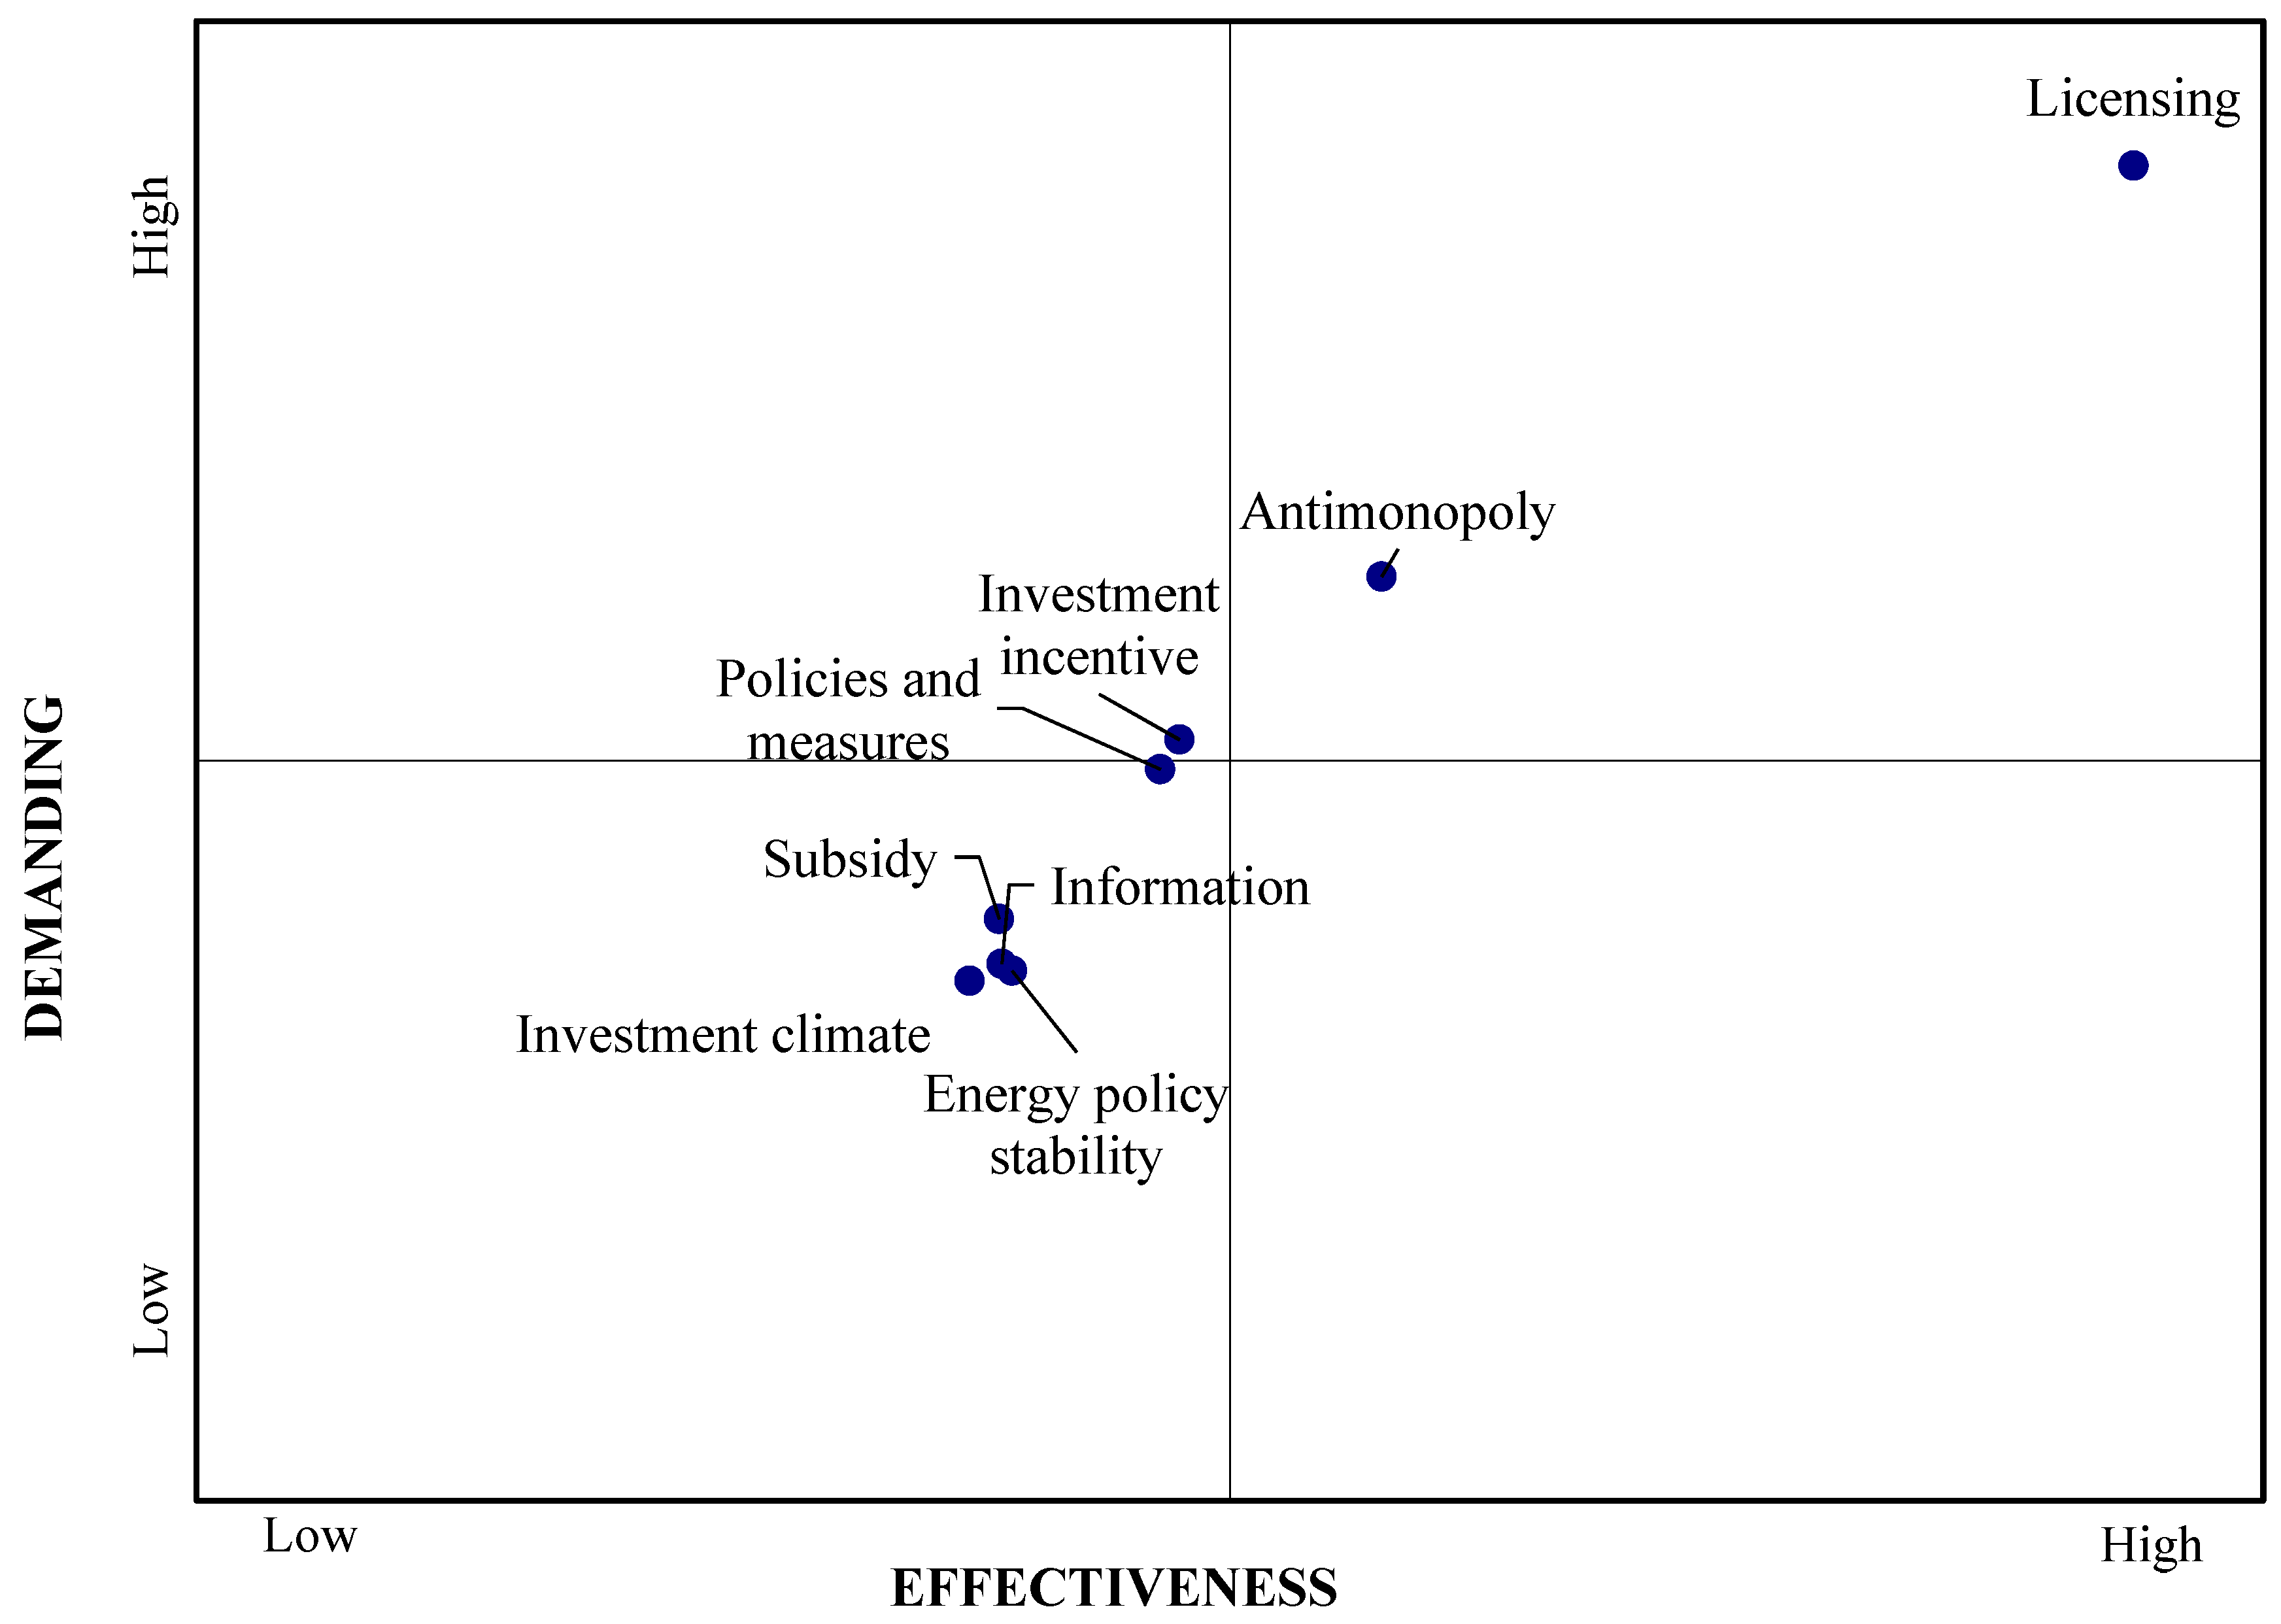
  • The measures for mitigating the monopoly of fossil fuels (such as the reduction of subsidies for fossil fuels) along with the licensing process appear in the second-priority quadrant (high demanding/high effectiveness). This location indicates that citizens are highly demanding in terms of these two criteria;thus, the state needs to exert significant effort in order to increase satisfaction with these criteria.
  • The investment climate, the stability of the energy policy in Greece, the subsidies for investments, and the provided information about investments in renewable energy are located in the second-priority quadrant (low demanding/low effectiveness);thus, they are of secondary importance. In other words, this location reveals a low demanding index and small improvement margins; indicating, in essence, that with little effort, the effectiveness is low.
  • It should also be noted that there are two criteriafor which it is difficult to infer their location. Specifically, the policies and measures for improving the competitiveness of renewables in the energy market as well as the investment incentives are located very close to the axis between the third- and the second-priority quadrants. However, it is likely that the investment incentives criterion falls marginally within the third-priority quadrant, which suggests that the priority for improving these criteria should be ranked lower than the other criteria. In addition, this location means that these criteria have small improvement margins and call for considerable effort.

5. Discussion

As with any type of product or service, satisfaction may be a significant parameter in the establishment of an attractive investment environment for renewable energy investors. At the same time, satisfaction analysis is a practical way to ascertain whether the policies in place are efficient. Satisfaction analysis, however, not only identifies the policy areas that require improvement to satisfy citizens, but may also be used strategically to serve critical purposes [24,25,26] that stretch beyond the need to raise financial resources for RES projects. That is, citizen satisfaction can help build and preserve a trustful relationship between citizens and governments, while it may also enhance citizen willingness to accept and even support RES development plans [24,25].
Nevertheless, the empirical literature on renewable energy investments have focused on other areas with most research works having examined the profile of investors as well as the influence of sociodemographic, attitudinal, social, and financial variables on investment decisions [5,6,7,8,9,10,12,13,14,15,16,17,18,19,38,40]. However, respondents in this study exhibited different levels of satisfaction with the examined investment attributes, suggesting that satisfaction may also affect citizens’ investment decisions apart from the variables that had been studied until today. Seen from this perspective, satisfaction may be the missing component in understanding what drives citizens to invest, and it may be what turns willingness-to-invest into actual investment.
The potential benefits of citizen satisfaction bring forward the need to pay attention to those factors/criteria, which exert the strongest influence on satisfaction, but may be neglected in current policymaking. To that end, results from this study have provided a spherical and reliable feedback system explicitly for investments in renewable energy that can be easily used by policymakers to understand the steps they should take to address weaknesses [49,54]. Interestingly, citizens assigned great value to the licensing process, policies mitigating the monopolies of fossil fuels, and improving the competitiveness of RES in the energy market as well as the incentives provided for RES investments. Since these factors are greatly important in satisfaction with RES investments, it is possible that they affect investment decisions as well; thus, stronger policy responses to these factors may be necessary. In relation to incentives, the provision of incentives or government bonuses for housing retrofits have already been identified as positive factors in RES investors’ decision-making [40,41]. Although incentives have been applied widely to attract investments, many EU countries have decided to curtail them because they were economically unviable [17]. Nevertheless, our results suggest that incentives are important for citizen satisfaction and could positively affect investment decisions.
In practical terms, the action diagram identified the areas of underperformance which require immediate policy attention. The licensing process along with the measures for mitigating the monopoly of fossil fuels were the only criteria located in the action opportunity quadrant meaning that they are critical to citizens’ satisfaction and require immediate improvement. A possible explanation for the low satisfaction with the licensing process is that citizens may regard it as time consuming and complicated although it has been simplified considerably over the last years [34]. Moreover, the high importance that citizens attached to the establishment of policies for mitigating the monopoly of fossil fuels is consistent with the findings of Masini and Menichetti [42] who observed that the existence of policies supporting renewable investments can drive citizen investment in certain renewable types. Hence, citizens in different countries seem to be affected by the wider policy context surrounding RES investments. It is also worth noting that the absence of criteria in the leverage opportunity quadrant of the action diagram suggests that there is a lack of strategic advantages that could be used in the competition against renewable energy investments. It is, therefore, possible that there may be challenges in strengthening the competitive advantage of RES investments over the competition with other types of investment.
Another result that should be discussed concerns the criteria located in the transfer resources quadrant of the action diagram. In this quadrant, the criteria, which have low weight and only have a slight effect on satisfaction, included, inter alia, subsidies and information provision. A strategic action for the state would thus be to transfer resources from these criteria and allocate them to the criteria that require immediate attention such as the licensing process and measures for mitigating the monopoly of fossil fuels. In addition, the demanding level of citizens, which indicates the difficulty in fulfilling their expectations, may be used as a segmentation criterion along with other criteria (such as demographic and psychographic variables) to group potential investors or provide a more insightful investor profile analysis. In this analysis, citizens were identified as slightly demanding meaning that they can be satisfied, even if only a small portion of their expectation is fulfilled. Hence, the Greek state needs to exert minimal effort to increase citizen satisfaction and correspond to their expectations.
Finally, certain limitations and directions for future studies should be stated. Regarding limitations, respondents in this study were not investors, but citizens who have not invested in renewables. Citizens were thus treated as ‘potential investors’ although not all of them were necessarily interested in investing. The rationale was that, with the right policies and changes in the existing policy framework, citizens may invest in renewable energy and, in this way, finance the transition to a renewable-based energy system. Another limitation was that this study was conducted before the energy crisis due to the conflict in Ukraine and, consequently, it is possible that citizens’ attitudes towards RES investments may have been affected due to the subsequent fluctuations in energy prices. In terms of future research, the value functions obtained by the MUSA method are, in essence, utility functions and can be used to investigate the degree by which citizens perceive RES investments as risky investments. Moreover, in order to form a comprehensive picture of satisfaction over RES investments, similar studies could be performed on other RES investor groups, such as firms and municipalities.

6. Conclusions

The analysis in this paper has addressed citizen satisfaction with RES investments for the first time and provided relevant knowledge for improving the investment environment. Satisfaction can be a critical tool in policy decision-making since measuring and analyzing satisfaction with investments can identify whether implemented policies are correct and what needs to be improved to correspond to citizens’ needs and expectations. In other words, insights into satisfaction can inform policy decisions in ways that fulfill citizens’ investment expectations, while such decisions in the long run may enhance the investment environment and perhaps build trustful relationships between citizens and governments which, in turn, may enhance citizen acceptance of RES development plans. The results illustrate that citizens are generally not satisfied with the state’s actions regarding RE investments; thus, highlighting the need for improving those aspects that mostly affect satisfaction actions. Dissatisfaction was recorded for various aspects but, most importantly, for the bureaucratic and time-consuming licensing process that citizens must carry out to complete their investment. These results suggest that the current licensing process needs to be simplified perhaps through establishing simpler and quicker procedures, such as one-stop-shop systems. In addition, citizens were dissatisfied with the adequacy of policies aiming at mitigating the monopolies of fossil fuels and improving the competitiveness of renewables in the energy market as well as the adequacy of incentives for renewable investments. These should be treated as areas of under-performance that also require careful policy responses. A strategic action based on our results would be to transfer resources from less important investment aspects to those that were shown to be more important for citizen satisfaction. To conclude, satisfaction seems to be a promising angle for renewable energy investments and may be used along other variables (such as sociodemographic and psychographic attributes) in the analysis of investor profiles as a means to attract investments as well as a policy tool to build trustful relationships between citizens and governments.

Author Contributions

Conceptualization, E.K.; methodology, E.K.; software, E.G. and E.K.; validation, E.K.; formal analysis, E.K.; investigation, E.K.; resources, E.K.; data curation, E.K.; writing—original draft preparation, E.K.; writing—review and editing, E.K.; visualization, E.K.; supervision, G.T., E.G. and S.G. All authors have read and agreed to the published version of the manuscript.

Funding

This research received no external funding.

Data Availability Statement

Data available upon request.

Conflicts of Interest

The authors declare no conflict of interest.

References

  1. Chassot, S.; Hampl, N.; Wüstenhagen, R. When energy policy meets free-market capitalists: The moderating influence of worldviews on risk perception and renewable energy investment decisions. Energy Res. Soc. Sci. 2014, 3, 143–151. [Google Scholar] [CrossRef]
  2. European Commission A Policy Framework for Climate and Energy in the Period from 2020 to 2030: COM(2014) 15 Final. Available online: https://eur-lex.europa.eu/legal-content/EN/TXT/?uri=COM:2014:15:FIN (accessed on 15 March 2023).
  3. European Commission Directive (EU) 2018/2001 of the European Parliament and of the Council of 11 December 2018 on the Promotion of the Use of Energy from Renewable Sources. Available online: https://eur-lex.europa.eu/legal-content/EN/TXT/PDF/?uri=CELEX:52014DC0015&from=EN (accessed on 15 March 2023).
  4. Greek Ministry of Environment and Energy. Available online: https://ec.europa.eu/energy/sites/ener/files/el_final_necp_main_en.pdf (accessed on 15 March 2023).
  5. Wilson, C.; Dowlatabadi, H. Models of Decision Making and Residential Energy Use. Annu. Rev. Environ. Resour. 2007, 32, 169–203. [Google Scholar] [CrossRef]
  6. Aguilar, F.X.; Cai, Z. Exploratory analysis of prospects for renewable energy private investment in the U.S. Energy Econ. 2010, 32, 1245–1252. [Google Scholar] [CrossRef]
  7. Shwom, R.; Lorenzen, J.A. Changing household consumption to address climate change: Social scientific insights and challenges. Wiley Interdiscip. Rev. Clim. Chang. 2012, 3, 379–395. [Google Scholar] [CrossRef]
  8. Gamel, J.; Menrad, K.; Decker, T. Is it really all about the return on investment? Exploring private wind energy investors’ preferences. Energy Res. Soc. Sci. 2016, 14, 22–32. [Google Scholar] [CrossRef]
  9. Salm, S.; Hille, S.L.; Wüstenhagen, R. What are retail investors’ risk-return preferences towards renewable energy projects? A choice experiment in Germany. Energy Policy 2016, 97, 310–320. [Google Scholar] [CrossRef]
  10. Sirr, G.; Power, B.; Ryan, G.; Eakins, J.; O’Connor, E.; le Maitre, J. An analysis of the factors affecting Irish citizens’ willingness to invest in wind energy projects. Energy Policy 2023, 173, 113364. [Google Scholar] [CrossRef]
  11. Curtin, J.; McInerney, C.; Gallachóir, B.Ó.; Salm, S. Energizing local communities—What motivates Irish citizens to invest in distributed renewables? Energy Res. Soc. Sci. 2019, 48, 177–188. [Google Scholar] [CrossRef]
  12. Gamel, J.; Menrad, K.; Decker, T. Which factors influence retail investors’ attitudes towards investments in renewable energies? Sustain. Prod. Consum. 2017, 12, 90–103. [Google Scholar] [CrossRef]
  13. Faiers, A.; Neame, C. Consumer attitudes towards domestic solar power systems. Energy Policy 2006, 34, 1797–1806. [Google Scholar] [CrossRef]
  14. Jager, W. Stimulating the diffusion of photovoltaic systems: A behavioural perspective. Energy Policy 2006, 34, 1935–1943. [Google Scholar] [CrossRef]
  15. Yildiz, Ö. Financing renewable energy infrastructures via financial citizen participation–The case of Germany. Renew. Energy 2014, 68, 677–685. [Google Scholar] [CrossRef]
  16. Vasseur, V.; Kemp, R. A segmentation analysis: The case of photovoltaic in the Netherlands. Energy Effic. 2015, 8, 1105–1123. [Google Scholar] [CrossRef]
  17. De Groote, O.; Pepermans, G.; Verboven, F. Heterogeneity in the adoption of photovoltaic systems in Flanders. Energy Econ. 2016, 59, 45–57. [Google Scholar] [CrossRef]
  18. Strazzera, E.; Statzu, V. Fostering photovoltaic technologies in Mediterranean cities: Consumers’ demand and social acceptance. Renew. Energy 2017, 102, 361–371. [Google Scholar] [CrossRef]
  19. Ebers Broughel, A.; Hampl, N. Community financing of renewable energy projects in Austria and Switzerland: Profiles of potential investors. Energy Policy 2018, 123, 722–736. [Google Scholar] [CrossRef]
  20. Pyrgou, A.; Kylili, A.; Fokaides, P.A. The future of the Feed-in Tariff (FiT) scheme in Europe: The case of photovoltaics. Energy Policy 2016, 95, 94–102. [Google Scholar] [CrossRef]
  21. Grigoroudis, E.; Politis, Y. Multiple Criteria Approaches for Customer Satisfaction Measurement. In Preference Disaggregation in Multiple Criteria Decision Analysis; Springer: Cham, Switzerland, 2018; pp. 95–123. [Google Scholar]
  22. Polemis, M.L.; Spais, A. Disentangling the drivers of renewable energy investments: The role of behavioral factors. Bus. Strateg. Environ. 2020, 29, 2170–2180. [Google Scholar] [CrossRef]
  23. Gerson, R. Measuring Customer Satisfaction: A Guide to Managing Quality Service; Crisp Publications: Menlo Park, CA, USA, 1993. [Google Scholar]
  24. Kampen, J.K.; Van De Walle, S.; Bouckaert, G. Assessing the Relation between Satisfaction with Public Service Delivery and Trust in Government: The Impact of the Predisposition of Citizens toward Government on Evaluations of its Performance. Public Perform. Manag. Rev. 2006, 29, 387–404. [Google Scholar]
  25. Beeri, I.; Uster, A.; Vigoda-Gadot, E. Does Performance Management Relate to Good Governance? A Study of Its Relationship with Citizens’ Satisfaction with and Trust in Israeli Local Government. Public Perform.\Manag. Rev. 2019, 42, 241–279. [Google Scholar] [CrossRef]
  26. Morgeson, F.V.; Petrescu, C. Do they all perform alike? An examination of perceived performance, citizen satisfaction and trust with US federal agencies. Int. Rev. Adm. Sci. 2011, 77, 451–479. [Google Scholar] [CrossRef]
  27. Simoglou, C.K.; Biskas, P.N. Assessment of the impact of the National Energy and Climate Plan on the Greek power system resource adequacy and operation. Electr. Power Syst. Res. 2021, 194, 107113. [Google Scholar] [CrossRef]
  28. Kaldellis, J.K.; Zafirakis, D.; Kondili, E. Contribution of lignite in the Greek electricity generation: Review and future prospects. Fuel 2009, 88, 475–489. [Google Scholar] [CrossRef]
  29. Kaldellis, J.; Zafirakis, D. Experimental investigation of the optimum photovoltaic panels’ tilt angle during the summer period. Energy 2012, 38, 305–314. [Google Scholar] [CrossRef]
  30. International Energy Agency. Greece 2017 Review; International Energy Agency: Paris, France, 2017. [Google Scholar]
  31. PPC The Leading Electricity Company. Available online: https://www.dei.gr/en/ppc-group/ppc/ (accessed on 10 November 2022).
  32. Hellenic Association for Energy Economics. Greek Energy Market Report; Hellenic Association for Energy Economics: Athens, Greece, 2022. [Google Scholar]
  33. REN21. Renewables 2020 Global Status Report; REN21: Paris, France, 2020; ISBN 978-3-948393-00-7. [Google Scholar]
  34. Angelopoulos, D.; Doukas, H.; Psarras, J.; Stamtsis, G. Risk-based analysis and policy implications for renewable energy investments in Greece. Energy Policy 2017, 105, 512–523. [Google Scholar] [CrossRef]
  35. Cia Alves, E.E.; Steiner, A.; de Almeida Medeiros, M.; da Silva, M.E.A. From a breeze to the four winds: A panel analysis of the international diffusion of renewable energy incentive policies (2005–2015). Energy Policy 2019, 125, 317–329. [Google Scholar] [CrossRef]
  36. Ministry of Environment and Energy. Ministry Overview; Ministry of Environment and Energy: Tokyo, Japan, 2022.
  37. Wüstenhagen, R.; Menichetti, E. Strategic choices for renewable energy investment: Conceptual framework and opportunities for further research. Energy Policy 2012, 40, 1–10. [Google Scholar] [CrossRef]
  38. Menyeh, B.O. Financing electricity access in Africa: A choice experiment study of household investor preferences for renewable energy investments in Ghana. Renew. Sustain. Energy Rev. 2021, 146, 111132. [Google Scholar] [CrossRef]
  39. Wu, J.; Zhang, B. Is local grid parity affordable in China? Discussion on the regional wind power potential and investment returns under policy uncertainty. Energy Policy 2022, 170, 113254. [Google Scholar] [CrossRef]
  40. Vasseur, V.; Kemp, R. The adoption of PV in the Netherlands: A statistical analysis of adoption factors. Renew. Sustain. Energy Rev. 2015, 41, 483–494. [Google Scholar] [CrossRef]
  41. Dolores, L.; Macchiaroli, M.; De Mare, G. Financial Impacts of the Energy Transition in Housing. Sustainability 2022, 14, 4876. [Google Scholar] [CrossRef]
  42. Masini, A.; Menichetti, E. Investment decisions in the renewable energy sector: An analysis of non-financial drivers. Technol. Forecast. Soc. Chang. 2013, 80, 510–524. [Google Scholar] [CrossRef]
  43. Hellenic Statistical Authority. Announcement on the Publication of the Revised 2011 Census Tables; Hellenic Statistical Authority: Piraeus, Greece, 2011. [Google Scholar]
  44. Kotroni, V.; Lagouvardos, K.; Lykoudis, S. High-resolution model-based wind atlas for Greece. Renew. Sustain. Energy Rev. 2014, 30, 479–489. [Google Scholar] [CrossRef]
  45. Willis, K.; Scarpa, R.; Gilroy, R.; Hamza, N. Renewable energy adoption in an ageing population: Heterogeneity in preferences for micro-generation technology adoption. Energy Policy 2011, 39, 6021–6029. [Google Scholar] [CrossRef]
  46. Crano, W.D.; Brewer, M.B.; Lac, A. Principles and Methods of Social Research, 3rd ed.; Routledge: London, UK, 2015; ISBN 9780415638562. [Google Scholar]
  47. Pagano, M.; Gauvreau, K.; Mattie, H. Principles of Biostatistics; Chapman and Hall/CRC: Boca Raton, FL, USA, 2022; ISBN 9780429340512. [Google Scholar]
  48. Bryman, A. Social Research Methods—Oxford University Press; Oxford University Press: Oxford, UK, 2016. [Google Scholar]
  49. Manolitzas, P.; Yannacopoulos, D. Citizen Satisfaction: A Multicriteria Satisfaction Analysis. Int. J. Public Adm. 2013, 36, 614–621. [Google Scholar] [CrossRef]
  50. Manolitzas, P.; Kostagiolas, P.; Grigoroudis, E.; Intas, G.; Stergiannis, P. Data on patient’s satisfaction from an emergency department: Developing strategies with the Multicriteria Satisfaction Analysis. Data Br. 2018, 21, 956–961. [Google Scholar] [CrossRef]
  51. Kitsios, F.C.; Grigoroudis, E. Evaluating service innovation and business performance in tourism: A multicriteria decision analysis approach. Manag. Decis. 2020, 58, 2429–2453. [Google Scholar] [CrossRef]
  52. Glaveli, N.; Manolitzas, P.; Grigoroudis, E. Developing strategies to increase the possibility of being selected as a “regular” independent community pharmacy: An application of MUlticriteria Satisfaction Analysis. J. Pharm. Pract. Res. 2021, 51, 160–164. [Google Scholar] [CrossRef]
  53. Manolitzas, P.; Glaveli, N.; Palamas, S.; Talias, M.; Grigoroudis, E. Hotel guests’ demanding level and importance of attribute satisfaction ratings: An application of MUltiplecriteria Satisfaction Analysis on TripAdvisor’s hotel guests ratings. Curr. Issues Tour. 2021, 25, 1203–1208. [Google Scholar] [CrossRef]
  54. Grigoroudis, E.; Siskos, Y. Preference disaggregation for measuring and analysing customer satisfaction: The MUSA method. Eur. J. Oper. Res. 2002, 143, 148–170. [Google Scholar] [CrossRef]
  55. Matsatsinis, N.; Grigoroudis, E. Preference Disaggregation in Multiple Criteria Decision Analysis: Essays in Honor of Yannis Siskos; Springer International Publishing: Cham, Switzerland, 2018.
  56. Manolitzas, P.; Grigoroudis, E.; Matsatsinis, N. Using Multicriteria Decision Analysis to Evaluate Patient Satisfaction in a Hospital Emergency Department. J. Health Manag. 2014, 16, 245–258. [Google Scholar] [CrossRef]
Figure 1. Action diagram (source: Grigoroudis and Siskos [21]).
Energies 16 03979 g001
Figure 2. Improvement diagram (source: Kitsios and Grigoroudis [51]).
Energies 16 03979 g002
Figure 3. Global value function regarding citizens’ satisfaction with the state’s actions to facilitate renewable energy investments.
Energies 16 03979 g003
Figure 4. Action diagram: Citizen’s satisfaction with the state’s actions to facilitate renewable energy investments.
Energies 16 03979 g004
Figure 5. Improvement diagram: Citizens’ demanding level and effectiveness.
Energies 16 03979 g005
Table 1. Sociodemographic characteristics of the sample.
Variables Sample (%)
GenderMale48.4
Female51.6
Age18–3021.9
31–4022.1
41–5027.9
51–6018.3
>609.8
OccupationPublic employee19.9
Private employee21.2
Freelancer12.0
Entrepreneur4.3
Household6.0
Crop farmer5.8
Livestock farmer1.8
Retired15.8
Unemployed13.2
Education levelPrimary school17.6
Lower secondary school7.3
Technical school2.8
Vocational training school7.4
Upper secondary school20.8
Vocational education and training (VET)10.3
University22.3
Master’s degree10.0
Doctoral degree1.6
Family statusUnmarried36.9
Married51.0
Divorced4.9
Widowed7.2
Number of children05.7
114.1
228.3
310.9
43.5
50.6
60.1
70.1
80.1
Place of residenceUrban area64.1
Rural area35.9
Income<5000 Euros11.0
5001–10,000 Euros20.1
10,001–20,000 Euros28.5
20,001–30,000 Euros7.8
>30,000 Euros3.8
Prefer not to disclose28.8
Table 2. Percentage units of respondents’ satisfaction with the state’s actions to facilitate RES investments.
Very DissatisfiedDissatisfiedModerate SatisfactionSatisfiedVery Satisfied
Subsidies for investments in RES22.332.736.17.51.4
Investment incentives (such as tax exemptions)25.133.531.68.71.2
Investment climate (improved regulatory measures, access to national credit)24.334.931.08.61.2
Stability of Greek energy policy30.533.926.28.11.3
Policies and measures for improving the competitiveness of renewables in the energy market26.035.229.87.31.7
Measures for reducing the monopoly of fossil fuels (such as the reduction of subsidies for fossil fuels)27.534.229.07.91.4
Licensing process27.135.828.57.51.2
The provided information on investments in renewable energy27.232.832.27.10.7
Table 3. Criteria weights and average satisfaction indices in relation to citizens’ satisfaction with the state’s action to facilitate renewable energy investments.
CriteriaWeights (%)Average Satisfaction Indices (%)
Subsidies for investments in RES10.929.5
Investment incentives (such as tax exemptions)12.225.4
Investment climate (improved regulatory measures, access to national credit)10.529.1
Stability of Greek energy policy10.626.4
Policies and measures for improving the competitiveness of renewables in the energy market12.025.1
Measures for reducing the monopoly of fossil fuels (such as the reduction of subsidies for fossil fuels)13.721.8
Licensing process19.615.3
The provided information on investments in renewable energy10.627.5
Overall satisfaction23.00
Table 4. Average demanding and impact indices.
CriteriaDemanding Average IndicesImpacts Average Indices
Subsidies for investments in RES0.1200.077
Investment incentives (such as tax exemptions)0.2130.091
Investment climate (improved regulatory measures, access to national credit)0.0880.075
Stability of Greek energy policy0.0930.078
Policies and measures for improving the competitiveness of renewables in the energy market0.1970.090
Measures for reducing the monopoly of fossil fuels (such as the reduction of subsidies for fossil fuels)0.2970.107
Licensing process0.5090.166
The provided information on investments in renewable energy0.0970.077
Disclaimer/Publisher’s Note: The statements, opinions and data contained in all publications are solely those of the individual author(s) and contributor(s) and not of MDPI and/or the editor(s). MDPI and/or the editor(s) disclaim responsibility for any injury to people or property resulting from any ideas, methods, instructions or products referred to in the content.

