Article

Coordinated Voltage Control Strategy by Optimizing the Limited Regulation Capacity of Air Conditioners

1
College of Electronics and Information, Hangzhou Dianzi University, Hangzhou 310018, China
2
Innovation Institute, Hangzhou Dianzi University—Yueqing, Wenzhou 325038, China
*
Author to whom correspondence should be addressed.
Energies 2022, 15(9), 3225; https://doi.org/10.3390/en15093225
Submission received: 6 April 2022 / Revised: 23 April 2022 / Accepted: 25 April 2022 / Published: 28 April 2022
(This article belongs to the Topic Electricity Demand-Side Management)

Abstract

:
The high penetration of distributed renewable energy and the popularization of electric vehicles has led to voltage quality problems in distribution networks. Voltage problems, such as over-voltage, under-voltage, and voltage fluctuations, are increasingly becoming severe. Voltage regulation services play an essential role in improving the power supply quality of the distribution network. The development of information and communication technologies has promoted the upgrading of remote control technology. Air conditioners (ACs) can be easily remote controlled to change the power consumption for voltage regulation services. This study proposes a voltage control strategy by optimizing the limited regulation capacity of ACs. Firstly, a detailed thermal model is developed to analyze the room temperature and the regulation capacity of the ACs. Secondly, a successive voltage regulation algorithm is proposed to solve the voltage problems of the limited regulation capacity of ACs. In addition, the control strategy is developed to exploit the potential of voltage regulation. The control strategy formulates the participation priority of the ACs according to room temperature, which makes the ACs have a long regulation time and prevent the ACs switching working states in the process of voltage regulation. The case studies show that the proposed coordinated voltage regulation strategy can make node voltage restore to a permissible range and make full use of the limited regulation capacity of ACs for voltage control.

1. Introduction

With the rapid development of the photovoltaic (PV) generation industry, the capacity of grid-connected PV generation continues to increase. The intermittent output of PV generation aggravates voltage fluctuations in the distribution network and even causes reverse power flow, leading to over-voltage problems [1]. In addition, in response to the call for energy saving and emission reduction, electric vehicles (EVs) have shown a blowout type growth in recent year. The simultaneous charging of large-scale EVs will cause a significant power flow of the distribution network, leading to under-voltage problems [2]. Over-voltage and under-voltage problems affect the power supply quality of the distribution network and the regular operation of the electrical equipment, and even lead to damage. Therefore, to ensure the voltage quality of the distribution network, voltage regulation services have become more and more critical.
The traditional voltage regulation service is realized through reactive power compensation. The conventional reactive power regulation equipment includes the synchronous compensator [3], the on-load tap changer (OLTC) [4], and the shunt capacitor (SC) [5]. The regulation process of the synchronous compensator and OLTC has hysteresis, leading the equipment to not respond fast to voltage regulation. With the development of power electronics, flexible AC transmission system (FACTS) devices, as alternate, flexible, reliable, and stable VAR (reactive power) compensators, are utilized to solve the voltage problem by optimizing reactive power in the power system [6]. In addition, too much reactive power injection in the distribution network will cause the blockage of the network and increase power loss. The R/X of the distribution line is much larger than the power transmission line [7]. Therefore, compared with reactive power, active power compensation is more effective for voltage regulation in the distribution networks.
In recent years, with the rapid development of information and communication technologies, the user-side flexible loads can participate in demand–response projects [8]. Changing the operating power within a certain period allows the user-side flexible loads to provide voltage regulation services for the distribution network. Therefore, some researchers have focused on using flexible loads to achieve voltage regulation in the distribution network. The authors of [9] developed a voltage management model incorporating flexible loads to achieve a lower voltage network loss and maintain safe voltage levels under a random load demand and renewable power injection. The authors of [10] proposed an innovative methodology to apply flexible loads to enhance ancillary services that mitigate the voltage violations and congestion issues in low voltage distribution networks. Among the numerous demand-side resources, air conditioners (ACs) become more widespread and account for a huge proportion of the daily load [11]. The development of building insulation technology makes the building have a better thermal inertia to store the heat generated by the ACs for a certain period [12]. Therefore, ACs have a vast potential in serving as energy storage devices, which can improve the economic efficiency of the power system [13], balance the power supply and demand [14], and provide ancillary services [8]. When the ACs adjust the power consumption to provide voltage regulation services for the distribution network, the room temperature will not change drastically. Therefore, ACs can become potential voltage regulation resources on the demand side.
In the process of voltage regulation, the power flow of the distribution network should be calculated to obtain the compensation power provided by the ACs. The Newton–Raphson algorithm has good convergence in calculating nonlinear equations, which makes it the most common power flow calculation method [15]. The Newton–Raphson algorithm can calculate the node voltage of the distribution network and obtain the compensation power required by voltage regulation through the sensitivity coefficient matrix [16]. The authors of [17] simplified the calculation process of the sensitivity coefficient matrix, which has a faster convergence speed. However, the compensation power calculated by the sensitivity coefficient matrix is usually much larger than the actual required value, so it requires abundant voltage regulation resources on the node. Additionally, obtaining the sensitivity coefficient matrix needs multiple iterations that increase the computational burden due to the radial topology and intrinsic R/X ratio of the distribution network [18]. The quantity of ACs on the user side is limited. The maximum compensation power provided by the ACs may be far less than the value calculated by the sensitivity coefficient matrix. Therefore, the regulation process should consider the capacity of the ACs. In addition, when the ACs participate in the regulation process, the room temperatures need to be monitored in real-time to guarantee the comfort of the occupants. The equivalent thermal parameter (ETP) model is widely used to calculate the room temperature of the building [19]. The authors of [20] established a first-order thermodynamic equivalent model to estimate the controllable capacity of the air conditioners in peak-valley difference smoothing. The authors of [21] used the equivalent thermal parameter model to estimate room temperature changes in frequency regulation services. The temperature calculation accuracy of the ETP model is related to the complexity of the structure. An accurate model requires a lot of time to optimize the parameters and confirm its validity, so the voltage regulation potential of the ACs cannot be precisely evaluated.
To address the above problems, this paper proposes a coordinated voltage regulation strategy by optimizing the limited regulation capacity of air conditioners. Firstly, a thermal model based on heat loss calculation is built to evaluate the room temperature. Then, the ACs are classified and allocated the optimal regulation power according to the room temperature. Additionally, a successive voltage regulation algorithm is used to calculate the regulation power for the voltage control considering the capacity of the regulation resource. The main contributions of this paper are as follows:
1.
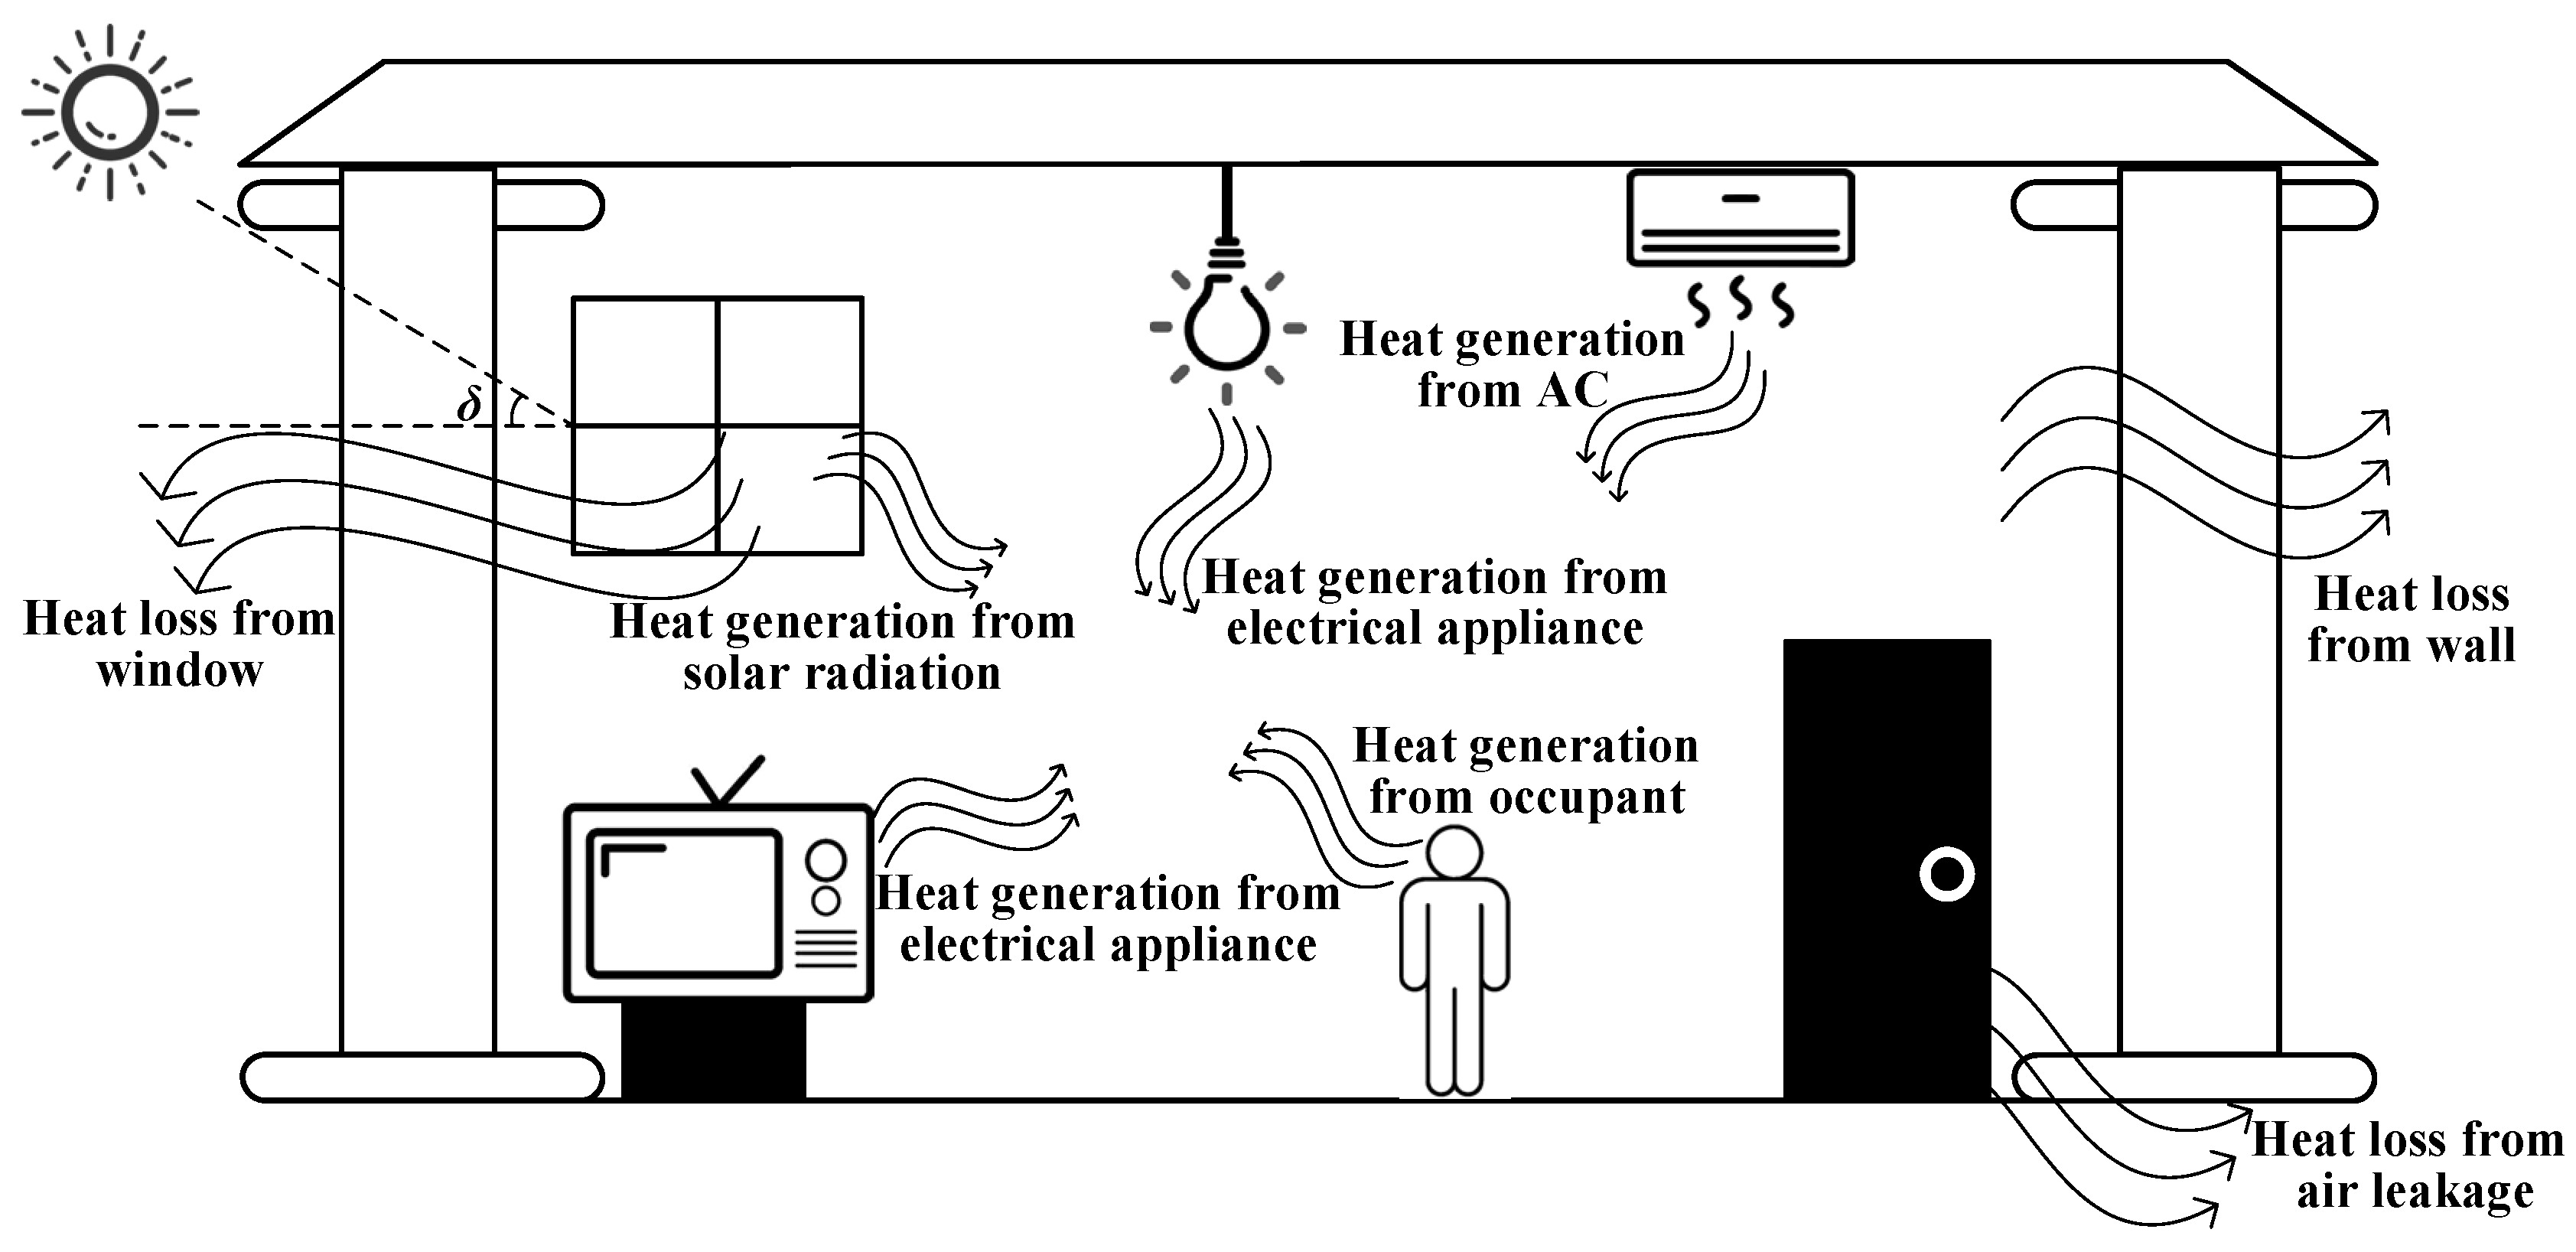
A detailed thermal model based on heat loss calculation is proposed for voltage regulation services, which considers solar radiation, electrical-appliance-emitted heat, and occupant-emitted heat. The model can accurately calculate the room temperature and evaluate the regulation potential of the AC.
2.
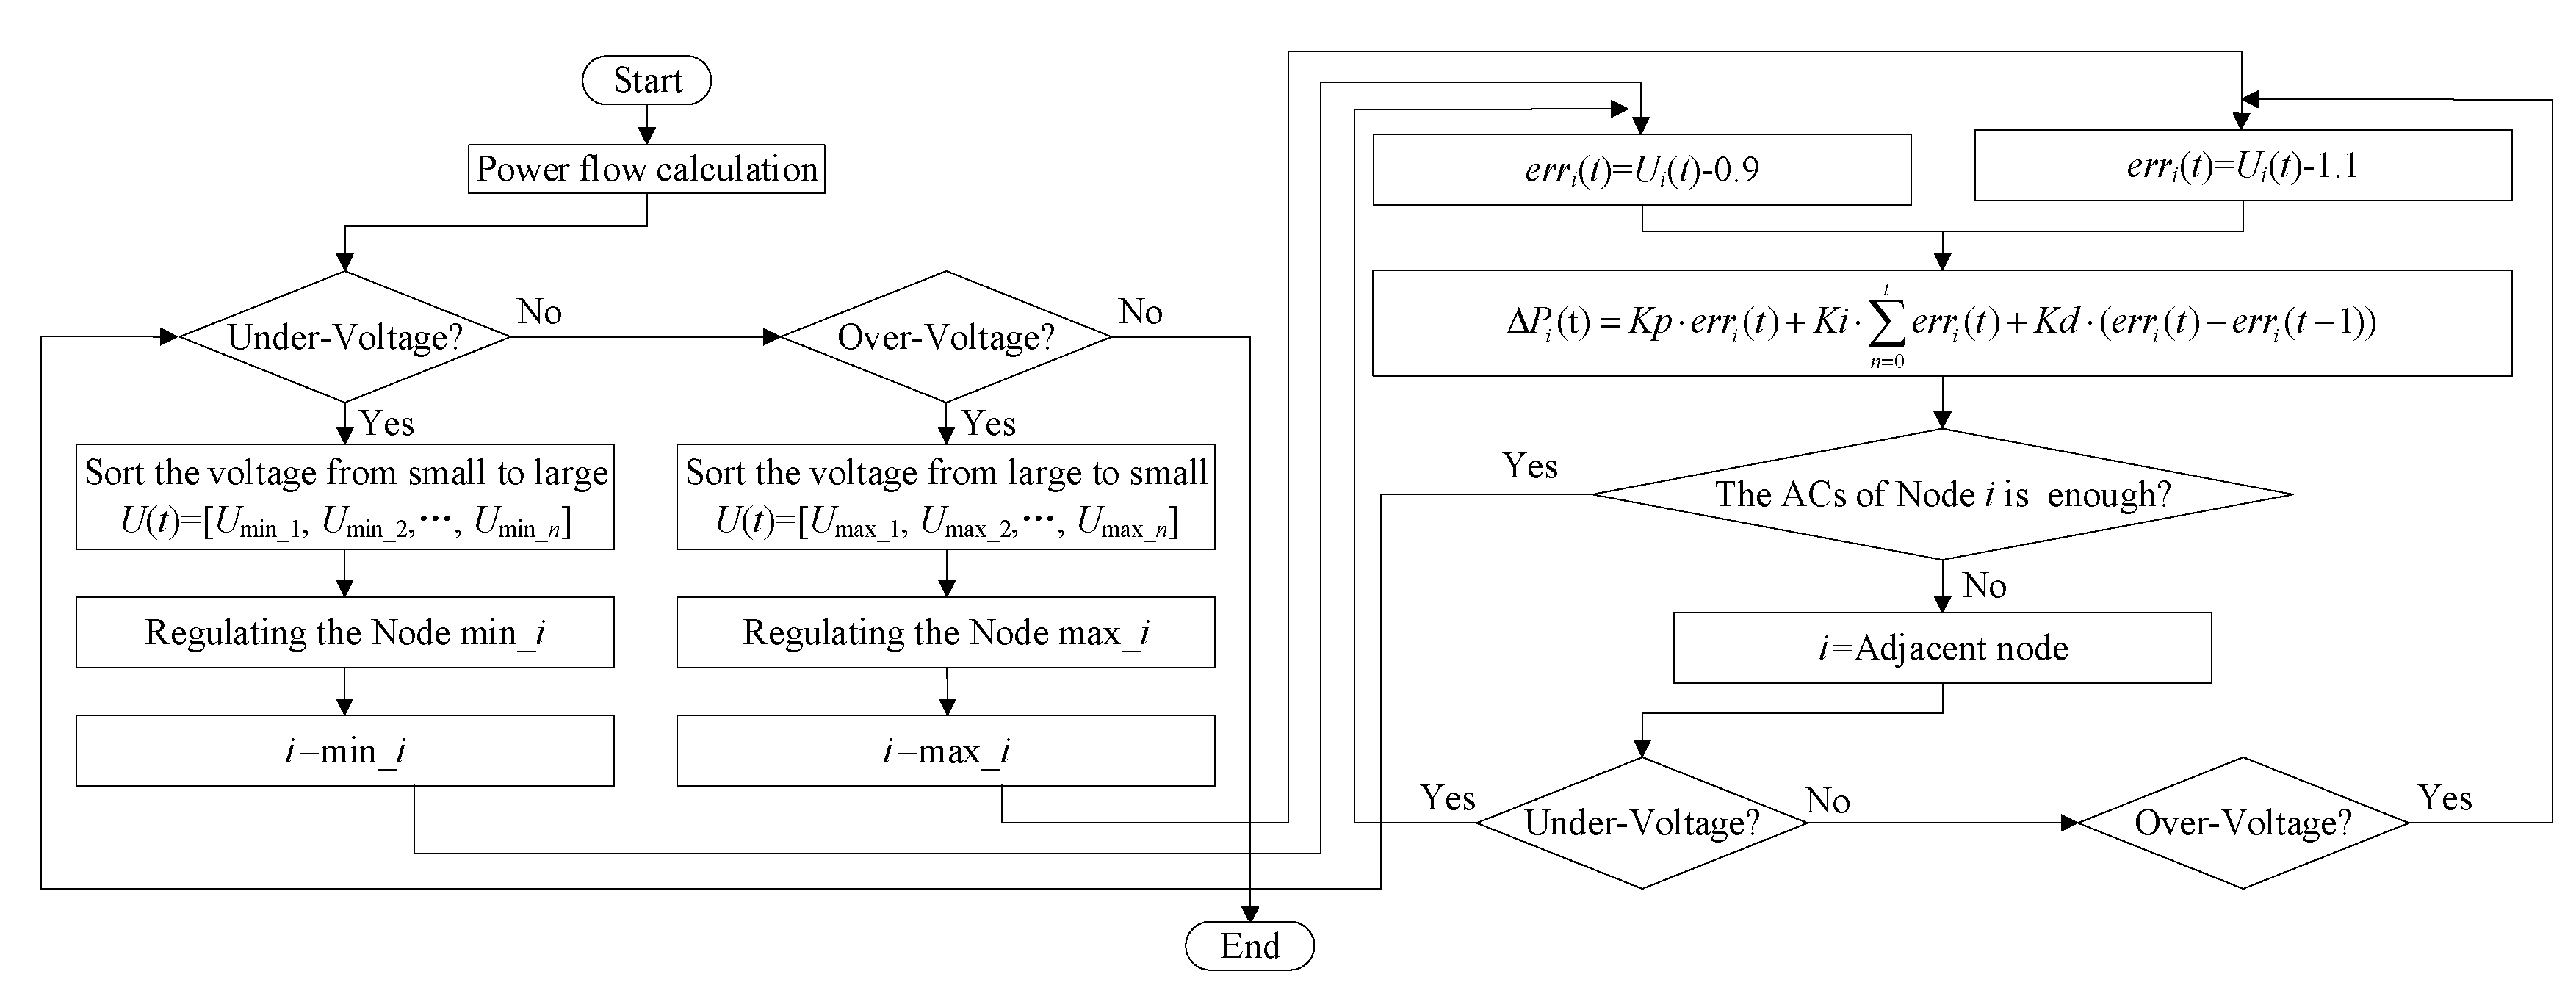
A successive voltage regulation algorithm is proposed to calculate the compensation power considering the capacity of voltage regulation resources on the user side. On the premise of keeping the nodal voltage within the permissible range, the algorithm uses less regulation power to achieve voltage control.
3.
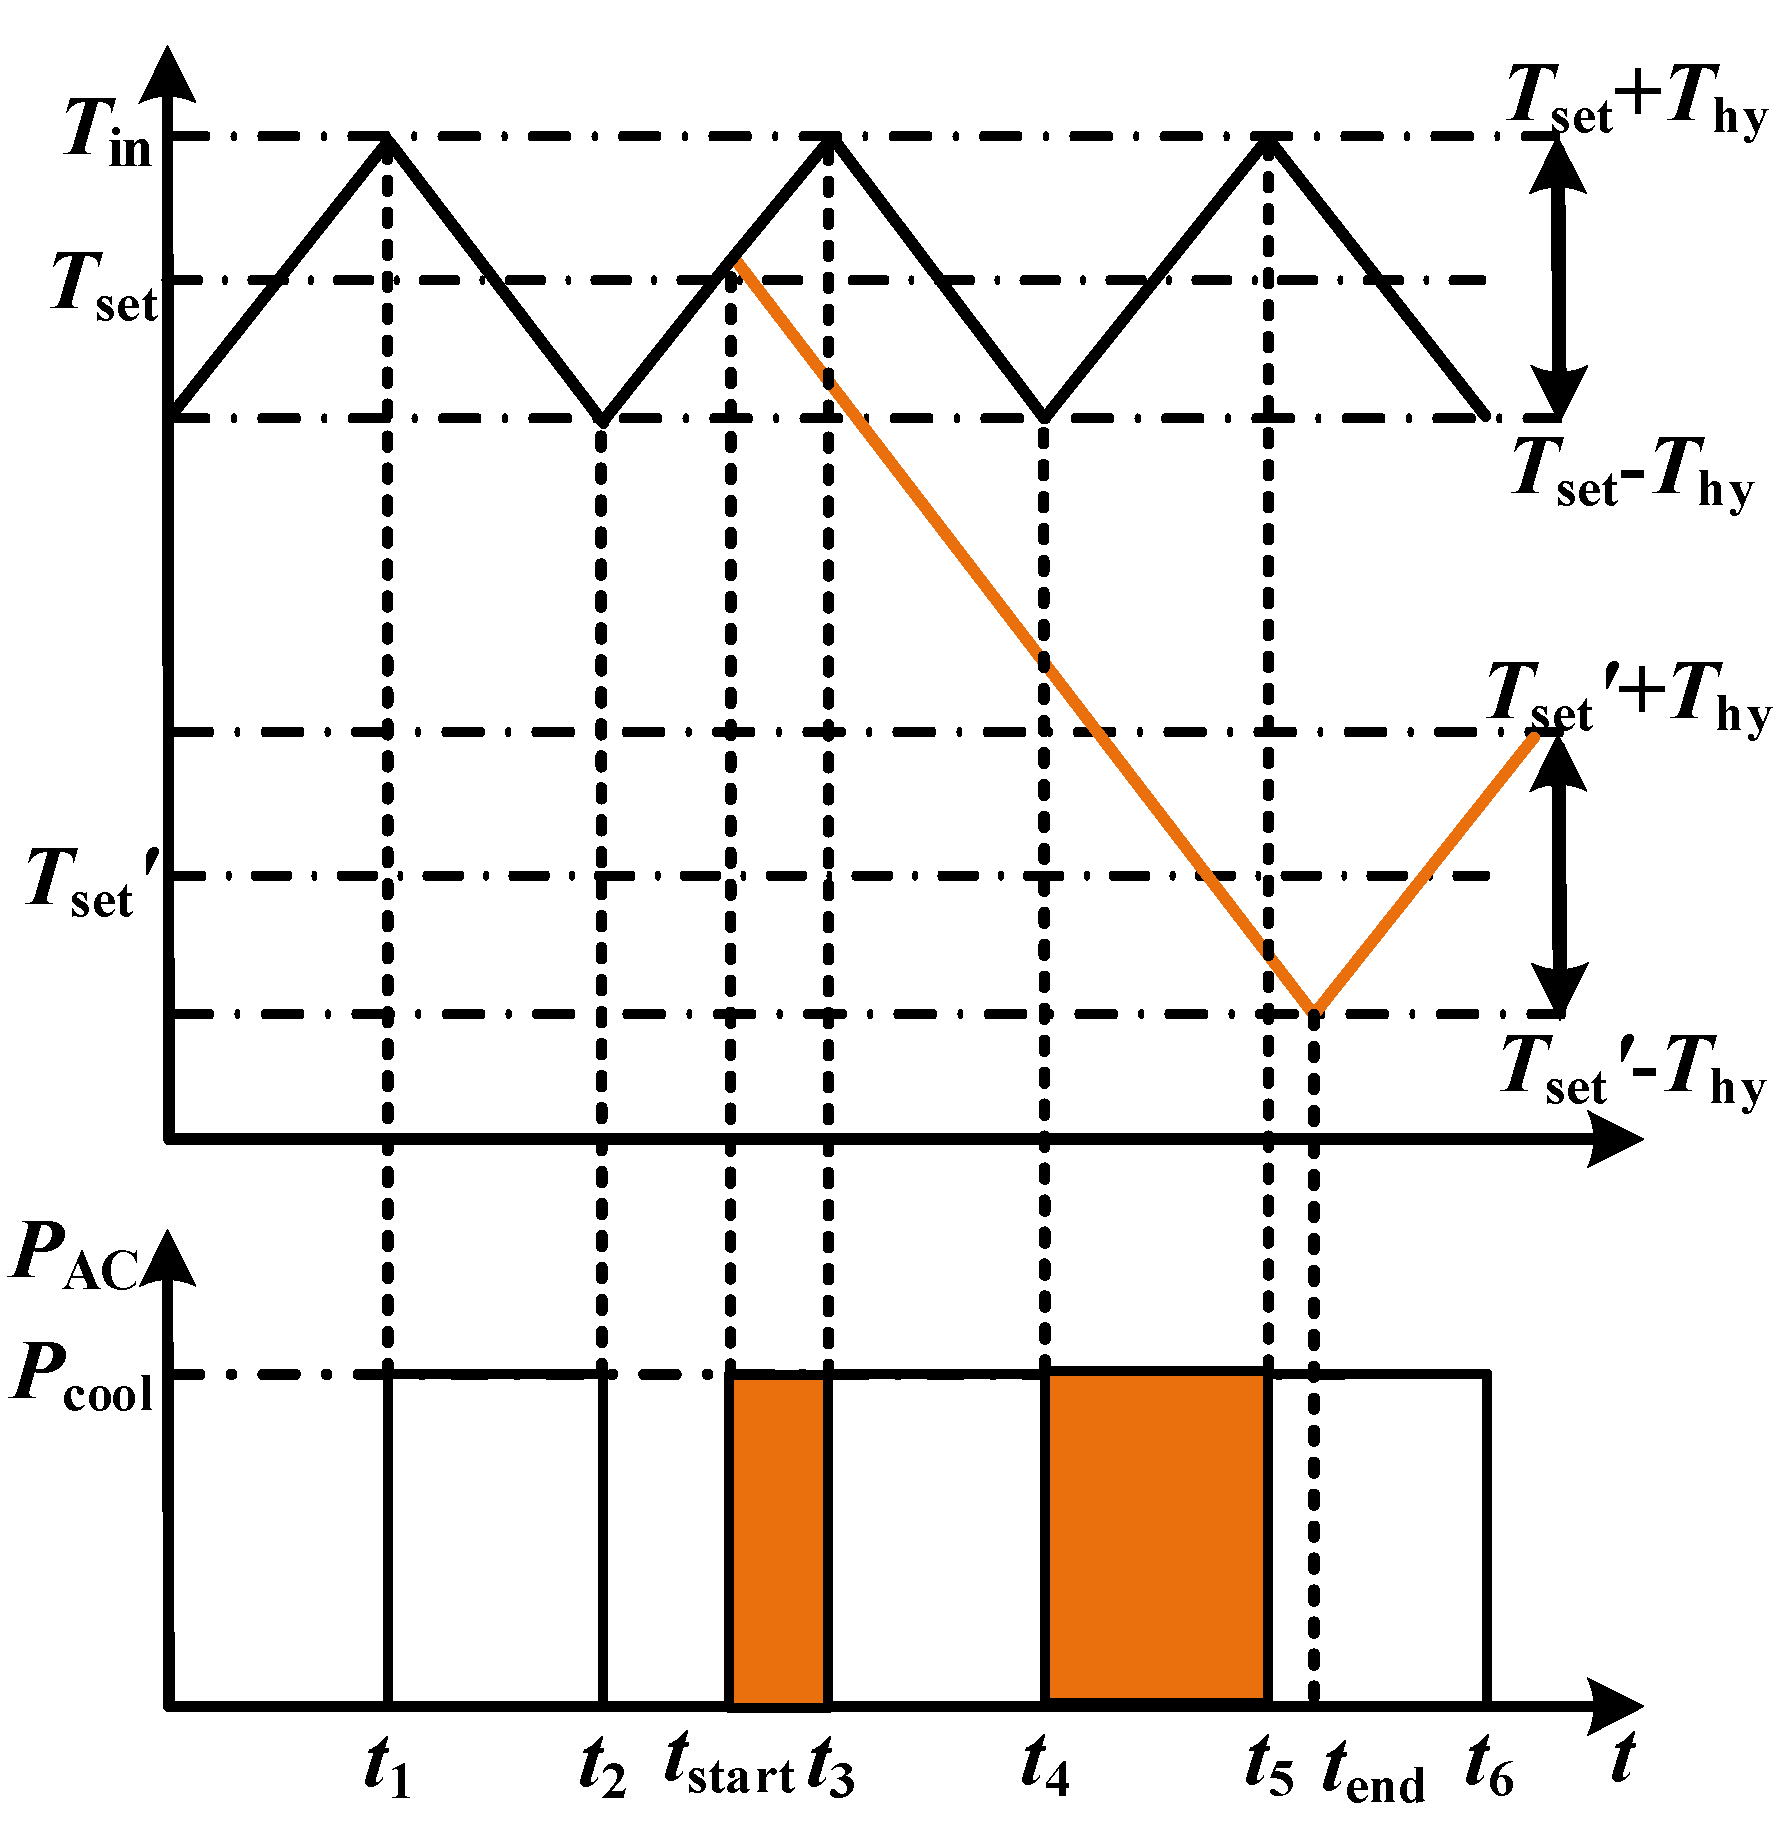
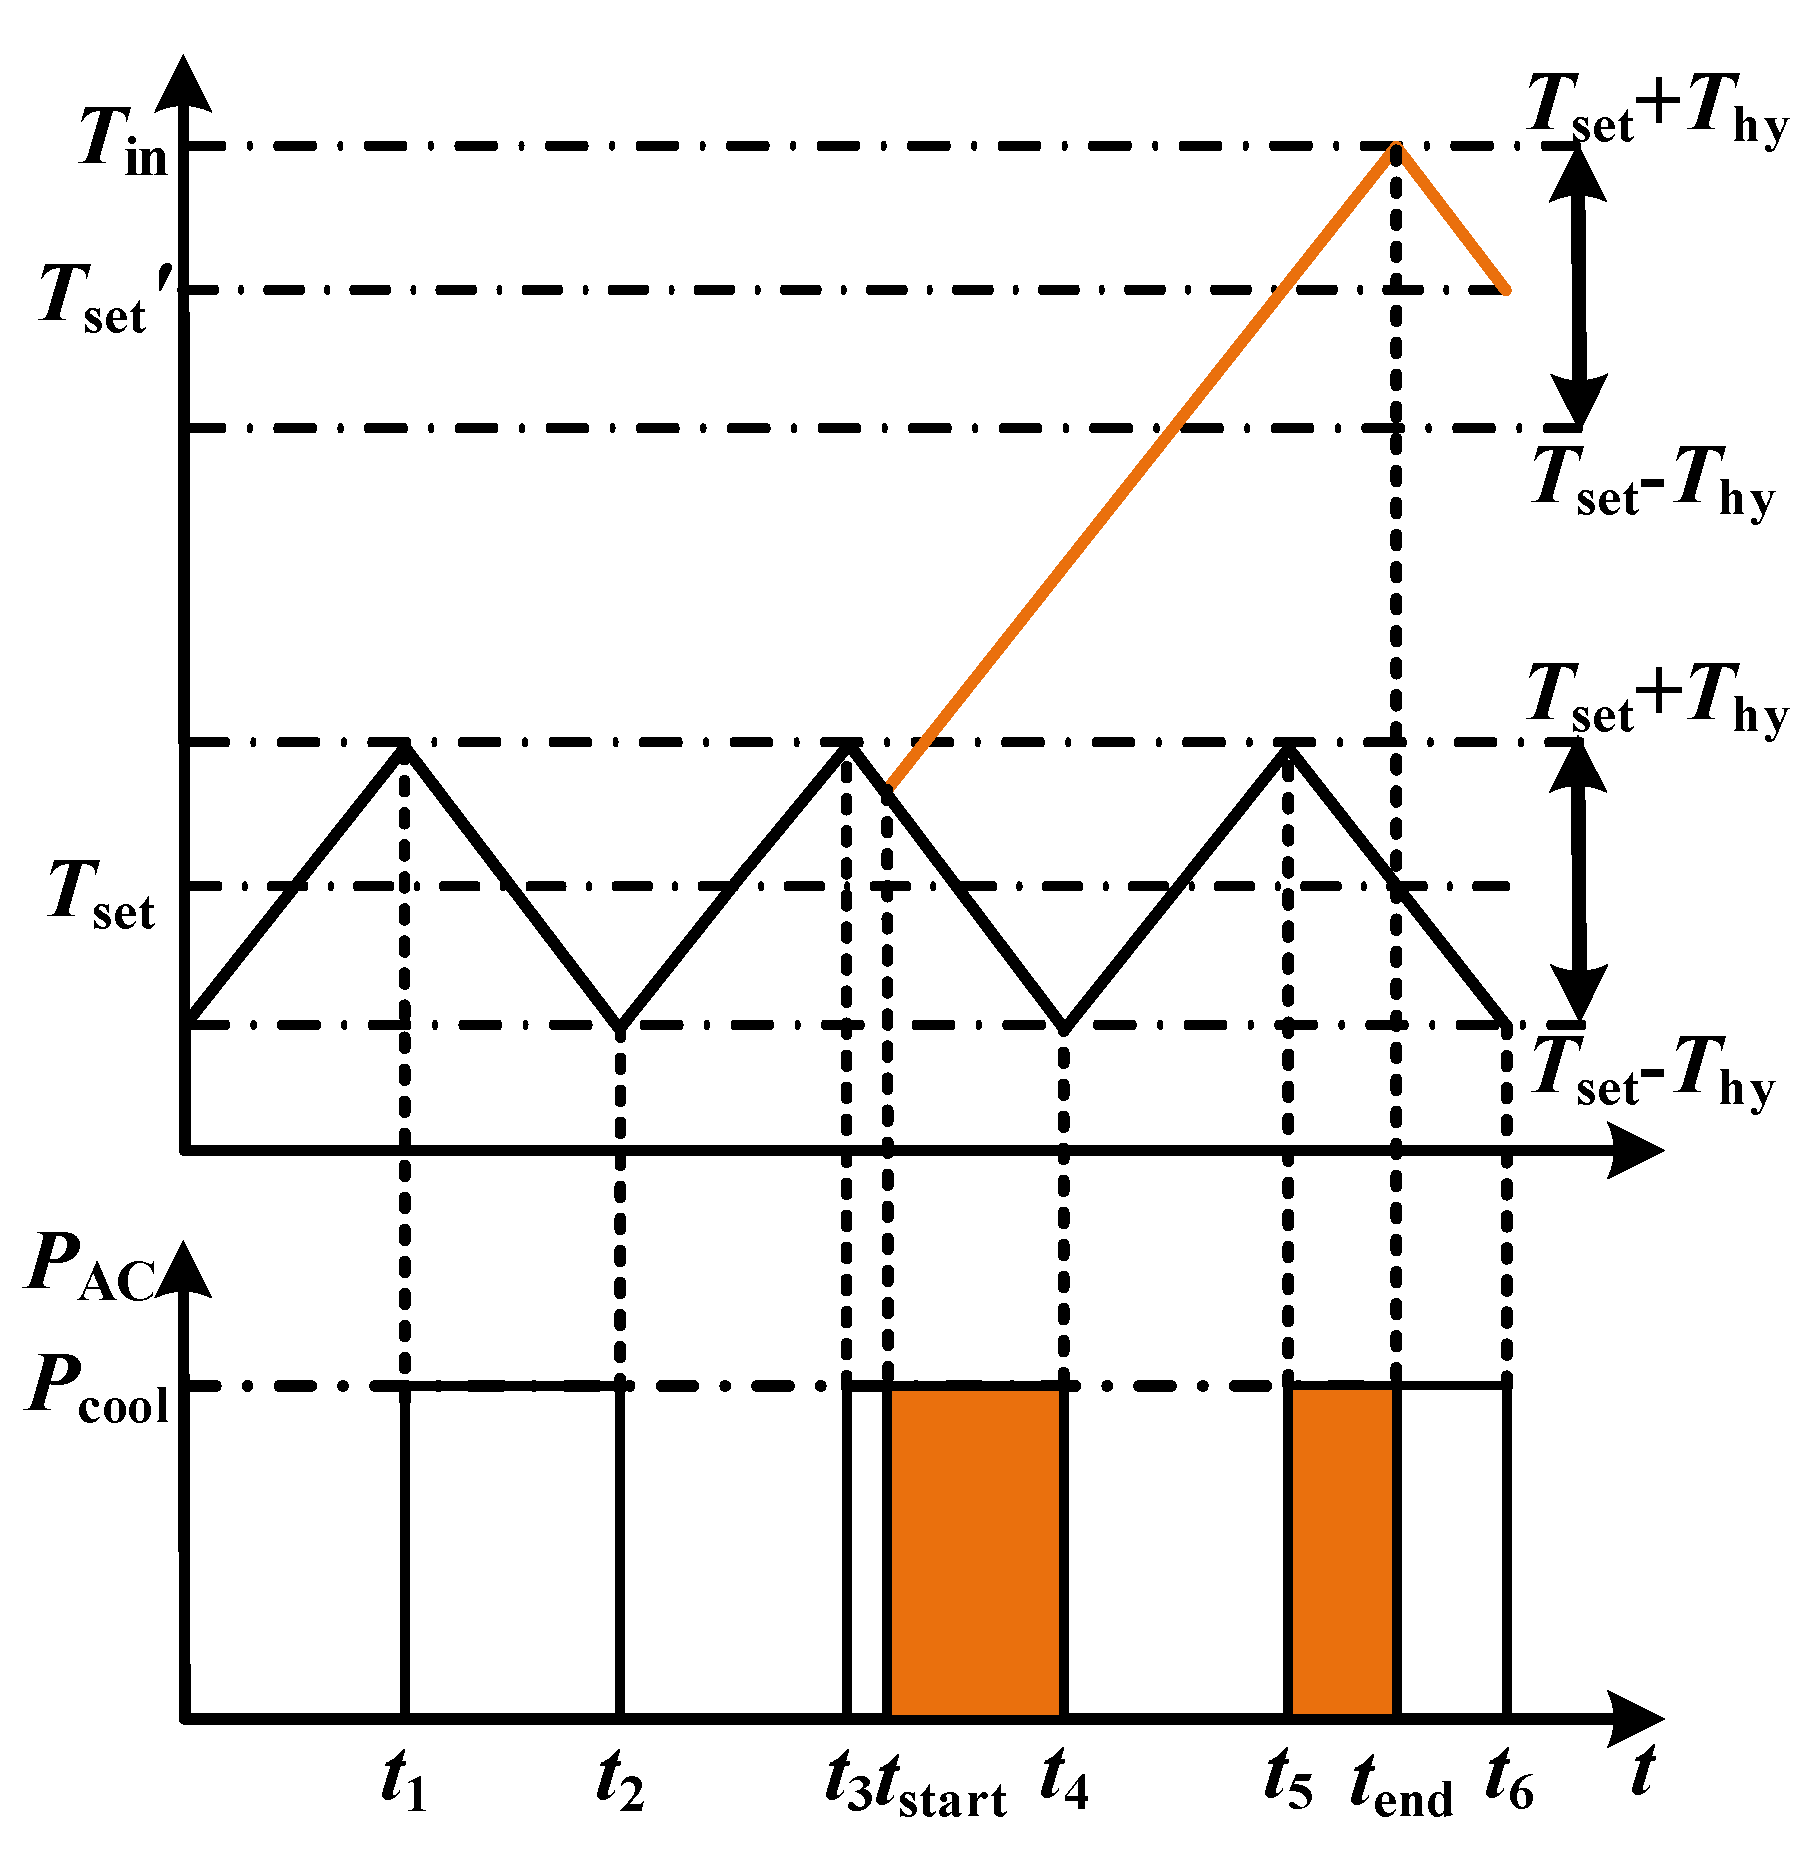
To make full use of the ACs’ voltage regulation potential, the control strategy arranges the participation priority of the ACs based on the room temperatures. In this way, an AC with a long regulation time will preferentially participate in the voltage regulation, which prevents ACs switching working state frequently.
The remainder of this paper is organized as follows. Section 2 develops the thermoelectric model of the ACs for voltage regulation. Section 3 introduces the voltage optimization methods of the distribution network, and numerical simulation tests are presented in Section 4. Finally, Section 5 concludes this study.

2. Thermoelectric Equivalent Model of ACs

The thermoelectric equivalent model of ACs was used to describe the relationship between the working state of an AC and the thermal dynamic variation of the building. The model mainly consists of the thermal model of the room and the electrical model of the AC.

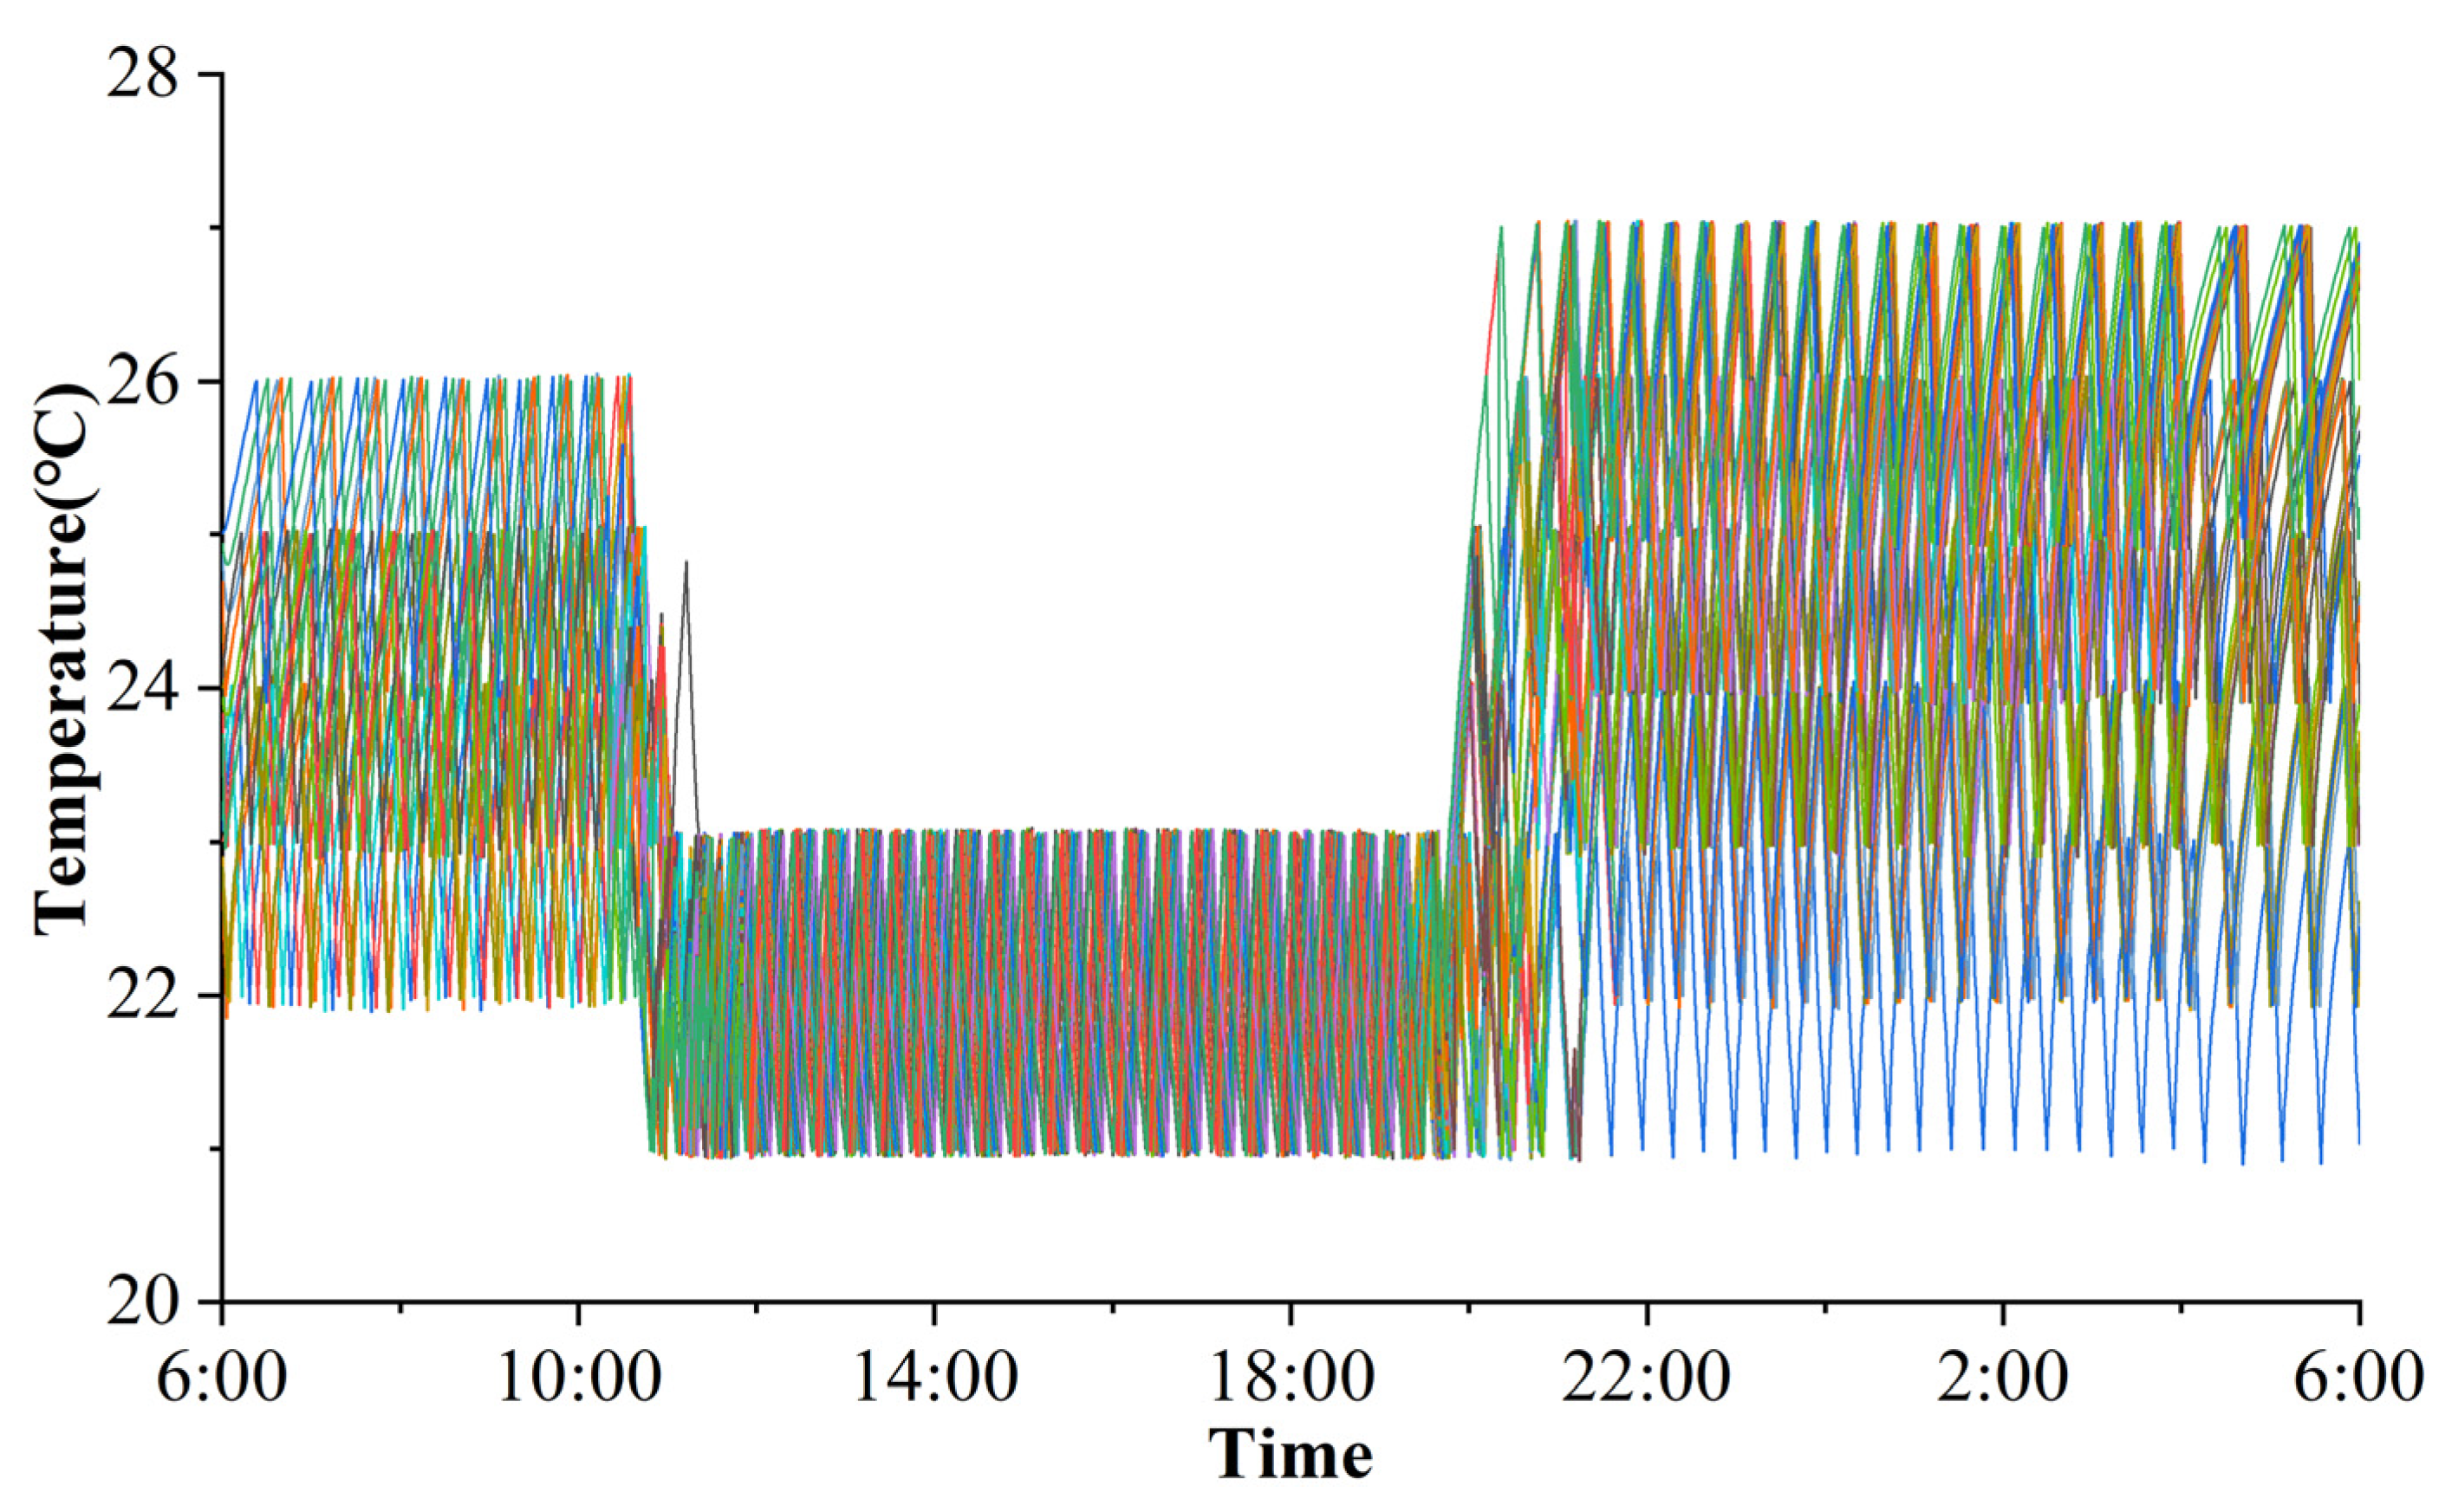
2.1. The Thermal Model of the Room

The thermal model based on heat loss calculation describes the dynamic thermal variation by the principle of energy conservation. As shown in Figure 1, the temperature variation of the room is caused by the unbalance of heat generation and heat loss [22]. The main factors are the temperature difference inside and outside the room. Additionally, other electrical appliances as well as the occupants inside the room and the solar radiation outside also can affect room temperature. According to the above factors, the room energy conservation formula was established, and the temperature variations can be expressed as:
c a · ρ a · V · d T in ( t ) d T = H generate ( t )     H loss ( t ) ,
H loss ( t ) = ( Tr window · S window + Tr wall · S wall + c a · ρ a · V · num ) · ( T in ( t )     T out ( t ) ) ,
H generation ( t ) = H AC ( t ) + ε · A + P average · cos δ ( t ) · s ( t ) ,
where c a and ρ a are the heat capacity and the density of the air, respectively. V is the volume of the room. t is the time slot. T in ( t ) and T out ( t ) are the indoor temperature and the ambient temperature, respectively. H generate ( t ) is the thermal generation, which is mainly affected by the heat generated by the AC ( H AC ( t ) ). Additionally, the solar radiation ( P average · cos δ ( t ) · s ( t ) ), electrical-appliance-emitted heat, and occupant-emitted heat ( ε · A ) also affect the ambient temperature. ε is the coefficient of heat release by electrical appliances and occupants. A is the area of the room. P average , δ ( t ) , and s ( t ) are the average solar intensity, the elevation angle of the sun, and the solar intensity, respectively. H loss ( t ) is the thermal loss, which is caused by conduction and ventilation. Conduction is caused by the difference between the hot and cold zones. The heat is transferred from the ambient temperature to the indoor temperature through walls ( Tr wall · S wall · ( T in ( t )     T out ( t ) ) ) and windows ( Tr window · S window · ( T in ( t )     T out ( t ) ) ). Tr wall and S wall are the thermal transmittance and the area of the wall, respectively. Tr window and S window are the thermal transmittance and the area of the window, respectively. Ventilation is caused by the air flow ( c a · ρ a · V · num · ( T in ( t )     T out ( t ) ) through cracks and gaps. V is the volume of the room. num is the number of times that the air changes.

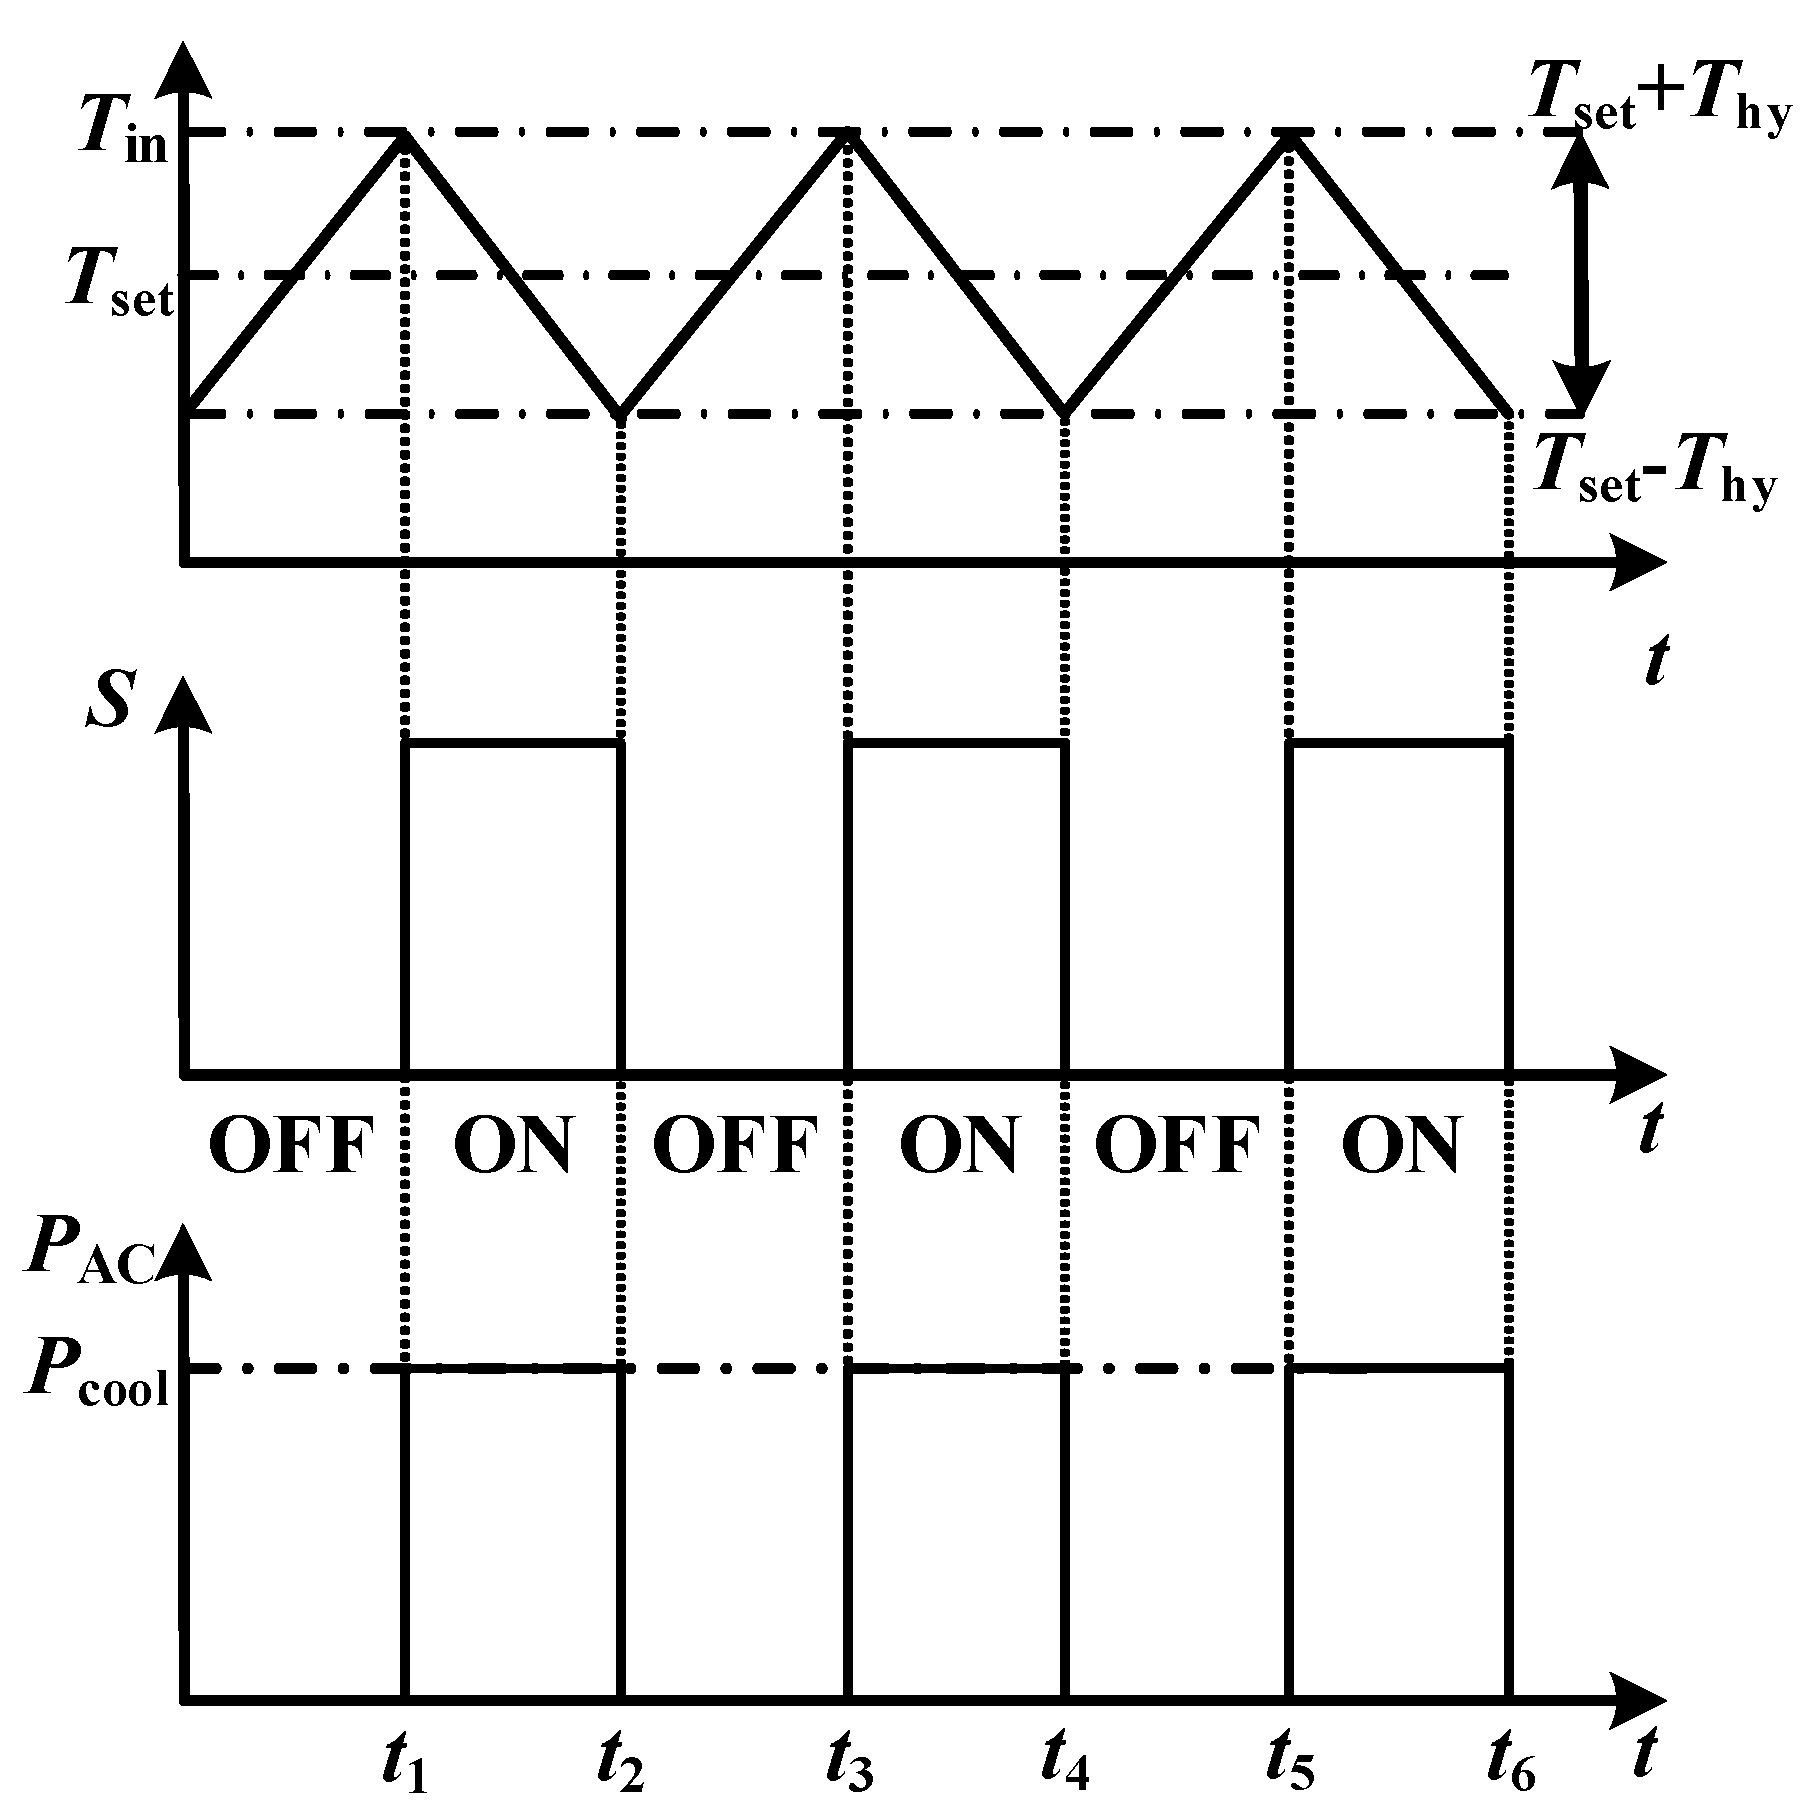
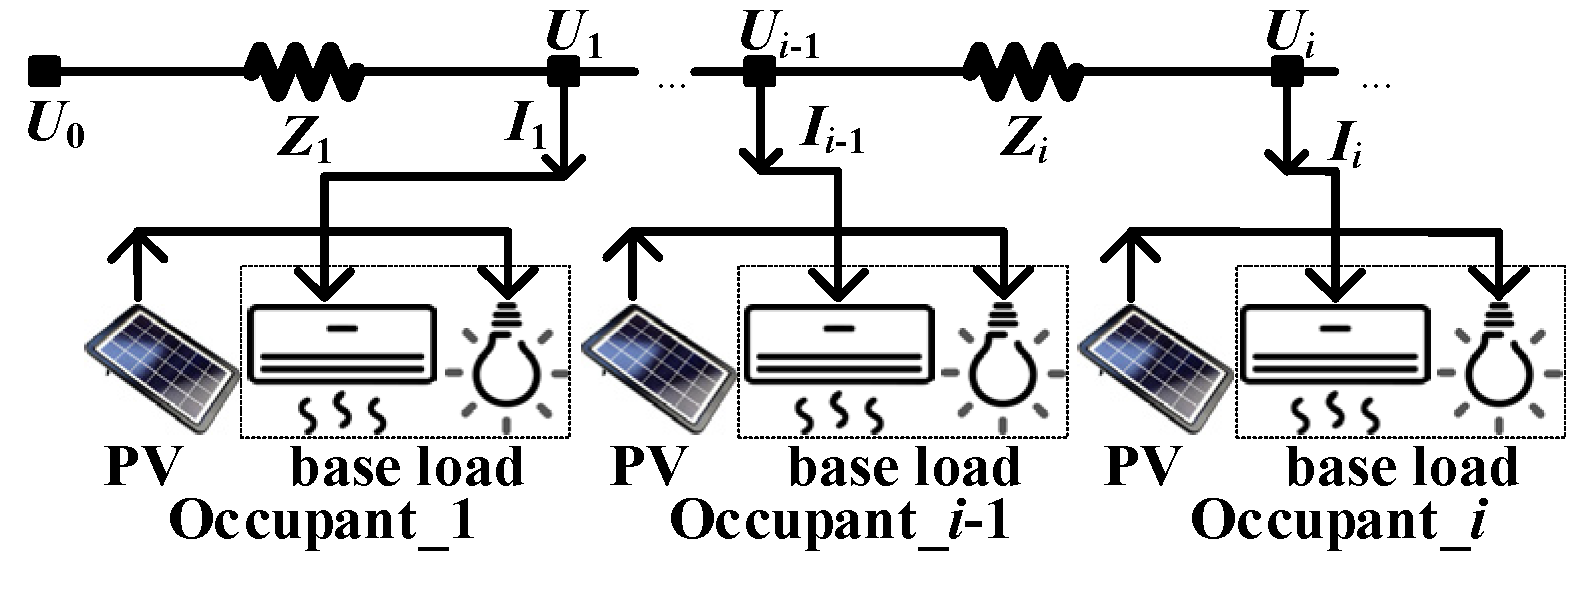
2.2. The Electric Model of the Room

The operation state of ACs has two states: cool state and standby state. The operating characteristics are shown in Figure 2. When the AC works in the cooling state, the compressor of the AC turns on, and the operating power of the AC is equal to Pcool. When the AC works in the standby state, the compressor of the AC turns off, and the operating power of the AC approaches zero. The standby state and the cooling state are switched alternately. The room temperature fluctuates within [ T set     T hy ,   T set + T hy ]. The average operating power in this state can be expressed as:
P AC _ i normal = P cool · ( t 2     t 1 ) t 3     t 1 ,  
The operating power can be regulated by adjusting the set temperature of the AC. According to the operational characteristics of the AC, the control strategy of the AC can be developed to provide voltage regulation services. The AC that participates in voltage regulation should be equipped with smart controllers. When the smart controllers receive the regulation signals, the set temperature of the AC is reset. However, to avoid affecting the use of the AC, the set temperature is controlled within the comfortable range. As recommended by the British Council for Offices, an acceptable set temperature range of ACs within the 22–26 °C can guarantee the comfort of the occupants in the room [23]. To deal with the over-voltage and under-voltage problems of the distribution network, the AC takes measures to decrease and increase the set temperature, respectively. When the distribution network exists the over-voltage problem, the AC decreases the set temperature; the operating performance of the AC is illustrated in Figure 3. The variation curves of the room temperature and the operating power of the AC are shown in Figure 3. The orange curve and orange parts illustrate the room temperature and increase in the operating power after the AC participates in the over-voltage regulation. When the smart controller receives the over-voltage regulation signal at the time t start , the set temperature decreases from T set to T set . During t start     t end , the compressor keeps the working state, which increases operating power. In this way, the AC can provide regulation power for the over-voltage problem. The regulation power for the over-voltage problem can be expressed as:
P AC _ i over = P cool     P AC _ i normal ,  
When the distribution network encounters an under-voltage problem, the AC increases the set temperature; the operating performance of the AC is illustrated in Figure 4. The variation curves of the room temperature and the AC’s operating power are shown in Figure 4. The orange curve and orange parts illustrate the room temperature and decrease in the operating power after the AC participates in the under-voltage regulation. When the smart controller receives the under-voltage regulation signal at the time t start , the set temperature increases from T set to T set . During t start     t end , the compressor keeps the standby state, which results in a decrease in operating power. In this way, the AC can provide regulation power for the under-voltage problem. The regulation power for the under-voltage problem can be expressed as:
P AC _ i under = P AC _ i normal ,  

3. Optimization of Power Flow for the Distribution Network

To optimize the power supply quality of the distribution network, the nodal voltage must be controlled within a permissible range to ensure the regular operation of the electrical equipment. Therefore, it is crucial to calculate the power flow of the distribution network according to the real-time load and power generation. The distribution system operator formulates the control strategy of the ACs for voltage optimization according to the over-limit situation of the nodal voltage.

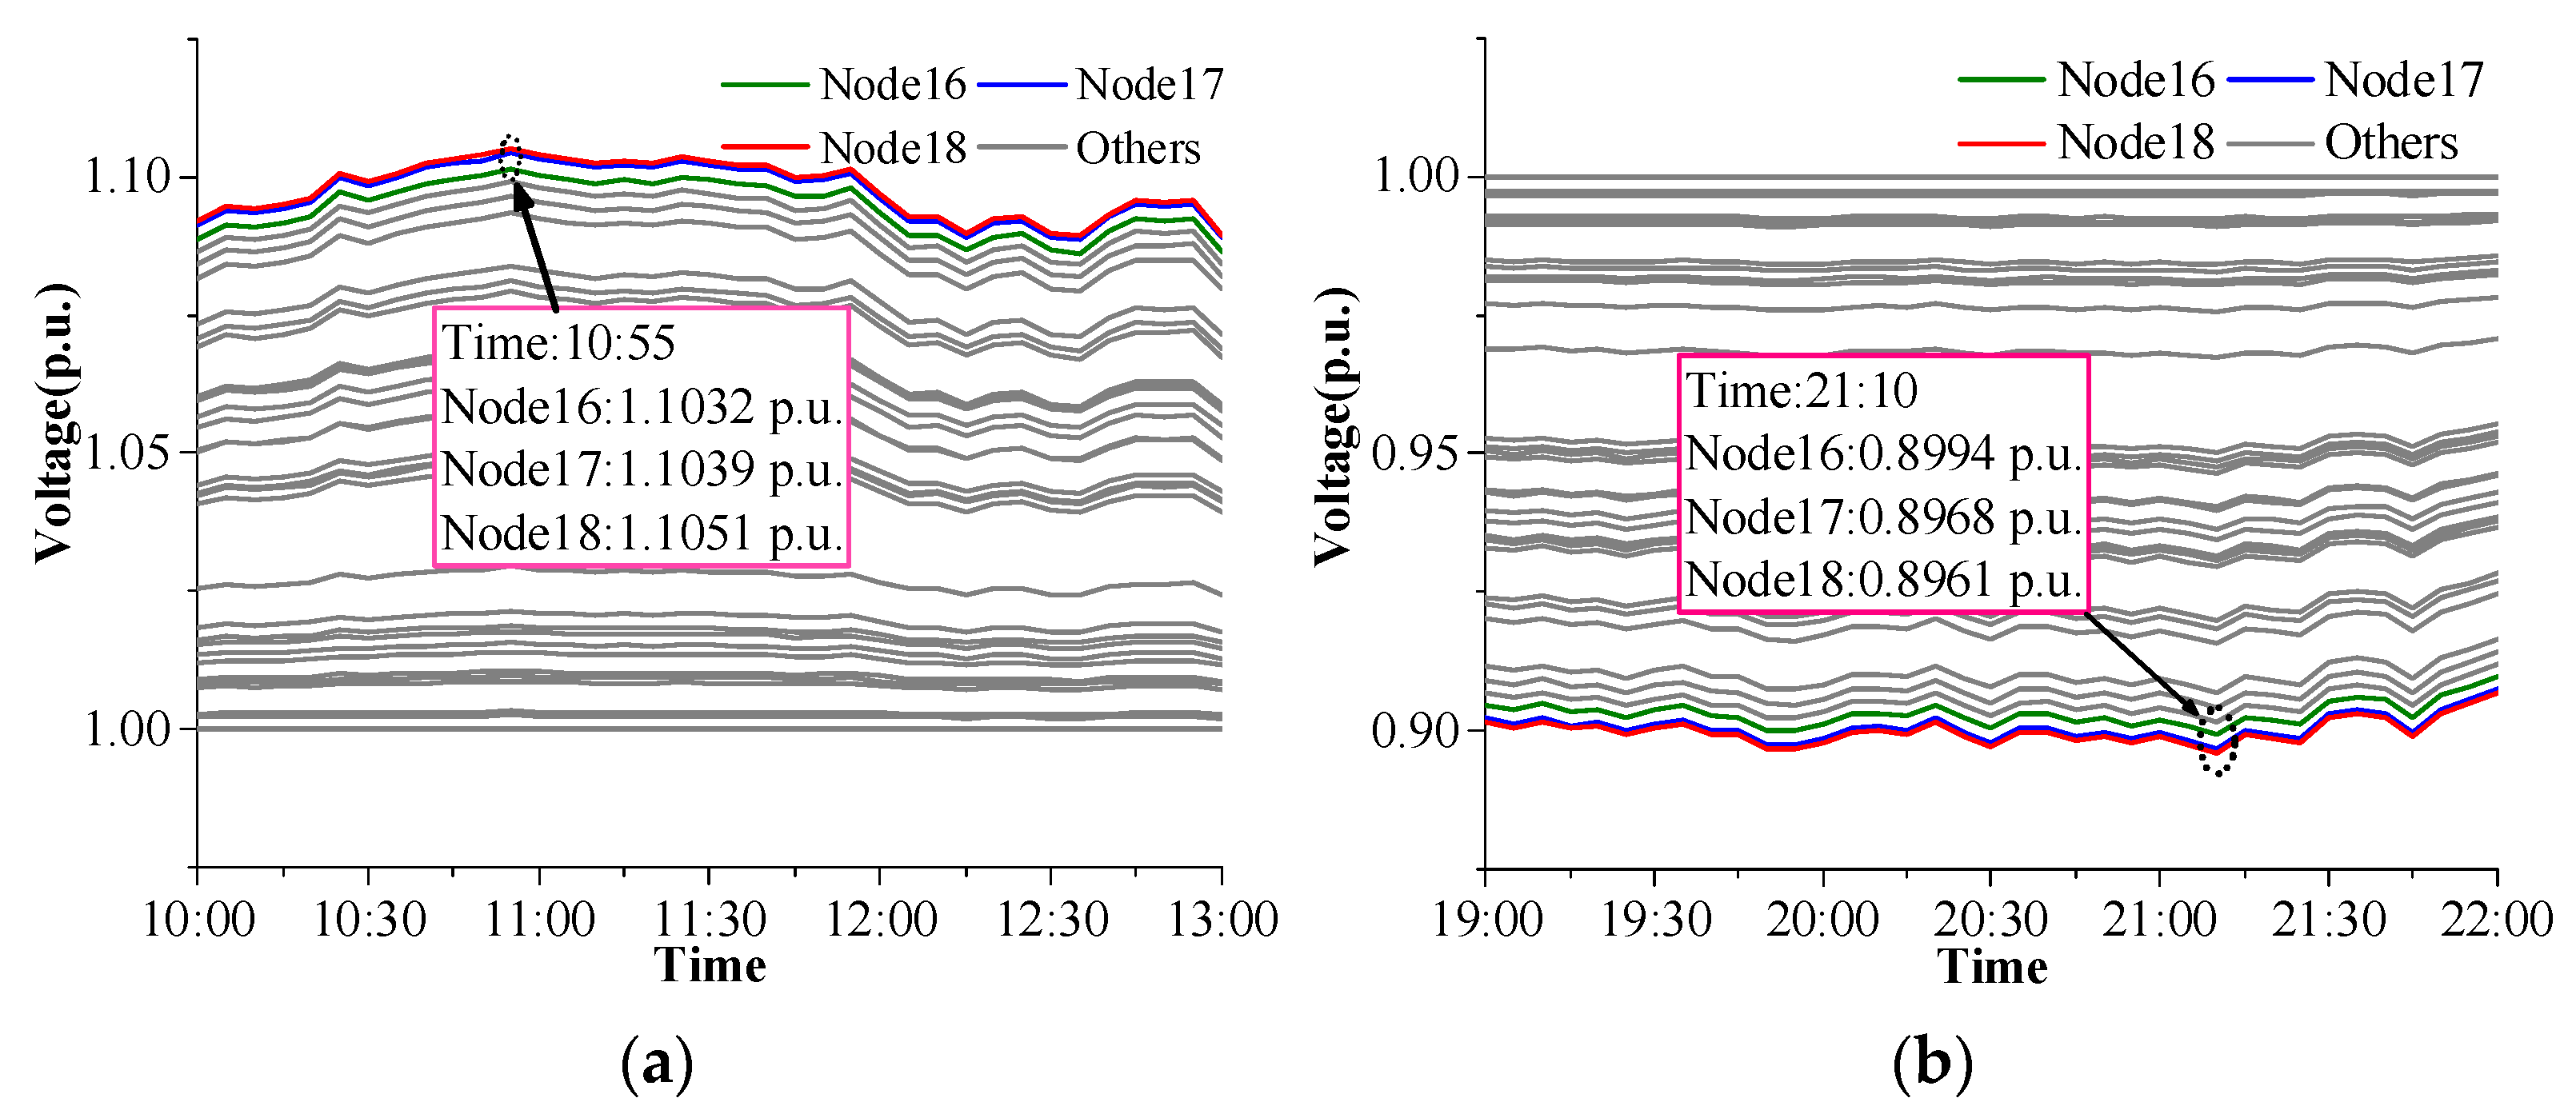
3.1. Voltage Problem of the Distribution Network

The power supply quality of the power system affects the electrical equipment on the user side. According to IEEE Recommended Practice for Monitoring Electric Power Quality, the nodal voltage of the distribution network must be controlled within the range of [0.9, 1.1] p.u. [24].
The simple distribution network model is shown in Figure 5. Zi is the impedance between node i−1 and node i on the distribution line. U0 is the voltage of the reference node, and Ui is the voltage of node i. When the illumination is sufficient in the daytime, the PVs’ output may exceed the basic load, which causes a reverse power flow and even the over-voltage problem (the voltage is higher than 1.1 p.u and the duration exceeds 1 min). When PVs stop output after office hours and the basic load of the user side soars, the under-voltage problem may occur (the voltage is lower than 0.9 p.u. and the duration exceeds 1 min). In addition, due to the impedance of the transmission line, the nodal voltage decreases with the distance from the reference node. The nodal voltage can be expressed as:
U i = U i 1 Z i · ( I i + I i + 1 + ) ,  
where I i is the current flowing into node i.

3.2. Sensitivity Coefficient Method

The sensitivity coefficient method is a common method to solve the nonlinear voltage regulation problem. The compensation power required for voltage optimization was obtained by calculating the voltage sensitivity coefficient and the voltage over-limit value. The sensitivity coefficient matrix S is the inverse matrix of the Jacobian Matrix, which can be calculated with the Newton–Raphson power flow algorithm:
S = Jacobian   Matrix 1 = [ S θ P S θ Q S UP S UQ ] ,  
where S θ P = Δ P / Δ θ , S θ Q = Δ Q / Δ θ , S UP   = U · Δ P / Δ U , and S UQ = U · Δ Q / Δ U . Δ P and Δ Q are the active and reactive power required for voltage regulation. Δ θ and Δ U is the over-limit value of the phase angle and node voltage, respectively, which can be expressed as:
Δ U ( t ) = Δ U 1 ( t ) , Δ U 2 ( t ) , , Δ U i ( t ) ,  
Δ U i ( t ) = { U i ( t )     U max   ,   U i ( t ) > U max U i ( t )     U min   ,   U i ( t ) < U min 0   ,   other   ,  
where U max and U min are the upper and the lower voltage limit, respectively. When the node voltage exceeds the upper or the lower voltage limit, the compensation power shall be calculated to regulate the distribution network:
Δ P ( t ) = S UP 1 ( t ) · Δ U ( t ) ,  
When the under-voltage or over-voltage problem exists in the distribution network, the regulation power can be calculated in the sensitivity coefficient method to eliminate the voltage problem in the distribution network. However, the sensitivity coefficient method neglects the capacity of the voltage regulation resources on the user side. For this reason, a successive voltage regulation algorithm is developed to optimize the voltage of the distribution network considering the voltage regulation capacity on the user side.

3.3. Successive Voltage Regulation Algorithm and the Control Strategy of ACs

The successive voltage regulation algorithm can optimize the voltage of the distribution network to the permissive range. However, the successive voltage regulation algorithm considers the voltage regulation capacity and needs less regulation power than the sensitivity coefficient algorithm. The regulation process is achieved through PID algorithm iteration:
{ err i ( n ) = U i ( n )     U max ,   U i ( n ) > U max   err i ( n ) = U i ( n )     U min ,   U i ( n ) < U min ,
Δ P i ( n ) = K p · err i ( n ) + K i · k = 1 n err i ( k ) + K d · ( err i ( n )     err i ( n ) ) ,
where err i ( n ) represents the difference between the nodal voltage and U max or U min in the nth iteration, when the nodal voltage exceeds the permissive range. K p ,   K i ,   K d is the coefficient of the PID algorithm. Δ P i ( n ) is the regulation power of the node i in the nth iteration. The algorithm is an iterative process that adopts the node-by-node regulation mode. When the distribution network has a voltage problem, the node with the most severe over-limit is subject to voltage regulation. The iteration of the PID algorithm continues until the node with the most severe over-limit changes or all nodal voltages are within the range of [0.9, 1.1] p.u. The flow chart of the successive voltage regulation algorithm is shown in Figure 6. The regulation power of the node i is obtained by the PID algorithm. If, in a specific case, the node of the voltage regulation resource is still not insufficient, the ACs of the adjacent node will provide regulation power and participate in the voltage optimization. In the regulation process, the participation priority of the ACs is based on the room temperature. When the distribution network exists the over-voltage problem, the AC with a higher room temperature has the higher participation priority. When the distribution network exists the under-voltage problem, the AC with a lower room temperature has the higher participation priority.

4. Experiment and Results

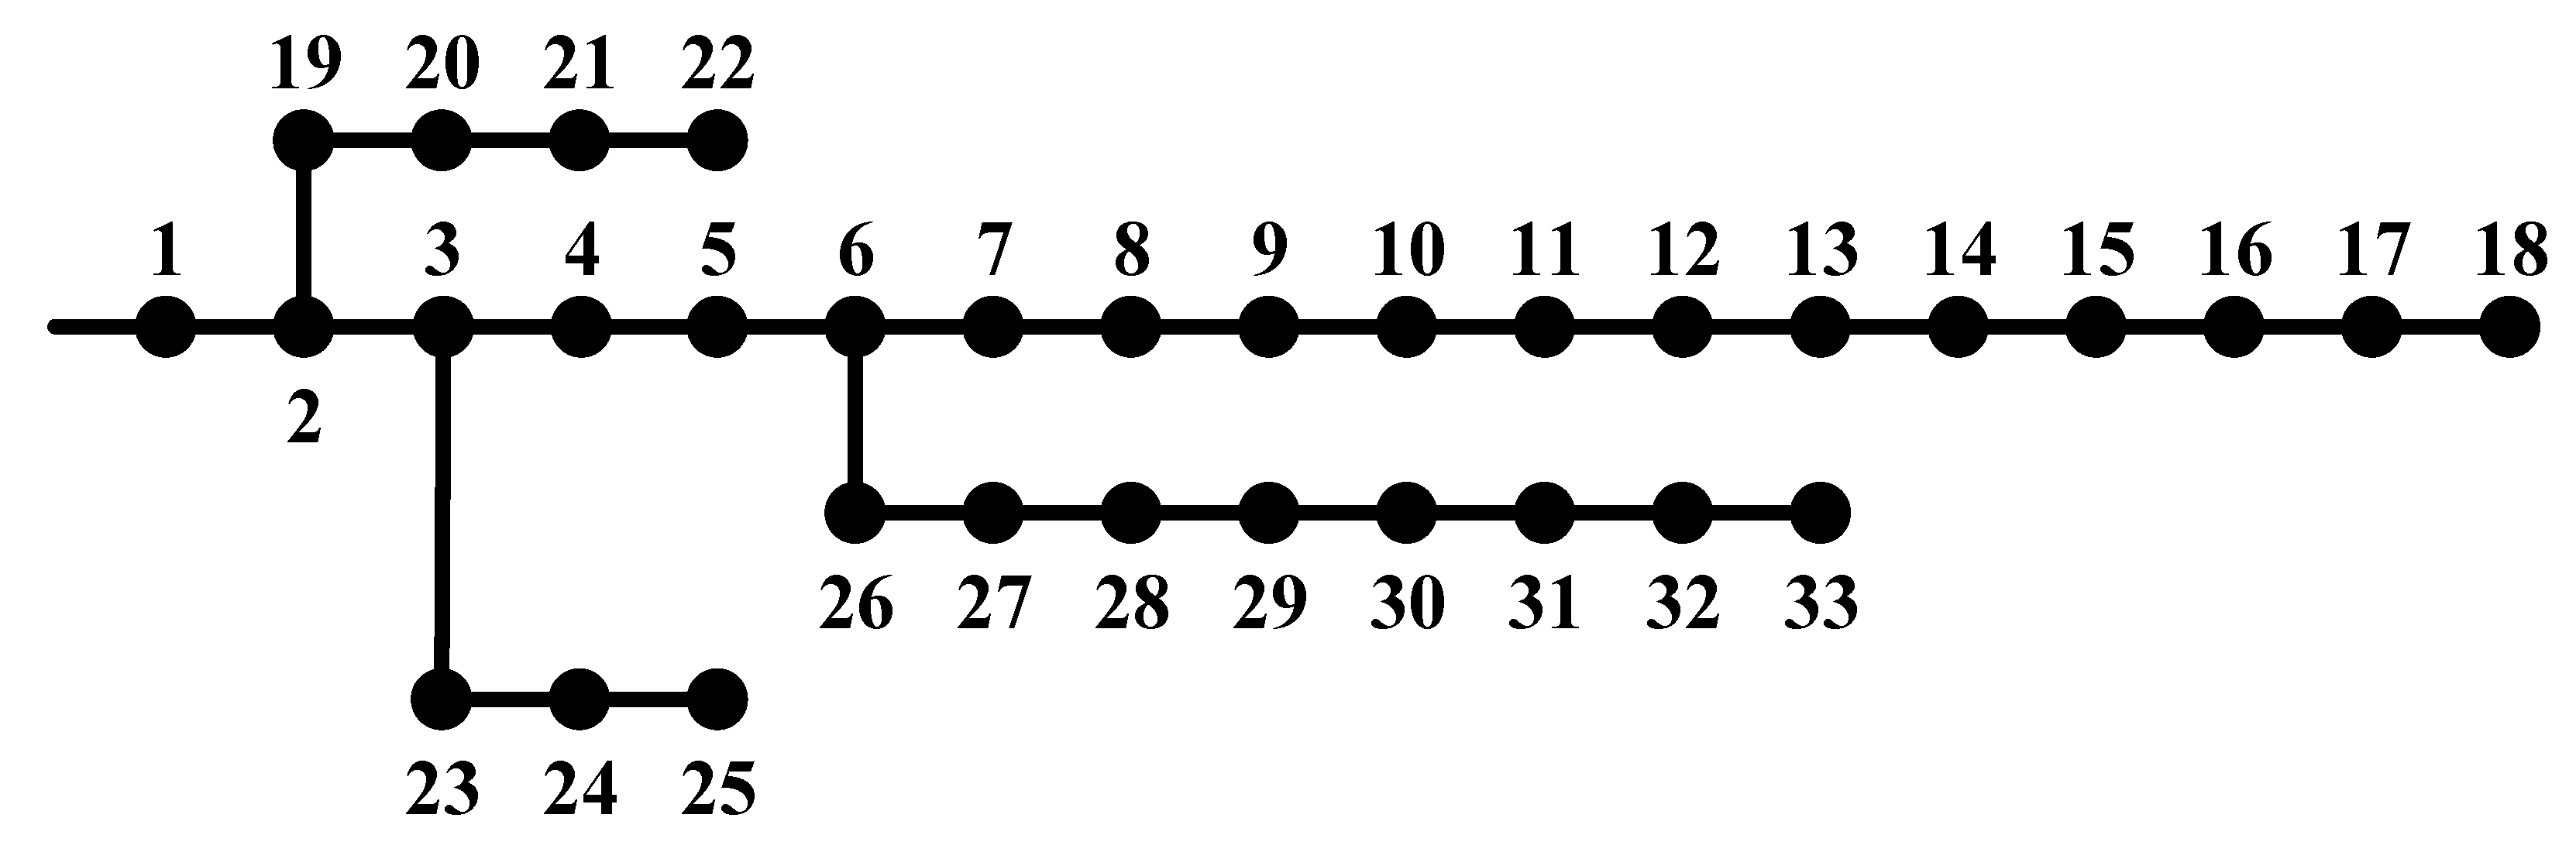
4.1. Test System and Parameters

Simulation was performed using the MATLAB software (Version R2018a, MathWorks, Natick, MA, USA) on a computer equipped with Intel (R) Core (TM) i7-7820 @ 2.90 GHz and 32 GB memory. The IEEE 33-node power distribution system model was used to verify the availability of the coordinated voltage optimization strategy. The model is shown in Figure 7.
In the IEEE 33-node power distribution system, node 1 was the reference node, and the other nodes were “PQ” nodes. Each node was assumed to have 100 occupants. The penetration rates of the PVs and the ACs were 85% and 100%, respectively. The parameters of the AC model and the thermal model are shown in Table 1. The simulation time was from 6:00 a.m. on the first day to 6:00 a.m. on the second day. There were 288-time nodes in total, and each time node was 5 min. The powers of PVs and base load were obtained from the literature [25], and the power curve is shown in Figure 8. The work time of PV generation was 4:50–19:35, and power output reached the maximum value of 7.84 MW at 11:25. The load power fluctuated between 2.72 and 4.69 MW.
Without any voltage optimization, the curves of the nodal voltage are shown in Figure 9. Each curve indicates a nodal voltage. The gray curve indicates that the node voltage does not exceed the range of [0.9, 1.1], and the green, blue, and red curves indicate that the nodes have a voltage problem. It can be seen from the figure that node 18 is farthest from the reference node. Therefore, the fluctuation of node 18 is the most serious. When under-voltage occurs in the distribution network, the node voltage reaches the minimum value of 0.8961 p.u. at 21:10. When over-voltage occurs in the distribution network, the node voltage reaches the maximum value of 1.1051 p.u. at 10:55.

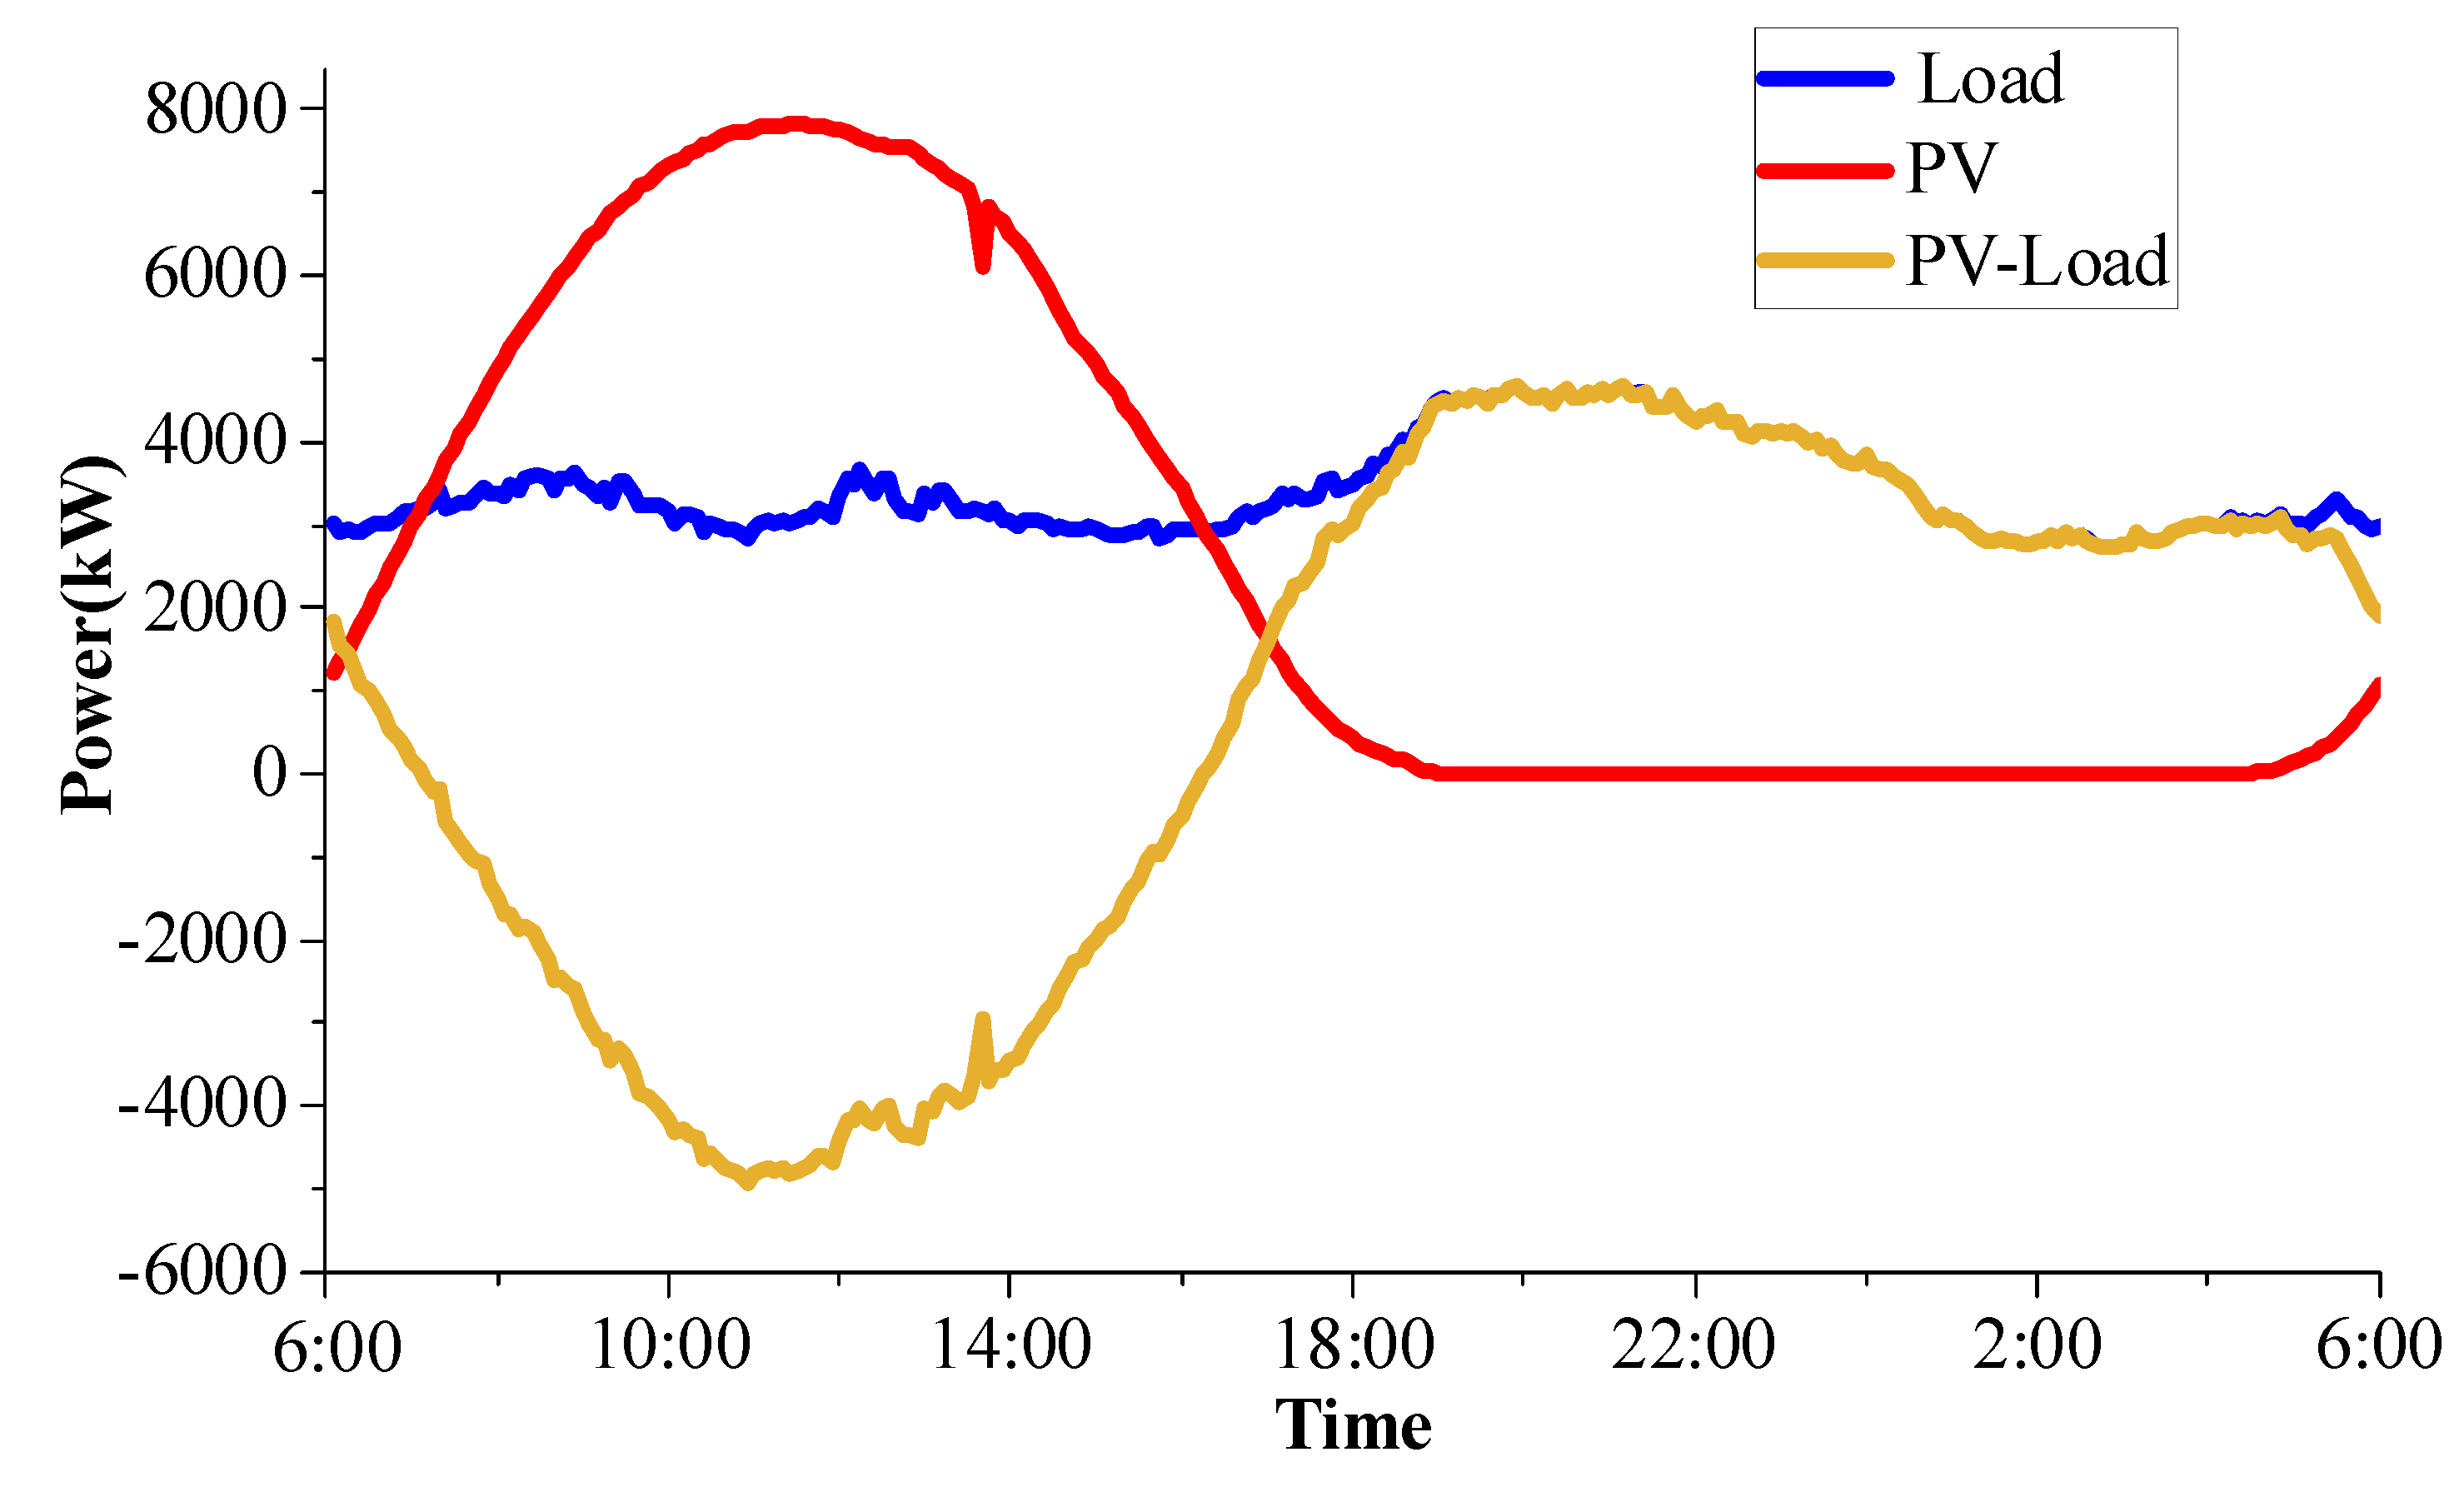
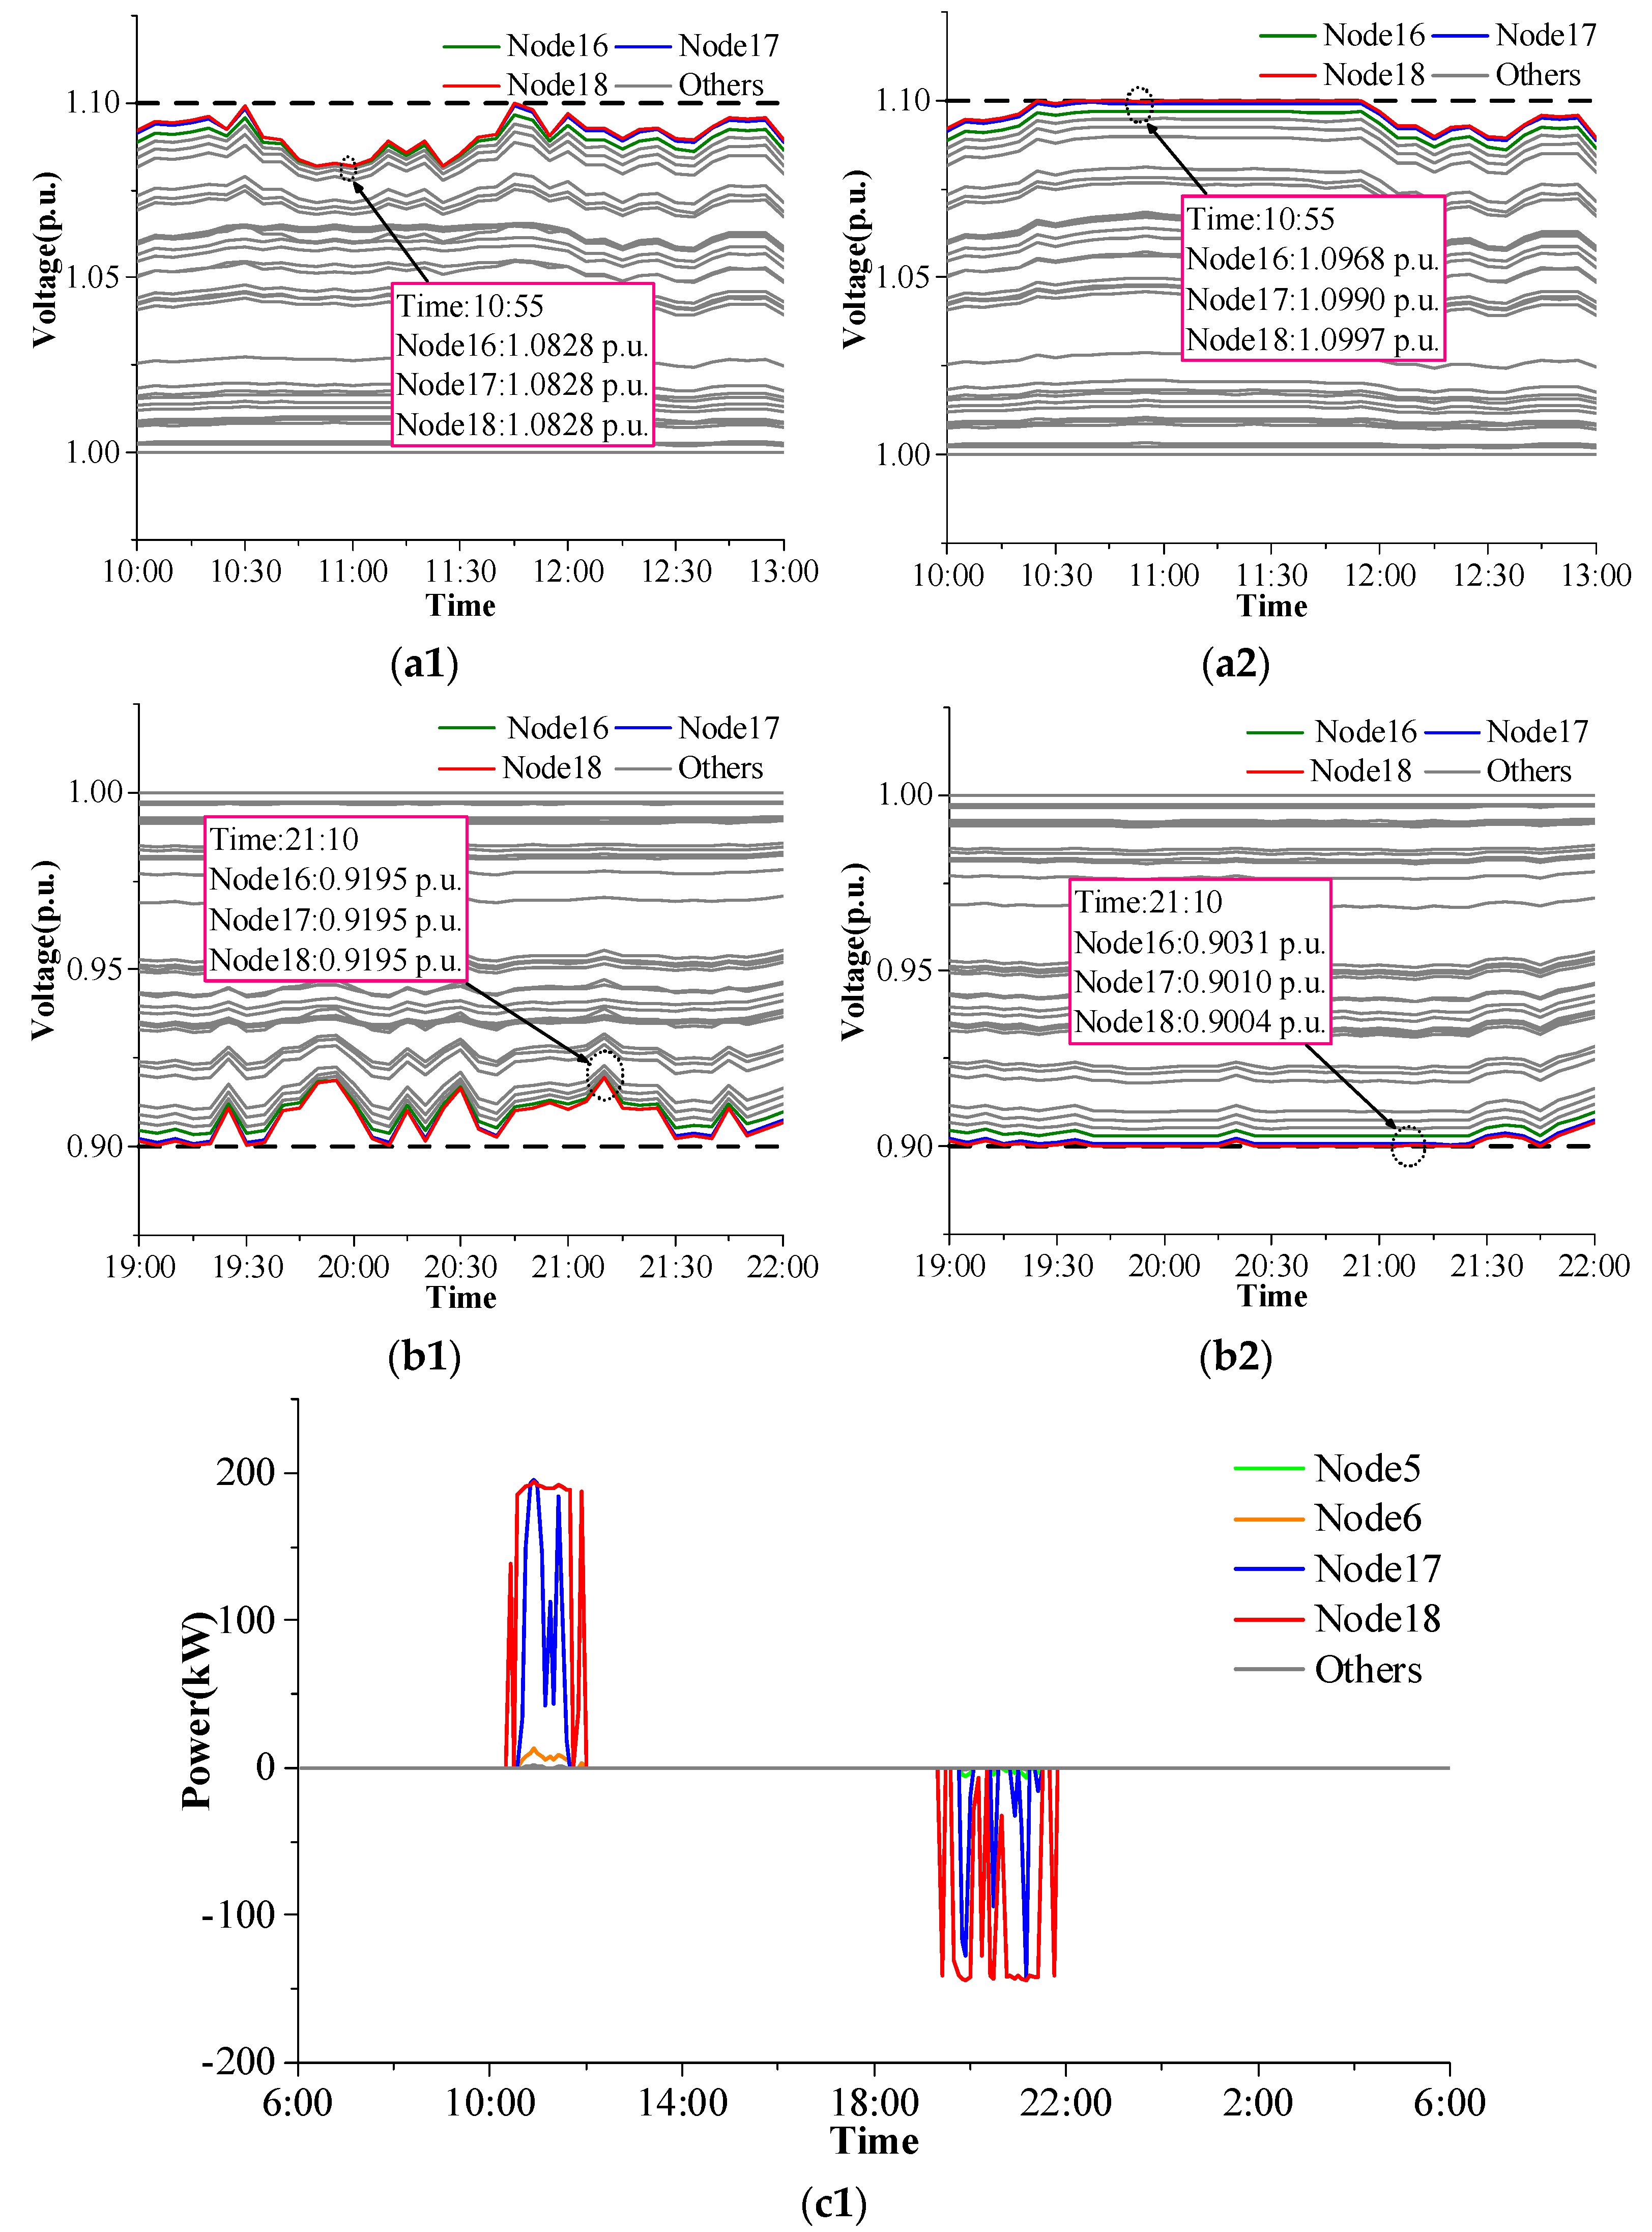
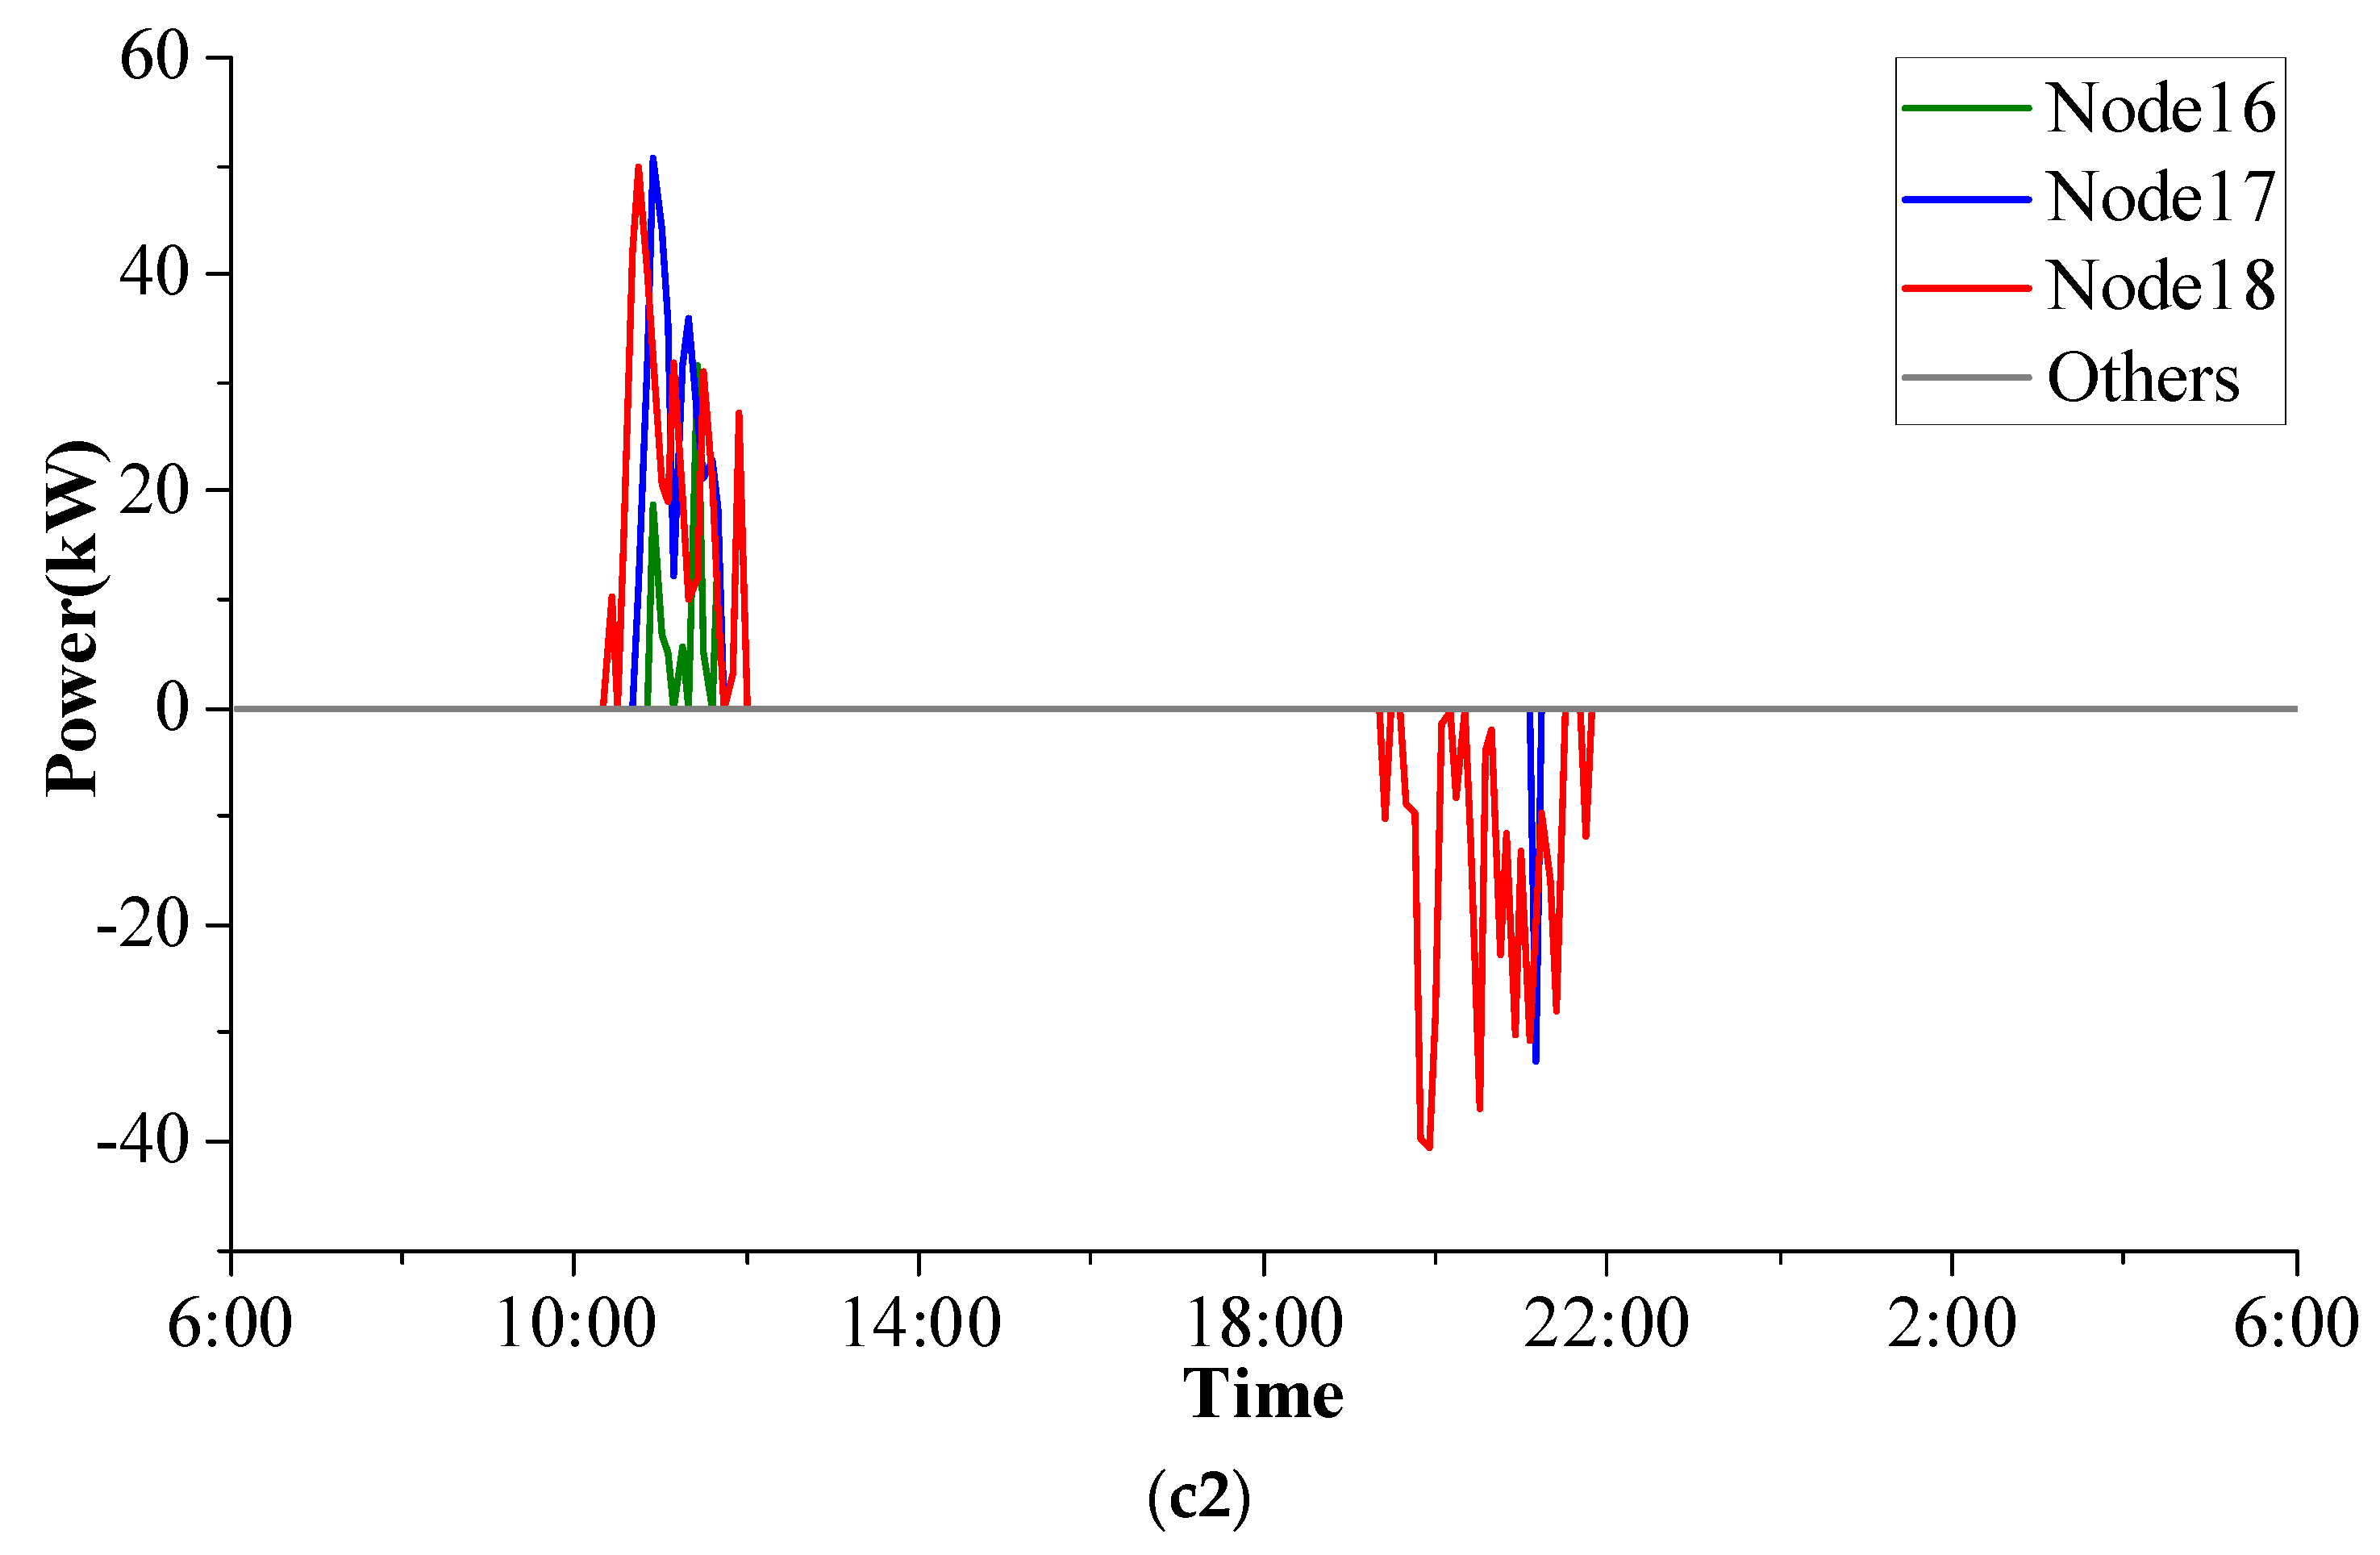
4.2. Voltage Optimization by the Sensitivity Coefficient Method and the Successive Voltage Regulation Algorithm

The sensitivity coefficient algorithm is a commonly used voltage optimization algorithm, which can directly calculate the reactive power and active power for voltage regulation by the voltage sensitivity matrix. However, the calculation process of the sensitivity coefficient method focuses on all nodes of the distribution network and neglects the capacity of the regulation resource. In this way, the calculated power is so great that the ACs on the user side cannot provide it. Therefore, considering the limited ACs on the user side, the successive voltage regulation algorithm was proposed to use less regulation power for realizing voltage optimization. The curves of the nodal voltage and regulation power by the sensitivity coefficient method and the successive voltage regulation algorithm are shown in Figure 10.
After regulating using the sensitivity coefficient method, the nodal voltage curves are shown in Figure 10(a1,b1). It can be seen that the voltages are controlled within the range of [0.9, 1.1] p.u. The voltage of node 18 decreases from 1.1051 p.u. to 1.0282 p.u. at 10:55 and increases from 0.8961 p.u. to 0.9195 p.u. at 21:10. As shown in Figure 10(c1), the regulation power is mainly provided by node 18 and node 17, the maximum over-voltage regulation power is greater than 200 kW, and the minimum power is greater than 150 kW. However, the voltage regulation resources cannot provide so much power. When the voltage regulation resources of the user side are limited, the sensitivity coefficient method is unsuitable for calculating the regulation power.
Due to the limited regulation resources of the user side, the process of voltage regulation should consider the voltage regulation capacity on the user side. The curves of the nodal voltage after regulating using the successive voltage regulation algorithm are shown in Figure 10(a2,b2). After regulating using the successive voltage regulation algorithm, the voltages are controlled within the range of [0.9, 1.1] p.u. The voltage of node 18 decreases from 1.1051 p.u. to 1.0997 p.u. at 10:55 and increases from 0.8961 p.u. to 0.9004 p.u. at 21:10. On the premise of keeping the voltage within the permissive range, the regulation power can be afforded by the ACs on the user side. The regulation power calculated by the successive voltage regulation algorithm is shown in Figure 10(c2). Additionally, to avoid affecting the use of the ACs, the set temperatures of the ACs are controlled within the range of 22–26 °C during the entire regulation process. The curves of the room temperature at the node are shown in Figure 11.
The over-voltage regulation process of the successive voltage regulation algorithm at 10:25~11:05 is shown in Table 2. The over-voltage problem begins at 10:25; 20 ACs participate in voltage regulation and provide 10.61 kW of active power. The voltage of node 18 decreases from 1.1006 p.u. to 1.0999 p.u. During 10:25~10:45, the ACs at node 18 can provide voltage regulation services for the distribution network. As the over-voltage problem becomes severe, the ACs at node 18 cannot provide enough regulation power to keep the voltage of the distribution network within the range of [0.9, 1.1] p.u. The ACs at node 17 begin to participate in voltage regulation. Aside from the 50.37 kW active power provided by the 99 ACs at node 18, 21 ACs at node 17 also provide 11.24 kW active power for voltage regulation. At 10:55, both node 18 and node 17 cannot provide enough regulation power. Other 33 ACs at node 16 participate in voltage regulation and provide 17.74 kW of active power.

5. Conclusions

With the development of demand–response technology, ACs have become a potential voltage regulation resource. This paper proposed a coordinated voltage control strategy by optimizing the limited regulation capacity of ACs. Firstly, a detailed thermoelectric equivalent model of ACs was developed to accurately evaluate the dynamic thermal changes of the room. Secondly, a successive voltage regulation algorithm was proposed to calculate the optimal regulation power for voltage optimization. Thirdly, the regulation strategy of the ACs was proposed to make full use of the voltage regulation potential and avoid affecting the use of the ACs. Simulations were carried out to establish comparisons with the sensitivity coefficient method. The results show that the coordinated voltage control strategy can use less regulation power to achieve voltage optimization.
The enormous potential of ACs presents a tremendous opportunity for providing voltage regulation services to the distribution network. However, the regulation capacity of the ACs is limited, meaning that ACs cannot cope with the severe voltage problems for a long time. Therefore, our future work will focus on developing the coordinated control strategy of ACs and the traditional voltage regulation equipment.

Author Contributions

Conceptualization, Y.H.; methodology, Y.H.; formal analysis, Q.X.; investigation, Q.X.; data curation, L.Z.; writing—original draft preparation, Y.H.; writing—review and editing, Q.X., L.S., W.H. and J.C.; supervision, Q.X.; project administration, Q.X. All authors have read and agreed to the published version of the manuscript.

Funding

This research received no external funding.

Acknowledgments

The authors would like to thank the editor and reviewers whose comments and suggestions have improved the quality of this paper.

Conflicts of Interest

The authors declare no conflict of interest.

References

  1. Hua, Y.; Xie, Q.; Hui, H.; Ding, Y.; Wang, W.; Qin, H.; Shentu, X.; Cui, J. Collaborative voltage regulation by increasing/decreasing the operating power of aggregated air conditioners considering participation priority. Electr. Power Syst. Res. 2021, 199, 107420. [Google Scholar] [CrossRef]
  2. Xie, Q.; Hui, H.; Ding, Y.; Ye, C.; Lin, Z.; Wang, P.; Song, Y.; Ji, L.; Chen, R. Use of demand response for voltage regulation in power distribution systems with flexible resources. IET Gener. Transm. Distrib. 2020, 14, 883–892. [Google Scholar] [CrossRef]
  3. Duarte, S.N.; de Souza, B.C.; de Almeida, P.M.; de Araújo, L.R.; Barbosa, P.G. A Compensation Strategy Based on Consumer’s Voltage Unbalance Assessment for a Distribution Static Synchronous Compensator. IEEE Lat. Am. Trans. 2020, 18, 156–164. [Google Scholar] [CrossRef]
  4. Daratha, N.; Das, B.; Sharma, J. Coordination Between OLTC and SVC for voltage regulation in unbalanced distribution system distributed generation. IEEE Trans. Power Syst. 2014, 29, 289–299. [Google Scholar] [CrossRef]
  5. Aryanezhad, M. Management and coordination of LTC, SVR, shunt capacitor and energy storage with high PV penetration in power distribution system for voltage regulation and power loss minimization. Int. J. Electr. Power Energy Syst. 2018, 100, 178–192. [Google Scholar] [CrossRef]
  6. Muhammad, Y.; Khan, R.; Raja, M.A.Z.; Ullah, F.; Chaudhary, N.I.; He, Y. Solution of optimal reactive power dispatch with FACTS devices: A survey. Energy Rep. 2020, 6, 2211–2229. [Google Scholar] [CrossRef]
  7. Xie, Q.; Shentu, X.; Wu, X.; Ding, Y.; Hua, Y.; Cui, J. Coordinated Voltage Regulation by On-Load Tap Changer Operation and Demand Response Based on Voltage Ranking Search Algorithm. Energies 2019, 12, 1902. [Google Scholar] [CrossRef] [Green Version]
  8. Hui, H.; Ding, Y.; Liu, W.; Lin, Y.; Song, Y. Operating reserve evaluation of aggregated air conditioners. Appl. Energy 2017, 196, 218–228. [Google Scholar] [CrossRef]
  9. Zhang, M.; Bao, Y.-Q. Voltage control strategy for distribution network with thermostatically controlled loads equivalent energy storage model considering minimum-on-off time. Int. J. Electr. Power Energy Syst. 2021, 133, 107268. [Google Scholar] [CrossRef]
  10. Canizes, B.; Silveira, V.; Vale, Z. Demand response and dispatchable generation as ancillary services to support the low voltage distribution network operation. Energy Rep. 2022, 8, 7–15. [Google Scholar] [CrossRef]
  11. Song, M.; Gao, C.; Yang, J.; Yan, H.; Southeast University; Shanghai Power Company Economic Research Institute; China Electric Power Research Institute. Energy storage modeling of inverter air conditioning for output optimizing of wind generation in the electricity market. CSEE J. Power Energy Syst. 2018, 4, 305–315. [Google Scholar] [CrossRef]
  12. Péan, T.; Costa-Castelló, R.; Fuentes, E.; Salom, J. Experimental Testing of Variable Speed Heat Pump Control Strategies for Enhancing Energy Flexibility in Buildings. IEEE Access 2019, 7, 37071–37087. [Google Scholar] [CrossRef]
  13. Tostado-Véliz, M.; Bayat, M.; Ghadimi, A.A.; Jurado, F. Home energy management in off-grid dwellings: Exploiting flexibility of thermostatically controlled appliances. J. Clean. Prod. 2021, 310, 127507. [Google Scholar] [CrossRef]
  14. Tostado-Véliz, M.; Gurung, S.; Jurado, F. Jurado, Efficient solution of many-objective Home Energy Management systems. Int. J. Electr. Power Energy Syst. 2022, 136, 107666. [Google Scholar] [CrossRef]
  15. Tostado-Véliz, M.; Kamel, S.; Jurado, F. Development and Comparison of Efficient Newton-Like Methods for Voltage Stability Assessment. Electr. Power Compon. Syst. 2021, 48, 1798–1813. [Google Scholar] [CrossRef]
  16. Hua, Y.; Shentu, X.; Xie, Q.; Ding, Y. Voltage/Frequency Deviations Control via Distributed Battery Energy Storage System Considering State of Charge. Appl. Sci. 2019, 9, 1148. [Google Scholar] [CrossRef] [Green Version]
  17. Kulworawanichpong, T. Simplified Newton-Raphson power-flow solution method. Int. J. Electr. Power Energy Syst. 2010, 32, 551–558. [Google Scholar] [CrossRef]
  18. Tostado-Véliz, M.; Kamel, S.; Jurado, F. A Novel Family of Efficient Power-Flow Methods with High Convergence Rate Suitable for Large Realistic Power Systems. IEEE Syst. J. 2021, 15, 738–746. [Google Scholar] [CrossRef]
  19. Lu, N.; Member, S. An Evaluation of the HVAC Load Potential for Providing Load Balancing Service. IEEE Trans. Smart Grid 2012, 3, 1263–1270. [Google Scholar] [CrossRef]
  20. Zhang, J.; Ma, G.; Lyu, X.; Li, M.; Xu, J.; Wu, X. Research on scheduling control strategy of large-scale air conditioners based on electric spring. Int. J. Electr. Power Energy Syst. 2021, 124, 106398. [Google Scholar] [CrossRef]
  21. Hui, H.; Ding, Y.; Zheng, M. Equivalent Modeling of Inverter Air Conditioners for Providing Frequency Regulation Service. IEEE Trans. Ind. Electron. 2019, 66, 1413–1423. [Google Scholar] [CrossRef]
  22. Ryder-cook, D. Thermal Modelling of Buildings; Tech Rep; Cavendish Laboratory, Department of Physics, University of Cambridge: Cambridge, UK, 2009. [Google Scholar]
  23. Lakeridou, M.; Ucci, M.; Marmot, A.; Ridley, I. The potential of increasing cooling set-points in air-conditioned offices in the UK. Appl. Energy 2012, 94, 338–348. [Google Scholar] [CrossRef]
  24. Society, E. IEEE Recommended Practice for Monitoring Electric Power Quality; IEEE: Piscataway, NJ, USA, 2009; Volume 2009. [Google Scholar]
  25. Xie, Q.; Hara, R.; Kita, H.; Tanaka, E. Coordinated control of OLTC and multi-CEMSs for overvoltage prevention in power distribution system. IEEJ Trans. Electr. Electron. Eng. 2017, 12, 692–701. [Google Scholar] [CrossRef]
Figure 1. The thermal model of the room.
Energies 15 03225 g001
Figure 2. The operating characteristics of ACs.
Energies 15 03225 g002
Figure 3. The operating performances of the AC for over-voltage.
Energies 15 03225 g003
Figure 4. The operating performances of the AC for under-voltage.
Energies 15 03225 g004
Figure 5. The simple distribution network model.
Energies 15 03225 g005
Figure 6. The flow chart of the successive voltage regulation algorithm.
Energies 15 03225 g006
Figure 7. IEEE 33-node power distribution system model.
Energies 15 03225 g007
Figure 8. Aggregated data of photovoltaics (PVs) and base load.
Energies 15 03225 g008
Figure 9. The voltages curves of nodes without any voltage optimization: (a) over-voltage problem; (b) under-voltage problem.
Energies 15 03225 g009
Figure 10. The voltages curves of nodes and regulation power with the voltage optimization of the sensitivity coefficient method and the successive voltage regulation algorithm: (a1) Over-voltage optimization by the sensitivity coefficient method. (a2) Over-voltage optimization by the successive voltage regulation algorithm. (b1) Under-voltage optimization by the sensitivity coefficient method. (b2) Under-voltage optimization by the successive voltage regulation algorithm. (c1) The regulation power calculated by the sensitivity coefficient method. (c2) The regulation power calculated by the successive voltage regulation algorithm.
Energies 15 03225 g010aEnergies 15 03225 g010b
Figure 11. The room temperatures of node 18.
Energies 15 03225 g011
Table 1. The parameters of the AC model and the thermal model.
ParameterDefinitionValueUnits
T set The set temperature of the AC22–26°C
T hy The fluctuation temperature1°C
c a The heat capacity of the air1.005kJ/(kg∙°C)
ρ a The heat density of the air1.205Kg/m3
V The volume of the room75m3
num Air exchange times1/7200Hz
P cool The power of the cooling state900W
Table 2. The over-voltage regulation process of the successive voltage regulation algorithm.
TimeNodeQuantity of ACsPower (kW)
10:25~10:301600
1700
182010.61
10:30~10:351600
1700
1800
10:35~10:401600
1700
182915.51
10:40~10:451600
1700
188141.89
10:45~10:501600
172111.24
189950.37
10:50~10:551600
176433.36
188140.88
10:55~11:00163317.74
179950.79
186231.56
11:00~11:0516136.86
178844.81
184221.07
Publisher’s Note: MDPI stays neutral with regard to jurisdictional claims in published maps and institutional affiliations.

