Article

Greening of the District Heating Systems—Case Study of Local Systems

1
Faculty of Energy and Fuels, AGH University of Science and Technology, 30-059 Kraków, Poland
2
Office of Strategy and Development, TAURON Ciepło sp. z o.o., 40-126 Katowice, Poland
*
Author to whom correspondence should be addressed.
Energies 2022, 15(9), 3165; https://doi.org/10.3390/en15093165
Submission received: 7 March 2022 / Revised: 11 April 2022 / Accepted: 23 April 2022 / Published: 26 April 2022
(This article belongs to the Special Issue Recent Advances in District Heating)

Abstract

:
The integration of renewable energy resources into district heating systems is gaining momentum across Europe, as heat producers are expected to work towards the EU Directive of Efficient District Heating and Cooling to achieve carbon neutrality by 2050. This paper studies the techno-economic implications of transforming conventional district heating systems of six locations in Poland, generating 8.5 PJ of heat annually, into sustainable and efficient district heating systems. These new systems consist of flat solar collectors integrated with seasonal pit thermal energy storages and gas heating plants, acting as flexible heat sources, covering residual heat demand and/or increasing the parameters of the working medium in the network. Using the IEA-TIMES software, two scenarios were considered, namely STAT and DYN. The results show that reaching a 20% share of heat production by solar thermal would demand extra construction of seasonal heat storage facilities with a total capacity of 197 TJ, which is approximately 4.5 times bigger than the largest seasonal heat storage located in Vojens, Denmark. The projected increase in the prices of natural gas and CO2 emission allowances accelerates the transformation of systems towards greater use of solar heating plants. In the period 2025–2050 the heat generation costs increase by ca. 65%. The contribution of the CAPEX and OPEX costs components are presented.

1. Introduction

In the European Union, space heating and domestic hot water production accounted for about 64% of final energy consumption in the household sector in 2019 [1], of which 28% was the consumption of renewable energy sources (RES). Achieving the goals of climate neutrality requires a profound transformation of the heating sector especially as the minimum requirements for the use of RES in heat production are planned to be gradually increased to ensure a fully decarbonised district heat (DH) system by 2050 [2]. In order to meet this requirement, there has been an increasing trend in the integration of renewable energy sources into both existing and new DH systems. According to the review and the comparative study of the large-scale solar thermal systems in leading countries [3], in 2016 a total of 366 MW was installed in solar collectors in Denmark, China, Germany and Austria. Denmark topped the record with 348 MW installed capacity in 2016. Austria installed a solar thermal plant, buffer storage and storage integrated compression heat pump of a total gross floor area of 48,860 m2 and total heat demand of 3400 MWh/year. In 2018, almost 1.55 GWt of solar thermal plants were installed worldwide; this can be translated to an area of 2.2 million m2 of solar collectors [3], Denmark being the forerunner with 970 MWt installed. The development of solar-based district heating systems is influenced by many factors, including location, political and economic support systems and funds to finance investments. The most used solar technology in existing district heating systems in the European Union is flat solar collectors. Most flat-plate collectors consist of aluminum (cheaper) or copper (more expensive) tubes and heat-absorbing materials inside an insulated frame covered with transparent glazing. In large-scale systems, the most common are collectors with a unit area of 12 m2 to 14 m2 [3]. The use of single modules with a larger surface area allows us to reduce the cost of hydraulic connections between individual collectors, as well as the structure enabling their mounting on the ground. As heat losses increase with the rising operating temperature, at higher temperatures of up to approx. 80 °C double glazing and additional insulation are implemented. Vacuum collectors are used in a higher temperature range, 80–100 °C (fewer losses). The temperature range above 150 °C is appropriate for parabolic focusing collectors. According to [4], the benefits of using the CSP (Concentrating Solar Power) technology with parabolic collectors are promising profitability of the investment, technology maturity and considerable operating experience. In contrast, CSP technologies are used to a greater extent to generate electricity. However, there are solutions where water, after initial heating in flat plate collectors to approx. 70 °C, is transferred to parabolic collectors which raise its temperature to 98 °C (e.g., a heating plant in Aalborg). It is worth noting that concentrating collectors mostly only absorb direct solar radiation, while flat plate collectors absorb both direct and diffuse radiation. One of the largest solar installations for district heating is in Silkeborg, Denmark. The solar collector installation in Silkeborg has a total thermal capacity of 110 MW and covers an area of 156,694 m2 [5]. Considering that the highest amount of heat production in solar thermal plants occurs in the summer and inversely the highest heat demand is in the wintertime it is necessary to integrate heat storage into such district heating systems.
This work is limited to low-temperature storage, that use the specific heat of the working fluid. These are currently the cheapest, simplest and most common storage systems. They can be divided into above-ground and underground storage. Ground storage (called heat accumulators) is most often steel water tanks (TTES) used for short-term heat storage on an hour/day timescale. The main reason for installing TTES storage by producers of district heating is to make the operation of cogeneration units more flexible, allowing them to maximize their profits from the sale of electricity (i.e., the units work at full capacity in periods with high electricity prices and the heat is then stored in the storage tank). Underground storage facilities are used for seasonal heat storage on a daily/monthly basis. These storage systems use a medium such as soil, water and gravel. In the case of storage in a medium other than water, heat exchangers are required to be placed inside them, which reduces efficiency and increases heat loss. In district heating systems integrated into large-scale solar heating plants existing in Europe, PTES (pit thermal energy storage) solutions, in which water is the heat accumulating medium, undoubtedly have the largest storage capacity [6]. As the water serves as both the heat carrier and the storage medium there is no need to install additional heat exchangers inside the storage unit. They are built by hollowing a trench insulated with a special polymer coating ensuring water-tightness. From above, the storage is covered with an insulating protective layer with a special drainage system for removing rainwater. Compared to above-ground storage, PTES are characterized by larger capacities and lower unit capital expenditures. In both TTES and PTES non-pressurized water tanks are used. During their charging, hot water is fed to the upper section, and at the same time cold water is received from the lower section. The intermediate layer between hot and cold water moves to the bottom of the tank and the amount of heat stored in the tank increases. Unloading of storage systems is carried out by collecting hot water from the upper part of the tank and feeding the cooled water to the lower part of them. The intermediate layer moves towards the upper part of the tank. The water level in the tanks is practically unchanged [7].
The largest PTES heat storage in Europe with a capacity of 205,000 m3 is located in Vojens, Denmark. It is integrated into the district heating system, in which about 50% of the heat is generated in solar collectors supplying approximately 64 GWh of heat to consumers. The collectors have a thermal capacity of 49 MWt and cover an area of 70,000 m2. Although the maximum water temperature in this storage could reach 95 °C, under operating conditions it is maintained at a lower level of 80–90 °C. According to [8], the construction of depositories such as those in Vojens requires detailed geotechnical research confirming the possibility of building said storage system in a given area. Basic information about sample storage systems is presented in Table 1.
District heating systems in Poland have been predominantly supplied by coal-fired heating plants and combined heat and power plants (CHPs) for many years. Established interests have created an enduring sociotechnical configuration centered around existing solutions in which fossil fuels play a major role in district heating. Existing infrastructure, industry structure, techno-scientific knowledge, policies, user practices and local heat markets are aligned with them. This makes it difficult for new technological solutions, such as the ones proposed in this paper consisting of large-scale solar thermal and seasonal heat storage, to breakthrough. Tank heat accumulators are quite commonly used in Poland, characteristics of the selected heat accumulators are presented in Table 2.
Poland, however, lacks seasonal energy storages that will make it possible to utilize the heat produced in large-scale solar collectors for covering heat demand during wintertime.
The development of a robust plan for the transformation of coal-based into sustainable RES-based district heating systems requires the use of both short-term operational planning and long-term strategic planning methods [11]. There have been multiple studies related to the short-term planning of operation, scheduling and development of control strategies for district heating systems. Most often the main objective is to minimize the overall short-run marginal costs by optimizing system performance. The issue of uncertainty of variable RES-based generation is one of the major concerns in operation planning. An innovative algorithm has been proposed by [12] for Robust Model Predictive Control (RMPC) for microgrids that included both electrical and thermal devices. The heating side covered heat pumps, micro CHPs, thermal energy storage systems as well as controllable and non-controllable thermal loads. The results of the case study showed that compared to the deterministic formulation of the scheduling problem, in the case of RMPC in which the uncertainties in the forecast of heat demand, RES generation, and electricity and gas pricing have been addressed there is a substantial decrease in the thermal balance breach [12].
Additional flexibility is provided when DH systems are equipped with energy storage. An approach to energy storage operation planning is proposed by [13]. This strategy considers the uncertainty associated with distributed generation from RES. Instead of conventional methods that require the stored energy to be at a constant level or higher at the end of the planning horizon, a set of methods and models have been developed to control the storage in a way that accounts for the uncertainty associated with RES generation beyond the planning horizon.
Contrary to short-term operation planning the number of studies on the long-term planning of district heating system expansion is rather limited. It was noted by [14] that the literature dealing with DH system expansion, and especially with the associated modeling aspects, remains scarce and is mainly owned by private companies. Therefore, they developed a mixed-integer linear programming model to find an optimum strategy to expand an existing district heating system including technology sizing and spatial network extension. This model was developed in the General Algebraic Modelling System (GAMS). The generation options included natural gas-fired CHP plants, heat pumps, natural gas boilers and biomass boilers. As the considered technologies had different investment costs and lifetimes, the methodology offered an adequate comparison criterion that combined different cost variables. A mixed-integer linear model with endogenous decision-making was developed by [15]. This model was used in the case study in the area of Zagreb to optimize the expansion of generation capacities as well as pipeline infrastructure. Besides standard costs components included in short-term operation planning, the objective function also included the investment costs into new generation assets.
Our study contributes to long-term generation expansion planning (GEP). The model developed in this work with the use of the TIMES generator belongs to the family of linear optimization energy-economic models. TIMES is not an engineering tool for simulating thermodynamic processes and short-term system dynamics. The major role of models generated with TIMES is to estimate the energy system dynamics over a long-term. Therefore, TIMES models are suited for the exploration of possible energy futures based on contrasted scenarios. The model provides optimal solutions under the assumption of perfect foresight, which means that the agents precisely know the values of parameters such as district heat demand, fuel prices, CO2 emissions, etc., in future years. In reality, the values of such parameters are subject to uncertainty and therefore, their possible impact has been captured with the use of the scenario approach and sensitivity analysis in which the values of selected parameters have been redefined. The research questions addressed in this paper are as follows: (i) To what extent is it possible to increase the penetration of solar thermal in a large-scale district heating systems such as the ones that exist in big cities in Poland? (ii) What are the costs of transforming coal-based district heating systems into less carbon intensive ones based on solar thermal technologies? (iii) How can solar thermal technologies be integrated into DH systems? (iv) How would the daily operation profile look like with large scale solar thermal integrated into DH systems? (v) What are the area constraints to establish solar heating plants and seasonal heat storages?
The novelty of this paper is the use of the TIMES generator for local planning of the expansion and operation of the large-scale solar-based district heating systems. The paper provides new insights into the possibilities of using solar thermal technology integrated with the pit thermal energy storage in the district heating systems in Poland. The economic viability of such systems was evaluated considering forecasted changes in prices of natural gas prices and CO2 emission allowances. From the optimization point of view, the model is simultaneously considering the investment and operation decisions including heat storage, with high penetration of intermittent solar-based heat generation.
The novelty of the paper is also that it attempts for the first time to identify the technical and infrastructural challenges associated with such large district heating systems.
According to [16] technological transitions occur not only by offering new technologies but as the outcome of linkages between developments at multiple levels that include political, economic and legal frameworks that create favorable conditions, so-called socio-technical landscape, for their increasingly wider use. It is very important to raise stakeholder awareness by providing results of qualitative and quantitative studies on new technological solutions and showing the implications of their application. Unfortunately, the number of such studies is still insufficient. Therefore, this case study contributes to building a socio-technical innovation to accelerate Polish DHS technological transition.

2. Materials and Methods

2.1. Modelling the Transformation of the District Heating Systems

The approach based on the TIMES modeling framework was used to optimize the transformation of the district heating systems and to investigate their economic performance. TIMES is a tool developed by the International Energy Agency (IEA) [17]. In this paper, a simplified model of the six district heating systems mentioned above was developed using TIMES. The model made it possible to reflect the general energy balance of the systems without considering the modeling of hydraulic processes occurring in the network piping. The result of the model includes the structure of installed heat capacity and the system operation to meet the given demand. A full description of the TIMES methodology can be found in [18]. Below only the most relevant equations are briefly described. In addition to the built-in mathematical formulas, any type of linear equation or inequality can also be incorporated into the model by the user.

2.1.1. Mathematical Description of Main Equations

The model aims to minimize the total discounted costs of satisfying the demand for district heat in the tested systems. These costs consist of the investment cost of new capacity I n v , variable operation costs V a r   and fixed costs F i x . Discounting is done through the discount factor D for all modeling years y . The minimized objective function is defined as:
O b j = y I n v y + V a r y + F i x y · D y
TIMES considers both economic and technical parameters (e.g., efficiency, availability) of energy technologies. The model is capable of handling additional constraints, such as the required share of renewable energy in heat generation.
For each modeling year, this study assumed daily temporal resolution (time slices). The model ensures that the heat demand E t s D E M is met in each time slice t s by the sum of the individual heat production E t , t s of technologies t .
t E t , t s E t s D E M   t s
Maximum heat production of a given technology t is limited by its installed capacity C t and annual availability factor A V t . C 2 A converts units of capacity into units of heat
E t C t · A V t · C 2 A   t
A similar equation is used to limit the maximum heat production at the time slice level E t , t s by the time slice availability factor A V t , t s .
E t , t s C t · A V t , t s · C 2 A t , t s  
This equation was used to reflect the variable production of a solar thermal plant. The values of A V t , t s were determined using the solar irradiation data described in Section 2.3.
TIMES allow setting a peak reserve P R F , which guarantees a safety margin in proportion to peak heat demand D P e a k . This margin ensures against certain random events that are not explicitly represented in the model.
t C t · P F t D P e a k · P R F
The share of available capacity C t of technology t at peak demand depends on a factor P F t . This factor is close to unity for stable generators and energy storage.
Heat storage dynamics, i.e., the evolution in time of the energy stored E t s S T G is tracked at time slice level t s by the energy balance equation
E t s S T G = E t s 1 S T G + E t s S T G , I N E t s S T G , O U T η S T G t s  
where E t s S T G , I N and E t s S T G , O U T stand for charging and discharging of the storage, respectively. The overall storage efficiency η S T G is expressed with respect to the discharge only.

2.1.2. Scenarios

The optimization of infrastructure development was carried out for a period of 25 years for two scenarios:
  • STAT scenario—constant price scenario (freezing the economic and technical parameters in the period 2025–2050 at the level of 2025).
  • DYN scenario—a scenario in which parameters, such as gas prices, prices of CO2 emission allowances change over time in the period 2025–2050.
The perfect foresight optimization was carried out covering the entire modeling period.

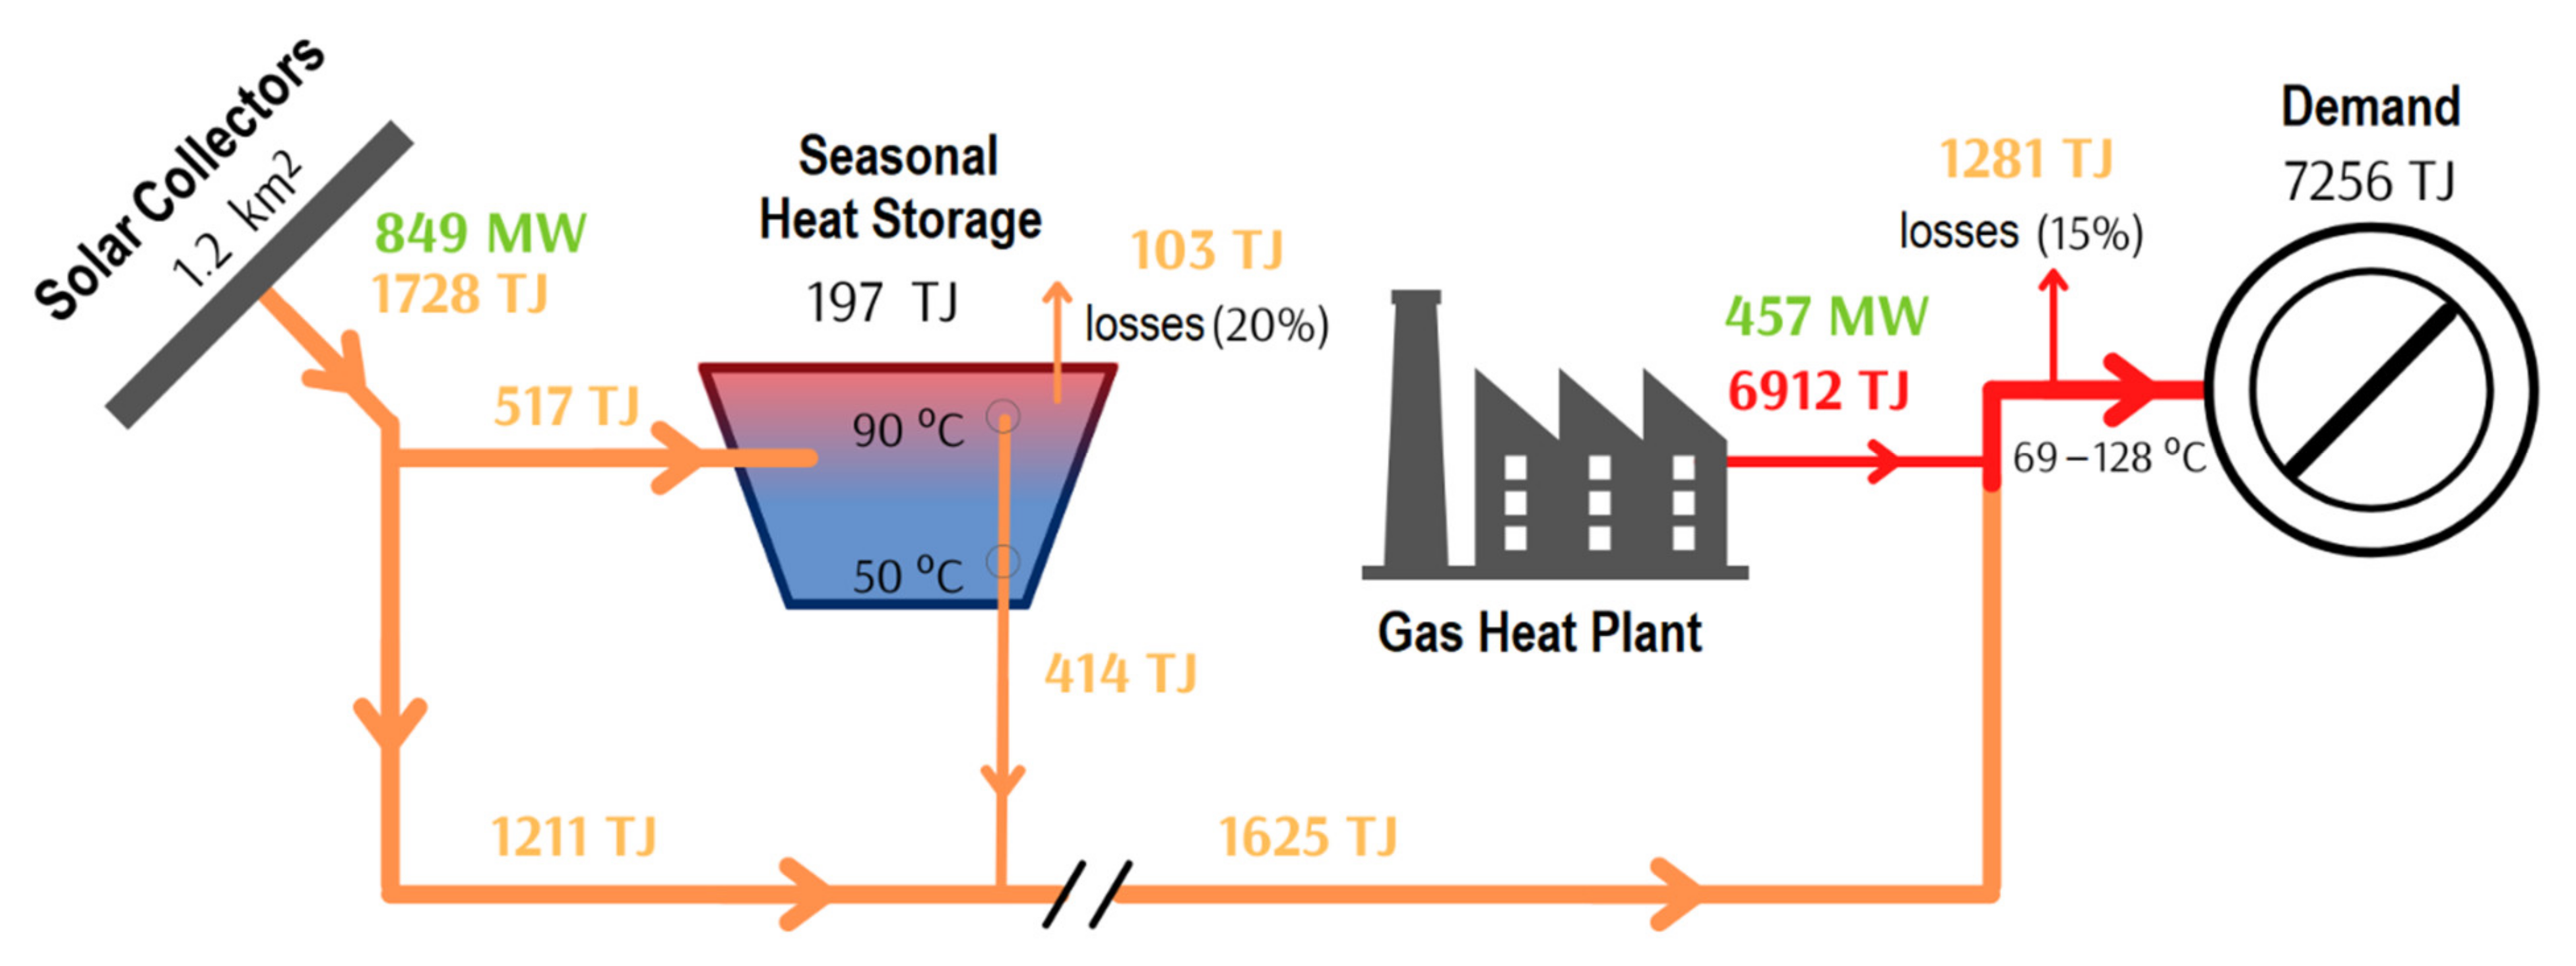
2.1.3. Topology of the District Heating System

The considered district heating systems consisted of three elements:
  • Flat solar collectors
  • Natural gas boilers
  • Seasonal heat storage
Figure 1 shows the schematic diagram of the tested system for the STAT scenario with 20% of RES in overall heat production. During the period April–October a part the heat produced from solar collectors is used directly to cover the current heat demand. The other part is tranferred to the seasonal heat storages. The gas boilers act as a flexible heat source covering the residual heat demand, which is the difference between the real heat demand of consumers and the production of heat from a renewable energy sources. They are also used to increase the temperature of the working medium to the required levels in the network.

2.1.4. Techno-Economic Parameters

Technical and economic characteristics of the heat generation technologies including the values of typical parameters required by the TIMES generator are presented in Table 3.
Table 4 presents the main parameters adopted for the heat storage technology of the PTES type. Despite an extended literature review, it has been difficult to pinpoint appropriate values for both fixed and variable operating costs.
Gas prices for heating were estimated for 2018 based on publications [19,20]. Then, it was assumed that this value would change in line with the forecast of natural gas import prices to the EU included in the Polish Energy Policy until 2040 [21]. The gas prices adopted in the calculations for all modelling years are presented in Table 5.
The prices of carbon dioxide emission allowances listed in Table 6 were taken from the results of the CAKE group with KOBIZE [22] obtained for the Climate Neutrality scenario.
Moreover, since the objective function of the TIMES model includes the sum of the discounted costs of the system operation, a discount rate of 8% was adopted.

2.2. Heat Demand

Six different areas located in Poland, called hereafter A-F, were considered in the study. It was assumed that each has a separate district heating system. The total production in all analyzed regions amounted to ca. 8.5 PJ. It was assumed that the winter and summer seasons last 210 and 155 days, respectively. In the summer season, there is only a demand for domestic hot water (DHW), accounting for 15% of the total annual heat production; a constant daily demand for DHW was assumed. The heat demand for space heating (SH) was spread over individual days based on the heating degree days calculated according to the Eurostat method with a base temperature of 18 °C. Average daily temperatures were used based on [23]. The results are shown in Table 7.

2.3. Heat Production and Storage Technologies

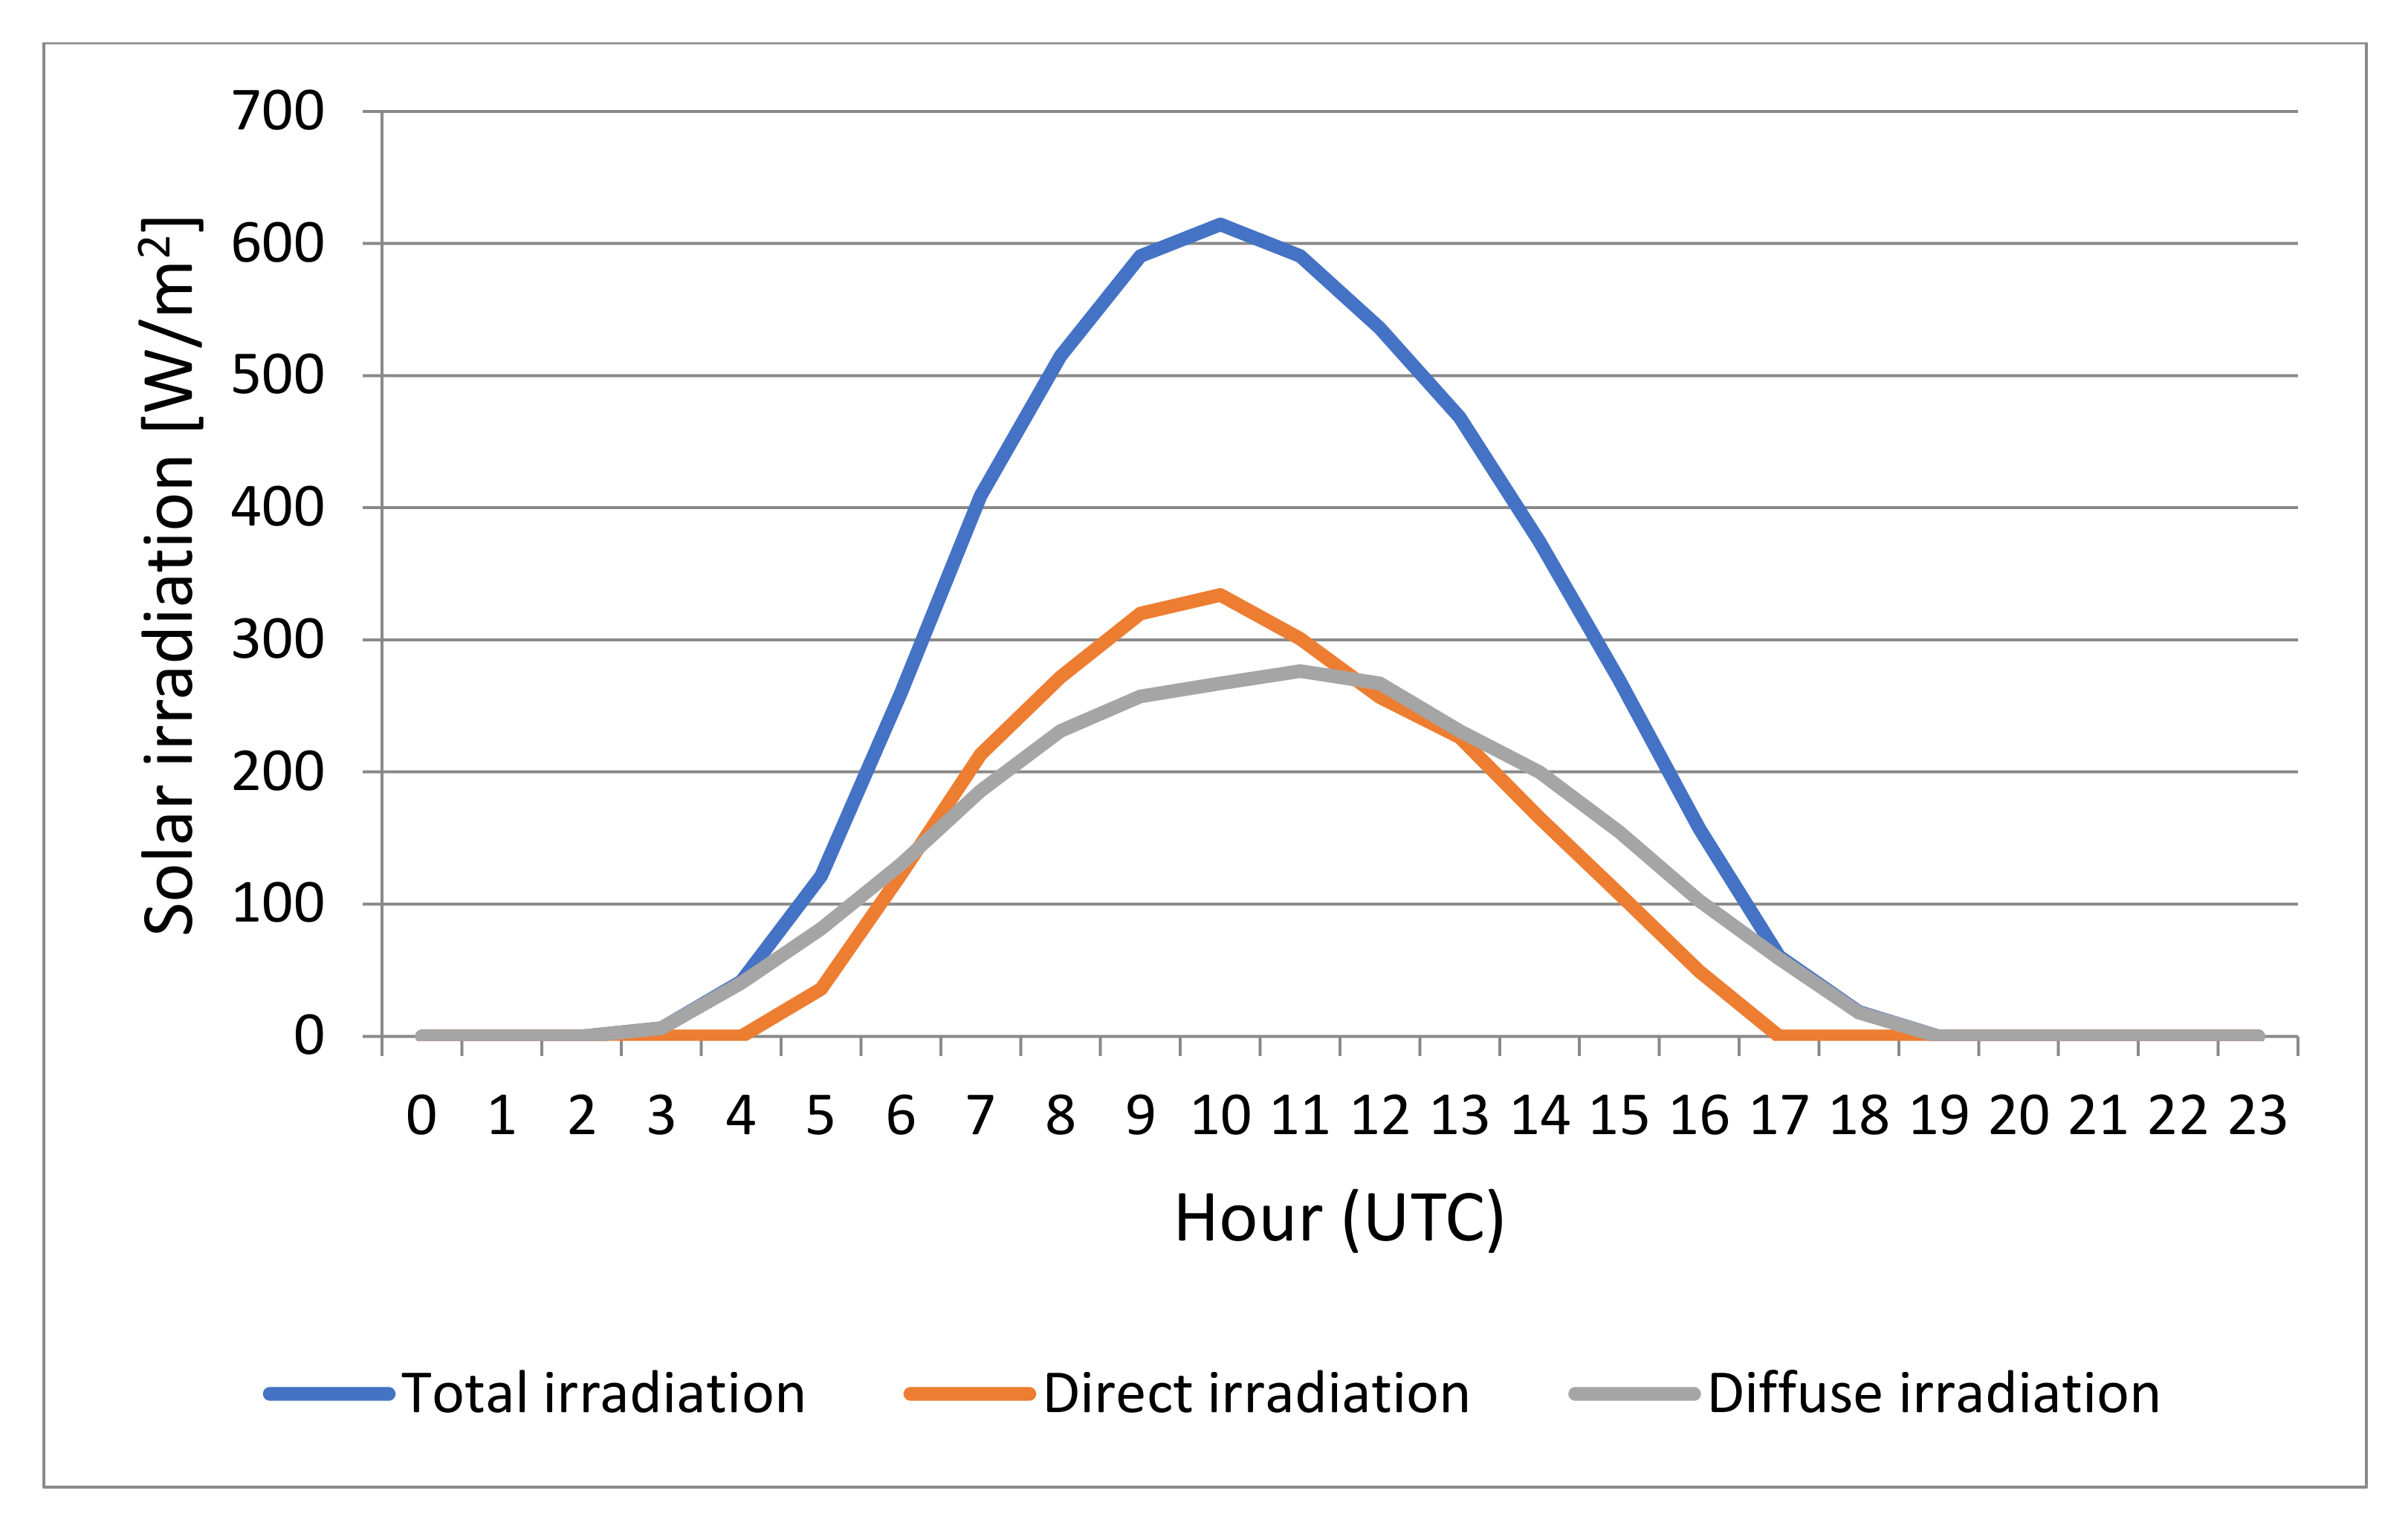
2.3.1. Heat Production in Solar Collectors

The setting of solar collectors has a considerable influence on the efficiency, the collectors should be oriented south (0° azimuth angle). According to the article [24], the optimal inclination angle of a flat plate collector for the area of Poland is approximately 40°.
The useful heat production from a solar collector Q u can be described by Equation (7):
Q u = Q 0 Q l     Q 0 > Q l 0                               Q 0 Q l      
where:
Q 0 —solar energy absorbed by the collector (excluding thermal losses),
Q l —collector thermal losses,
Q 0 can be calculated by Equation (8):
Q 0 = I · A · η 0
where:
I —solar irradiance (W/m2),
A —collectors area (m2),
η 0 —collector parameter determined empirically in the testing phase (the efficiency without considering losses).
On the other hand, thermal losses resulting from the temperature difference between the collector and the surrounding air can be quantified by Equation (9):
Q l = A · a 1 T a T a m + a 2 T a T a m 2
where:
T a —average collector temperature (depending on the temperature of the working medium in collectors),
T a m —ambient temperature,
a 1 —collector parameter determined empirically in the testing phase (the first-order thermal losses) (W/(m2K)),
a 2 —collector parameter determined empirically in the testing phase (the second-order heat losses) (W/(m2K)).
The parameters of the collectors are determined in accordance with the EN 12975 standard, whose values used in this study are presented in Table 8.
From Equation (9), the value of average temperature T a depends on many factors, such as the climate, the structure of the collectors, and its elements. However, the temperature of the working medium has a significant impact, which depends on the operating conditions of the system at a given moment. Performing detailed simulations of changing temperature of the working medium flowing through the collectors is beyond the scope of this study. It is assumed that the collector temperature will be constant, which according to [27], T a for collectors feeding heating networks is approximately 60 °C.
To calculate the useful heat production from collectors, it is required to use meteorological data, such as the value of total irradiance and the ambient temperature. This data was obtained from the PVGIS platform for Katowice in 2010 [28]. The results of the direct and diffused radiation values for this location (50°25′ N, 19°00′ E) assuming the collector inclination angle equals 40° and the azimuth angle of 0°are shown in Figure 2.
It was assumed that the installation of solar collectors generates heat merely in the April–October period (Table 9).
During this period, the total heat production per m2 of collector area (with a capacity of approximately 0.7 kWt) was 395 kWh. The heat production levels of another three projects are listed below for comparison [3]:
  • In Dronninglund, Denmark, heat production is 493 kWh/m2/year
  • In Büsingen, Germany, heat production is 603 kWh/m2/year
  • In Salzburg, Austria, heat production is 533 kWh/m2/year.
The calculations made with the use of the tool [29] indicated for a latitude close to Katowice, heat production was in the range of 344 to 427 kWh/m2/year.

2.3.2. Requirements for the Minimum Land Area

It can be assumed that 3–4 m2 of soil are needed for 1 m2 of the collector, in the case of large solar installations using flat solar collectors and placed in parallel. The assumptions are justified by the installation in Dronninglund, where a ground area of 130,000 m2 was used for the installation of 37,573 m2 of collectors [5]. In other words, there are 3.46 m2 of substrate per 1 m2 of the collector. Moreover, the sources given in [30] indicate that at least 3 m² of land is needed to install 1 m² of collectors, which was employed in this study.

2.3.3. Capacity of the Seasonal Heat Storage

The seasonal heat storage PTES is assumed similar to the one in Vojens/Denmark, which uses water as the heat accumulating medium. The amount of thermal energy needed to heat water from 40 °C to 90 °C, i.e., ΔT = 50 °C, can be calculated according to the Equation (10):
Q = c w · m · Δ T
where:
ΔT—temperature difference [°C]
m—the mass of water [kg]
cw—specific heat of water amounting to 4200 [J/kg/K]
From the volume of the storage equal to 200 × 103 [m3] (approximate volume of the storage in Vojens), given the data above the amount of heat Q needed to raise the temperature of water assuming water density equal to 980 [kg/m3] is ca.11500 MWht (or 41.4 TJ). This value is also the storage capacity.

3. Results

The results show the technical, economic and infrastructural challenges associated with the transformation of large district heating systems (overall heat production of ca. 8.5 PJ) that will be served by a solar thermal with heat storage. This chapter consists of three parts. The first part introduces the aggregated heat production in the collective system (sum of production in individual areas A–F) per year in daily resolution for the STAT scenario. Results covering the main parameters of the analyzed district heating systems are also described. Next, cost information is presented, including the overall cost of heat generation and costs components. Total amount of expenditure required to achieve a given share of heat production from RES is provided. The second part of the results section is devoted to DYN scenario. In the last part, sensitivity analysis is performed.

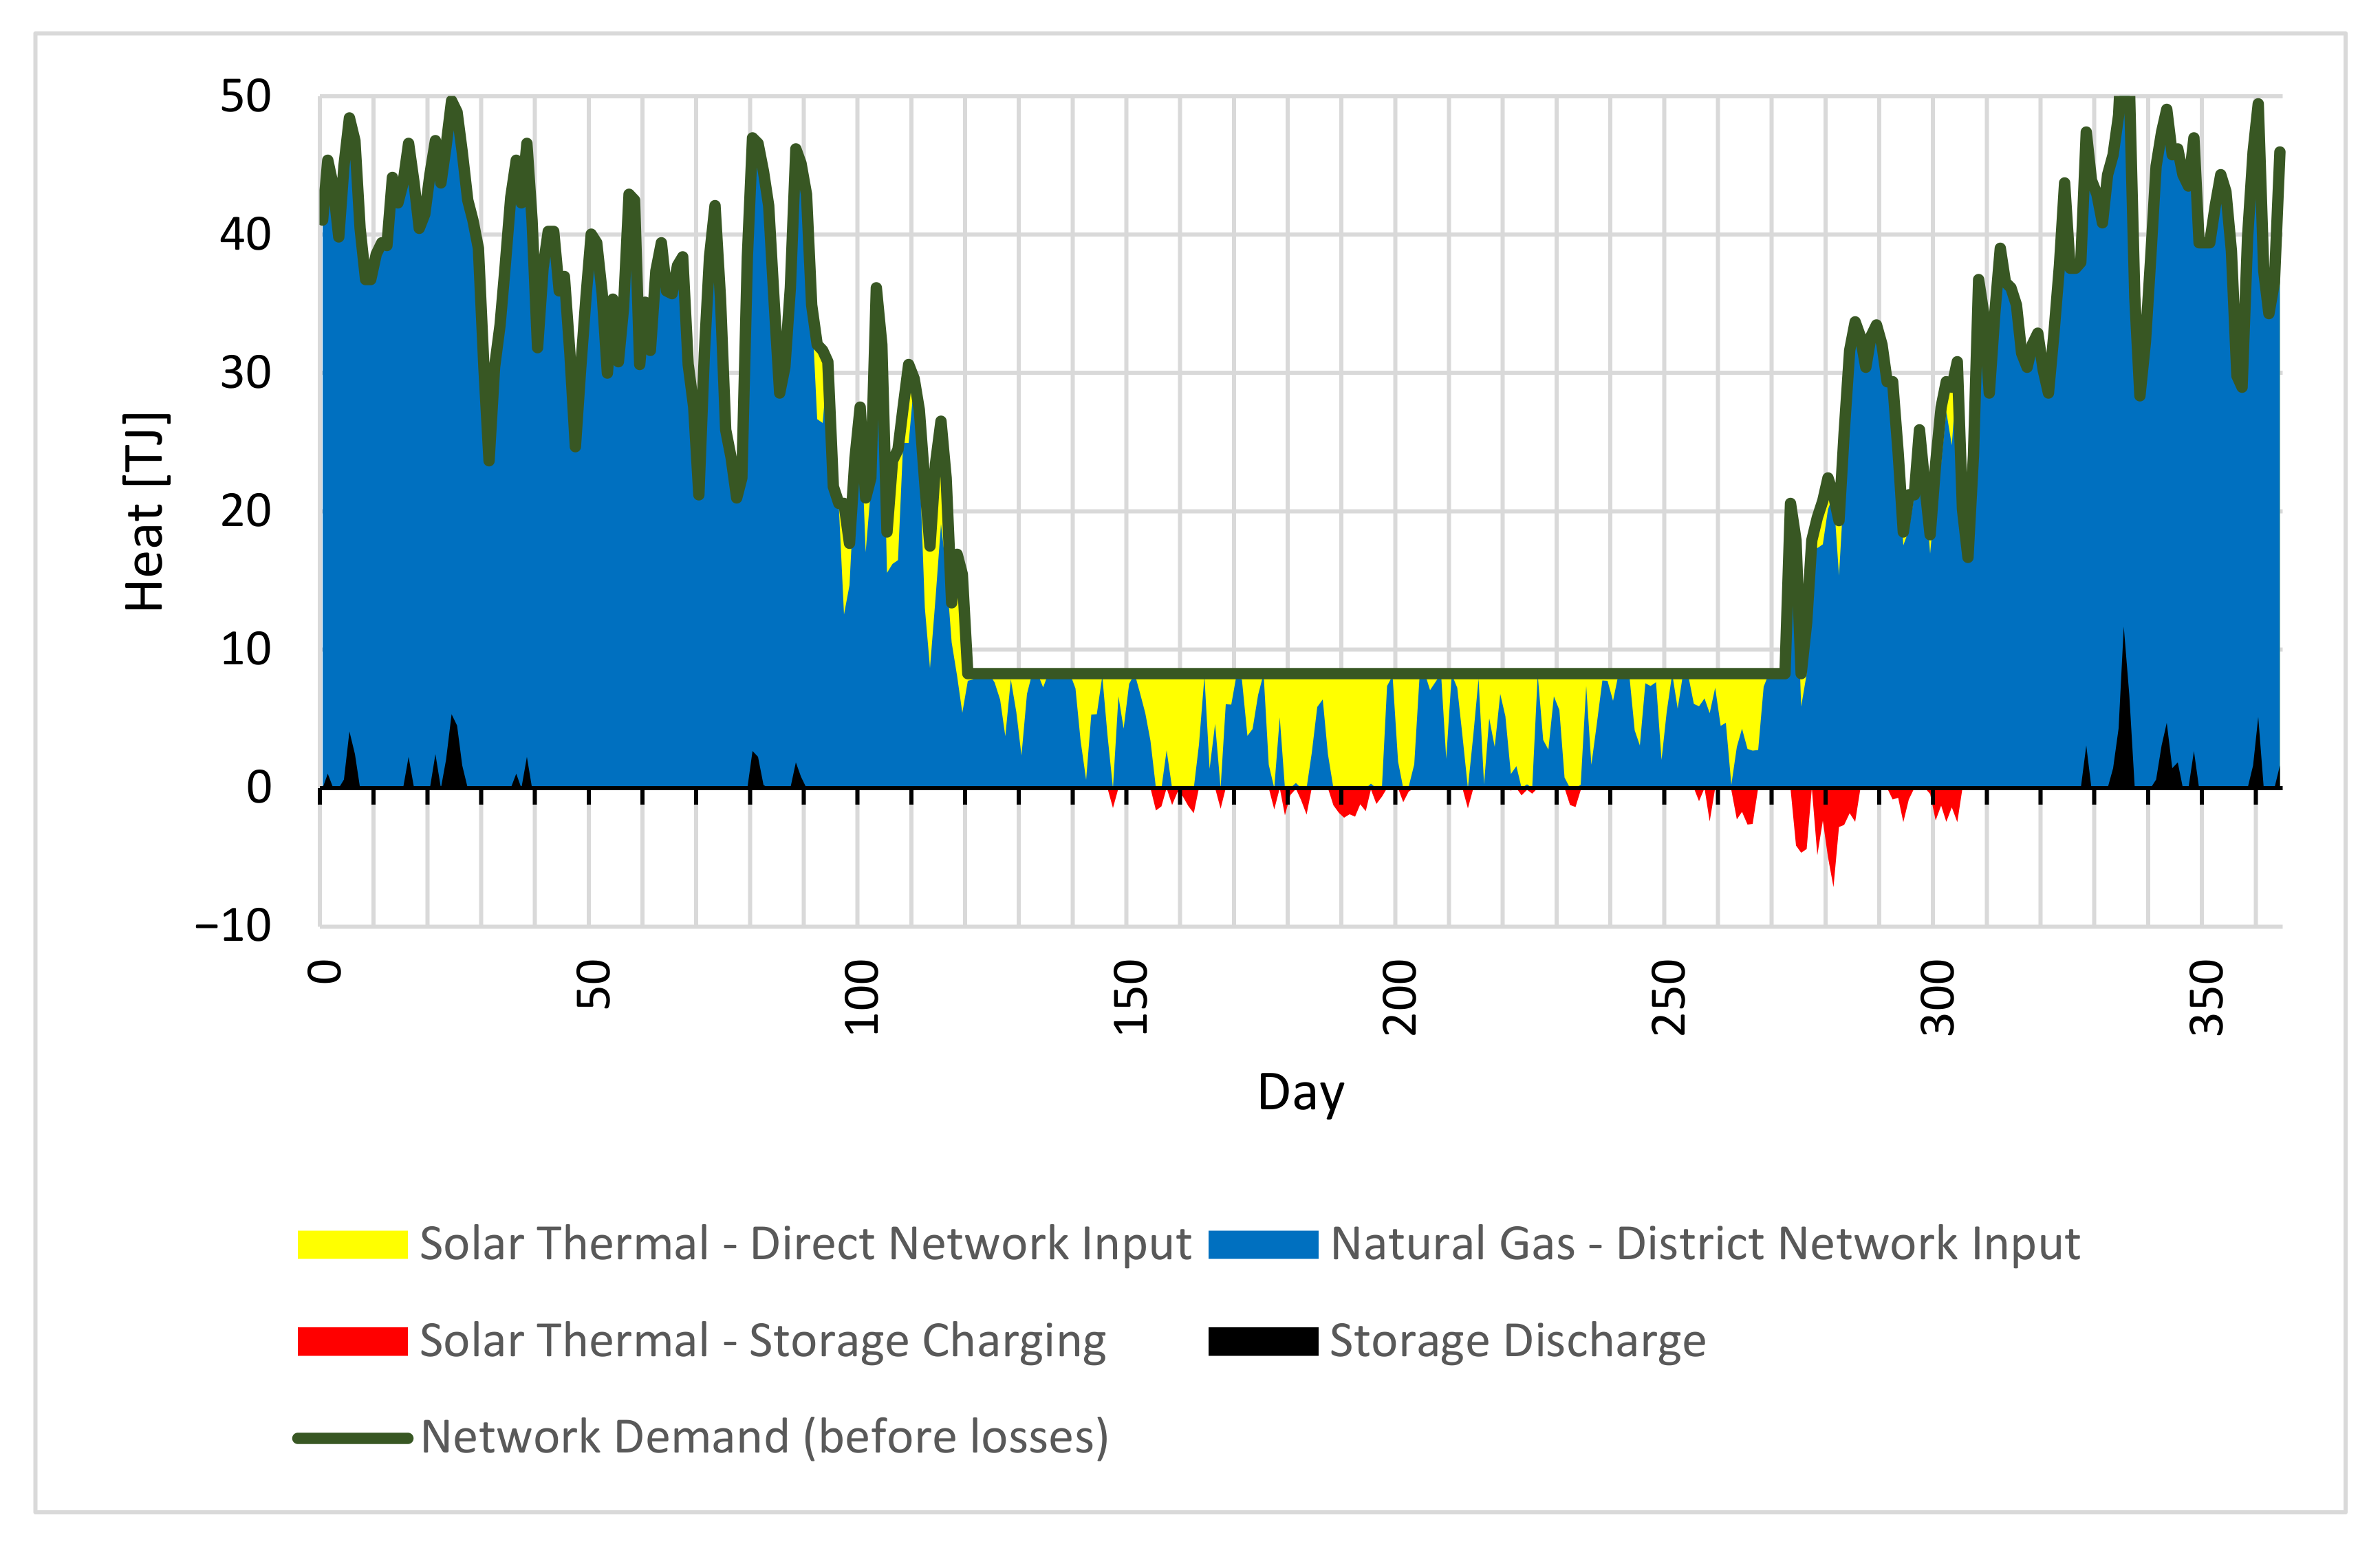
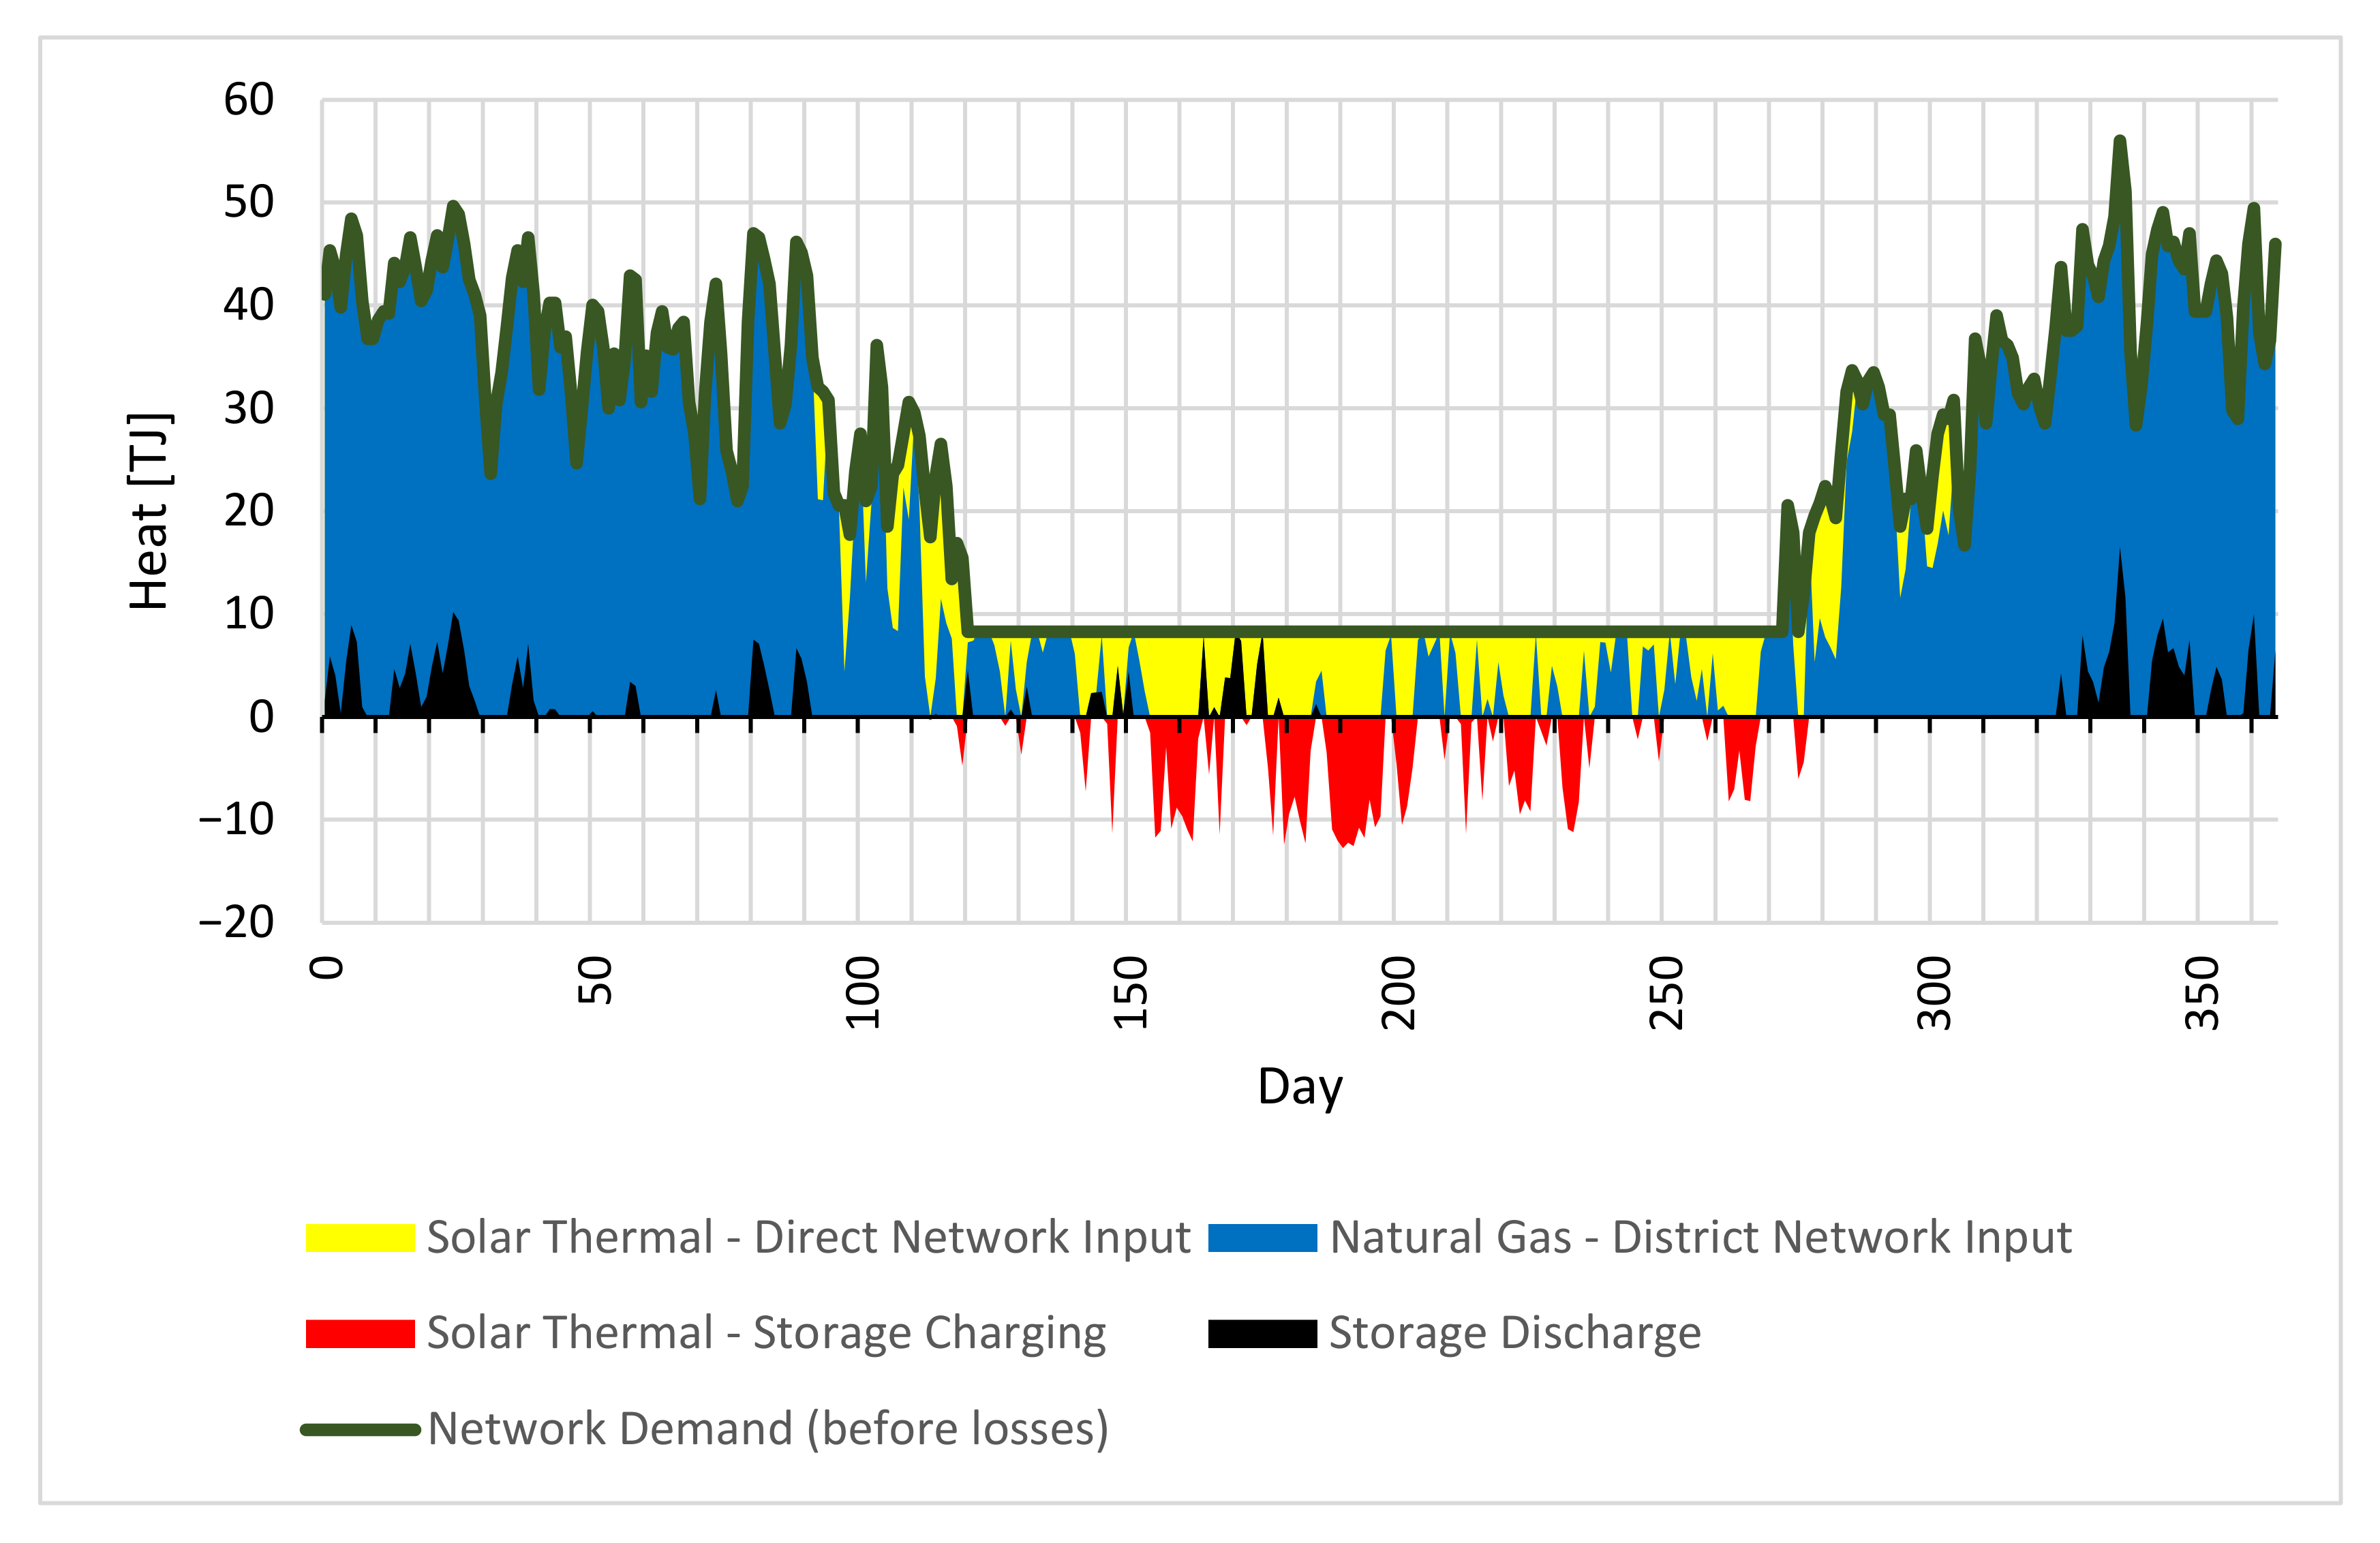
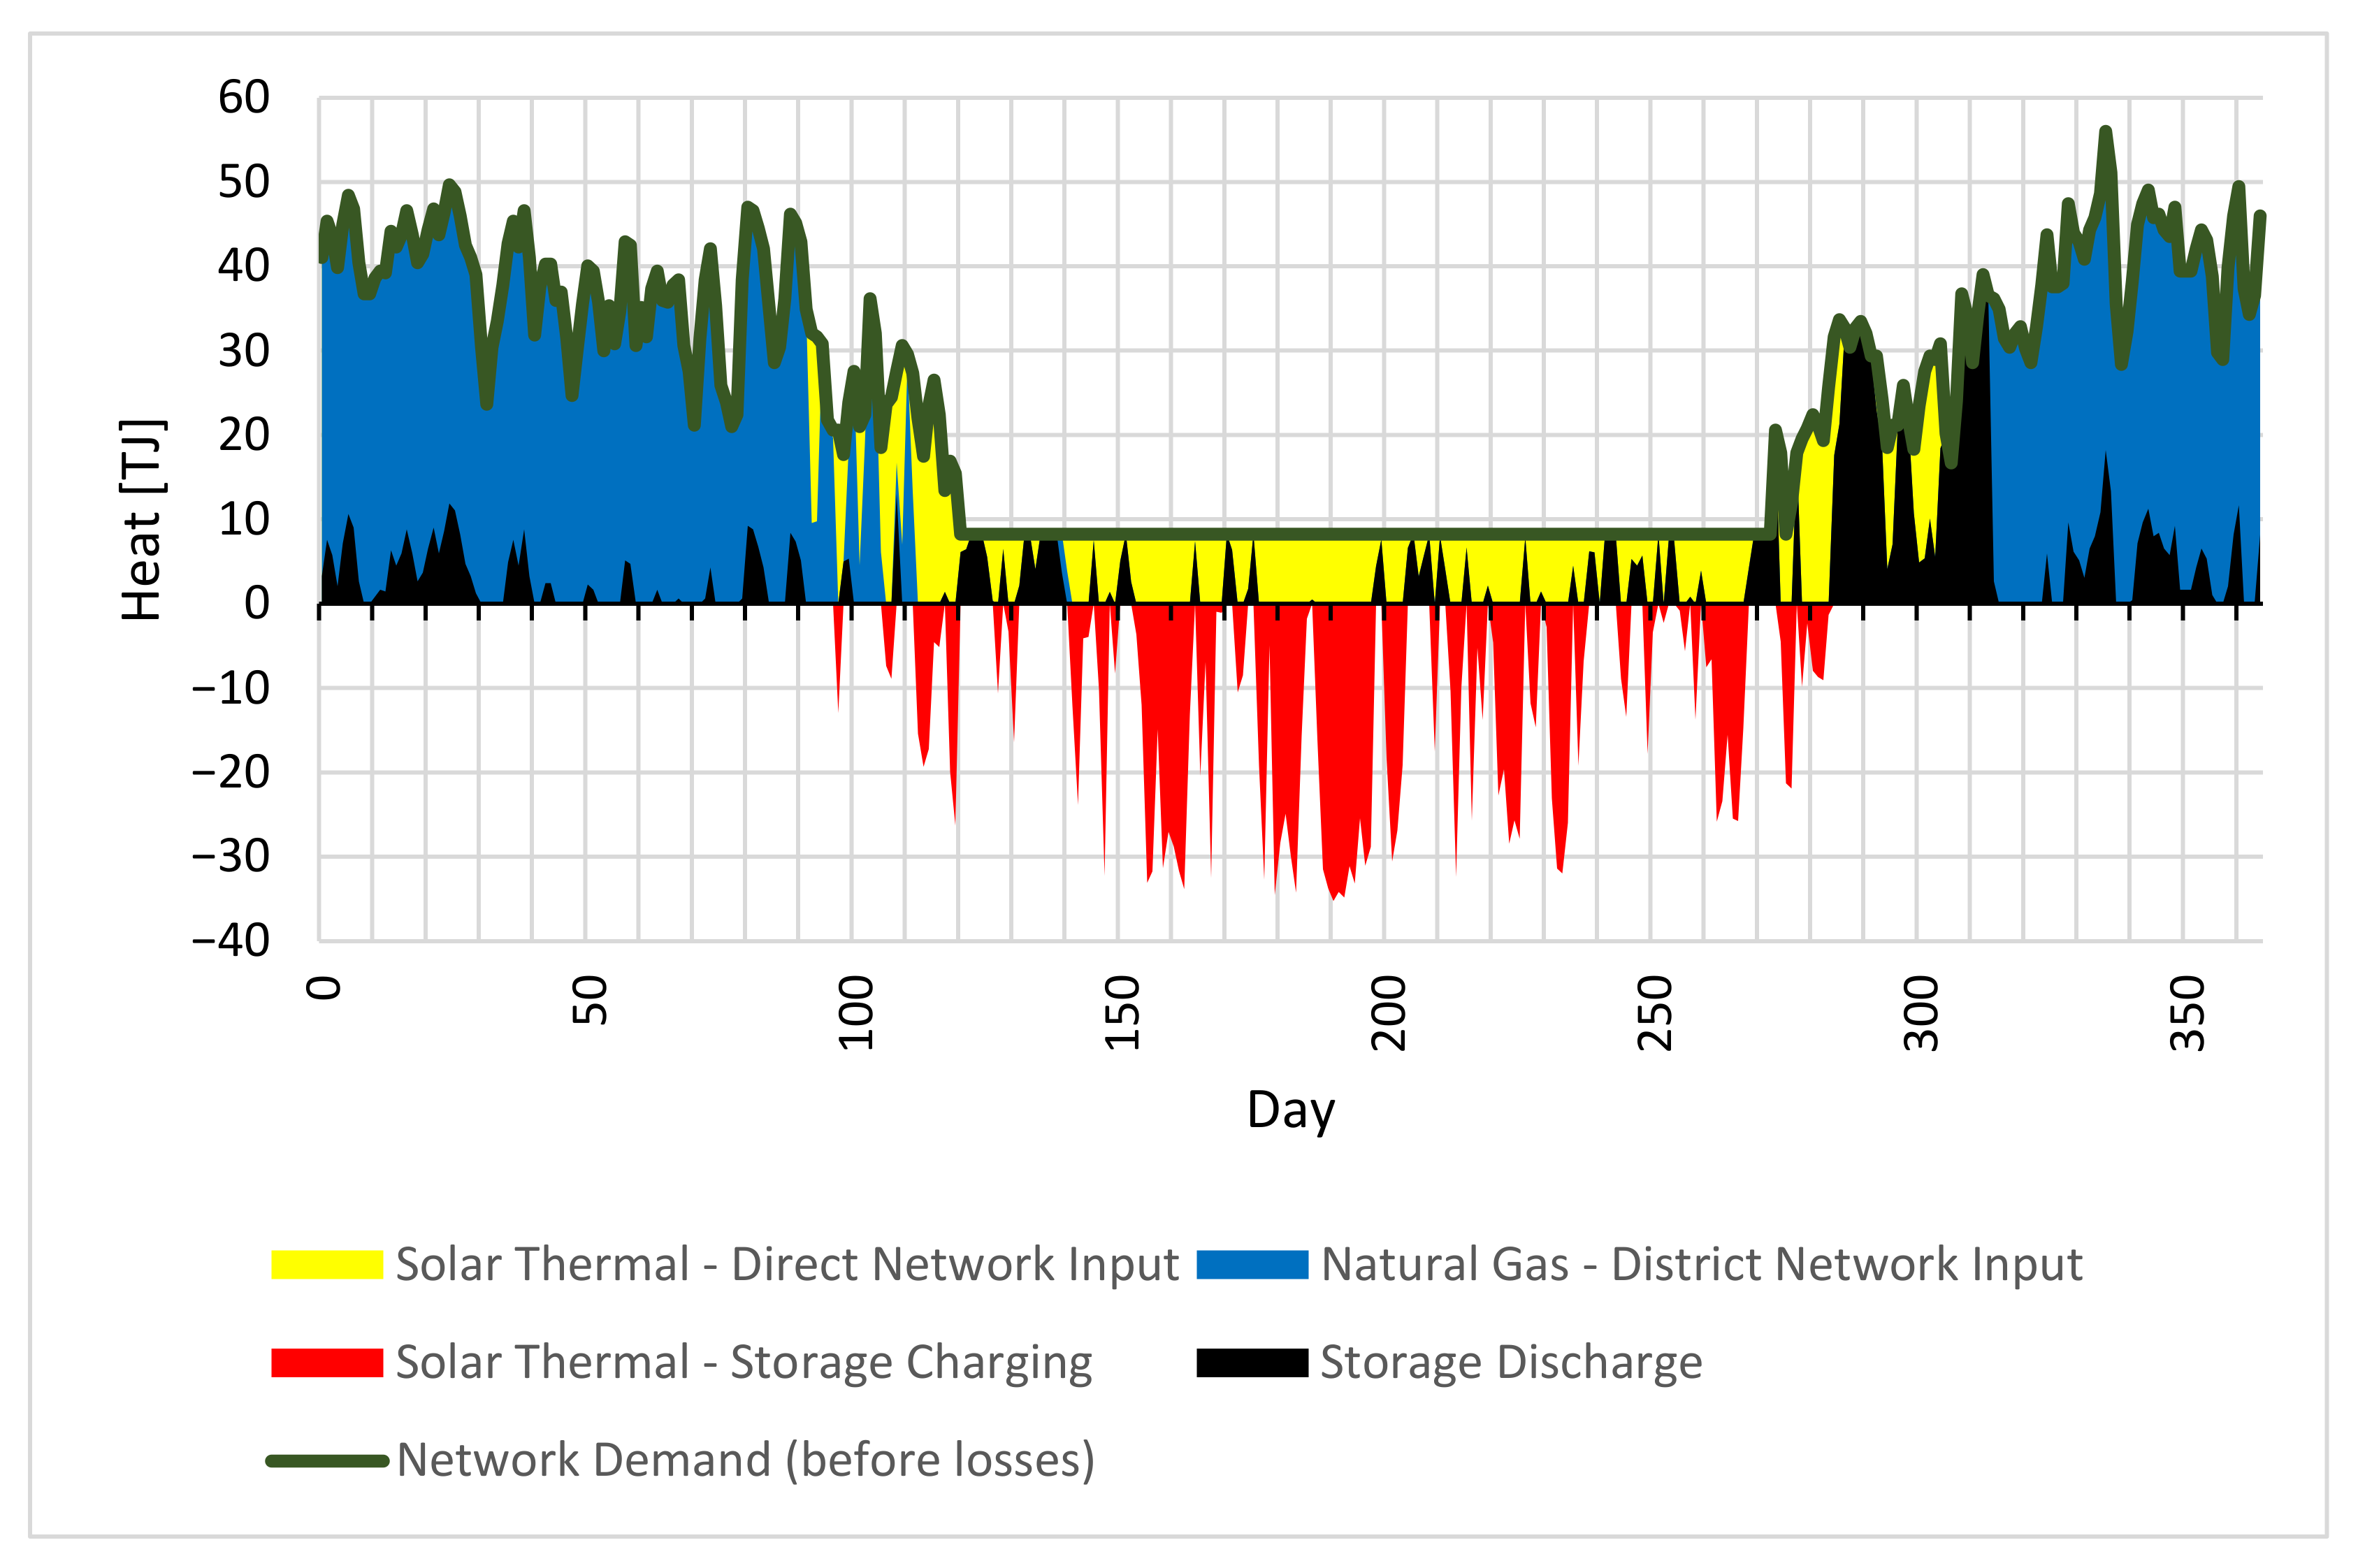
3.1. Daily Heat Production Profiles for a Fixed Price Scenario

The STAT scenario assumes that the prices of gaseous fuel and CO2 emission allowances in the period 2025–2050 are maintained at the level of the values assumed for 2025. The results are presented for various variants of the required share of heat production from solar collectors, i.e., 10% (Figure 3), 20% (Figure 4) and 40% (Figure 5), respectively.
As seen in Figure 3, for the variant with 10% share of RES in heat production, solar collectors generally meet the demand for domestic hot water during the summer.
PTES heat storage systems installed in district heating systems are relatively small (Table 10). Their total capacity is 139 TJ, which is about three times more than the heat storage in Vojens. Heat storage is discharged only outside the summer period at times of peak heat demand. This makes it possible to reduce thermal capacity installed in gas heating plants, thus reducing investment costs in these technologies.
Figure 4 shows the daily heat balance in the system for the variant with an increasing share of heat production from RES up to 20%. The characteristics of the operation of district heating systems are slightly different. Although the capacity installed in solar collectors is doubled, the capacity of heat storage increases moderately, i.e., increases by about 40% (Table 11).
To achieve the certain target of RES production, it is necessary to use the heat generated from solar collectors in the heating season. The number of days in which heat is discharged from seasonal heat storage increases.
Setting the requirement for heat production from RES to the level of 40% makes it necessary to increase the thermal capacity installed in solar collectors to over 1.7 GWt (Table 12). In such a variant, the required ground area covered with solar collectors would have to be approximately 7.5 km2 (Table 13). The capacity of seasonal heat storage is also expanding significantly, reaching a capacity exceeding 530 TJ. This means that this scenario would require the construction of twelve heat storage systems of a scale such as the one in Vojens. Since the model optimizes both the size and functioning of the system, the following implications arise in this variant. First of all, seasonal heat storage is charged to a much greater extent throughout the entire potential period, i.e., April-October (Figure 5). Secondly, a significant discharge occurs immediately after the start of the heating season with an eye on reducing heat storage losses. One should keep in mind that the model decides on such an operation of heat storage, taking into account the costs of construction and operation of the entire system, including gas heating plants.
The main parameters characterizing the variant with the required share of heat from solar collectors of 40% are revealed in Table 12.
Figure 6 illustrates the thermal capacity of heat production technologies and the storage capacity as a function of the solar energy contribution. It shows that the thermal capacity of the solar collector increases linearly with the increase in the share of RES. In the case of seasonal heat storage, the difference in their capacities for the RES share of 10% and 20% is insignificant. Only the increase in the share of RES by over 25% leads to the expansion of PTES capacities.
This is due to the fact that already for a minimum RES share required of 10% the model optimizes the size of seasonal heat storage taking into account periods with peak heat demand and the benefits from decreasing the capacities and so investments into gas boilers. Further leveling up the RES share to 25% results in deeper charging and more intensive use of the heat storage also within the summer. It should be noted that the demand for the heat outside the heating season is 15% of the annual demand. Change of the RES shares from 10% up to 50% has a rather limited impact on the total capacity installed in gas heating plants, which decreases slightly with the increase in the required RES share.

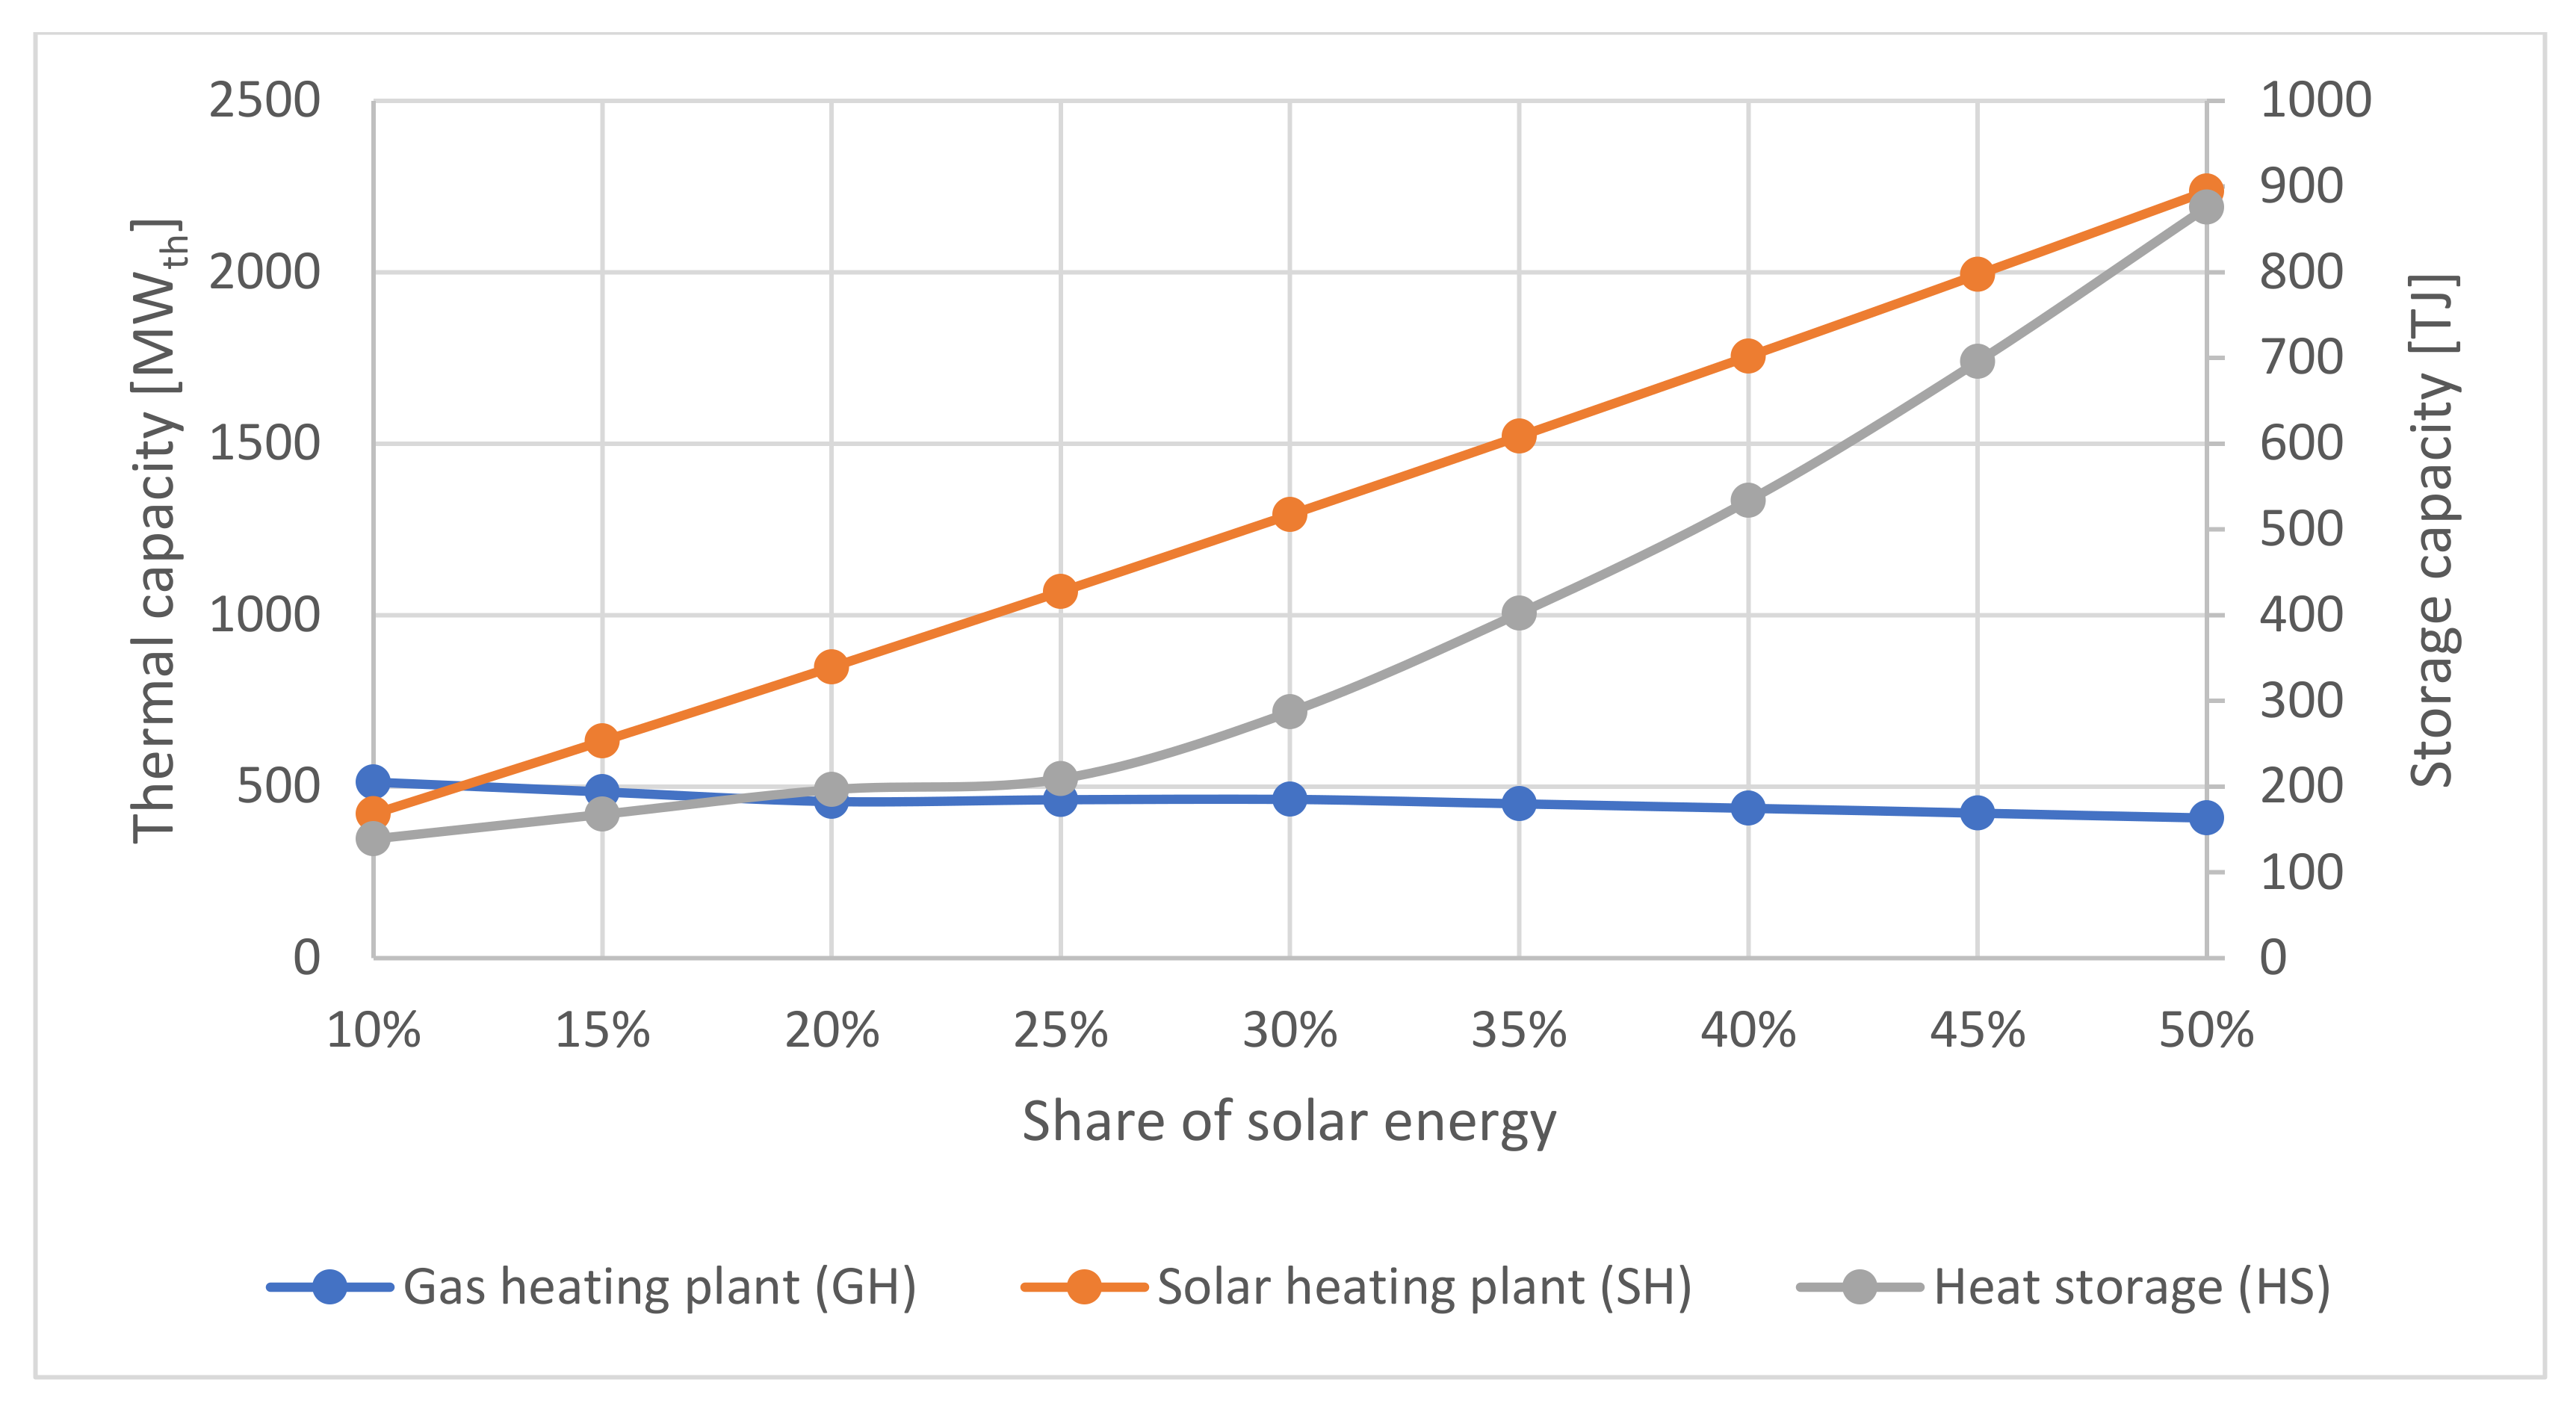
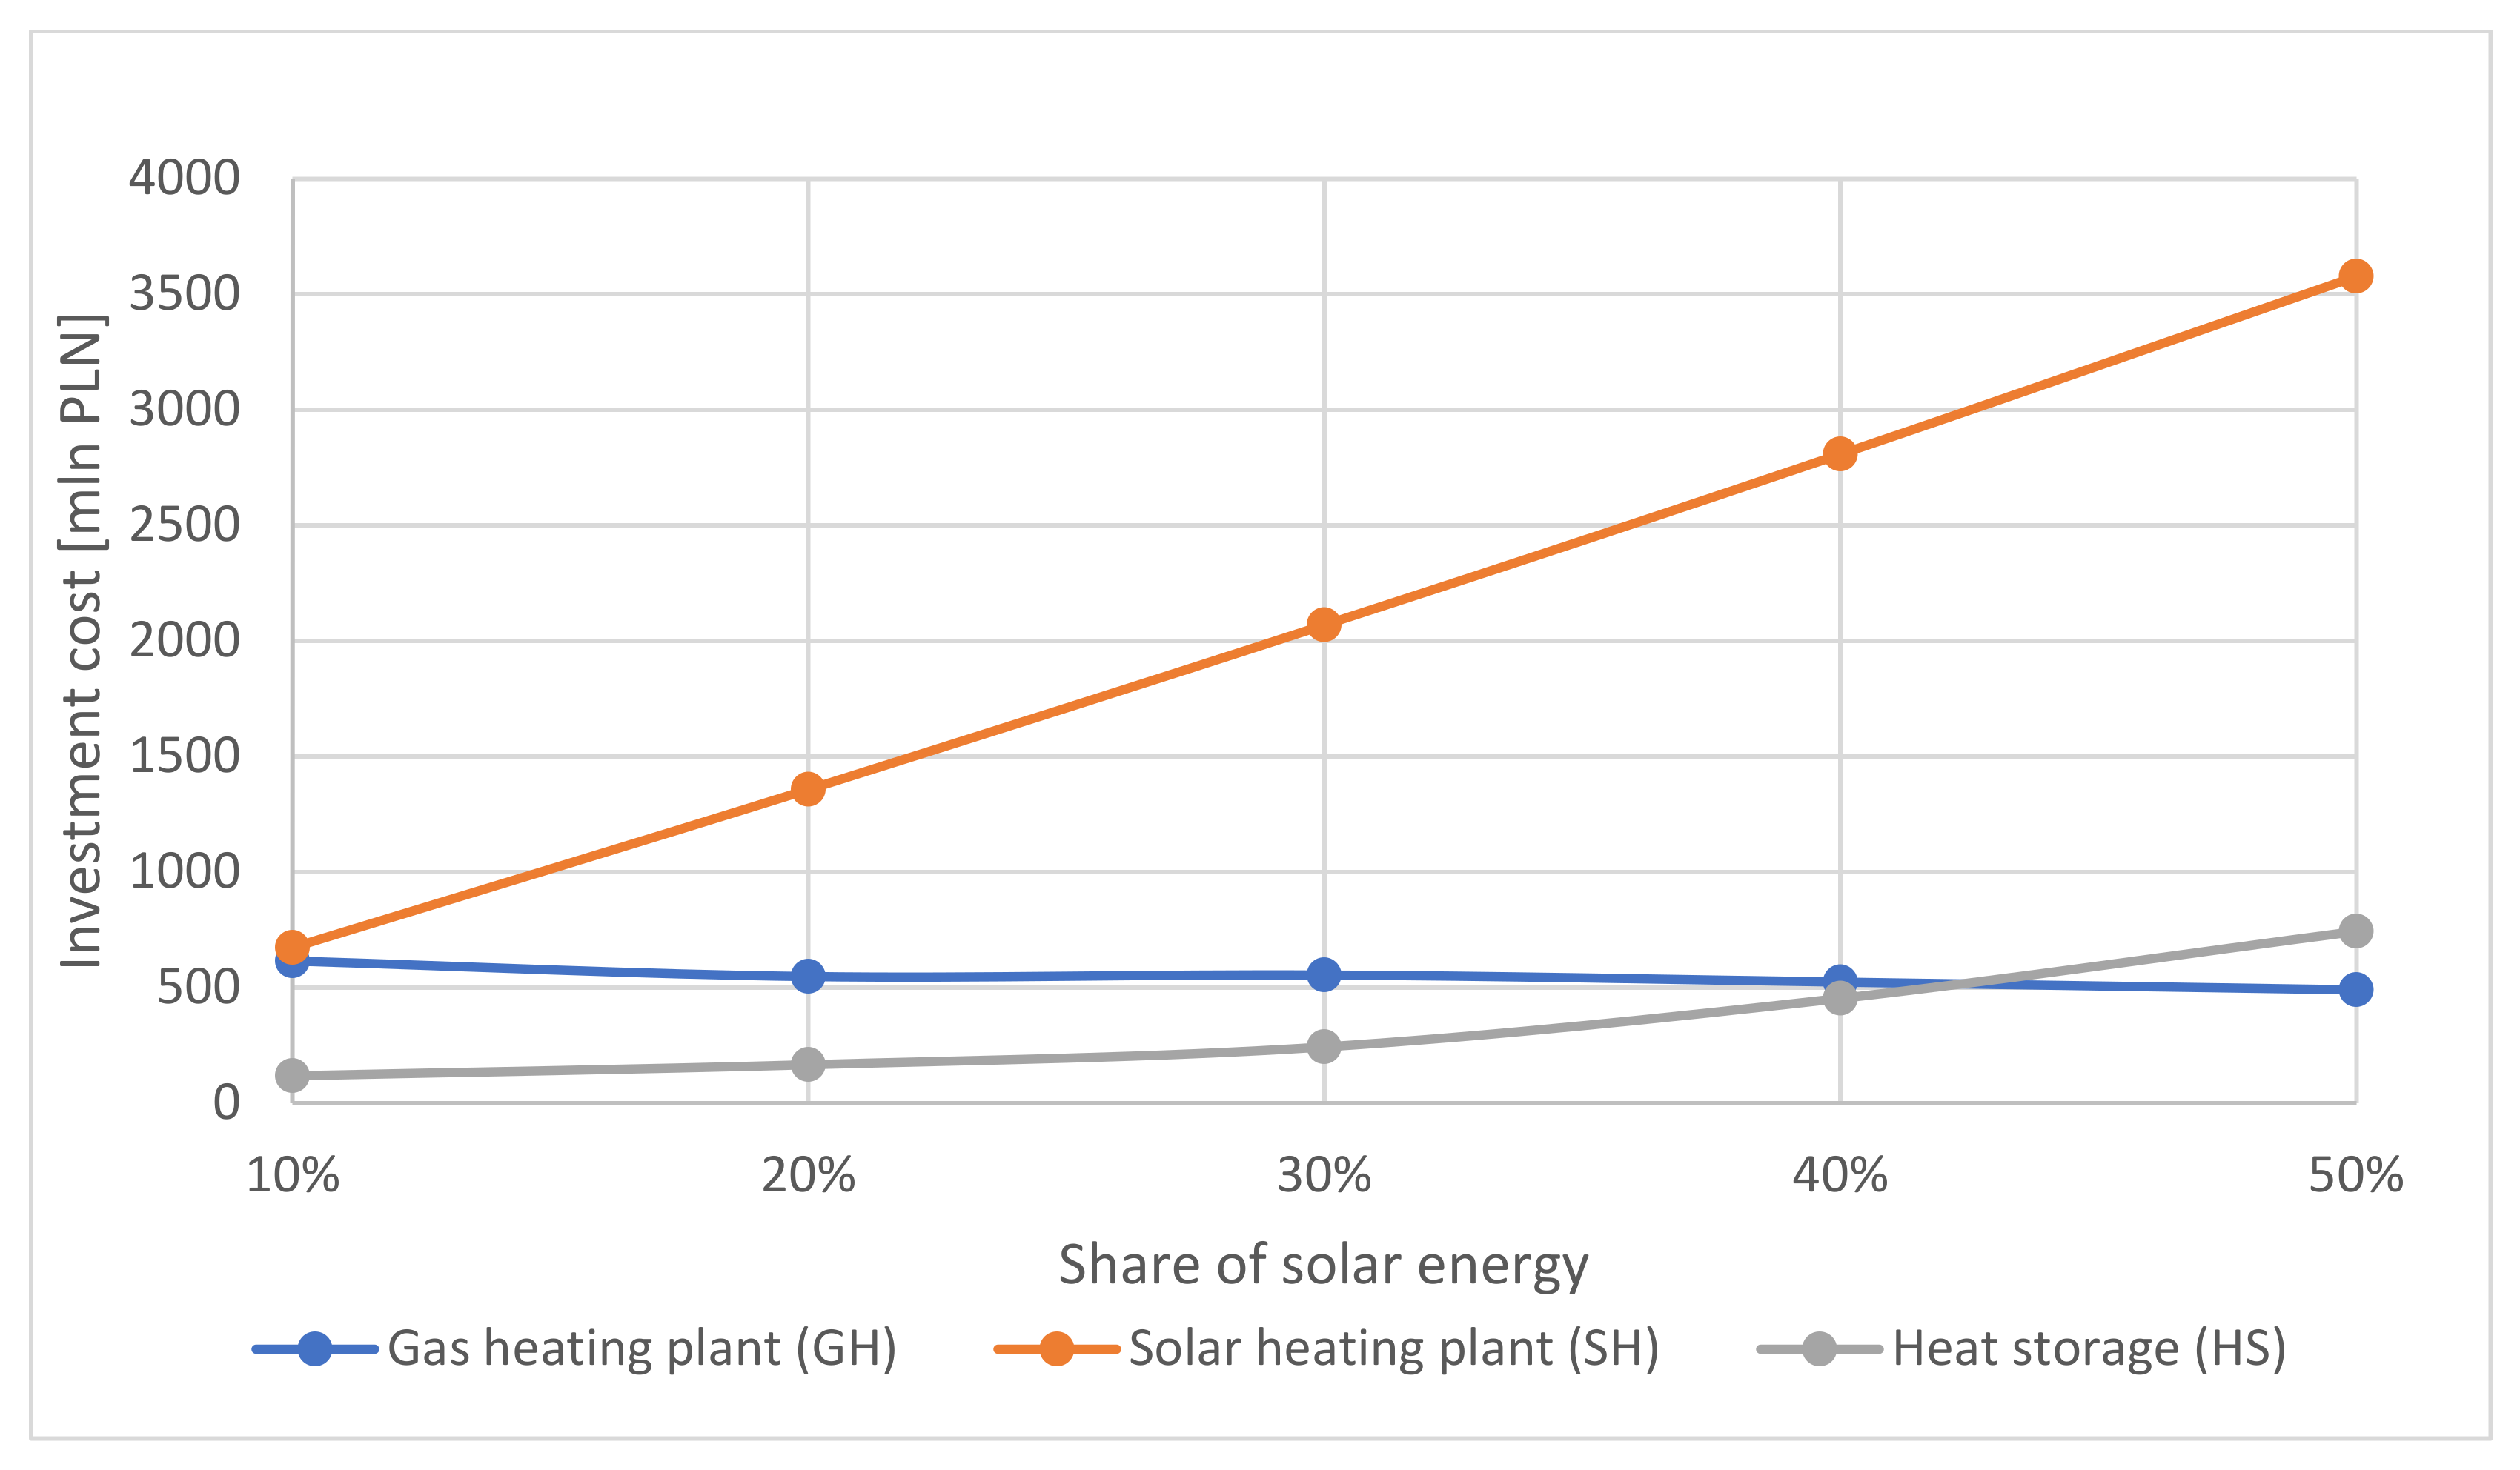
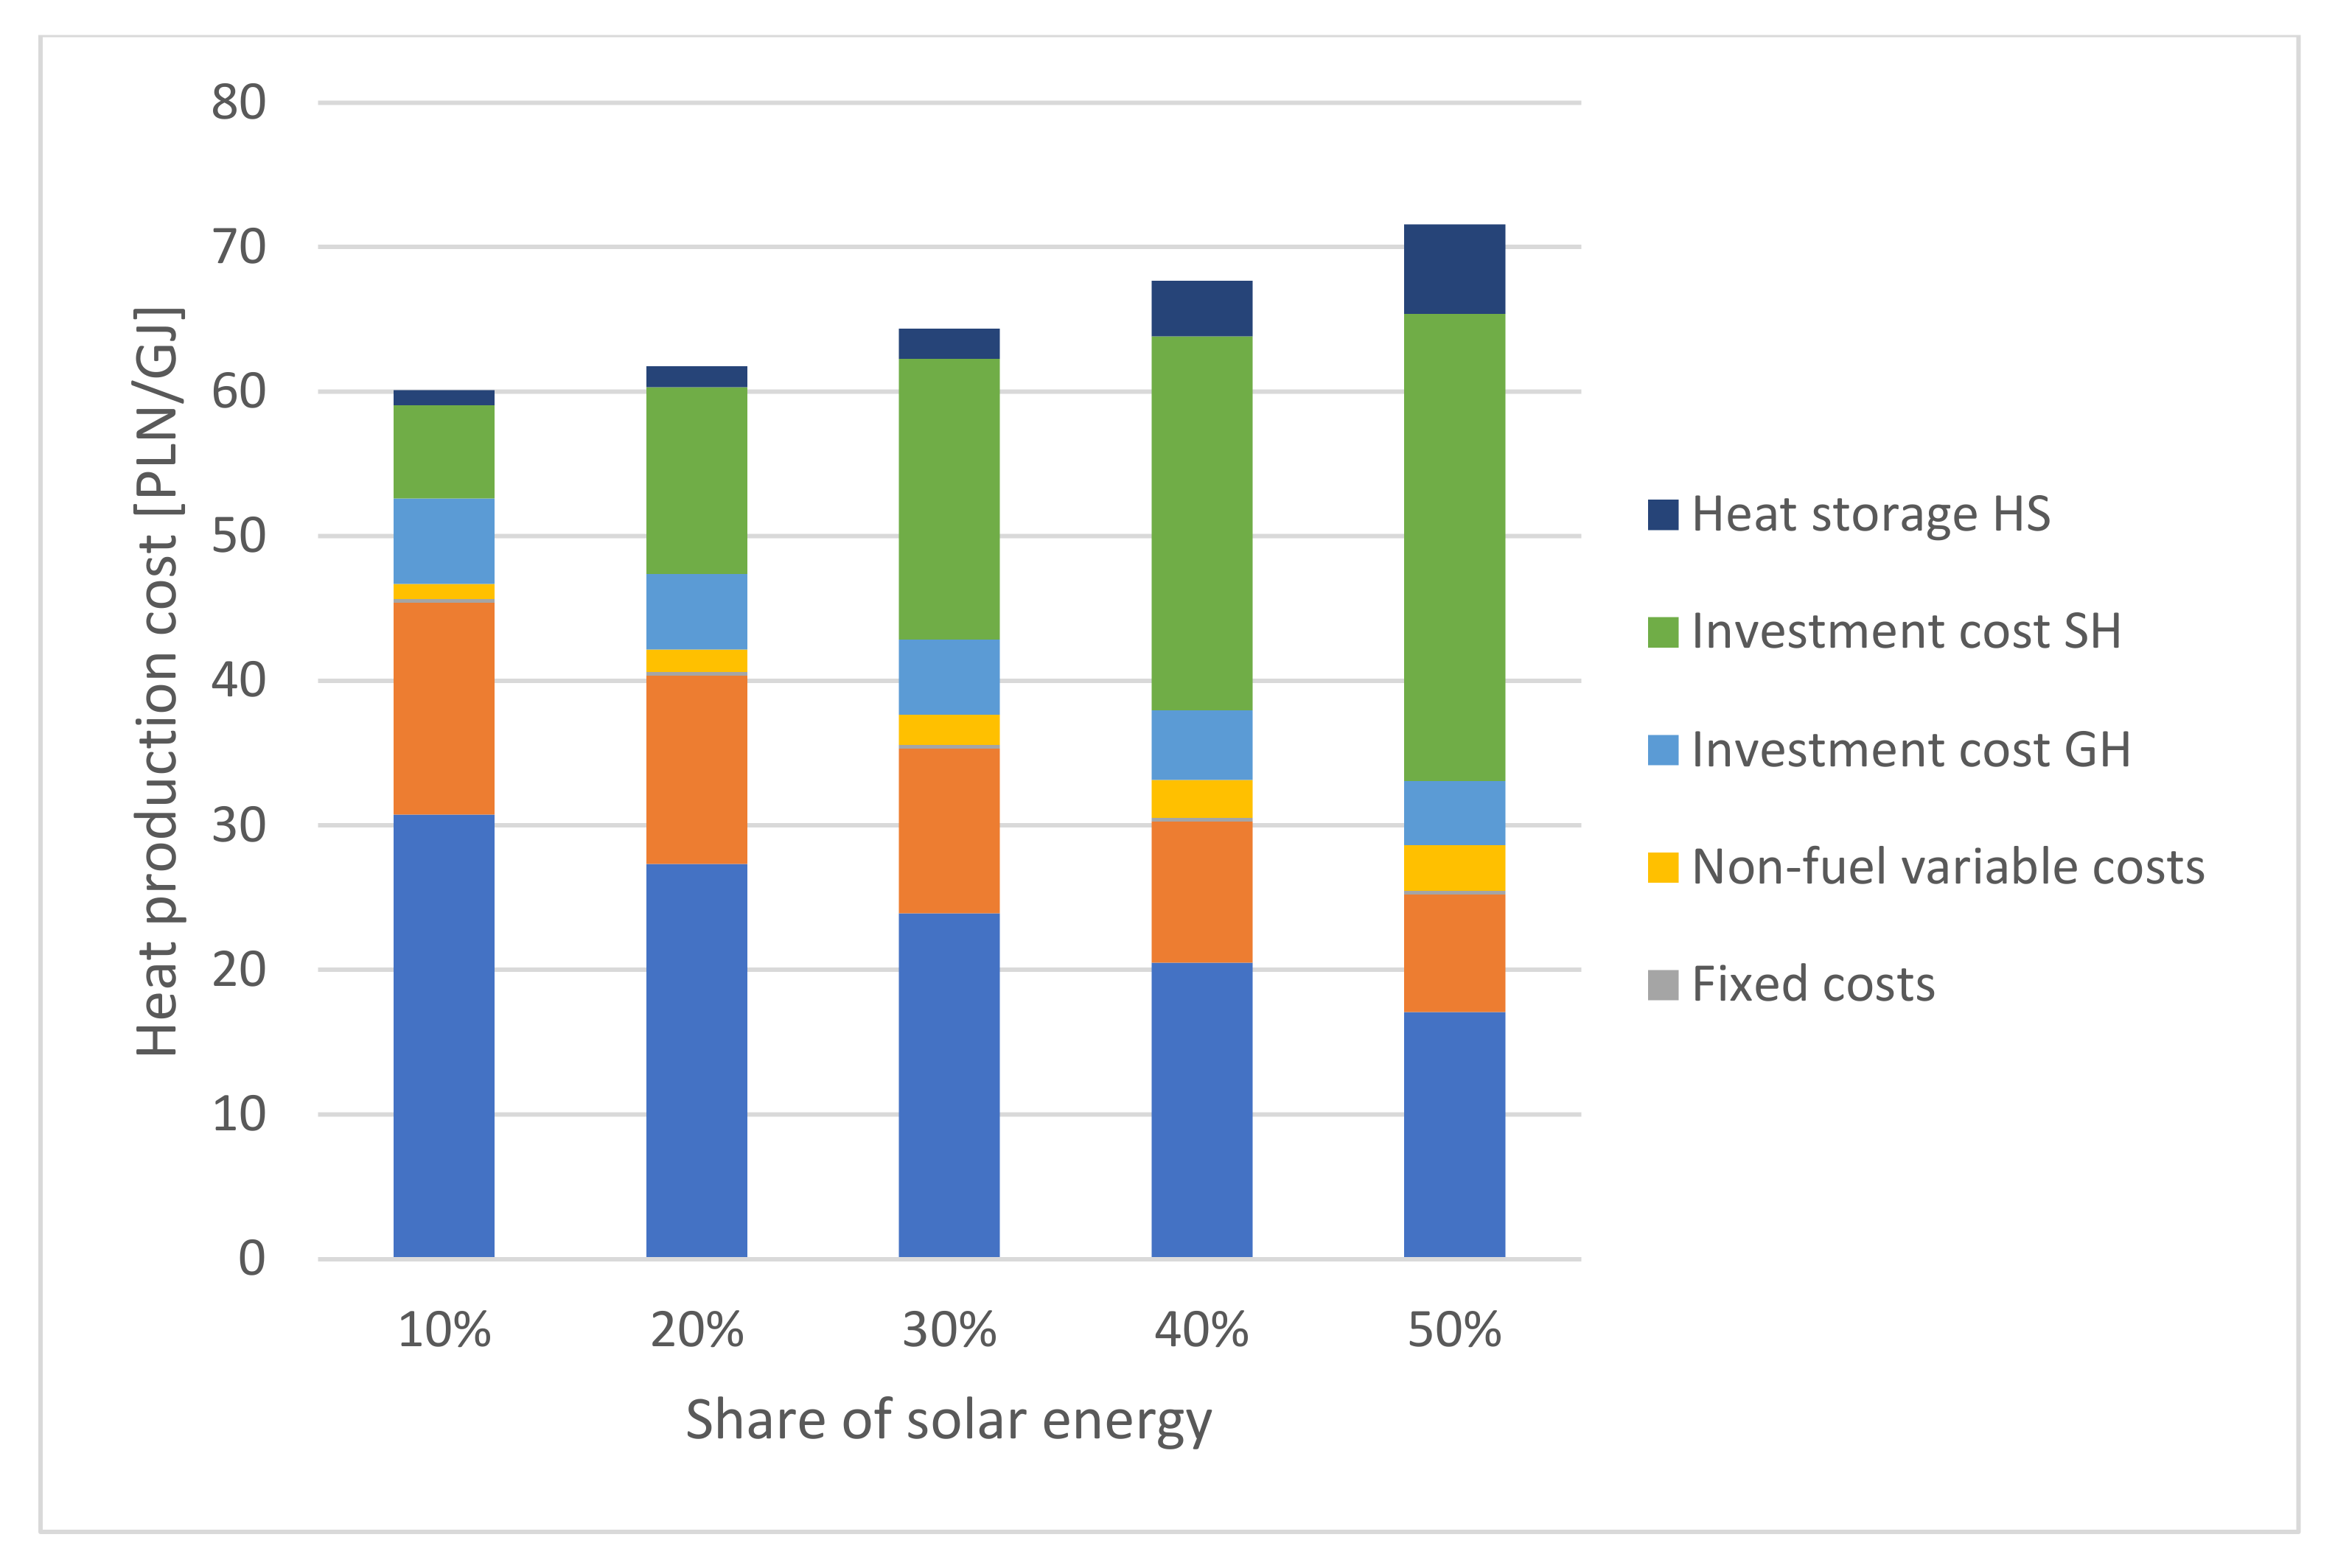
3.2. Cost Results for a Fixed Price Scenario

The results presenting the investment costs required to achieve a given share of renewable energy sources in heat production are shown in Figure 7. For a 20% share of renewable energy sources in heat production, the cost of building solar thermal plants is almost 1.5 billion PLN. Figure 8 confirms the increase in heat production costs with an increase in the share of RES in heat production, i.e., from the level of approx. 60 PLN/GJ with a 10% share of RES to approx. 72 PLN/ GJ with a 50% share of RES. The distribution of cost components indicates that the investments in solar heating plants constitute a dominant share in the total costs of heat production from RES above 30%. With lower RES shares, the main component is the natural gas fuel and the cost of purchasing CO2 emission allowances. One should bear in mind that in this scenario, the prices of natural gas and CO2 emission allowances are fixed at the level of 2025. If this was the case, it could in fact be concluded that the production of heat using natural gas heating plants is a cheaper solution than the production of heat based on solar thermal plants integrated with seasonal heat storage. Table 13 presents a summary of the results for various variants of the share of heat production in solar heating plants.

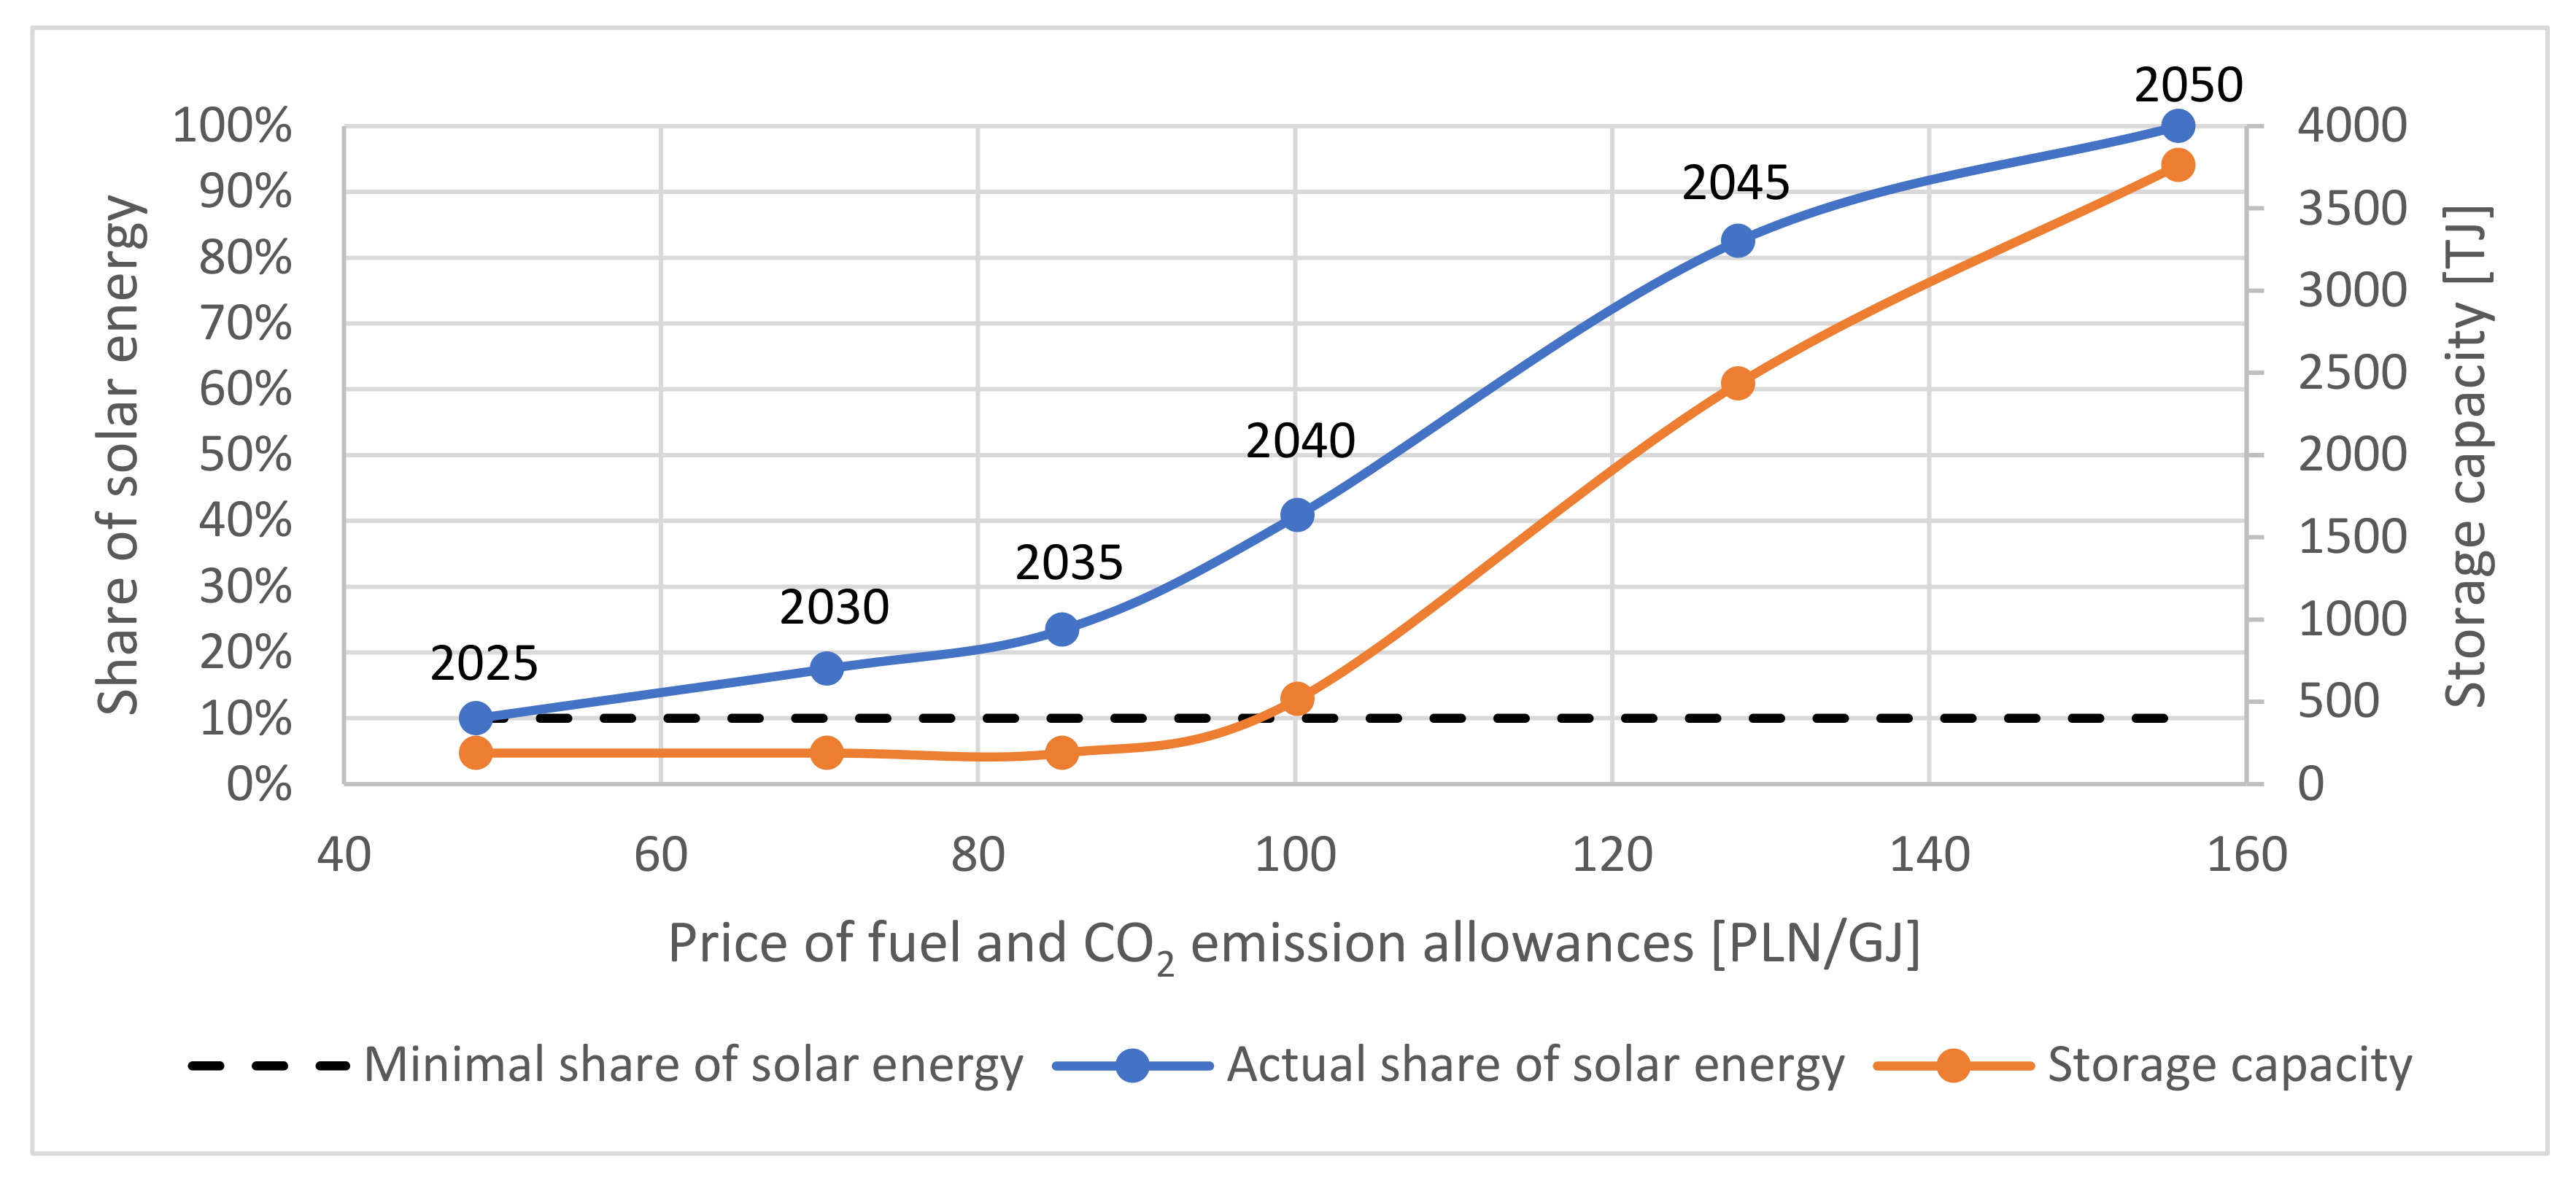
3.3. Results of the Scenario with Changes in the Price of Natural Gas Fuel and CO2 Emissions Allowances

The competitiveness of gas-fired heating plants is influenced by both gas prices and the prices of CO2 emission allowances. The previous section found that with the constant prices of natural gas and CO2 emission allowances, heat production based on gas heating plants is a cheaper solution than heat production based on solar thermal plants integrated with seasonal heat storage. However, the STAT scenario is non-viable and price fluctuations are likely to happen. First, the prices of CO2 emission allowances are expected to increase in the long term. In fact, this is unprecedented in the history of the EU ETS, as in 2022, when CO2 costs exceed fuel costs. It can be assumed that future CO2 prices will be even higher than those shown in Table 6. All this makes the DYN scenario more realistic compared to the STAT scenario. Figure 9 shows the system optimization results for the DYN scenario, which show how the share of RES changes with the change of these two cost components. The gas prices adopted for different years are presented in Table 5. The purchase prices of CO2 emission allowances are presented in Table 6. The gas emissivity was assumed at the level of 55.54 kg/GJ. In this scenario, in all years the minimum share of heat production from solar collectors is set at only 10%. This means that if the RES share indicated in Figure 9 is greater than 10% it is because the model found it to be cost-optimal solution in a given year. A growth in the cumulative cost of natural gas and CO2 allowances above 100 PLN/GJ (which is forecasted to take place in 2040) makes it more profitable to invest in large-scale solar heating plants integrated with seasonal heat storage. When the cost of these components exceeds 150 PLN/GJ, the systems are 100% powered by solar heating plants. Of course, such a variant is also unrealistic because this work does not consider in detail the technical limitations of the operation of the heating network and land restrictions. Nevertheless, it is a clear signal that in the future one should expect an increase in the competitiveness of heat production based on solar thermal plants integrated with seasonal heat storage. Table 14 presents the basic results of the DYN scenario in the following years.
By analyzing the results, it can be clearly seen that in order to prevent further increase in heat generation costs in the year after 2025, the model increases investments in CO2 free solutions, i.e., solar heating plants. As result, this leads to a reduction in the price of heat in 2050 compared to the prices recorded for 2040 and 2045, despite incurring significant investment costs related to the increase in the capacity of solar heating plants and heat storage facilities.

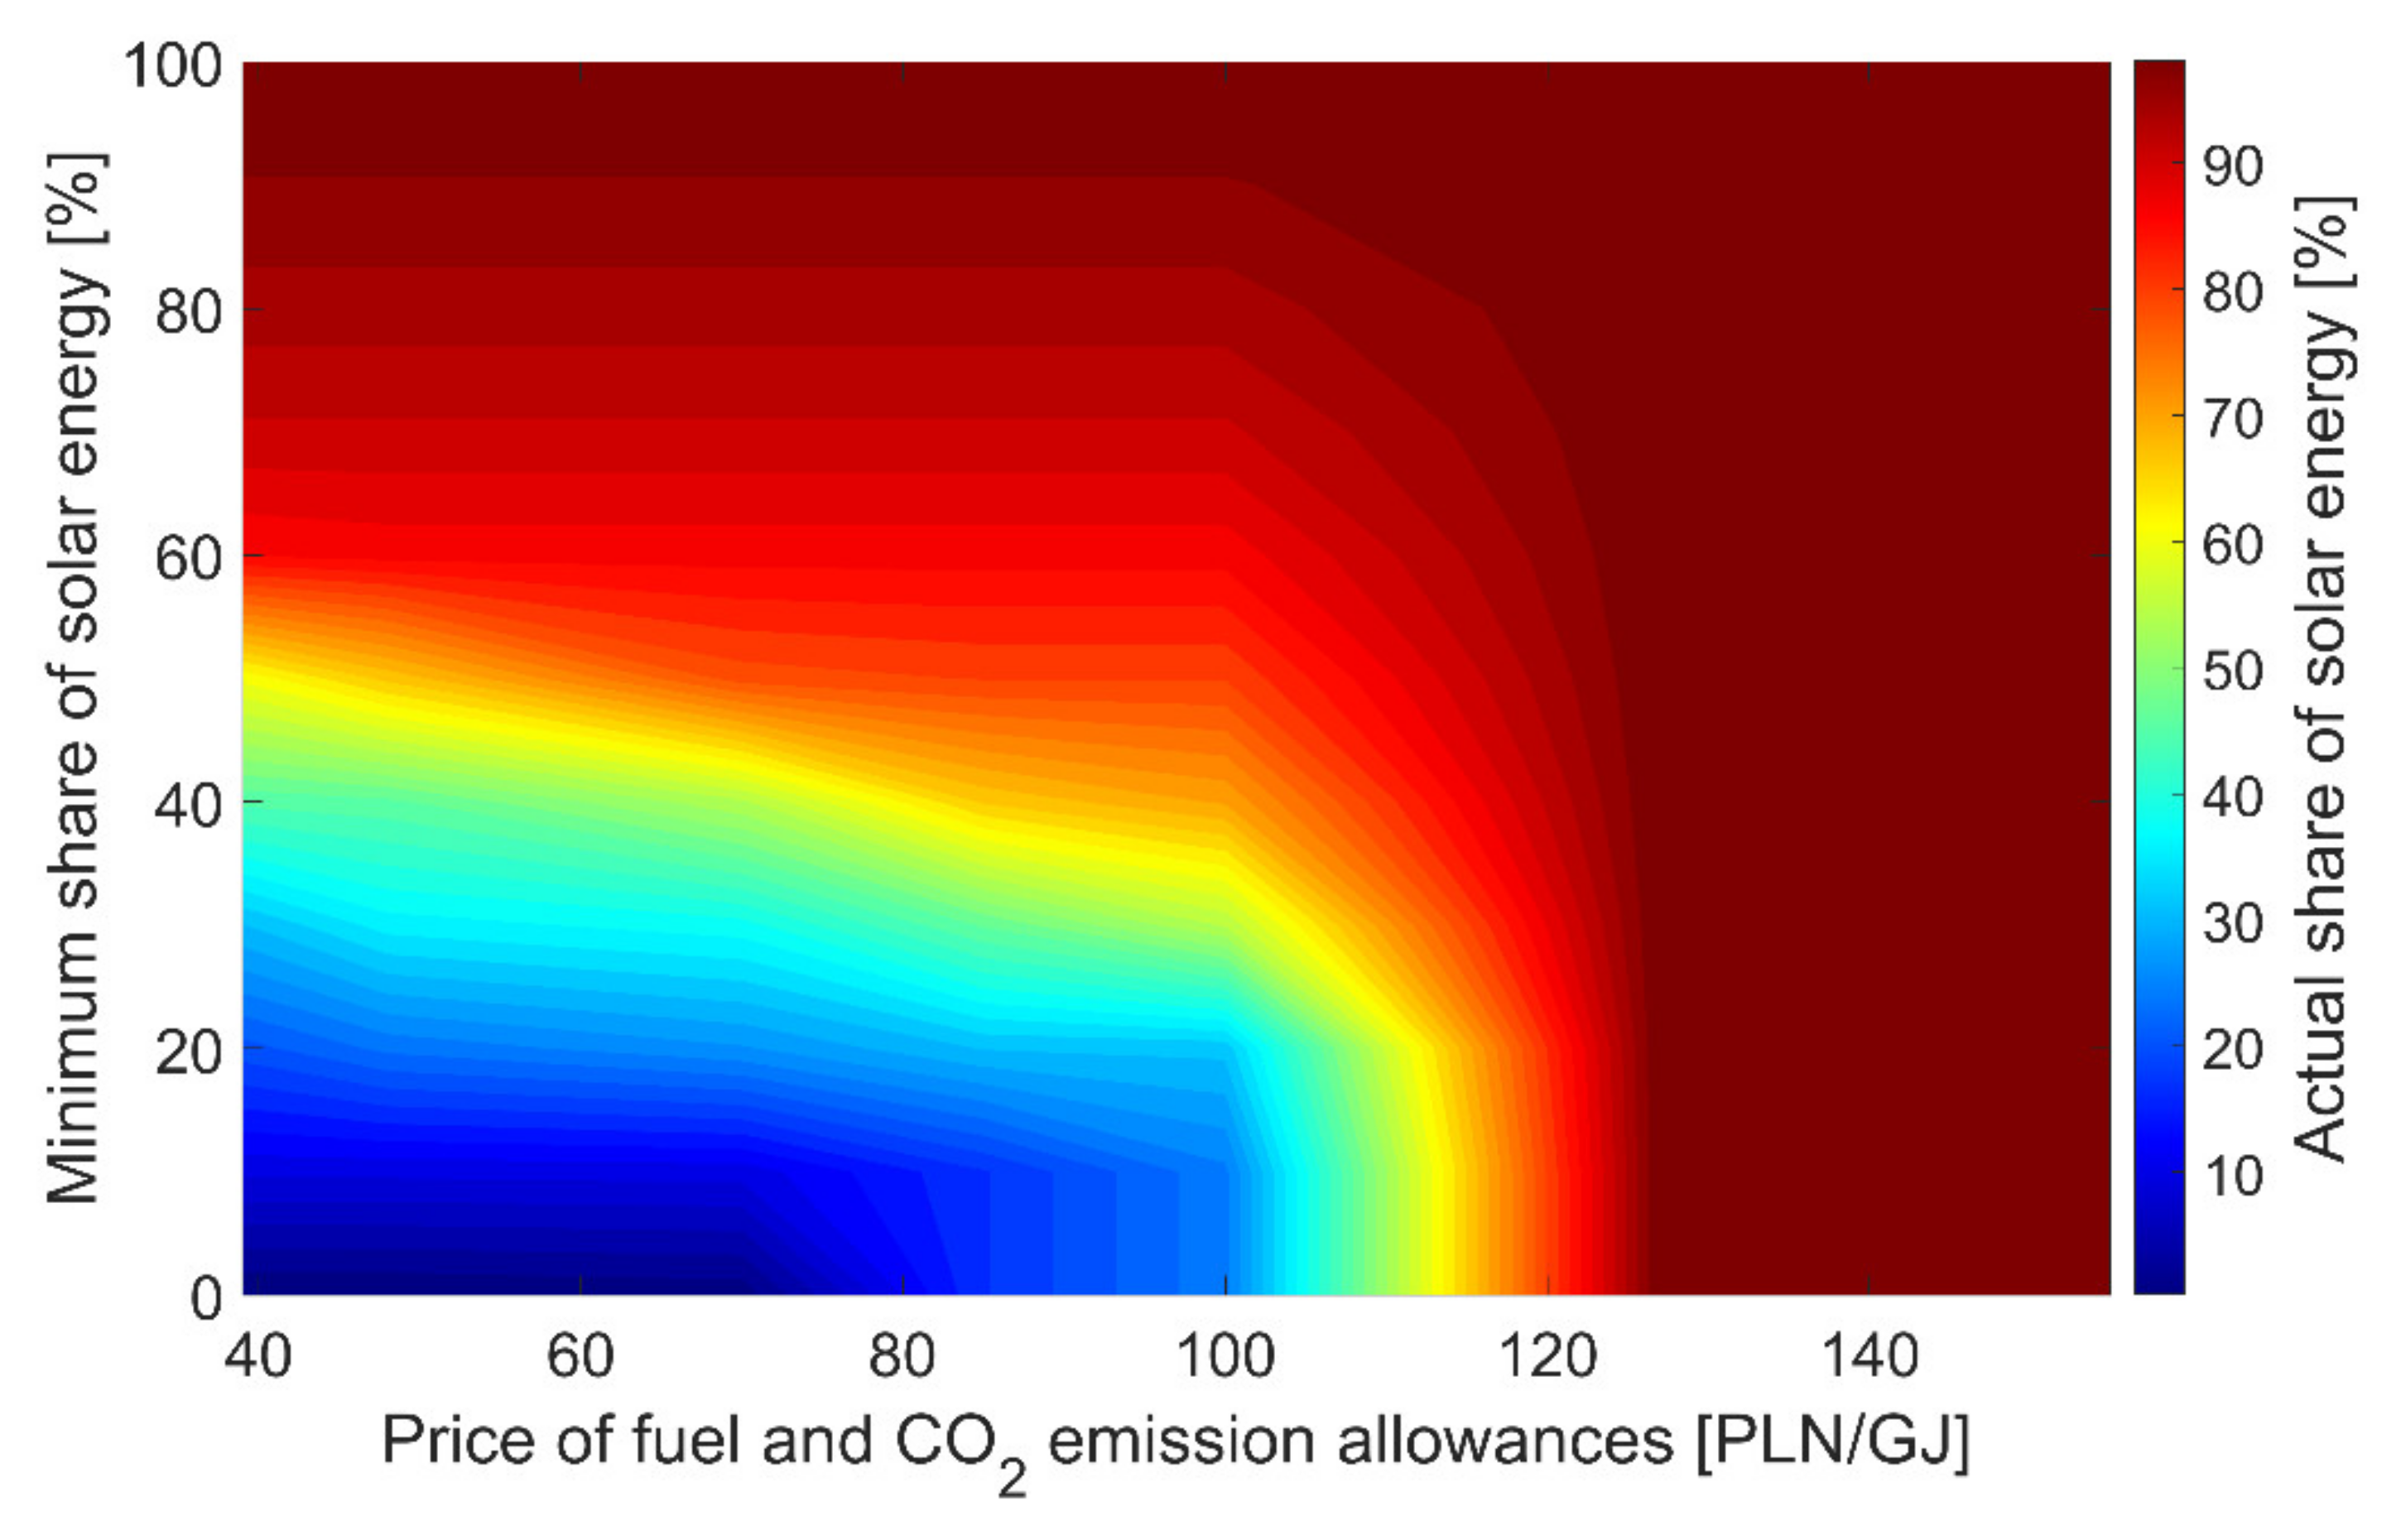
3.4. Sensitivity Analysis

The model provides optimal solutions under the assumption of perfect foresight. In order to determine the effect of uncertainty not captured within the scenarios, additional sensitivity analysis has been performed. The main research question in this study is to recognize the extent of the possibility to increase the penetration of solar thermal into large-scale district heating systems. The results have been evaluated against the exogenous constraints on the minimum required heat from solar energy and changes in costs of the natural gas-based heat production (Figure 10).
Figure 10 shows that up to the natural gas-based production cost, including fuel and CO2 emission allowances, of approx. 80 PLN/GJ heat production from solar thermal plants does not exceed the minimum requirement (dark blue area). Up to this cost threshold, gas heat plants are more competitive than solar heat plants. With the increase of this cost above 100 PLN/GJ, the situation gradually changes, and solar thermal plants are becoming more and more competitive, as indicated by the higher than required solar energy share. Above 125 PLN/GJ, the model decides to generate heat exclusively in solar thermal plants (dark red area).

4. Conclusions

In this work, a model of six district heating systems in Poland with a total heat annual production of about 8.5 PJ was developed with the use of IEA-TIMES generator to optimize their transition from hard coal toward renewables. A general heat balance of the systems was developed without taking into account the hydraulic processes occurring in the network pipelines. It was assumed that the existing coal boilers will be entirely replaced by new technologies. The proposed concept assumed feeding district heating systems with large-scale solar heat plants integrated with seasonal pit thermal energy storage. The choice was not random but resulted from an extended literature review and existing solutions used worldwide. For the first time, an attempt was made to identify the technical, economical, and infrastructural challenges associated with such large district heating systems transitioning to be served by solar thermal collectors with heat storage. While it would be favorable to rely solely on RES, in order to cover the demand for residual heat and to maintain the required parameters of the working medium in the network, dispatchable heat sources should also be included in the systems. In this work, a solution has been adopted, in which, in addition to solar heat plants, gas boilers are a part of the system. The main tool used i.e., the TIMES model made it possible: (i) to develop the generation expansion plan that included the optimal size of solar collectors, gas boilers and heat storage systems, as well as (ii) to optimize the system operation. The calculations carried out for the location of the solar collectors in Katowice, Poland, showed that the total heat production in the period April-October per m2 of the collector area is in the range of 395 kWh. Two scenarios were elaborated to explore the possible energy futures. In the first one, STAT, the economic and technical parameters in the period 2025–2050 were frozen at the 2025 level. In the second scenario, DYN, gas prices and CO2 emission allowance prices have changed over the years. Next, a perfect foresight optimization of system expansion was carried out, whose main objective was to minimize the overall heat generation costs. From the optimization point of view, the model is simultaneously considering the investment and operation decisions. The results revealed the investment costs, land requirements for solar collectors and PTES as well as estimated heat generation costs. The variant of the STAT scenario assuming a 20% share of RES in heat production requires the construction of solar thermal plants with a total capacity of 849 MW covering a land area of approx. 3.6 km2. In order to store the heat produced at these plants, seasonal heat storage facilities would have to be built with a total capacity of 197 TJ, which is about 4.5 times larger than the currently largest PTES storage facility located in Vojens, Denmark. The estimated cost of building such collectors and storage facilities is respectively: PLN 1358 million and PLN 167 million, and the cost of heat generation is about 62 PLN /GJ. The results of the system optimization for the DYN scenario, in which the prices of natural gas and CO2 emission allowances increased over the years show a dynamic transformation of the systems towards greater use of solar heat plants. The aggregate increase in the cost of natural gas fuel and CO2 allowances above 100 PLN/GJ (which is forecasted to occur in 2040) makes heat generation from natural gas less profitable than the use of large-scale solar thermal plants integrated with seasonal heat storage. Above 125 PLN/GJ, the model decides to generate heat exclusively in solar thermal plants. The year 2022, has been unprecedented in the history of the EU ETS when the cost of CO2 emissions exceeded the cost of fuel in Poland. This illustrates the importance of switching to RES in line with the European Commission’s proposals that for a district heating system to meet the criteria of an efficient system in the future, the share of heat production from RES must increase. This also shows the importance of studies dealing with DH system expansion, especially with the associated modeling aspects. Even though the technical constraints of district heating network operation and field limitations were not considered in the model, the results give a clear indication that in the future we should expect an increase in the price competitiveness of heat production based on solar thermal plants integrated with seasonal heat storage. While current regulations favor centralized heat sources, in the future, an alternative way of developing district heating systems is decentralization e.g., the creation of local DH microgrids. The operation parameters in such microgrids can be adjusted for the greater use of renewables and heat pumps on the supply side, as well as benefiting from its reduction of transmission losses. This should also have a positive impact on district heating self-reliance which, as defined by [31], increases with the increase of energy production by local sources once minimizing energy consumption from the main grid. The issue of district heating decentralization will be the subject of our future work.

Author Contributions

Conceptualization, A.W.; methodology, A.W.; software, A.W. and M.R.; validation, A.W.; investigation and literature review, O.O., L.M., H.Z., M.K. (Maciej Kulik) and A.W.; data curation, O.O., L.M., H.Z., M.K. (Maciej Kulik), M.K. (Marek Kempka), A.W. and M.R.; writing—original draft preparation in Polish, A.W.; translating draft from Polish to English, M.K. (Maciej Kulik); writing—review and editing, O.O., L.M., H.Z., M.K. (Maciej Kulik), M.K. (Marek Kempka) and A.W.; visualization, M.R.; supervision, A.W. and M.K. (Marek Kempka); project administration, A.W. All authors have read and agreed to the published version of the manuscript.

Funding

This research was funded by AGH University of Science and Technology, Faculty of Energy and Fuels, grant number 16.16.210.476.

Institutional Review Board Statement

Not applicable.

Informed Consent Statement

Not applicable.

Data Availability Statement

Not applicable.

Acknowledgments

We would like to acknowledge the Research and Development Team of TAURON Ciepło sp. z o.o. for the support on the execution of the study.

Conflicts of Interest

The authors declare no conflict of interest.

References

  1. Eurostat. Share of Fuels in the Final Energy Consumption in the Residential Sector, 2019. 2021. Available online: https://ec.europa.eu/eurostat/statistics-explained/index.php?title=Energy_consumption_in_households (accessed on 17 January 2022).
  2. European Commission. Proposal for a Directive of the European Parliament and of the Council on Energy Efficiency; European Commission: Brussels, Belgium, 2021; Available online: https://eur-lex.europa.eu/legal-content/EN/TXT/?uri=CELEX%3A52021PC0558 (accessed on 16 December 2021).
  3. Tschopp, D.; Tian, Z.; Berberich, M.; Fan, J.; Perers, B.; Furbo, S. Large-scale solar thermal systems in leading countries: A review and comparative study of Denmark, China, Germany and Austria. Appl. Energy 2020, 270, 114997. [Google Scholar] [CrossRef]
  4. Fuqiang, W.; Ziming, C.; Jianyu, T.; Yuan, Y.; Yong, S.; Linhua, L. Progress in concentrated solar power technology with parabolic trough collector system: A comprehensive review. Renew. Sustain. Energy Rev. 2017, 79, 1314–1328. [Google Scholar] [CrossRef]
  5. European Commission. Directorate General for Energy, COWI, and CEPS. In Case Study on Solar-Heating Plant in Silkeborg, Denmark. Annex A.4 to Part 1 of the Study on the Competitiveness of the Renewable Energy Sector; European Commission: Brussels, Belgium, 2019; Available online: https://data.europa.eu/doi/10.2833/353782 (accessed on 17 January 2022).
  6. Bott, C.; Dressel, I.; Bayer, P. State-of-technology review of water-based closed seasonal thermal energy storage systems. Renew. Sustain. Energy Rev. 2019, 113, 109241. [Google Scholar] [CrossRef]
  7. Portal Branży Ciepłowniczej. Bezpieczniej z Akumulatorem Ciepła. 8 September 2009. Available online: https://www.energetykacieplna.pl/artykuly/bezpieczniej-z-akumulatorem-ciepla-37136-6 (accessed on 27 January 2022).
  8. Chatzidiakos, A. Pit Thermal Energy Storages Denmark, Experience and Working Systems; Ramboll UK: London, UK, 2020. [Google Scholar]
  9. Solarthermalworld.org. Sesonal Pit Heat Storage: Cost Benchmark of 30 EUR/m3. Available online: https://solarthermalworld.org/news/seasonal-pit-heat-storage-cost-benchmark-30-eurm3/?fbclid=IwAR2EF7YWmSjShWDoLpgMk4p068KidC99XtAjUDhk7FMwcg9xllRkqV9v4C4 (accessed on 15 January 2022).
  10. Zwierzchowski, R. Characteristics of large thermal energy storage systems in Poland. E3S Web Conf. 2017, 22, 00206. [Google Scholar] [CrossRef] [Green Version]
  11. Wyrwa, A.; Suwała, W.; Pluta, M.; Raczyński, M.; Zyśk, J.; Tokarski, S. A new approach for coupling the short- and long-term planning models to design a pathway to carbon neutrality in a coal-based power system. Energy 2022, 239, 122438. [Google Scholar] [CrossRef]
  12. Carli, R.; Cavone, G.; Pippia, T.; de Schutter, B.; Dotoli, M. Robust Optimal Control for Demand Side Management of Multi-Carrier Microgrids. IEEE Trans. Autom. Sci. Eng. 2022, 1–14. [Google Scholar] [CrossRef]
  13. Sperstad, I.B.; Korpås, M. Energy Storage Scheduling in Distribution Systems Considering Wind and Photovoltaic Generation Uncertainties. Energies 2019, 12, 1231. [Google Scholar] [CrossRef] [Green Version]
  14. Delangle, A.; Lambert, R.S.C.; Shah, N.; Acha, S.; Markides, C.N. Modelling and optimising the marginal expansion of an existing district heating network. Energy 2017, 140, 209–223. [Google Scholar] [CrossRef]
  15. Dominković, D.F.; Stunjek, G.; Blanco, I.; Madsen, H.; Krajačić, G. Technical, economic and environmental optimization of district heating expansion in an urban agglomeration. Energy 2020, 197, 117243. [Google Scholar] [CrossRef]
  16. Geels, F.W. Technological transitions as evolutionary reconfiguration processes: A multi-level perspective and a case-study. Res. Policy 2002, 31, 1257–1274. [Google Scholar] [CrossRef] [Green Version]
  17. IEA-ETSAP|Energy Systems Analysis. Available online: https://iea-etsap.org/ (accessed on 18 January 2022).
  18. Loulou, R.; Goldstein, G.; Kanudia, A.; Lettila, A.; Remme, U. Documentation for the TIMES Model. Part I: Times Concepts and Theory. IEA-ETSAP. July 2016. Available online: https://iea-etsap.org/docs/Documentation_for_the_TIMES_Model-Part-I_July-2016.pdf (accessed on 9 September 2019).
  19. Gospodarka Paliwowo-Energetyczna w Latach 2018 i 2019. GUS, Warszawa. 2020. Available online: https://stat.gov.pl/download/gfx/portalinformacyjny/pl/defaultaktualnosci/5485/4/15/1/gospodarka_paliwowo-energetyczna_2018_i_2019.pdf (accessed on 11 January 2022.).
  20. URE. Energetyka Cieplna w Liczbach 2019; Urząd Regulacji Energetyki: Warsaw, Poland, 2020. [Google Scholar]
  21. Ministerstwo Klimatu i Środowiska. Polityka Energetyczna Polski do 2040 r. Załącznik 2–Wnioski z Analiz Prognostycznych dla Sektora Paliwowo Energetycznego. Ministerstwo Klimatu i Środowiska. 2 February 2021. Available online: https://www.gov.pl/attachment/15a6e747-6231-4dc8-8aba-909a3aa0efb6 (accessed on 1 July 2021).
  22. KOBIZE. LIFE Climate CAKE PL. Available online: https://www.kobize.pl/pl/category/id/71/life-climate-cake-pl (accessed on 29 October 2021).
  23. Meteomodel: Pogoda i Klimat, Prognozy Numeryczne, Dane Meteo. Pogoda i Klimat. Available online: https://meteomodel.pl/ (accessed on 23 January 2022).
  24. European Commission. Joint Research Centre, ILF Consulting Engineers Austria GmbH, and AIT Austrian Institute of Technology GmbH. In Long Term (2050) Projections of Techno-Economic Performance of Large-Scale Heating and Cooling in the EU; European Commission: Brussels, Belgium, 2017; Available online: https://data.europa.eu/doi/10.2760/24422 (accessed on 1 February 2022).
  25. Grahovac, M.; Liedl, P.; Frisch, J.; Tzscheutschler, P. Simplified Solar Collector Model: Hourly Simulation of Solar Boundary Condition for Multi-Energy Optimization. In Proceedings of the 41st International Congress on Heating, Refrigerating and Air-Conditioning (HVCA&R), Belgrade, Serbia, 1–3 March 2010. [Google Scholar]
  26. Freeman, J.; Hellgardt, K.; Markides, C. An Assessment of Solar–Thermal Collector Designs for Small-Scale Combined Heating and Power Applications in the United Kingdom. Heat Transf. Eng. 2015, 36, 1332–1347. [Google Scholar] [CrossRef] [Green Version]
  27. European Solar Thermal Industry Federation. Objective Methodology for Simple Calculation of the Energy Delivery of (Small) Solar Thermal Systems. 2017. Available online: https://www.google.com/url?sa=t&rct=j&q=&esrc=s&source=web&cd=&ved=2ahUKEwj6q4Pjkub1AhURrYsKHZVfBMcQFnoECAcQAQ&url=http%3A%2F%2Fwww.estif.org%2Ffileadmin%2Festif%2Fcontent%2Fpolicies%2Fdownloads%2FSimple_Calculation.pdf&usg=AOvVaw1sFN3j4RpvDnN7J0A7ddZP (accessed on 10 January 2022).
  28. Cattaneo, B. Photovoltaic Geographical Information System (PVGIS). EU Science Hub–European Commission. 15 June 2018. Available online: https://ec.europa.eu/jrc/en/pvgis (accessed on 18 January 2022).
  29. SDH Solar District Heating. SDH Online-Calculator. Available online: https://sdh-online.solites.de/?lang=en-US (accessed on 12 December 2021).
  30. Fraunhofer ISE; PlanEnergi; Chalmers University. Solar Thermal Shows Highest Energy Yield Per Square Metre. July 2017. Available online: https://solarthermalworld.org/news/solar-thermal-shows-highest-energy-yield-square-metre/ (accessed on 5 January 2022).
  31. Kim, M.; Parkt, S.; Choi, J.K.; Lee, J. Energy independence of energy trading system in microgrid. In Proceedings of the 2017 IEEE Innovative Smart Grid Technologies–Asia (ISGT-Asia), Auckland, New Zealand, 4–7 December 2017; pp. 1–4. [Google Scholar] [CrossRef]
Figure 1. Schematic diagram of the tested system and energy balance for the STAT scenario with the share of RES in heat production amounting to 20%.
Energies 15 03165 g001
Figure 2. The value of solar radiation falling on the collector on a selected day in June in Katowice.
Energies 15 03165 g002
Figure 3. Daily heat flows in the system for the STAT scenario with the share of heat production from solar heating plants at least at the level of 10%.
Energies 15 03165 g003
Figure 4. Daily heat flows in the system for the STAT scenario with the share of heat production from solar heating plants at least at the level of 20%.
Energies 15 03165 g004
Figure 5. Daily heat flows in the system for the STAT scenario with the share of heat production from solar heating plants at least at the level of 40%.
Energies 15 03165 g005
Figure 6. Sensitivity analysis—thermal power of the technology and storage capacity as a function of the share of solar energy.
Energies 15 03165 g006
Figure 7. The amount of investment expenditures as a function of the share of solar energy. Explanation of abbreviations: GH—gas heating plant, SH—solar heating plant, HS—heat storage.
Energies 15 03165 g007
Figure 8. Distribution of heat generation cost components as a function of solar energy share. Explanations of abbreviations: HS—heat storage, SH—solar heating plant, GH—gas heating plant.
Energies 15 03165 g008
Figure 9. Share of heat from solar collectors and heat storage capacity as a function of the purchase cost of fuel and CO2 emission allowances by a gas heating plant in DYN scenarios.
Energies 15 03165 g009
Figure 10. Actual share of solar energy in the system as a function of the required share of solar energy and the cost of purchasing fuel and CO2 emission allowances for a gas heating plant.
Energies 15 03165 g010
Table 1. Characteristics of given storage systems [9].
NameTypeYear
Built
Temperatures
Range (°C)
CapacityPower
(Dis)Charging
(MW)
(mil. m3)(MWh)(TJ)
Sunstore 2
Marstal *
PTES200335–90106382.36.51
Sunstore 3
Dronninglun *
PTES201310–8960540019.426.10
Sunstore 4
Marstal *
PTES201217–8875600021.610.50
Vojens **PTES201540–9021012,18043.838.50
Gram **PTES201520–9012512,12543.730.00
Toftland **PTES201720–9085688524.822.00
* Demonstration installations. ** Commercial installations.
Table 2. Characteristics of selected storage systems [10].
NameVolume (m3)Height (m)Diameter (m)Capacity (TJ)
EC Siekierki30,40047306.3
EC Poznań24,00063234.9
EC Kraków18,00048233.7
EC Białystok13,00037212.7
EC Bielsko12,00037212.5
Table 3. Data of heat generation technology.
NameEfficiencyAvailabilityLifetime
(Years)
CAPEX *
(mln PLN/MWh)
FIXOM **
(PLN/MW/Year)
VAROM ***
(PLN/GJ)
Gas boilers0.980.9251.240000.5
Solar collectors-(Table 9)251.62255.8 ****
* Investment expense. ** Fixed operating costs. *** Variable non-fuel operating costs. **** It has been assumed that auxiliary electricity consumption (energy) accounts for 0.3% of the heat generated and the electricity price is 700 PLN/MWh.
Table 4. Data of heat storage technology.
Name Time of Full Dis(Charging) Storage (Days)Lifetime (Years)CAPEX (MPLN/TJ)FIXOM (PLN/GJ/Year)VAROM (PLN/GJ)
PTES0.812300.85--
Table 5. Natural gas prices (PLN/GJ).
Fuel2018203020402050
Natural gas32.845.650.456.2
Table 6. Forecast of prices of CO2 emission allowances.
Unit2020202520302035204020452050
€/t CO225.062.5100.0150.0200.0300.0400.0
PLN/t CO2112.0280.0448.0672.0896.01344.01792.0
Table 7. Value of heat production in (TJ) in each month.
AreaType123456789101112
ADHW80.272.480.277.680.280.280.280.280.280.277.680.2
ASH333.8246.7258.5158.80.00.00.00.00.0155.0251.2324.7
BDHW70.863.970.868.570.868.570.870.868.570.868.570.8
BSH294.7217.8228.3140.20.00.00.00.00.0136.9221.8286.7
CDHW37.133.537.135.937.135.937.137.135.937.135.937.1
CSH154.2114.0119.573.40.00.00.00.00.071.6116.1150.0
DDHW40.436.540.439.140.439.140.440.439.140.439.140.4
DSH168.1124.2130.280.00.00.00.00.00.078.0126.5163.5
EDHW23.020.723.022.223.022.223.023.022.223.022.223.0
ESH95.670.774.045.50.00.00.00.00.044.471.993.0
FDHW4.64.14.64.44.64.44.64.64.44.64.44.6
FSH19.114.114.89.10.00.00.00.00.08.914.418.6
Table 8. Characteristics of collector parameters.
Type: η 0 a1a2Source
Flat plate collector 179.464.03630.0078[25]
Flat plate collector 272.003.47000.0141[26]
Table 9. Monthly heat production from a flat collector (kWht/m2).
123456789101112
Qp9.4918.6738.1056.4527.4477.5781.8964.3440.9747.0915.8310.73
Table 10. The quantities characterizing the modeled system with the required share of heat from solar collectors = 10%.
Parameter (Unit)Value
Installed storage capacity (TJ)139
Maximum daily storage flow (TJ/day)11.7
Installed capacity of solar collectors (MW)421
Solar collectors area (m2)600,750
Installed capacity of gas heat plants (MW)513
Table 11. The values characterizing the modelled system with the required share of heat from solar collectors = 20%.
Parameter (Unit)Value
Installed storage capacity (TJ)197
Maximum daily storage flow (TJ/day)16.5
Installed capacity of solar collectors (MW)849
Solar collectors area (m2)1,212,950
Installed capacity of gas heat plants (MW)457
Table 12. The quantities characterizing the modelled system with the participation of heat from solar collectors = 40%.
Parameter (Unit)Value
Installed storage capacity (TJ)534
Maximum daily storage flow (TJ/day)39.0
Installed capacity of solar collectors (MW)1755
Solar collectors area (m2)2,507,500
Installed capacity of gas heat plants (MW)437
Table 13. Summary of the basic results of the STAT scenario depending on the required share of solar energy in heat generation.
Share of Solar EnergySolar CollectorsHeat Storage CapacityHeat PriceTotal Investment Cost
CapacityLand AreaSolar CollectorsHeat Storage
MWkm2TJthou. m3PLN/GJMPLN
10%4231.81419092459.85677.0161.3
15%6352.72019092460.841015.6161.3
20%8493.63919795861.771358.5167.2
25%10694.581217105762.871710.4184.4
30%12935.542312151964.382068.9265.2
35%15226.522425207265.982434.8361.6
40%17557.522559272267.692808.4475.1
45%19938.543717349169.583189.4609.2
50%22369.585899437971.583578.3764.2
Table 14. Summary of the basic results of the DYN scenario in subsequent years.
YearSolar CollectorsHeat Storage CapacityShare of Solar EnergyHeat PriceTotal Investment Cost
CapacityLand AreaSolar CollectorsHeat Storage
MWkm2TJthou. m3%PLN/GJMPLN
20254231.8141909241059.85677.0161.3
20307433.1831909241880.38511.20.0
203510014.2911909242392.01413.80.0
204017957.694518252341100.041270.4278.9
2045396416.987243611,86383102.583469.61630.0
2050500521.451376318,33010099.031666.51128.6
Publisher’s Note: MDPI stays neutral with regard to jurisdictional claims in published maps and institutional affiliations.

