Article

Households’ Energy Choices in Rural Pakistan

1
College of Economics, Zhejiang University, Hangzhou 310058, China
2
School of Finance, Zhejiang University of Finance and Economics, Hangzhou 310058, China
3
Department of Civil Engineering, College of Engineering, Taif University, P.O. Box 11099, Taif 21944, Saudi Arabia
4
Department of Electrical Engineering, College of Engineering, Taif University, P.O. Box 11099, Taif 21944, Saudi Arabia
*
Author to whom correspondence should be addressed.
Energies 2022, 15(9), 3149; https://doi.org/10.3390/en15093149
Submission received: 26 February 2022 / Revised: 22 March 2022 / Accepted: 18 April 2022 / Published: 26 April 2022
(This article belongs to the Special Issue Factors Influencing Households’ Energy Consumption)

Abstract

:
In the wake of the United Nation’s Sustainable Development Goals—zero hunger and affordable modern/clean energy for all—many developing countries have taken serious steps in recent years to increase clean energy access for the rural population. The government of Pakistan has similarly made numerous efforts to promote the use of clean energy sources in the rural areas of the country. Therefore, this study examines rural households’ energy choices for cooking and lighting in Pakistan. In doing so, a comprehensive dataset is collected from three different districts of Pakistan between 2020 and 2021, and multivariate probit (MVP) model and Chi-square tests are employed. The Chi-square results indicate that the age, education level, and occupation of the household-head; household size and income; distance to market and wood source; and biogas system ownership are the significant factors affecting cooking choices. The MVP results show that an increase in education level, school-going children, access to credit facilities, and gender (female) are the key positive factors, whereas an increase in the distance to nearest market/road, household size, and age are the factors that negatively affect the likelihood of using clean energy sources for lighting. While comparing the propensity to use modern/clean energy fuels across the three districts, infrastructural development and literacy rate were found to be crucial factors.

1. Introduction

Access to modern energy is becoming increasingly essential for the quality of daily life and socio-economic development of human beings [1]. It was recently reported that an inconsistent energy supply is not only a burden for the household budget, it also causes welfare losses and air pollution [2,3]. However, in reality, most developing countries face challenges in the provision of a reliable supply of energy, specifically electricity, which is the most-preferred form of energy. More importantly, a high number of households in many developing countries are not electrified and solely depend on traditional cooking and lighting sources. For example, recent worldwide statistics show that about 2.6 billion people rely on traditional biomass resources to meet their basic cooking needs, whereas about 770 million people do not have access to electricity [4]. The International Energy Agency (IEA, 2020) report further highlights that inadequate access to clean energy is not the only problem; an increase in the prices of Liquified Petroleum Gas (LPG) and grid-connected electricity in the wake of rising unemployment in energy-deprived countries are other major issues that make clean energy unaffordable for households. This problem has caused a significant number of households around the world to shift back towards traditional cooking and lighting methods: fuelwoods, charcoal, and Kerosene oil [4,5]. A substantially large proportion of these households is located in Sub-Saharan and South-Asian countries, specifically in rural areas [6]. In the context of Pakistan, a synthesis of different official reports and the academic literature revealed that approximately 95% of rural households use traditional biofuel/biomass sources to meet their basic cooking and lighting needs [7].
Since traditional energy sources are health hazards and have numerous negative impacts on the environment and air quality, among other climatic issues [3,6], the Pakistani government, collaborating with different international organizations—e.g., United Nation Development Program (UNDP), Winrock International (WI), and Stichting Nederlandse Vrijwilligers (SNV)—has been making serious efforts in recent years to increase the use of modern and clean energy in rural areas. Furthermore, the use of solar photovoltaic (PV) systems and domestic biogas systems is also encouraged by the federal and provincial governments. These consistent efforts by the Pakistani Government, and different co-projects with China under the China Pakistan Economic Corridor’s (CPEC), have increased electricity generation in Pakistan. However, soaring electricity bills, hyperinflation, increased unemployment, and a contraction in overall economic activities have been combined with a slump in disposable incomes globally; therefore, as a result, households around the world are either reverting to traditional fuel sources or not adopting modern cooking and lighting sources [4,5,8]. Overall, achieving the United Nation’s Sustainable Development Goals (SDGs) [9,10]—clean, modern, and affordable energy for all (SDG 7) [9] and zero hunger (SDG-2) [11,12]—by 2030 seems unlikely [8,9,13].
In sum, it is becoming increasingly important to understand households’ basic energy (cooking and lighting) choices—specifically rural households’ preferences, as they are about 80% of the total population in most developing economies—to formulate a robust energy plan. For example, the Pakistani government has paid about 470 billion Pakistani rupees (2.99 billion US dollars) as a power subsidy and also had to pay about 5.42 billion US dollars a year as capacity charges for the preceding two years, given that Pakistan’s dilemma is a surplus of power generation capacity [14]. In addition, Pakistan plans to double its existing power generation capacity to reach around 53,500 MW (considering an annual growth in its economy of approximately 6%), in this case, if households’ energy choices do not shift towards clean energy sources, the long-standing circular debt acquired by the energy sector will be disastrous for the country, as Pakistan is already under a financial crunch. The impact of the energy crisis, energy mismanagement, and the circular debt of the energy sector in Pakistan has been reported as the most devastating factors for the overall economy: collectively, they shrink the Gross Domestic Product (GDP) [15], increase the trade deficit, and negatively affect foreign investments [16], business cycle variables and returns on investments [17,18]. More precisely, understanding the determinants of households’ energy choices is of great importance for both the energy sector’s development and the overall economic growth of Pakistan, as well as being important in the formulation of pertinent policy guidelines that promote the use of clean/modern energy sources in rural areas of the country.
A systematic examination of the extant literature indicates that household energy choices for lighting and cooking are determined by numerous inter-connected socio-economic, demographical and infrastructural factors. Most studies on this topic have put more weight on Sub-Saharan African regions, while little is known about lighting and cooking choices in the context of the south-Asian region, including Pakistan, where most studies only the provide techno-economic feasibilities of renewable energy projects [15,17]. Other relevant studies have either the examined social acceptance or awareness of a specific energy source for a particular region in Pakistan; for example, public attitude towards biogas systems [19], women’s empowerment and the use of biogas for cooking [7,20], pre- and post-adoption beliefs regarding biogas-based cooking [21], and social acceptance of solar PV systems [22,23]. On the contrary, in the context of Sub-Saharan Africa, studies have comprehensively examined households’ fuel choices and found that female-headed, more educated, and wealthy households have a higher tendency to choose clean/modern energy sources (solar PV system) than their counterparts [24,25]. However, studies examining the basic fuel selection choices of households in the context of Pakistan are not prolific. The main contribution of this study is, therefore, to provide a comprehensive analysis of rural households’ energy fuel choices in Pakistan for cooking and lighting in the wake of different socio-economic, demographical, and infrastructural attributes and recent efforts to increase access to modern/clean energy options vis-à-vis traditional/unclean health-hazard energy sources.
Since wealth distribution, education level, women’s empowerment and their role in economic activities, as well as, most importantly, access to the national grid and the price and availability of traditional fuels (e.g., Kerosene oil, agricultural residuals and fuelwoods) are uneven between Pakistan and Sub-Sharan African countries, a comprehensive assessment aiming to understand households’ fuel choices is a vibrant research agenda with numerous applications in the formation of energy policies and improving access to clean modern energy in rural areas of Pakistan. Therefore, in light of the above discussion, the key objective of this study is to examine the determinants of household energy choices in rural areas of Pakistan. Following the relevant literature and seminal studies, this research considers a comprehensive list of cooking and lightning options that are available at the targeted rural areas and employs robust econometric models, such as Chi-square and Multivariate Probit (MVP) models, among others. The cooking choices available to and used by the households are fuelwood, biomass pellets, agricultural residues, dung cake, charcoal, biogas system, LPG, and grid-connected electricity, whereas the lighting choices considered in this study are kerosene oil, grid-connected electricity, solar PV system, rechargeable battery, petrol/diesel generators (PDG), and biogas systems. The influencing factors considered in the model, which could possibly affect cooking and lighting choices, were the gender, age, education level, and main occupation of the household head; children in schools; total household size, net annual income, landholding size and cattle holding; price of solar PV system, generator, fuel and kerosene; distance to the nearest market, wood source and road; access to credit; availability of national grid connection and biogas plants; and dummy variables for location/districts. The survey results, using a sample of 532 rural households in three different districts of Pakistan, indicate that a substantially large proportion of households choose traditional/unclean sources for cooking: fuelwood, agricultural residuals, dung cake, and biomass pellets. However, the lighting choices results indicate that traditional/unclean (kerosene oil) and modern/clean (grid-connected electricity, solar PV system and rechargeable batteries) sources are equally used for lighting. Further investigation suggests that age, household size, the educational level of the household head, net annual income, occupation of the household head, distance to market and wood source, and biogas system ownership are the factors influencing cooking choices in the area under consideration in this study.
While examining lighting choices, we found that the households headed by women, with access to credit facilities, with a higher education level, and with more school-going children have a higher propensity towards clean energy sources. In contrast, the increase in the distance to market/road, household size, and age of household head are the factors that negative affect the likelihood of using clean energy sources. Finally, the study performed a comparative analysis by investigating district-wise bifurcation and suggests that infrastructural development and literacy rate play an important role in energy fuel choices: districts with higher literacy rates and better infrastructure conditions tend to adopt clean energy fuels. Our findings have numerous practical implications and policy suggestions for renewable/clean energy promoters, policymakers, energy planning departments, and those interested in rural development in Pakistan, as well as for the effective development and formulation of the energy policy guidelines.
The remainder of this article is arranged as follows. Section 2 discusses the data collection procedure, site selection, and empirical strategies employed in the paper, dubbed the “empirical research design”. Section 3 comprehensively discusses the results. Finally, Section 4 concludes the paper and provides policy suggestions.

2. Empirical Research Design

2.1. Study Area and Sampling

The study was conducted in rural areas of three geographically important districts of Pakistan, namely the Dera Ismail Khan, Bhakkar and Tank districts (see Figure 1). The districts were divided into Tehsils, Union Councils (UCs) and UC-Wards. District Dera Ismail Khan (coordinate: 31°49′53″ N 70°54′7″ E) is situated at the west bank of the Indus river, which is considered the geographical center-point of Pakistan and connects four (4) major provinces of the country. It spreads over a 9334 km2 (21.27% urban and 78.73% rural) area and consists of 5 Tehsils, 47 UCs, and 174 UC-Wards. The district’s total population is approximately 1,693,594 (males 48.4% and females 51.5%) with a literacy rate of nearly 44.52% [26]. A connected district to Dera Ismail Khan, Bhakkar (coordinates: 31°37′40″ N 71°3′45″ E) is situated at the Indus river’s east bank. It covers a total area of 8153 km2 (15.76% urban and 84.24% rural) and consists of 4 Tehsils, 64 UCs, and 220 UC-wards. The total population of the district is approximately 1,647,852 (51.16% males and 48.84 females) with a literacy rate of about 51.82% [27]. District Tank (coordinates: 32°7′48″ N 70°13′48″ E) is connected to the north side of the Dera Ismail khan district, with a total area of around 2900 square km2 (11.02% urban and 88.98% rural): it contains 1 Tehsil, 16 UCs, and 87 UC-Wards. The total population of district Tank is approximately 427,044 (52.19% males and 47.81% female), and the literacy rate is 40.98% [26].
All three districts entail vast plain agriculture lands and are famous for producing sugarcane, wheat, maze, dates, mangos, and animal farming. The study employed a multi-stage stratified random sampling approach. In the first stage, based on local administration classifications, agro-climatic zones (ACZs), and agro-ecological zones (AEZs), we divided the sample into three districts. The study then chose households with access to clean and/or renewable energy sources and technologies. In the second stage, following relevant studies [25,28], representative sample size was decided as follows: confidence interval was considered as 95%, precision as 4%, proportion of the population expected to have access to RETs was considered as 33%. Mathematically, this can be presented as:
N = z α 2 2 p 1 p e 2
N = 3.8416 0.33 0.67 0.016 = 531
where N is the proposed sample size, e is the margin of error (precision), p is the proportion of population expected to have access to RETs, 1 − p is the remaining population, and z α 2   is the critical value at the 95% confidence level for a two-tailed hypothesis test.
Figure 1. Map of the districts under study: Dera Ismail Khan, Bhakkar, and Tank. Source: [26,27,29].
Energies 15 03149 g001

2.2. Data Acquisition

2.2.1. Survey

To accurately understand the demographic, socio-economic, and infrastructural factors, comprehensive parameters were considered to achieve explicit categorical data in the specified time-period. Semi-structured questionnaires were used during the cross-sectional survey of selected households, directed using face-to-face interview sessions. We carried out a loop of open and closed questions with the help of focal persons (key informants) to ensure both the reliability and diversity of our data. For cross-validation, robustness, and to maintain a balance between close-ended and open-ended questions, we first executed the study on 45 randomly selected households (15 from each district) as an initial testing. This systematic process of pre-testing enabled us to develop a comprehensive and refined questionnaire that best describes the survey instruments. The sample size and survey instruments were upscaled and refined accordingly. The survey was conducted between October 2020 and September 2021, representing the most recent energy choices and ensuring contrastive seasonal effects on household’s energy choice.

2.2.2. Direct Observational Approach

At surveyed sites in rural villages, a direct observational approach was used on a sessional basis, which profoundly helped us to better understand the energy choices of rural households for cooking and lighting. For complimentary selection, the cross-validation approach reduced the potential bias of survey data. A total of 51 out of 127 focal persons (appointed representatives of a village’s community) in each UC were approached and selected according to their availability. Each focal person worked in a union council and had credible education, experience and good knowledge about the local community. These focal persons helped us to conduct the survey and interview questionnaires. However, other relevant data were collected from different (i) local non-governmental organizations (NGOs) working on health hazards issues, RETs promotions and facilitation, (ii) local electricity power management departments for rural household’s electrification portfolio, (iii) local forestry department for ACZ/AEZ, and (iv) rural development authorities. The secondary data were collected from relevant official websites [26,27], official/government publications [30,31], and previous research papers [15,19,32].

2.3. Data Analysis

2.3.1. Chi-Square Test

Among the many statistical approaches used for observational studies, the Chi-square (χ2) test is widely used by researchers studying survey response data: it helps in analyzing differences in categorical variables (nominal in nature). In our dataset, a substantially large proportion of households were disproportionately skewed towards fuelwood, indicating that the assumptions of traditional parametric statistical methods (e.g., normal distribution and homogeneity of variance) cannot be achieved. The financial econometric literature indicates that parametric models can yield spurious results in such cases. However, non-parametric methods make fewer assumptions: they are more flexible, more robust, and applicable to non-quantitative data. Hence, Pearson’s Chi-square (a nonparametric) test was applied in this study using SPSS27 to assess the relationship between households’ cooking fuel choices and a range of explanatory variables.
The Pearson Chi-square equation can be defined as:
χ 2 = i = 1 n O i E i 2 E i
where O i is the observed value and E i is the expected value. The number of choices in the i th category for trials was 1 , , n .

2.3.2. Multivariate Probit (MVP) Model

Our preliminary findings indicate that households use multiple sources of energy for lighting purposes: solar PV systems, grid-connected electricity, kerosene lamps, biogas systems, rechargeable batteries, and petrol/diesel generators. In Table 1, we enlist and define the variables used in this study. The availability and use of lighting energy sources for households are relatively dissimilar and vary according to the demographic, socio-economic, and infrastructural factors of a village: in some cases, two or more energy sources are simultaneously used, whereas in other cases, they are used as a substitute. Since households’ lighting energy preferences depend on the explanatory variables, the test of independence (untabulated) shows that the lighting energy choices are correlated with each other. This indicates that the MVP model, considered one of the most appropriate methods to analyze correlated multivariate binary outcomes, is an appropriate technique [25,33]. While single equation probit and multinomial probit models do not predict the joint interdependence of binary outcomes, the MVP model allows for joint prediction. The MVP model is based on the random utility model [33]. In this model, each participant makes an adoption decision to maximize her utility. The utility function U i j of an individual i choosing alternative j is defined as:
U i j = V i j + ε i j = α j + k β j k X j k + ε i j
where V i j is the deterministic part and ε i j is the stochastic part of the utility function. The deterministic part V i j consists of an alternative specific constant, α j , independent variable, X j k , and its coefficient; β j k   . The stochastic term (standard error), ε i , follows a multivariate normal (MVN) distribution with mean 0 and variance Σ, such that ε i = ( ε i 1 , , ε i J )   MVN 0 , Σ . Σ has a flexible structure given that the variance–covariance matrix may contain a correlation between explanator variables and unobserved effects. This process is appropriate to examine substitution and complement patterns among different alternatives [33].
Note that if the expected utility is larger than 0, then individual i chooses the alternative j , and the dependent variable Y i j becomes 1. Alternatively, individual i will not select the alternative j , and the dependent variable will become 0. The choice function can be defined as:
Y i j = 1 ,                   i f     U i j > 0 0 ,                   i f     U i j < 0
Further, the choice probability P i j of an individual i for alternative j can be represented as:
P i j = Pr U i j > 0 = I ( V i j + ε i j > 0 ) Φ ε i d ε i
Since the MVP model can be applied to multiple choice situations, the choice probability is adjusted in Equation (6).
P i j Y i β ,   Σ = S j   S j   Φ   ( ε 1 , , ε 1 0 ,   Σ ) d ε i   d ε J
where   Y 1 = Y i 1 Y i J   and   S j = , 0                 i f     Y i j = 0 , 0                     i f   Y i j = 1
More specifically, the model considers six dependent variables and takes the following form in our study [34,35,36].
y i = 1   i f   β i   X + ε i > 0
and
y i = 0   if   β i   X + ε i     0 ,   i = 1 , 2 6
where X is a vector of the explanatory variables; β 1 , β 2 , β 3 , β 4 , β 5   and   β 6 , random errors are ε 1 , ε 2 , ε 3 , ε 4 , ε 5   and   ε 6 of the multivariate normal distribution with zero mean and unitary variance. Stata-16 software is used for estimation. The variable selection is based on the relevant literature (e.g., [25]), summarized in Table 1.

3. Results and Discussion

3.1. Characteristics of the Households

The total sample size of the households for this study was proposed to be 600; however, 532 (94%) questionnaires out of the total sample data were complete and adequate in all respects. Thus, our final error-free sample size was 532 households. As presented in 
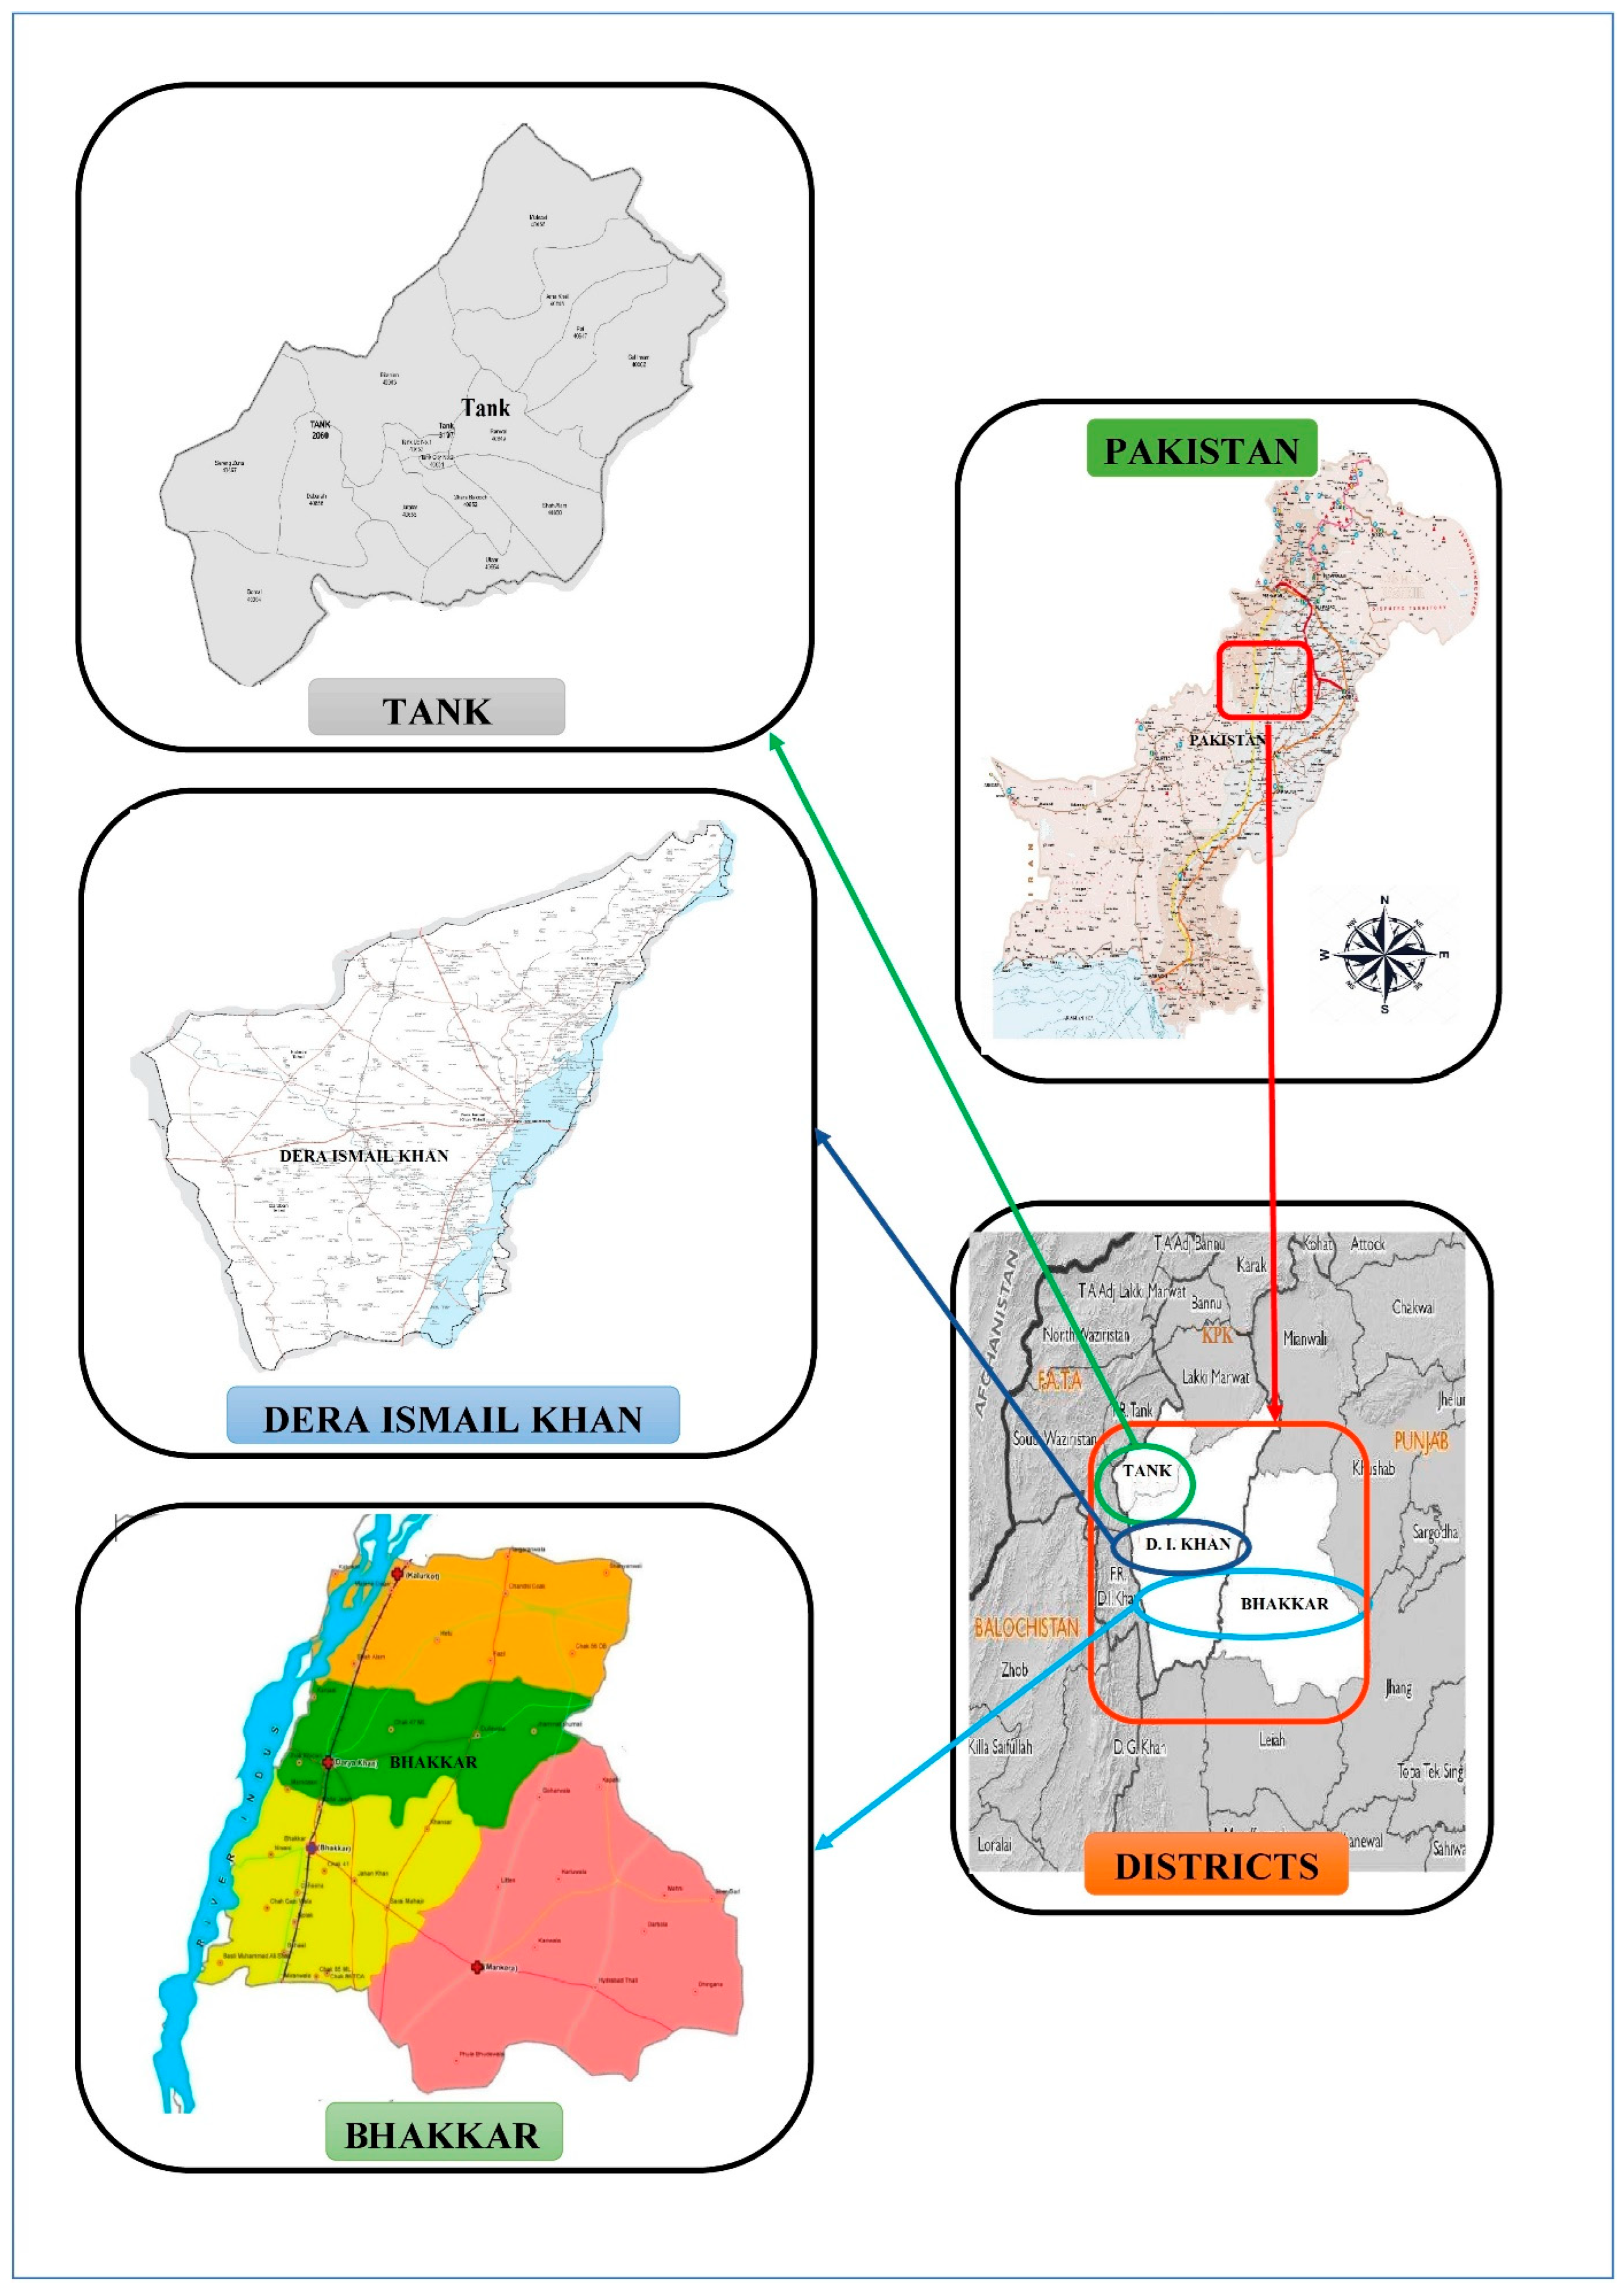
Table 2, male-headed households were about 90.79% and female-headed households were about 9.21% of the total. The average age of the sample households is approximately 46.7 years, household size is 7.54 individuals per house, education level of the household head is 8.03 years, number of school-going children is 2.40, and the annual net income of the households is 726,500 Pakistan rupees (PKR). The main occupations for the households are crop field farming (23.12%), animal farming (18.23%), crop dusting/veterinary services (17.86%), and private small businesses (13.53%), among others who are engaged in multiple economic activities (27.15%). Further, the average livestock (cattle) holding of the households is 5.61 animals and the average landholding (in hectare) is 2.81. Pakistan is an agricultural country where credit facilities are often provided to farmers/rural households; however, such facilities are often taken by the big farmers. In our sample, the credit facilities are used by 21.99% of the households. The infrastructure of the electricity system is poor in villages and there are often technical problems (e.g., consistent grid-outage and transmission line issues). We found that 64.20% of the households were connected to the grid. However, the infrastructure of electricity distribution in the villages of district Dera Ismail Khan was slightly better than the other districts—Tank and Bhakkar. A total of 8.08% of sample households owned petrol and diesel fuel-based generators, primarily those living in off-grid areas. About 21.20% of sample households owned solar PV systems, whereas about 6.01% owned biogas systems, specifically those households engaged in animal and field crop farming. The nearest wood collection site was, on average, 50.40 min walking (round trip), and the nearest market trip takes, on average, 58.20 min of walking (round trip).
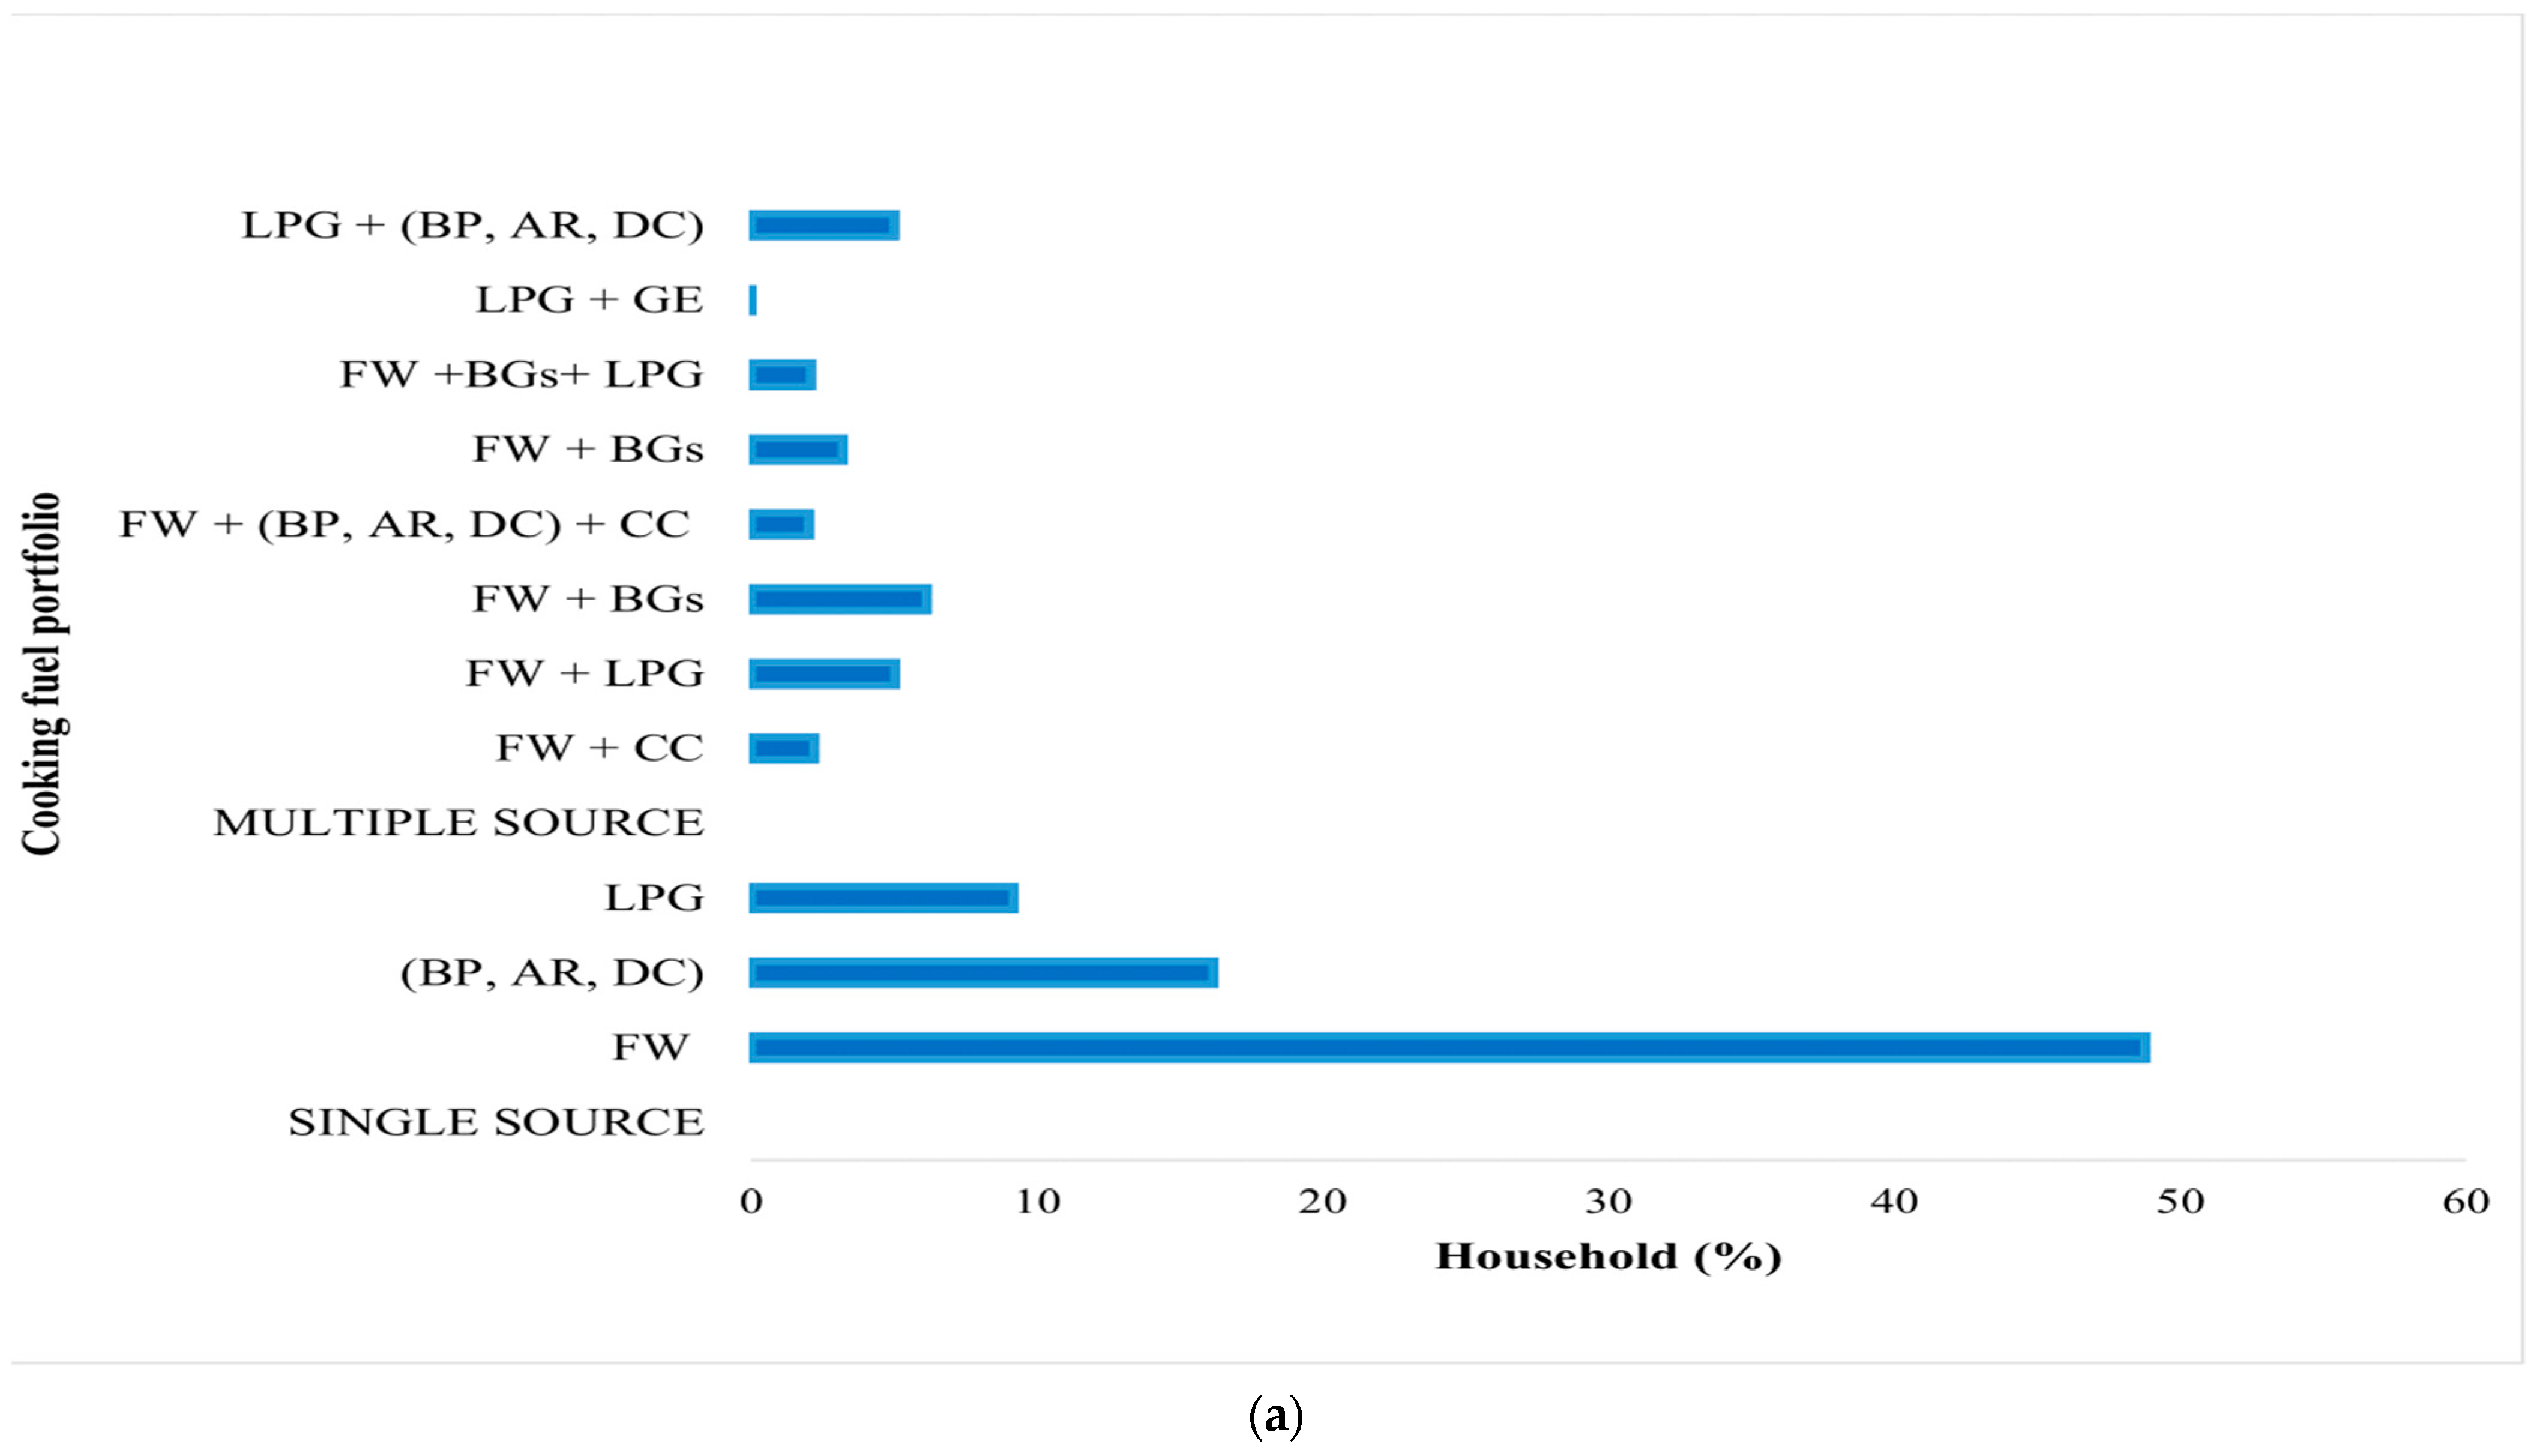
Table 3 (Panel A) presents the frequency and percentage of households using different cooking fuel sources. Out of 532 households in all three districts, 64% of the households used fuelwood as the single primary cooking fuel and 20.48% of the households simultaneously use biomass pellets, agricultural residue, and dung-cake with a flammable material such as kerosene oil or petrol. Charcoal was used at a rate of about 4.13% at the household level; however, its use is more common in commercial activities, such as bread-making, ironing, and heating. Around 7.33% of the households use LPG as a cooking fuel, which is a comparatively a lower percentage than their urban counterparts, who often use LPG for their cooking needs. The perplexity of electricity load shedding (grid outage) in rural areas is around 14–16 h a day [15,17], which affects the use of electrical appliances for cooking: only 0.37% of the households use electricity for cooking. In our sample, about 6.01% of households own a biogas system; however, only 3.57% use the biogas system properly, with special biogas cooking stoves. The diffusion of biogas systems and the underlying difficulties have been discussed in the relevant studies [7].
However, many households use a mixed fuel-portfolio (multi-fuel consumption). An analysis of the survey data shows that many rural households still prefer to use fuelwood as the primary fuel option. Fuelwood is utilized in conjunction with other fuel substitutes, which refers to the energy-staking model. Figure 2a details the fuel-mix portfolio for cooking used by the households. About 74.19% households rely on a single source: fuelwood is the source for 48.8% of households, the simultaneous use of biomass pellets/agricultural residues/dung-cake and kerosene is the source for 16.19%, and LPG is the source for 9.2%. The rest of the households (25.81%) use mixed fuels for cooking, which is comprehensively portrayed in Figure 2a.
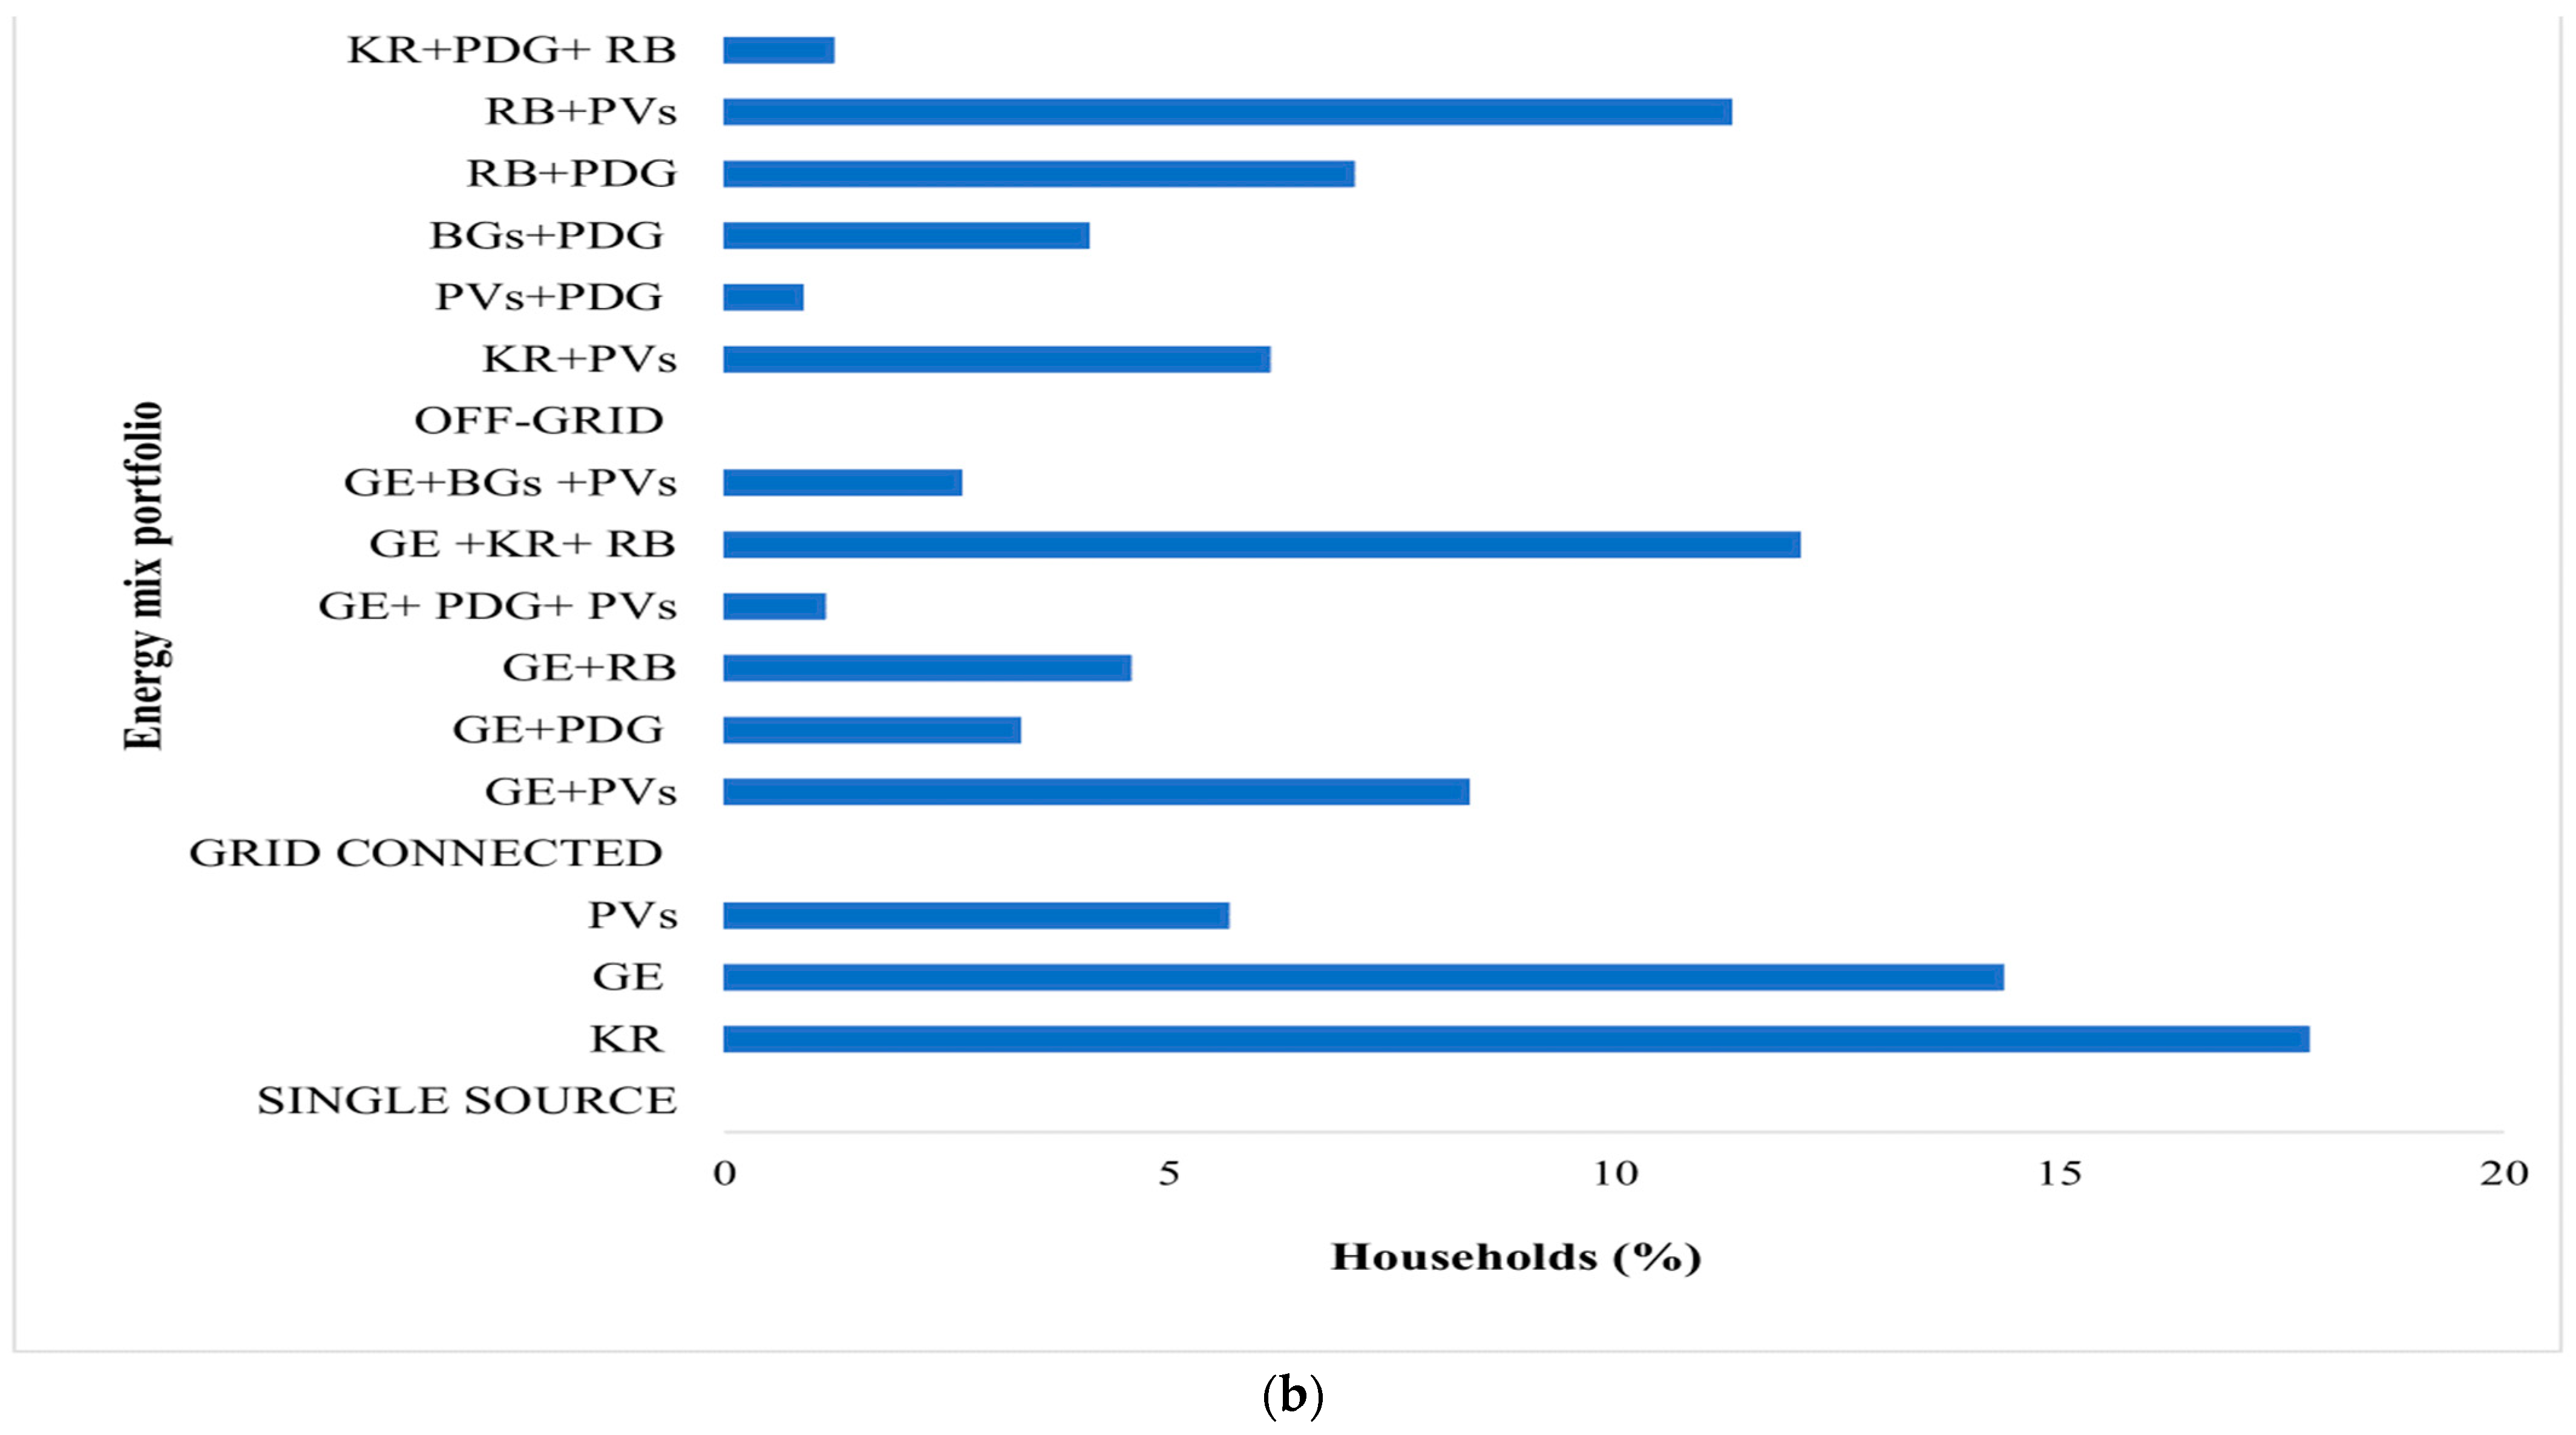
Table 3 (Panel B) lays out the frequency and percentage of households’ primary energy sources for lighting. Out of 532 households, 202 (37.96%) use old-fashioned lighting sources (kerosene lamps), 147 (27.63%) use electricity, 112 (21.05%) use solar PV system/smart lamps (smart lanterns), 46 (8.64%) households use rechargeable (e.g., lithium Ion) batteries, 11 (2.06%) use biogas system/lamps, and 13 (2.44%) use petrol/diesel generators (specifically, those living off-grid areas) for lighting purposes. While 64.2% of sample households are connected to the grid, actual access to electricity is limited due to a poor distribution system, weak transmission lines, and electricity shortfall in rural areas. Figure 2b presents households’ energy portfolio (mix substitutions) for lighting. The sample data collected in this study demonstrate that households relying on a single source of energy are about 37.7% of the total, where kerosene users are 17.76%, grid electricity users are 14.32%, and solar PV system users are 5.62%. The total proportion of grid-connected households that use a mixed-energy portfolio is 31.86%, and the aggregate proportion of off-grid households utilizing a mixed-energy portfolio is 30.44%, which is comprehensively portrayed in Figure 2b.

3.2. Cooking Fuel Choices: Chi-Square Analysis

The results in Table 4 depict the relationship between explanatory variables and households’ cooking fuel choices by employing the Pearson Chi-square model.
Gender: The first treatment of Chi-square, which examines the gender factor, shows a statistically insignificant coefficient (χ2 = 2.99, p-value = 0.5595). This intimates that the gender differences do not influence the choice of cooking fuel source. The reason for there being no conflict in cooking fuel choices might refer to other factors, for example, cheaper or more economical sources of cooking fuel. Our findings contradict the results of Rahut et al. [37], who found that females are more likely to choose a clean cooking fuel than their male counterparts.
Age: The results of Chi-square for the age factors are significant (χ2 = 26.93, p-value = 0.0422), indicating the importance of age as an influencing factor. In rural areas, females are often engaged in cooking activities. It is understandable that young households prefer clean energy sources, whereas senior citizens have more savings (given that they have been accumulating savings for a comparatively longer time period than the younger households), which can be used to buy/afford modern RETs, such as a biogas system.
Location: Location is another important factor, which can influence households’ cooking choices due to the numerous differences that exist in ACZs and AEZs between two different sample areas [25]. In terms of location, as an influencing factor, our results are insignificant (χ2 = 7.29, p-value = 0.5056), indicating that the cooking choices across the three districts under study are largely similar: this is possible because the three selected districts in our study are geographically connected to each other and similar in terms of ACZs/AEZs. It is interesting to note that while district Dera Ismail Khan has a better infrastructure and a higher literacy rate, the households’ cooking fuel choices are yet indistinguishable across the three districts.
Income: In rural communities, income is one of the most crucial factors in making any decision, especially in rural communities in developing countries [15,25,38], since these communities are financially underprivileged in developing countries. In our sample, income was a similarly significant factor (χ2 = 91.36, p-value = 0.0000). Our findings exhibit that wealthier households prefer to choose clean energy fuels for cooking, such as LPG. In face-to-face conversations with the households, we found that a few wealthy households also use different combinations of clean and/or traditional fuel. Conversely, households with low annual income prefer to use cheaper energy sources: fuelwood, agricultural residue, dung cake and biomass pellets. Overall, an increase in income level reduces the household’s choice to use dirty fuel for primary cooking needs.
Education level: The education level of the household head is also significant (χ2 = 33.88, p-value = 0.0868) in our study. Similar to many other studies that examine the education level of the household-head, we found that less-educated households are not concerned about the health issues of using dirty fuel. On the other hand, educated households prefer to use clean energy sources for cooking and are more conscious about the health issues. Our findings are in line with other, similar studies [25,39,40].
Household size: The relationship between household size (the number of family members) and primary cooking fuel choices is statistically significant (χ2 = 78.93, p-value = 0.0000). It is commonly believed that the need for cooking fuel increases when the household number (size) increases. In rural areas, females and children are often considered an economical source of fuelwood and agricultural residues’ collection. Therefore, a large family has more chances to efficiently accumulate sufficient energy fuels. Our results corroborate the findings of other relevant studies [41].
Occupation: The Chi-square results of household head’s occupation show (χ2 = 28.38, p-value = 0.0284) a significant association with cooking fuel choice. The households that are simultaneously engaged in both cropping and animal farming, and those that work in the government offices tend to choose clean energy sources. Further, big landlords and households with a large number of animals (cattle) were found to be the current users of a biogas system for their primary cooking needs.
Distance to the nearest market and wood-collection site: The availability of wood sources in the nearby vicinity is one of the key determinants that significantly affects households’ fuel choices. The Chi-square analysis in Table 4 shows a significant relationship between distance to wood source and household cooking fuel choice (χ2 = 43.45, p = 0.0000). Distance to the nearest market is similarly a significant factor influencing households’ fuel choices. (χ2 = 38.47, p-value = 0.0001). Residing near to the market provides easier access to different clean energy sources, for example, LPG and electricity. In contrast, the remoteness of a location provides easier and more economical access to dirty fuels, such as agriculture residues, dung cakes, and fuelwoods.
Access to grid electricity: The χ2 of access to grid electricity (χ2 = 5.89, p-value = 0.2075) is insignificant, indicating that the access to grid electricity does not affect the cooking fuel choice in our sample. The main reasons for its insignificance are the consistently increasing prices of electricity in Pakistan [14], with grid outages of up to 16 h a day in the rural areas [15], and a low voltage that does not support many electricity appliances [17]. Therefore, despite having access to grid-connected electricity, the households do not consider this as a cooking fuel choice. In summary, the access to grid electricity does not substantially impact the choice of cooking fuels: while our results are contrary to the findings of some relevant studies [39,40], they are also supported by a few other relevant studies [25].
Biogas system ownership: The last explanatory variable in our analysis is biogas system ownership. The Chi-square results (χ2 = 43.51, p-value = 0.0000) indicate that the relationship between biogas system ownership and households’ cooking fuel choices is significant. Given that biogas system owners are comparatively wealthier and more educated households, the influence of biogas system ownership on fuel choice is evident, consistent with the literature [2,7,23]. The biogas awareness program launched by the provincial and federal governments has played an important role in educating people about the benefits of installing a biogas system.
In addition to the explanatory variables discussed above, few households are also found to be culturally addicted to traditional cooking style and taste; for example, the use of traditional (sand/mud made) cooking pots that can only be used with fuelwood. Similarly, we found that households prefer to use traditional biomass sources (i.e., agri-residues and fuelwoods) to cook milk tea and some other specific traditional food, even when clean energy sources are available. However, such habitual and cultural cooking styles and taste consciousness are not part of this study (for brevity). During face-to-face interviews and discussions with the households, we found that the steadily increasing prices of clean cooking fuels (LPG and electricity) have discouraged the household shift towards modern/clean energy sources. Likewise, an increase in the prices of clean energy fuels also increased the spread between the prices of clean and traditional fuels, making unclean traditional fuels more cost-effective and attractive.

3.3. Households’ Energy Choices for Lighting: Multivariate Probit (MVP) Model Approach

In this section, we analyze households’ energy choices for cooking using the MVP model. Choosing the MVP model with robust standard errors allows for us to understand the key factors influencing households’ decision when choosing among different energy sources for lighting. Multicollinearity between explanatory variables (so-called independent or influencing factors) can result in sporous findings, which can mislead readers and policymakers. Following a common practice, we first examined the Variance Inflation Factor (VIF) and checked whether the values were within the acceptance range that is commonly used (i.e., the threshold value of VIF < 10). Except for the distance to road factor, the remaining variables were below the threshold value of 10 (Table 5). To normalize the data, Z-scores were first calculated and then a cut-off value of ±3 was used (as suggested by the relevant literature [25]) to normalize the data and drop outliers. Note that the higher values of Z-score indicate more unusual observations, whereas 0 indicates a value that equals the mean.
Table 6 presents pairwise correlation results of the binary dependent variables: two unclean energy sources (kerosene and petrol/diesel generator) and four clean energy sources (electricity, rechargeable batteries, solar PV system and biogas system). The likelihood ratio is statistically significant—Chi2(15) = 76.24, Prob > Chi2 = 0.0000—rejecting the null hypothesis that the selected six energy choices are independent. The correlations between kerosene and electricity, rechargeable batteries, solar PV system, and biogas system and between petrol/diesel generator and electricity, rechargeable batteries, and solar PV system are all negative. More precisely, the correlation coefficients show a negative relationship between unclean energy sources and clean energy sources, indicating a substitution effect among them.
On the contrary, the relationship between kerosene oil and petrol/diesel generator is positive, indicating a complementary relationship between these sources: in off-grid areas, households use a combination of energy choices. The correlation coefficient among clean energy sources for lighting contrasts both positive and negative effects. For example, the correlation of (i) rechargeable batteries with electricity and solar PV system and the correlation between (ii) electricity and biogas system are positive. This complementarity between the clean fuels is understandable as the rechargeable batteries need power (using electricity or solar PV system) for re-charging and the use of biogas technology fundamentally complements the grid-connected electricity (energy mix portfolio). The correlation of solar PV system with electricity and biogas systems, and the correlation between rechargeable batteries and the biogas system were found to be negative, because the likelihood of such an energy mix (combination) for lighting may not be technically and economically feasible.
Table 7 provides the estimated coefficients (βi), while Table 8 illustrates the marginal probability effect (Yi = 1) of factors explaining households’ energy choices for lighting. The Wald Chi2 (102) = 597.42 (Prob > chi2 = 0.0000) is statistically significant at any commonly referred to conventional significance levels (e.g., at a 1% level; α = 0.01). Thus, the results of the model can be considered reliable.
Gender: In Table 7 and Table 8, both the coefficients and marginal probability effects of gender (female) are statistically insignificant for all lighting energy choices, except for the PV system, which is positive and significant. This implies that the females in rural areas usually stay at home during the daytime, and the unavailability of grid (electricity) creates numerous hurdles for them when attempting to manage their housework in a timely manner. Thus, the female-headed households have a higher tendency towards the use of solar PV systems compared to other lighting choices. Consistent with the previous studies [14,36], our results suggest that gender plays an important role in the energy choice for lighting: female-headed households are more likely to choose clean energy sources for lighting than their male counterparts.
Age: The coefficients and probability estimations of the household head’s age are positive and significant for the kerosene and biogas system. The former relationship indicates that older households may possibly be more comfortable with old-fashioned lighting choices (i.e., kerosene), whereas the latter relationship suggests that older households may have more resources allowing for the installation of a biogas system than the younger households. While our results are in line with the findings of Ali et al. [34], they contradict the findings of Kelebe et al. [42].
Education level: Table 7 illustrates that the education level of the household-head has a positive and significant association with rechargeable batteries, grid electricity, solar PV system, and biogas system. This clearly indicates the importance of literacy in the use of clean and modern energy sources. A negative and statistically significant association between household head’s education level and kerosene further strengthen our earlier argument. A substantially large number of studies examining the determinants of adoption for clean energy sources show similar findings [19,23,25].
Household size: Household size is another important factor in rural areas: since a large family size (up to some extent) has numerous comparative advantages in rural communities, at least in Pakistan. The results of both the coefficients and marginal probability estimates for household size are positive for kerosene, biogas system, and rechargeable batteries. This means that households with a larger family size, on average, need more energy and arranging multiple clean energy sources may not be a feasible option. Therefore, these households use kerosene lamps and rechargeable batteries to meet their basic lighting needs instantly, using easily available substitutes. Similarly, large families have different advantages regarding the cost-effective collection of animal manure (for the biogas system). In sum, the electricity shortfall in rural areas has pushed households towards the use of multisource energy, including from dirty, health-hazard sources.
Children in schools: Table 7 shows positive and significant relationships between children in school and both electricity and solar PV systems. Since school-going children represent comparatively more educated and wealthier households and households living nearer main roads than their counterparts, their choice to use electricity and a solar PV system is, therefore, justified. Further, it is also important to know that both electricity and solar PV systems are more user-friendly and have brighter lighting options than kerosene or rechargeable batteries; therefore, such households prefer to adopt these clean energy sources, which can also help the school-going children in their studies.
Households’ income level: The coefficients of household income are positive and significant for electricity, solar PV system, biogas system, and petrol/diesel generator. Households with a high income—both off-grid and grid-connected households—are likely to adopt a combination of different energy sources (energy mix) for lighting. The marginal probability shows significant results for petrol/diesel generators as an energy choice because households with a high income can easily afford substitutes that can fulfill their energy needs when electricity is unavailable. For off-grid areas, wealthy households have to rely on petrol/diesel generators. In contrast, the coefficient and marginal probability of households’ income portray a negative but significant relationship with kerosene and rechargeable batteries. As discussed above, households with a high income already own a more reliable energy portfolio, and, therefore, do not rely on dirty sources or rechargeable batteries.
Landholding: The coefficients of landholding size are positive and significant for solar PV systems, biogas systems, and petrol/diesel generators. The households with larger landholdings also have more available space, more livestock (in most cases), and more crop-residuals; therefore, installing a biogas system, solar PV system, and using petrol/diesel generators (in off-grid areas) for lighting needs are all favorable choices for them, compared to those households who own smaller (or no) landholdings. Our results are in line with the findings of other studies conducted in different regions [42,43].
Livestock holding: The coefficient of livestock holding was found to be positive and significant for biogas systems and petrol/diesel generators. It is evident that households owning large numbers of livestock have a sufficient availability of animal manure for biogas production. Furthermore, during the interview and questionnaire stage, we found that few households owning large numbers of livestock live in remote areas, which are mostly off-grid; thus, they use petrol/diesel generators as one of the primary energy sources for lighting in addition to biogas plants.
In contrast, the relationship between livestock holding and kerosene was found to be negative but significant. This is understandable because households with larger livestock holdings, their own biogas system, and a petrol/diesel generator, among other energy sources; therefore, the use of kerosene lamps has no interest. Our results corroborate the findings of Kabir et al. [44]: an increase in livestock size positively influences the households to take advantage of animal manure for the biogas system.
Price of solar PV system: Table 7 and Table 8 illustrate positive and significant associations between the prices of the solar PV system and kerosene, rechargeable batteries, and electricity. This shows that an increase in the price of solar PV systems leads rural households to shift towards either traditional/unclean sources (i.e., kerosene) or cheaper/economical sources (i.e., rechargeable batteries). Although the solar PV system is clean and not very complex for lighting purposes, households in rural areas cannot afford such technologies.
Price of kerosene: The estimated coefficients and marginal probabilities in Table 7 and Table 8 show that an increase in the price of kerosene oil noticeably reduces the use of kerosene lamps for lighting. The positive and significant relationship between kerosene oil prices and rechargeable batteries, electricity, and solar PV systems further suggests that an increase in the price of kerosene fuel leads households to adopt alternative sources. In other words, when kerosene fuel is be more expensive, households will either choose a cheaper option (rechargeable batteries) or other clean alternatives (solar PV system or electricity), given that the increase in the price of kerosene oil would shrink the spread between clean and dirty lighting fuels.
Price of generators and fossil fuel (petrol/diesel): It is obvious that an increase in the price of a petrol/diesel generator will substantially reduce the demand (or purchasing power) for petrol/diesel generators (households), as indicated by the negative and statistically significant coefficient in Table 7 and Table 8. On the contrary, the results for kerosene, grid electricity, and solar PV system, were found to be positive and significant, implying that the price of the petrol/diesel generator creates a spillover effect between cheaper energy sources and other comparable options (e.g., solar PV system). Similar results were found for the prices of fossil fuels in Pakistan.
Access to credit: The relationship between access to credit and solar PV system, biogas system, and petrol/diesel generators were found to be positive and significant. Recent renewable energy promotion campaigns and other motivational measures taken by both private and government entities to increase the use of RETs and clean/modern energy sources can be examined by looking at the results in Table 7 and Table 8. Our results also correlate with the findings of Berhe et al. [45]. In sum, we found that access to credit facilities positively and significantly influences the adoption of biogas systems as an energy lighting source in Pakistan.
Distance to market: The coefficient and marginal probability estimates are insignificant for kerosene. The availability of kerosene is relatively high in all three districts; therefore, distance to market was not an influencing factor. However, the coefficients were found to be found negative and significant for rechargeable batteries, electricity, and solar PV systems, indicating that households residing far from the market have limited access to clean energy compared to those residing nearby the market.
Distance to road: Interestingly, the results of Table 7 and Table 8 show that the distance to road was significant for only one factor: electricity. The electricity infrastructure follows the main and link roads of each district; therefore, households residing near the road have easy access to electricity. The estimated coefficients and marginal probability effects for other energy fuels are insignificant. Our results contradict the findings of Ali et al. [34] and Kelebe et al. [42], who found that easy access to roads increases households’ willingness to use clean energy.
Location: Although ACZs/AEZs have a similar nature across the three districts under study, demographic, socio-economic, and infrastructural factors vary. Our district-wise results show the dissimilarity of lighting energy choices: kerosene, solar PV systems, petrol/diesel generators, and biogas systems. The coefficients of kerosene and petrol/diesel generators are positive and significant for district Tank and Bhakkar, illustrating that households residing in Tank and Bhakkar use more unclean sources. A possible explanation for such choices is that the villages in these two districts are comparatively more remote than the villages in district Dera Ismail Khan. In contrast, the lighting energy choices of households in district Dera Ismail Khan are tilted towards solar PV systems and electricity. However, the propensity to choose the biogas system is more pronounced in district Bhakkar. It is well documented in the literature that the government of the Punjab province is consistently encouraging (in the form of providing subsidies) its rural residents to install biogas systems [7,20]; therefore, it is not surprising to find that households in district Bhakkar—which lies in the Punjab province—are more inclined towards biogas technology than the households in the other two districts, which are administrated by Khyber Pakhtunkhwa (KPK) province.

4. Conclusions

Access to modern and clean energy is not only essential for economic growth, but also important to improve living standards, environmental and air quality and decrease health risks for households—the burning of polluting fuel exposes households to different infectious, non-communicable respiratory, and cardiovascular diseases [8,46,47]. In light of the United Nation’s Sustainable Development Goals [9,12,13], which focus on (i) access to clean, modern and affordable energy for all and (ii) zero hunger, the number of individuals with access to modern/clean energy and adequate food has increased over the last decade. However, population growth during the same period in developing countries, soaring electricity bills and LPG prices, and high inflation and unemployment in recent years have either reverted households to the use of unclean traditional health hazard energy sources or stopped them from adopting modern and clean energy sources [4,8,25,43]. While comprehensive assessments of different energy choices for cooking and lighting were recently conducted for Sub-Sharan African and Latin American countries, the extant literature in the context of south-Asian countries is confined to either techno-economic studies or the social acceptance and awareness of a specific energy source for a particular case study. This study, therefore, comprehensively examines household energy choices in an energy-deprived developing south-Asian economy, Pakistan. In doing so, this study considers the numerous fuel choices that are available to rural households for cooking and lighting purposes and investigates the role of different socio-economic, demographical, and infrastructural attributes, among others, which plausibly affect the households’ decision-making process.
The key findings of this study indicate that the energy choices for heavy cooking rely on traditional fuels, specifically fuelwoods, followed by agricultural residues and biomass pellets. On the contrary, energy choices for lighting are not skewed towards modern or traditional energy sources: that is, the choice between clean (i.e., grid-connected electricity and solar PV system) and traditional (i.e., kerosene oil) sources is made in equal proportion.
While examining lighting choices, we found that the households headed by a female, with access to credit facilities, with higher education levels, and with more school-going children have a higher propensity towards clean energy sources. In contrast, the increase in the distance to market/road, household size, and age of the household head are the factors that negatively affect the likelihood to use clean energy sources. Finally, the study performed a comparative analysis by investigating district-wise bifurcation and suggested that infrastructural development and literacy rate play important roles in energy fuel choices: districts with a higher literacy rate and better infrastructure tend to adopt clean energy fuels.
Thus, we suggest that policymakers should consider socio-economic and infrastructural factors when establishing energy policy guidelines, specifically when proposing grid-extensions or launching renewable-energy promotion schemes. Given that this study comprehensively examines three important districts of Pakistan to infer the rural households’ choices in the country (because rural communities are usually considered to be homogenous in terms of socio-economic characteristics and institutional and infrastructural facilities), examining households’ energy choices in other rural communities will be an interesting research agenda, More importantly, energy planning and policy guidelines are designed based on future energy needs; therefore, forecasting short-term [48], medium-term [49], and overall electricity demand [50] will be interesting extensions of this work.

Author Contributions

M.A. (Muhammad Ahmar): conceptualization, software, data curation, formal analysis, methodology, writing—original draft; F.A.: conceptualization, formal analysis, supervision, investigation, validation, writing—original draft and review and editing; Y.J.: conceptualization, supervision, investigation, validation, writing—review and editing; M.A. (Mamdooh Alwetaishi): funding, writing—review and editing; S.S.M.G.: funding, writing—review and editing. All authors have read and agreed to the published version of the manuscript.

Funding

This project was funded by Taif University Researchers Supporting Project number TURSP- 2020/34, Taif University, Taif, Saudi Arabia. The authors also acknowledge Research Startup Grant by Zhejiang University of Finance and Economics, Hangzhou, China.

Institutional Review Board Statement

Not applicable.

Data Availability Statement

Authors agree to make the data and materials supporting the results presented in this paper available upon reasonable request.

Acknowledgments

We acknowledge the participants in the Asian Economic Community (AEC) Forum, held in South Korea, for their helpful suggestions and comments, specifically Josef C. Brada (Arizona State University, United States), Willem Thorbecke (RIETI, Japan), and Jehoon Park (AEC Foundation and Incheon National University, Korea). The authors also acknowledge the financial support of the Taif University Researchers Supporting Project number TURSP-2020/34, Taif University, Taif, Saudi Arabia, and Research Startup Grant by Zhejiang University of Finance and Economics, Hangzhou, China. All remaining errors are our own.

Conflicts of Interest

The authors declare no conflict of interest.

References

  1. UNDP. Human Development Report 2007/08. 2007. Available online: http://hdr.undp.org/sites/default/files/reports/268/hdr_20072008_en_complete.pdf (accessed on 15 February 2022).
  2. Acharya, B.; Adhikari, S. Household energy consumption and adaptation behavior during crisis: Evidence from Indian economic blockade on Nepal. Energy Policy 2021, 148, 111998. [Google Scholar] [CrossRef]
  3. Bruce, N.; Pope, D.; Rehfuess, E.; Balakrishnan, K.; Adair-Rohani, H.; Dora, C. WHO indoor air quality guidelines on household fuel combustion: Strategy implications of new evidence on interventions and exposure–risk functions. Atmos. Environ. 2015, 106, 451–457. [Google Scholar] [CrossRef]
  4. IEA (International Energy Agency). World Energy Outlook. 2020. Available online: https://www.iea.org/reports/world-energy-outlook-2020 (accessed on 15 February 2022).
  5. Agência-Brasil, Preço Do Gás e Desemprego Elevam uso da Lenha Para Cozinhar no Brasil (Gas Prices and Unemployment Increase the Use of Firewood for Cooking in Brazil). 2019. Available online: https://agenciabrasil.ebc.com.br/geral/noticia/2019-06/preco-do-gas-e-desemprego-elevam-uso-da-lenha-para-cozinhar-no-brasil (accessed on 15 February 2022).
  6. Health Effects Institute. State of Global Air 2018; Health Effects Institute: Boston, MA, USA, 2018. [Google Scholar]
  7. Yasmin, N.; Grundmann, P. Adoption and diffusion of renewable energy—The case of biogas as alternative fuel for cooking in Pakistan. Renew. Sustain. Energy Rev. 2019, 101, 255–264. [Google Scholar] [CrossRef]
  8. Shupler, M.; Mwitari, J.; Gohole, A.; de Cuevas, R.A.; Puzzolo, E.; Čukić, I.; Nix, E.; Pope, D. COVID-19 impacts on household energy & food security in a Kenyan informal settlement: The need for integrated approaches to the SDGs. Renew. Sustain. Energy Rev. 2021, 144, 111018. [Google Scholar] [CrossRef]
  9. Chirambo, D. Towards the achievement of SDG 7 in sub-Saharan Africa: Creating synergies between Power Africa, Sustainable Energy for All and climate finance in-order to achieve universal energy access before 2030. Renew. Sustain. Energy Rev. 2018, 94, 600–608. [Google Scholar] [CrossRef]
  10. Győri, Á.; Huszár, Á.; Balogh, K. Differences in the Domestic Energy Consumption in Hungary: Trends between 2006–2017. Energies 2021, 14, 6718. [Google Scholar] [CrossRef]
  11. United-Nations. Transforming Our World: The 2030 Agenda for Sustainable Development; Department of Economic and Social Affairs, United Nations: New York, NY, USA, 2015. [Google Scholar]
  12. Rosenthal, J.; Quinn, A.; Grieshop, A.P.; Pillarisetti, A.; Glass, R.I. Clean cooking and the SDGs: Integrated analytical approaches to guide energy interventions for health and environment goals. Energy Sustain. Dev. 2018, 42, 152–159. [Google Scholar] [CrossRef] [PubMed]
  13. WBG (World Bank Group). Tracking SDG7: The Energy Progress Report. Available online: https://www.seforall.org/global-tracking-framework (accessed on 15 February 2022).
  14. TP, The Third Pole 2021. 2021. Available online: https://www.thethirdpole.net/en/energy/pakistan-excess-power-generation/ (accessed on 15 February 2022).
  15. Ali, F.; Jiang, Y.; Khan, K. Feasibility analysis of renewable based hybrid energy system for the remote community in Pakistan. In Proceedings of the 2017 IEEE International Conference on Industrial Engineering and Engineering Management (IEEM), Singapore, 10–13 December 2017. [Google Scholar]
  16. Shabbir, M.S.; Bashir, M.; Abbasi, H.M.; Yahya, G.; Abbasi, B.A. Effect of domestic and foreign private investment on economic growth of Pakistan. Transnatl. Corp. Rev. 2021, 13, 437–449. [Google Scholar] [CrossRef]
  17. Ali, F.; Ahmar, M.; Jiang, Y.; AlAhmad, M. A techno-economic assessment of hybrid energy systems in rural Pakistan. Energy 2021, 215, 119103. [Google Scholar] [CrossRef]
  18. Ali, F.; He, R.; Jiang, Y. Size, Value and Business Cycle Variables. The Three-Factor Model and Future Economic Growth: Evidence from an Emerging Market. Economies 2018, 6, 14. [Google Scholar] [CrossRef] [Green Version]
  19. Luo, B.; Khan, A.A.; Ali MA, S.; Yu, J. An evaluation of influencing factors and public attitudes for the adoption of biogas system in rural communities to overcome energy crisis: A case study of Pakistan. Sci. Total Environ. 2021, 778, 146208. [Google Scholar] [CrossRef] [PubMed]
  20. Yasmin, N.; Grundmann, P. Home-cooked energy transitions: Women empowerment and biogas-based cooking technology in Pakistan. Energy Policy 2020, 137, 111074. [Google Scholar] [CrossRef]
  21. Yasmin, N.; Grundmann, P. Pre- and Post-Adoption Beliefs about the Diffusion and Continuation of Biogas-Based Cooking Fuel Technology in Pakistan. Energies 2019, 12, 3184. [Google Scholar] [CrossRef] [Green Version]
  22. Jan, I. Socio-economic characteristics influencing farmers’ willingness-to-adopt domestic biogas technology in rural Pakistan. Environ. Sci. Pollut. Res. 2021, 28, 20690–20699. [Google Scholar] [CrossRef] [PubMed]
  23. Jan, I.; Akram, W. Willingness of rural communities to adopt biogas systems in Pakistan: Critical factors and policy implications. Renew. Sustain. Energy Rev. 2018, 81, 3178–3185. [Google Scholar] [CrossRef]
  24. Baek, Y.J.; Jung, T.Y.; Kang, S.J. Analysis of Residential Lighting Fuel Choice in Kenya: Application of Multinomial Probability Models. Front. Energy Res. 2020, 8, 70. [Google Scholar] [CrossRef]
  25. Wassie, Y.T.; Rannestad, M.M.; Adaramola, M.S. Determinants of household energy choices in rural sub-Saharan Africa: An example from southern Ethiopia. Energy 2021, 221, 119785. [Google Scholar] [CrossRef]
  26. LGKP. Local Government, Elections, and Rural Development Departments, KPK, Pakistan. 2021. Available online: https://www.lgkp.gov.pk/districts/ (accessed on 15 February 2022).
  27. LGCD and Punjab. The Local Government & Community Development (LG&CD) Department. 2021. Available online: https://lgcd.punjab.gov.pk/district-bhakkar (accessed on 15 February 2022).
  28. Cochran, W.G. Sampling Techniques; John Wiley & Sons: Hoboken, NJ, USA, 2007. [Google Scholar]
  29. Maps of Pakistan. 2021. Available online: https://www.travel-culture.com/pakistan/pakistan_maps.shtml (accessed on 15 February 2022).
  30. NTDC. Daily Operational Energy Data. 2021. Available online: https://ntdc.gov.pk/energy (accessed on 15 February 2022).
  31. Pakistan Bureau of Statistics—PBS. 2021. Available online: https://www.pbs.gov.pk/content/energy-mining-statistics (accessed on 15 February 2022).
  32. Amir, S.M.; Yonggong, L. Reasons Behind Success and Failure of Biogas Technology: A Case of District Dera Ismail Khan (Pakistan). Sci. Pap.-Ser. Manag. Econ. Eng. Agric. Rural Dev. 2016, 16, 45–51. [Google Scholar]
  33. Edwards, Y.D.; Allenby, G.M. Multivariate Analysis of Multiple Response Data. J. Mark. Res. 2003, 40, 321–334. [Google Scholar] [CrossRef]
  34. Ali, A.; Rahut, D.B.; Mottaleb, K.A.; Aryal, J.P. Alternate energy sources for lighting among rural households in the Himalayan region of Pakistan: Access and impact. Energy Environ. 2019, 30, 1291–1312. [Google Scholar] [CrossRef]
  35. Ali, A.; Mottaleb, K.A.; Aryal, J.P. Wealth, education and cooking-fuel choices among rural households in Pakistan. Energy Strategy Rev. 2019, 24, 236–243. [Google Scholar] [CrossRef]
  36. Ahmar, M.; Ali, F.; Jiang, Y.; Wang, Y.; Iqbal, K. Determinants of Adoption and the Type of Solar Technology Adopted in rural Pakistan. Front. Environ. Sci. 2022. In Press. [Google Scholar] [CrossRef]
  37. Das, S.; De Groote, H.; Behera, B. Determinants of household energy use in Bhutan. Energy 2014, 69, 661–672. [Google Scholar] [CrossRef]
  38. Nlom, J.H.; Karimov, A.A. Modeling Fuel Choice among Households in Northern Cameroon. Sustainability 2015, 7, 9989–9999. [Google Scholar] [CrossRef] [Green Version]
  39. Heltberg, R. Fuel switching: Evidence from eight developing countries. Energy Econ. 2004, 26, 869–887. [Google Scholar] [CrossRef]
  40. Makonese, T.; Ifegbesan, A.P.; Rampedi, I.T. Household cooking fuel use patterns and determinants across southern Africa: Evidence from the demographic and health survey data. Energy Environ. 2018, 29, 29–48. [Google Scholar] [CrossRef] [Green Version]
  41. Van Der Kroon, B.; Brouwer, R.; van Beukering, P.J.H. The energy ladder: Theoretical myth or empirical truth? Results from a meta-analysis. Renew. Sustain. Energy Rev. 2013, 20, 504–513. [Google Scholar] [CrossRef]
  42. Kelebe, H.E.; Ayimut, K.M.; Berhe, G.H.; Hintsa, K. Determinants for adoption decision of small scale biogas technology by rural households in Tigray, Ethiopia. Energy Econ. 2017, 66, 272–278. [Google Scholar] [CrossRef]
  43. Koirala, D.P.; Acharya, B. Households’ fuel choices in the context of a decade-long load-shedding problem in Nepal. Energy Policy 2022, 162, 112795. [Google Scholar] [CrossRef]
  44. Kabir, H.; Yegbemey, R.N.; Bauer, S. Factors determinant of biogas adoption in Bangladesh. Renew. Sustain. Energy Rev. 2013, 28, 881–889. [Google Scholar] [CrossRef]
  45. Berhe, M.; Hoag, D.; Tesfay, G.; Keske, C. Factors influencing the adoption of biogas digesters in rural Ethiopia. Energy Sustain. Soc. 2017, 7, 10. [Google Scholar] [CrossRef] [Green Version]
  46. Yu, K.; Lv, J.; Qiu, G.; Yu, C.; Guo, Y.; Bian, Z.; Yang, L.; Chen, Y.; Wang, C.; Pan, A.; et al. Cooking fuels and risk of all-cause and cardiopulmonary mortality in urban China: A prospective cohort study. Lancet Glob. Health 2020, 8, e430–e439. [Google Scholar] [CrossRef] [Green Version]
  47. Yu, K.; Qiu, G.; Chan, K.H.; Lam, K.B.H.; Kurmi, O.P.; Bennett, D.A.; Yu, C.; Pan, A.; Lv, J.; Guo, Y.; et al. Association of Solid Fuel Use With Risk of Cardiovascular and All-Cause Mortality in Rural China. JAMA 2018, 319, 1351–1361. [Google Scholar] [CrossRef] [PubMed]
  48. Shah, I.; Iftikhar, H.; Ali, S.; Wang, D. Short-Term Electricity Demand Forecasting Using Components Estimation Technique. Energies 2019, 12, 2532. [Google Scholar] [CrossRef] [Green Version]
  49. Shah, I.; Iftikhar, H.; Ali, S. Modeling and Forecasting Medium-Term Electricity Consumption Using Component Estimation Technique. Forecasting 2020, 2, 163–179. [Google Scholar] [CrossRef]
  50. Nti, I.K.; Teimeh, M.; Nyarko-Boateng, O.; Adekoya, A.F. Electricity load forecasting: A systematic review. J. Electr. Syst. Inf. Technol. 2020, 7, 13. [Google Scholar] [CrossRef]
Figure 2. Proportion of sample households’ energy fuel mix. (a) Cooking energy mix. (b) Lighting energy mix.
Energies 15 03149 g002aEnergies 15 03149 g002b
Table 1. Explanatory variables.
Variable (Xi)Unit (Definition)Expected Relation
Gender (dummy variable)1 = female, 0 = malePositive
AgeHH age (in years)Negative
Education levelHH number of years of schoolingPositive
Total household sizeTotal number of individuals in HH familyPositive/Negative
Children in schoolTotal number of family’s members enrolled in schoolPositive
Net annual incomeHH net annual incomePositive
Landholding sizeHH holding total land (in hectares)Positive
Livestock HH holding livestock (in numbers)Positive
Price of solar PV systemTotal cost of solar PV systemNegative
Price of generators Total cost of generators fuel based (Petrol/diesel) for HHNegative
Price of petrol/dieselPrice of petrol/diesel and liquified petroleum gas (LPG) per liter in nearby market/fuel station/neighborhoodPositive/Negative
Price of kerosenePrice of kerosene per liter in the nearest market/neighborhoodPositive/Negative
Distance to marketRemoteness from the nearest market (roundtrip walking distance in minutes)Positive/Negative
Distance to roadRemoteness from road (roundtrip walking in minutes)Positive/Negative
Access to credit1 = HH has credit facility, 0 = otherwisePositive
Location (dummies)Setting Dera Ismail Khan as a reference category
D1 = 1 if household lives in district Bhakkar D1 = 0 otherwise;
D2 = 1 if household lives in district Tank D2 = 0 otherwise
Positive/Negative
Table 2. Descriptive statistics of the households’ characteristics.
VariablesStat.Total Samples Size (N = 532)SE
Location/districtDera Ismail KhanFreq187
BhakkarFreq180
TankFreq165
HHH genderMaleFreq483
FemaleFreq49
HH ageMean46.706.92
HH educationMean8.033.21
HH family sizeMean7.541.98
HH children/siblings enrolled in educational institutionsMean2.401.18
HH landholding (in hectare)Mean2.810.36
HH livestock holdingMean5.611.86
HH net annual cash income (in PKR)Mean726,500
HH with credit service facilitiesFreq117
HH having grid electricity connectionFreq342
HH using clean cooking sourcesFreq141
HH with solar PV systemFreq113
HH owns generator (petrol/diesel)Freq43
HH owns biogas system (Installed)Freq37
Distance to wood collection site (round-trip), min.Mean50.4046.40
Distance to nearest market (round-trip), min.Mean58.2021.30
Source: Own field survey, 2020–2021. HH stand for household, PKR stands for Pakistani rupee, solar PV system stands for solar photovoltaic system.
Table 3. Primary cooking and lighting energy choices.
Household’s Fuel TypesFreq: (N = 532)Percentage
Panel A: Primary cooking fuel
Fuelwood (FW)34164.09%
Biomasspellets (BP), agri residues (AR), and dunk-cake (DC) with kerosene10920.48%
Charcoal (CC)224.13%
Biogas system (BGs)193.57%
Liquefied petroleum gas (LPG)397.33%
Grid electricity (GE)20.37%
Total532100%
Panel B: Primary lighting energy sources
Kerosene (KR)20237.96%
Grid electricity (GE)14727.63%
Solar PV system (PVs)11221.05%
Rechargeable battery (RB)468.64%
Petrol/diesel generators (PDG)132.44%
Biogas system (BG)112.06%
Total532100%
Source: Own field survey, 2020–2021. Authors calculations.
Table 4. Pearson’s Chi square (χ2) test of association between household characteristics and primary cooking fuel choices.
VariableCategorye N (532)χ2 Statdfp-ValueCramer’s V
Gender insignificantMale4832.9940.5595
Female49
Age16–254726.93 **160.04220.1125
26–35193
36–45188
46–5565
56–above39
LocationDera Ismail Khan1877.2980.5056
Bhakkar180
Tank165
Household family’s size1–54578.93 ***120.00000.2224
6–10310
10–15166
15–above11
Education level (in years)No formal education6733.88 *240.08680.1262
4–6165
7–8121
9–1087
11–1265
13–1424
15–164
Household net annual income (PKR/year)300,000–500,00025991.36 ***160.00000.2072
500,001–700,000120
700,001–900,00073
900,001–1,100,00065
1,100,001–above15
Household occupationField cropping12328.38 ***160.02840.1155
Livestock farming97
Crop field and livestock mixed145
Crop dusting + veterinary services95
Private business72
Distance to wood source (round trip), minutes10–25 min4543.45 ***120.00000.1651
25–40 min82
40–55 min294
55 above111
Distance to market for (charcoal/LPG/biomass pallet)10–25 min4538.47 ***120.00010.1552
25–40 min82
40–55 min281
55 above124
Grid electricity connectionYes3425.8940.2075
No190
Biogas system ownershipYes3743.51 ***40.00000.28598
No495
***, **, and * represent statistical significance at p < 0.01, p < 0.05, and p < 0.10 respectively. LPG stands for liquified petroleum gas. e The two households that use grid electricity for cooking are excluded.
Table 5. Variance inflation factor results.
VariableVIF1/VIF
Gender of HH head(F)3.410.293
Age of HH head3.920.255
Education level of HH head2.640.379
Total HH family’s size4.840.207
Numbers of children enrolled in school3.980.251
Net annual cash income5.930.169
Landholding size5.580.179
Livestock holding size4.670.214
Average price of generator (petrol/diesel)3.330.3
Average rice (diesel/petrol/gas)2.940.34
Price of solar PV system1.20.833
Price of kerosene6.450.155
Distance to road10.290.097
Distance to market5.160.194
Access to credit facility2.250.444
Location (district)2.920.342
Mean VIF4.880.205
Table 6. Correlation coefficients of the six lighting energy choices.
Variable CorrelationsCoefficientsStandard ErrorZ
Kerosene and grid electricity−0.4360.1742.5057 **
Kerosene and rechargeable battery−0.3520.2051.7171 *
Kerosene and solar PV system−0.2910.1262.3095 **
Kerosene and biogas system−0.2450.1381.7754 *
Kerosene and petrol/diesel generator0.0950.0531.7924 *
Rechargeable battery and grid electricity0.5120.2242.2857 **
Rechargeable battery and solar PV system0.1790.0921.9457 *
Rechargeable battery and biogas system−0.1950.1731.1273
Petrol/diesel generator and rechargeable battery−0.1730.1860.9301
Petrol/diesel generator and grid electricity−0.2360.1172.0171 **
Petrol/diesel generator and solar PV system−0.0120.0140.8571
Petrol/diesel generator and biogas system0.0260.0350.7428
Grid electricity and solar PV system−0.2840.1092.6055 **
Grid electricity and biogas system0.0210.01871.1229
Solar PV system and biogas system−0.02470.02640.9356
Likelihood ratio test of (rho = 0): chi2(15) = 76.24. Prob > chi2 = 0.0000. Significance level: ** indicates 5%; * indicates 10%.
Table 7. Factors affecting households’ energy choices for lighting: MVP model estimation.
ExplanatoryVariablesKRRBGEPVsBGsPDG
Coef.SECoef.SECoef.SECoef.SECoef.SECoef.SE
a Gender (Female)0.03250.26310.02400.0520−0.05410.07540.5210 **0.2051−0.09320.1161−0.03540.0439
Age of HH head0.0782 **0.0375−0.03420.0252−0.03210.0442−0.11010.35100.3181 **0.1412−0.00750.0239
Education Level of HH−0.3241 **0.14200.2312 **0.10610.4135 **0.17510.2590 *0.01900.4762 ***0.1151−0.01760.0129
HH family’s size0.2474 **0.09830.1381 **0.0692−0.01810.0213−0.13200.15320.1470 ***0.0390−0.00890.0104
Children in school−0.04170.23700.02130.05700.2541 **0.12500.1830 ***0.05210.23100.1844−0.01240.0135
Net income of HH−3.006 ***0.8906−0.5081 *0.26230.98900.84313.235 ***0.81914.1310 ***0.96810.2199 ***0.0557
Landholding size−0.20010.1887−0.34420.43700.23700.30670.19600.60710.2471 ***0.06500.5133 ***0.1413
Livestock holding size−0.1499 *0.0901−0.08720.08120.04300.02940.04870.04710.4312 ***0.06520.0033 *0.0018
Price of solar PV system0.2366 **0.11860.8266 **0.16310.3590 *0.2140−0.3246 ***0.07070.00810.0735−0.02210.0148
Price of Generator (petrol/diesel)0.4662 **0.17010.61710.46240.4790 ***0.16140.2040 *0.10730.01300.0973−0.5138 *0.3031
Price of petrol/diesel−0.07250.06940.02340.0614−0.09420.06860.0736 *0.0443+0.0629 *0.0323−0.0351 ***0.0057
Price of kerosene−0.0943 *0.05040.0735 *0.04110.0633 **0.03100.0978 *0.05270.09340.1394−0.00670.0075
Distance to market0.16410.12540.0649 *0.0360−0.1991 *0.1123−0.1863 *0.1073−0.10400.1933−0.01040.0111
Distance to road0.19210.12270.23630.2210−0.1480 ***0.0311−0.25800.3025−0.25120.1741−0.01750.0205
a Access to credit−0.11400.1635−0.01100.0380−0.08940.10430.3161 ***0.09350.2361 ***0.08110.0215 ***0.0064
b Location: Tank0.9282 **0.4272−0.08810.0930−0.11920.1041−0.2742 *0.1521−0.02230.0350+0.0376 ***0.0117
b Location: Bhakkar0.3191 **0.13120.46400.5206−0.9460 *0.487−0.25930.17220.322 ***0.0971+0.0186 *0.0104
Constant−3.0372 **1.37410.4217 **0.2070−1.1821 ***0.396−1.1305 **0.52810.26400.2103−0.07690.0359
Total number of observations = 532. Log-likelihood function = −1145.12. Wald Chi2, χ2 (102) = 597.42. Prob > Chi2 = 0.0000. Significance level: *** 1%, ** 5%, and * 10%. a Dummy variable. b Location dummies: Dera Ismail Khan is the reference category. Note: coefficient (Coef.), robust standard error (SE), kerosene (KR), rechargeable battery (RB), grid electricity (GE), solar PV system (PVs), biogas system (BGs), petrol/diesel generator (PDG).
Table 8. Marginal effects of explanatory variables effecting the households’ lighting choices.
Explanatory VariablesKRRBGEPVsBGsPDG
MarginSEMarginSEMarginSEMarginSEMarginSEMarginSE
a Gender (Female)0.01150.02240.00480.0090−0.04100.03400.0157 **0.0076−0.00450.0068−0.01640.0223
Age of HH head0.0512 **0.01980.01400.0180−0.00900.0160−0.10200.09400.0460 ***0.0117−0.10650.0981
Education level of HH−0.0660 **0.02700.0373 **0.01620.14200.11600.0413 **0.01700.1030 **0.0427−0.04310.0577
HH family’s size0.2320 **0.09800.0825 *0.0486−0.00610.0210−0.06200.53200.0539 ***0.0173−0.06470.5554
Children in school−0.01050.04300.01100.14200.03100.07400.0880 **0.03400.00480.0037−0.09190.1355
Gross Income of HH−0.1780 ***0.0376−0.0830 ***0.01400.4909 **0.07160.3650 *0.21300.7420 ***0.24800.3811 ***0.1322
Land holding size−0.05900.0419−0.03400.02600.07730.11200.0320 **0.01410.0935 **0.03750.0434 ***0.0127
Livestock holding size−0.03020.0299−0.00210.00680.01430.01100.01600.01350.0592 ***0.01620.01670.0141
Price of solar PV system0.0478 **0.02030.0583 ***0.01500.0466 **0.0229−0.03860.03310.05240.0623−0.04030.0346
Price of Generator (petrol/diesel)0.0278 **0.01030.07130.06250.0348 **0.01430.02450.03310.03610.0419−0.0972 ***0.0261
price of (petrol/diesel)−0.08200.05330.01910.03900.05810.04120.0120 ***0.00270.0048 *0.0028−0.0338 **0.0141
Price of kerosene0.0430 *0.02300.02100.13900.03100.02120.04200.03270.00430.0265−0.04380.0341
Distance to market0.04500.05300.06300.0580−0.00850.0113−0.0940 **0.0375−0.03500.0270−0.09810.0642
Distance to road0.04600.06200.02600.0190−0.1340 ***0.0462−0.04200.0678−0.02930.0227−0.04380.0708
a Access to credit−0.06960.0900−0.05300.0613−0.03500.05900.27500.20100.1020 ***0.02990.6871 ***0.2098
b Location: Tank0.0180 *0.0042−0.02470.0196−0.03440.0290−0.06540.06700.00830.02270.0767 ***0.0241
b Location: Bhakkar0.05710.17800.05100.0380−0.2130 ***0.0610−0.01410.02950.0712 ***0.02370.06830.0699
Significance level: *** 1%, ** 5%, and * 10%. a Dummy variable. b Location dummies: Dera Ismail Khan is the reference category. Note: Robust standard error (SE), kerosene (KR), rechargeable battery (RB), grid electricity (GE), solar PV system (PVs), biogas system (BGs), petrol/diesel generator (PDG).
Publisher’s Note: MDPI stays neutral with regard to jurisdictional claims in published maps and institutional affiliations.

