1. Introduction
With the development of the economy and the increasing electricity demand, people’s requirements for the reliability of modern power systems continue to increase. As an essential safety device in the low-voltage distribution network, the low-voltage circuit breaker (LVCB) plays the role of distributing electric energy and performing on-off operations for low-voltage distribution circuits, motors, or other electrical equipment according to specified conditions [
1,
2,
3]. An LVCB is an essential electrical device in the entire power supply network, and it is vital to ensure its safe and reliable running during the service stage [
4,
5].
The electrical life of an LVCB is the number of on-load operations that the device can withstand under the specified on and off conditions without repairing and replacing any parts [
6]. The contact wear caused by electrical stress is the main reason for the LVCB’s degradation and failure. During the breaking process of the LVCB, an arc is generated between the contacts, which causes mass loss on the contact surface. This mass loss resulting from the arc current is called the contact erosion amount (CEA). When the CEA threshold of the LVCB is reached, the contact performance cannot meet the switch-on requirements, and then it fails [
7,
8]. The research on the electrical life of the LVCB is the basis for the reliability assessment of the distribution network. LVCBs are extensively equipped in the distribution network. During the whole life cycle, it is frequently required to design targeted running and maintenance plans, which necessitates a thorough understanding and judgment of the electrical life of LVCBs [
9,
10].
In terms of electrical life assessment methods for the switching apparatus, some researchers have studied new methods for contact erosion monitoring. The Savitzky–Golay convolution smoothing technique is integrated with the BP neural network algorithm in [
11], and the arcing time, arc energy, and arcing phase angle are selected as characteristic parameters. The remaining electrical life prediction model for the contacts is established, which enhances the forecast accuracy over the old methodology. In [
12], an electrical life assessment model based on cloud theory is proposed, considering the fuzziness and randomness in life evaluation. This approach uses a cloud model to replace the traditional interval method to divide the insulation state level of the circuit breaker. According to an example calculation analysis, it is demonstrated that the new model is more accurate than the old one. From the perspective of the erosion rate and wear coefficient, an electrical life assessment method for the Cu-W contact of the circuit breaker is proposed [
13], which can be used to support the design of arc contacts. Meanwhile, it is noted that the size and type of contacts affect electrical life. In [
14], a novel method is proposed for processing time-resolved spectral signals using the chromaticity method. It is applied to the online monitoring of contact erosion in the high-voltage circuit breaker. The time-resolved spectroscopy of the arc is captured using an optical fiber sensor. The spectral emission time is correlated with the contact mass loss and the degree of surface deterioration. In [
15], a method for determining the arcing time using auxiliary contacts is proposed, and the test is performed on circuit breakers with different excitation coils. The technique is appropriate for high-voltage gas circuit breakers. The auxiliary contacts can be accessed during the online operation to perform an online assessment of the circuit breaker contact state. The authors of [
16] analyze the changing law of characteristics such as arc time, arc energy, and breaking phase angle with the operation numbers of a special AC contactor that is often used in low-voltage power distribution systems. Simultaneously, this study created a database of crucial electrical life features and effectively applied the strategy to electrical fire detection. In [
17,
18], the corresponding relationship between the dynamic contact resistance of the circuit breaker and the contact erosion state is analyzed, and the related state evaluation methods are proposed. The authors of [
19] investigate an online evaluation approach of the high-voltage circuit breaker considering multiple physical parameters. The authors of [
20] describe the distribution characteristic of electrical life for AC contactors. The authors of [
21] introduce the arc plasma characteristic and arc movement of the LVCB. The influence of reignition is examined on the LVCB in [
22]. In addition, there are multiple linear regression-based and arc discharge power-based monitoring algorithms for the CEA of circuit breakers [
8,
23]. Regardless of the approach used, the goal of the electrical life study of the LVCB is to determine the contact erosion degree and provide a baseline for the overall performance degradation of the switching apparatus. It is still an effective method to use arc energy to characterize the contact erosion state.
In the study of the arc erosion mechanism of the switching apparatus, three key considerations are electrical, contact, and equipment parameters [
24,
25,
26,
27]. Electrical parameters include arc energy, breaking current level, arcing phase angle, arcing time, and electric charge. Contact parameters include material properties, processing technology, and geometry shape. Breaking speed, opening distance, arc extinguishing mode, and arc extinguishing medium are examples of equipment parameters. Additionally, [
28] investigates the effect of operation frequencies on arc erosion behavior. The surface morphology, microstructure, and element distribution of the Ag/CdO contact are described utilizing scanning electron microscopy. Furthermore, the formation process and action mechanism of arc erosion are analyzed. In [
29,
30], the influence of alloying elements and the manufacturing process on the arc erosion characteristics of contact materials are studied, respectively. The authors of [
31] analyze the effect of load characteristics on contact erosion behavior.
Despite the availability of several state evaluation techniques for on-site diagnosis and testing of the switching apparatus, there are still some problems in the electrical life assessment of the LVCB. First, due to the limitation of the circuit breaker structure and detection cost in the low-voltage field, the LVCB maintenance is mainly periodic, without considering the impact of the operation environment, which will lead to excessive or insufficient maintenance. Second, the existing arc erosion model usually only considers the influence of current when calculating the CEA and takes the arc current waveform as a standard sine wave. However, in actual operation, the current waveform of the LVCB changes with the power factor and supply voltage, which makes the theoretical estimated value quite different from the actual value of electrical life. Therefore, this paper studies the arc erosion law of the LVCB considering the arc voltage and analyzes the electrical life distribution features of the LVCB under different supply voltages and power factors.
Due to the influence of arc, the circuit topology changes, the waveform of breaking current is distorted, and the zero-crossing of arc current is early (compared with the current before contact separation). Therefore, the maximum current and arcing time change with t0. Firstly, this paper examines the motion law of arc voltage during the breaking process and establishes the arc voltage mathematical model of the LVCB based on arc starting time. Then, the arc erosion model considering arc voltage is established. The arc current waveform and contact wear curve variations of the LVCB under different supply voltages and power factors are obtained. At the same time, the electrical life simulation test is carried out with the help of the Monte Carlo approach, and the LVCB’s electrical life distribution is obtained. Finally, the effectiveness of this method is compared and analyzed through experiments. Research on this subject can help increase the accuracy of lifetime evaluation under various loads and operation conditions while also serving as a technical reference for the LVCB’s reliability evaluation and running and maintenance plan.
The remainder of this research is organized as follows:
Section 2 presents an arc voltage model that is based on the arc starting time (AST).
Section 3 analyzes the arc current of the LVCB.
Section 4 establishes an arc erosion model for the LVCB considering arc voltage and analyzes the arc erosion variation under different supply voltages and power factors.
Section 5 conducts electrical life simulation experiments by the Monte Carlo method.
Section 6 verifies the validity of the method by electrical life test. In
Section 7, the conclusion is provided.
2. Arc Voltage Model of the LVCB Based on AST
In order to study the influence of supply voltage and power factor on electrical life, it is necessary to establish an arc erosion model with the help of arc voltage. The first thing to do is analyze the variation law of arc voltage during contact breaking. The arc of the LVCB consists of three parts: near-cathode zone, near-anode zone, and arc column zone. Similarly, the arc voltage is also divided into cathode voltage drop, anode voltage drops, and arc column voltage drop. The essence of the electrode voltage drop is the space charge excited by the electric field between the contacts, which is closely related to the material on the contact surface and the gas medium. For air medium, the value of cathode voltage drop is close to that of anode voltage drop. When the arc burns steadily, the voltage drop between the cathode and anode fluctuates less as the current varies and can be approximated as a constant. For the arc column zone, the essence of the arc column voltage drop is the ionization of air to form plasma, which is closely related to the electric field strength and arc length. The arc voltage
ue can be approximately expressed as:
where
uc is the cathode voltage drop,
ua is the anode voltage drop,
uz is the arc column voltage drop,
u0 is the electrode voltage drop,
E is the arc column electric field strength, and
l is the arc length.
By analyzing the I-V characteristic curve of the AC arc, the relationship between the arc voltage and the current of the LVCB has been apparent. However, in the analysis and calculation of the electrical life, people are concerned about the erosion effect of the current on the contact during a specific arcing time, and the corresponding arc starting time (AST) is an essential physical quantity. The AST of an LVCB refers to the time interval from the arc burning moment to the previous current zero. Its distribution interval is [0, T/2), where T is the circuit period. With the aid of the AST concept, the relationship between contact breaking operation and arc voltage of the LVCB can be established, which lays a foundation for the subsequent analysis of electrical life characteristics.
For investigating the arc voltage variation of the LVCB based on the AST, it is necessary to analyze the movement characteristics during the contact breaking of the LVCB. It cannot cause damage to the parts while ensuring the quick action of the contacts. Assume that the AST is t0, the breaking speed is v, the contact opening distance is D, and the contact gap is d during the breaking process. There are three situations to describe the relationship among t0, d, and D.
t0 is a large number. The contact gap d does not reach the opening distance D when the arc reaches the zero-crossing point and extinguishes, and the contact keeps moving after the arc is extinguished;
t0 is moderate. When the arc is extinguished, the contact gap d = D;
t0 is relatively small. Before the arc is extinguished, the contact gap has reached D, and it remains unchanged as the arc burns until the arc is extinguished.
The second case is a particular case of contact breaking. That is, the contact gap is exactly
D when the arc is extinguished, and the AST is
tD at this time, then the variation law of the contact gap can be obtained as follows:
Equations (2) and (3) show that the change of the contact gap is closely related to the AST. Combined with Equation (1), the arc voltage can be written as a functional curve cluster related to
t0 during the contact separation. According to the changing characteristics of the arc voltage, the arc voltage value reaches the maximum when the arc is extinguished. The maximum arc voltage can be expressed as Equation (4).
When the contact gap changes little during the initial stages of contact breaking, it can be assumed that the gap between contacts rises linearly with time. The variation of arc voltage with the AST obtained according to Equation (4) is shown in
Figure 1. Since the AC arc has negative resistance characteristics and the arc voltage is practically constant while the arc is burning stably, the average value of the arc voltage during contact breaking is utilized to indicate the overall fluctuation features of the arc voltage. The blue curve in
Figure 1 shows the corresponding relationship between the maximum arc voltage (at the arc extinction point) and the AST, i.e.,
t0-
umax. The red curve indicates the corresponding relationship between the mean value
ue* of arc voltage and the AST. Because the arc voltage in the arc burning section increases first and then tends to be stable, and the average arc voltage is less than the voltage at the arc extinguishing point, the curve inflection point is advanced. Without special instructions, the arc voltage in the following paper is the average arc voltage value.
The corresponding relationship between
ue* and
t0 is established from
Figure 1, as shown in Equation (5):
Equation (5) shows that the key to determining the link between the arc voltage and the AST is to discover the values of the three parameters tD, u0, and uD. u0 and uD are the near-pole voltage drop and the arc voltage value during stable arcing, respectively, which are determined by the contact material and the opening distance. tD is the inflection point of the voltage curve, which is also related to the characteristics of the circuit breaker itself. In the same batch of the LVCB, the parameters of tD, u0, and uD can be considered unchanged.
To estimate the parameter values for
tD,
u0, and
uD, we can consult the relevant data of the LVCB contact material and contact travel curve. Furthermore, the three parameters may be computed by collecting the arc current and voltage waveform under various AST. This paper collected the arc voltages at different ASTs, and the average voltage is calculated. The results are shown in
Figure 2.
After curve fitting, it can be obtained that u0 = 22 V, uD = 38 V, tD = 0.36 T.
3. Arc Current Waveform of the LVCB
The analysis of the arc current waveform of the LVCB is the basis for establishing the arc erosion model. In the low-voltage switching apparatus field, the traditional arc erosion model considers that the arc current is the same as the steady-state current of the power system when the contact is broken. If the breaking current level does not change, the electrical life of the LVCB remains unchanged. The arc current is shown in Equation (6).
However, Equation (6) cannot account for the effect of voltages and power factors on electrical life. According to actual operating data, the electrical life of the LVCB is also highly connected with the supply voltage and power factor. After introducing the arc voltage, changes of arc current under different supply voltages and power factors and the influence on the CEA can be obtained. The specific analysis process is given below. Using a single-pole contact as an example,
Figure 3 shows the equivalent circuit diagram of a contact-breaking load circuit. Among them,
R and
L are load-side resistance and inductance, which can be used to adjust the circuit power factor.
C is the capacitance to the ground, and the current flowing through
C is usually minimal, and its current value can be ignored.
up and
ue are the supply voltage and arc voltage, respectively.
After the contacts of the LVCB are separated, an arc is generated between the contacts. The existence of the arc changes the original structure of the circuit. For the LVCB, on the one hand, the existence of the arc voltage plays a role in limiting the current, and on the other hand, the factors affecting the electrical life become more complicated. According to
Figure 3, the voltage equilibrium equation is as follows:
From Equation (7), the arc current can be obtained as:
where
U is the supply voltage RMS,
θ is the power factor angle, and
ω is the angular frequency of the AC power supply. The initial condition is
ie (
t = 0,
t0 = 0) = 0.
,
.
3.1. Arc Current Waveform under Different ASTs
According to Equation (8), the arc current waveforms at different ASTs are obtained in
Figure 4. In
Figure 4, the supply voltage is 220 V, the current RMS is 10 A, the power factor is 0.65, and the frequency is 50 Hz.
The arc current is not a standard sine wave throughout the contact breaking process, as seen in
Figure 4, and the current amplitude fluctuates with the AST. Furthermore, the arc extinguishing time is not fixed at T/2. The greater the arc starting time
t0, the closer the arc extinguishing time is to T/2. The smaller the arc starting time is, the greater the difference between the arc current amplitude and the ideal current amplitude is.
3.2. Arc Current Waveform under Different Supply Voltages
In order to analyze the influence of supply voltage on arc current waveform, three different supply voltages are selected in this paper: 220 V, 380 V, and 660 V. The arc current waveform obtained under different supply voltages is shown in
Figure 5.
t0 and the power factor in
Figure 5 are fixed. The dotted line is the current waveform under ideal conditions. From the arc current waveform, when
t0 = 0 ms, it can be obtained that the larger the supply voltage, the larger the current amplitude at the same AST, and the longer the arcing time. It can be preliminarily judged that with the increasing supply voltage, the erosion effect of the arc on the contacts is more significant. Meanwhile, the electrical life of the LVCB is decreasing, which is consistent with the actual usage.
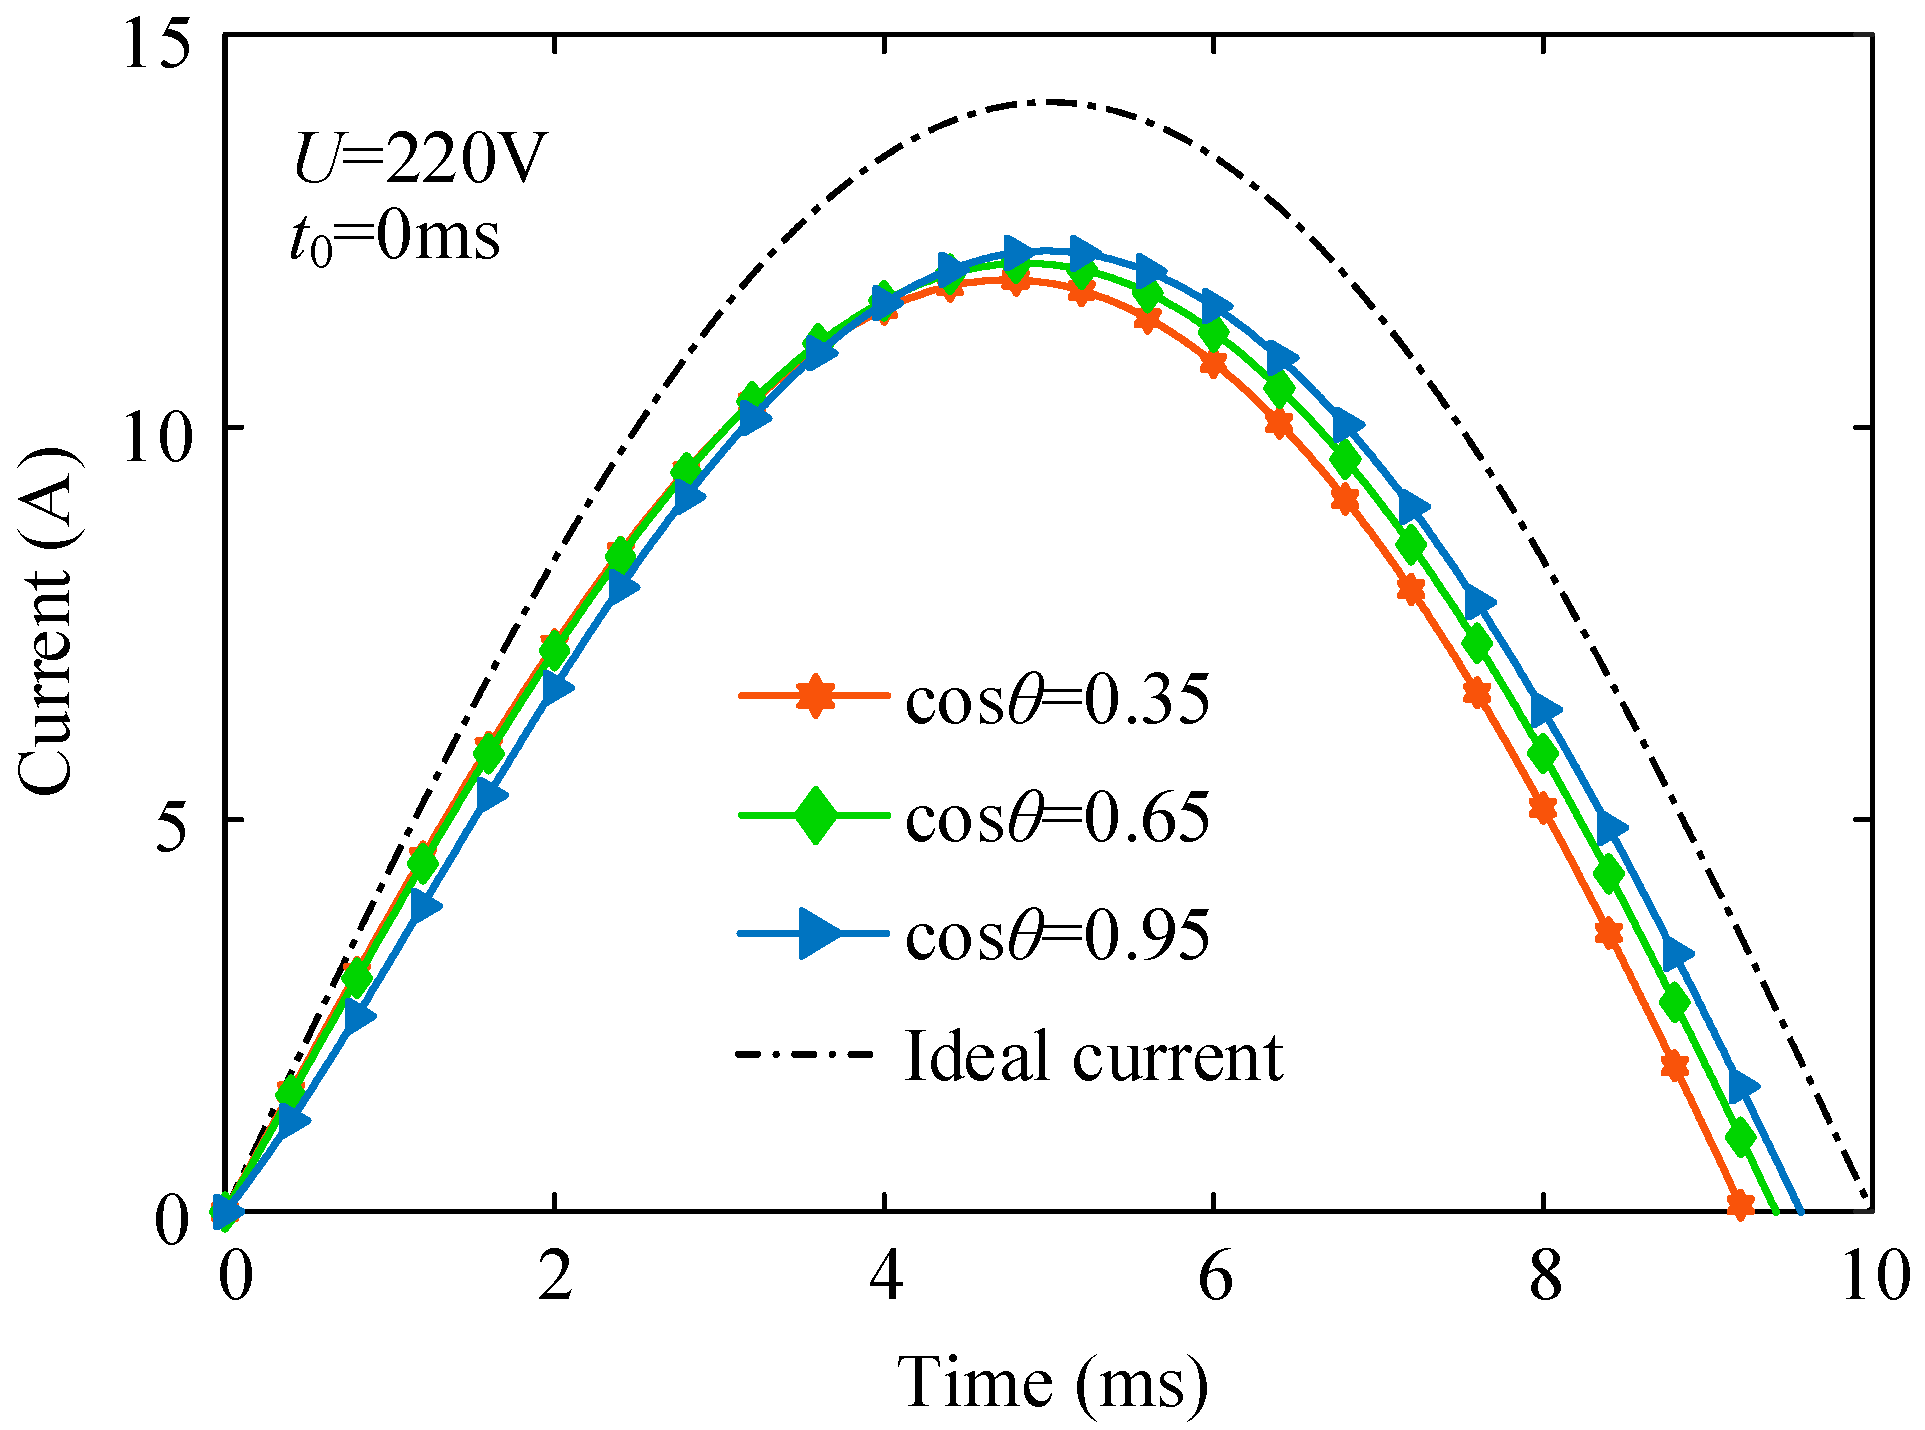
3.3. Arc Current Waveform under Different Power Factors
For investigating the effect of power factors on arc current, this paper selects three power factors of 0.35, 0.65, and 0.95 to examine the variation law of arc current. Taking the AST
t0 = 0 ms and the supply voltage as 220 V as an example, the arc current waveform under different power factors is obtained, as shown in
Figure 6.
As shown in
Figure 6, the power factor is different, and the arc current waveform is different. The higher the power factor, the longer the arcing time. However, unlike the effect of the supply voltage on the arc current amplitude, the arc current amplitude decreases with the increasing power factor before
t0 = 4 ms. After 4 ms, the arc current amplitude increases as the power factor increases. As a result, the changing trend of the CEA is not entirely consistent with the trend of the power factor, and the impact of the power factor on the CEA must be considered comprehensively in conjunction with the AST.
4. Arc Erosion Model of the LVCB Considering Arc Voltage
The arc erosion model of the LVCB characterizes the corresponding relationship between erosion quality and arc current [
6,
12]. By establishing an arc erosion model, the electrical life of the LVCB can be simulated effectively. While saving costs, it can also significantly improve work efficiency. The CEA considering arc voltage under a single contact operation is obtained through the arc current integration during the arcing time, as shown in Equation (9):
where Δ
t is the arcing time. The function
f(
ie) can be represented by |
ie| or
ie2. The contact erosion of each operation is calculated by Equation (9). Then, the remaining electrical life of the switching apparatus can be obtained according to the appropriate threshold setting to achieve the purpose of evaluating the electrical life. Considering the present research results, if the breaking current level is not high (<1 kA),
ie2t can be selected as a characterization equation of arc erosion.
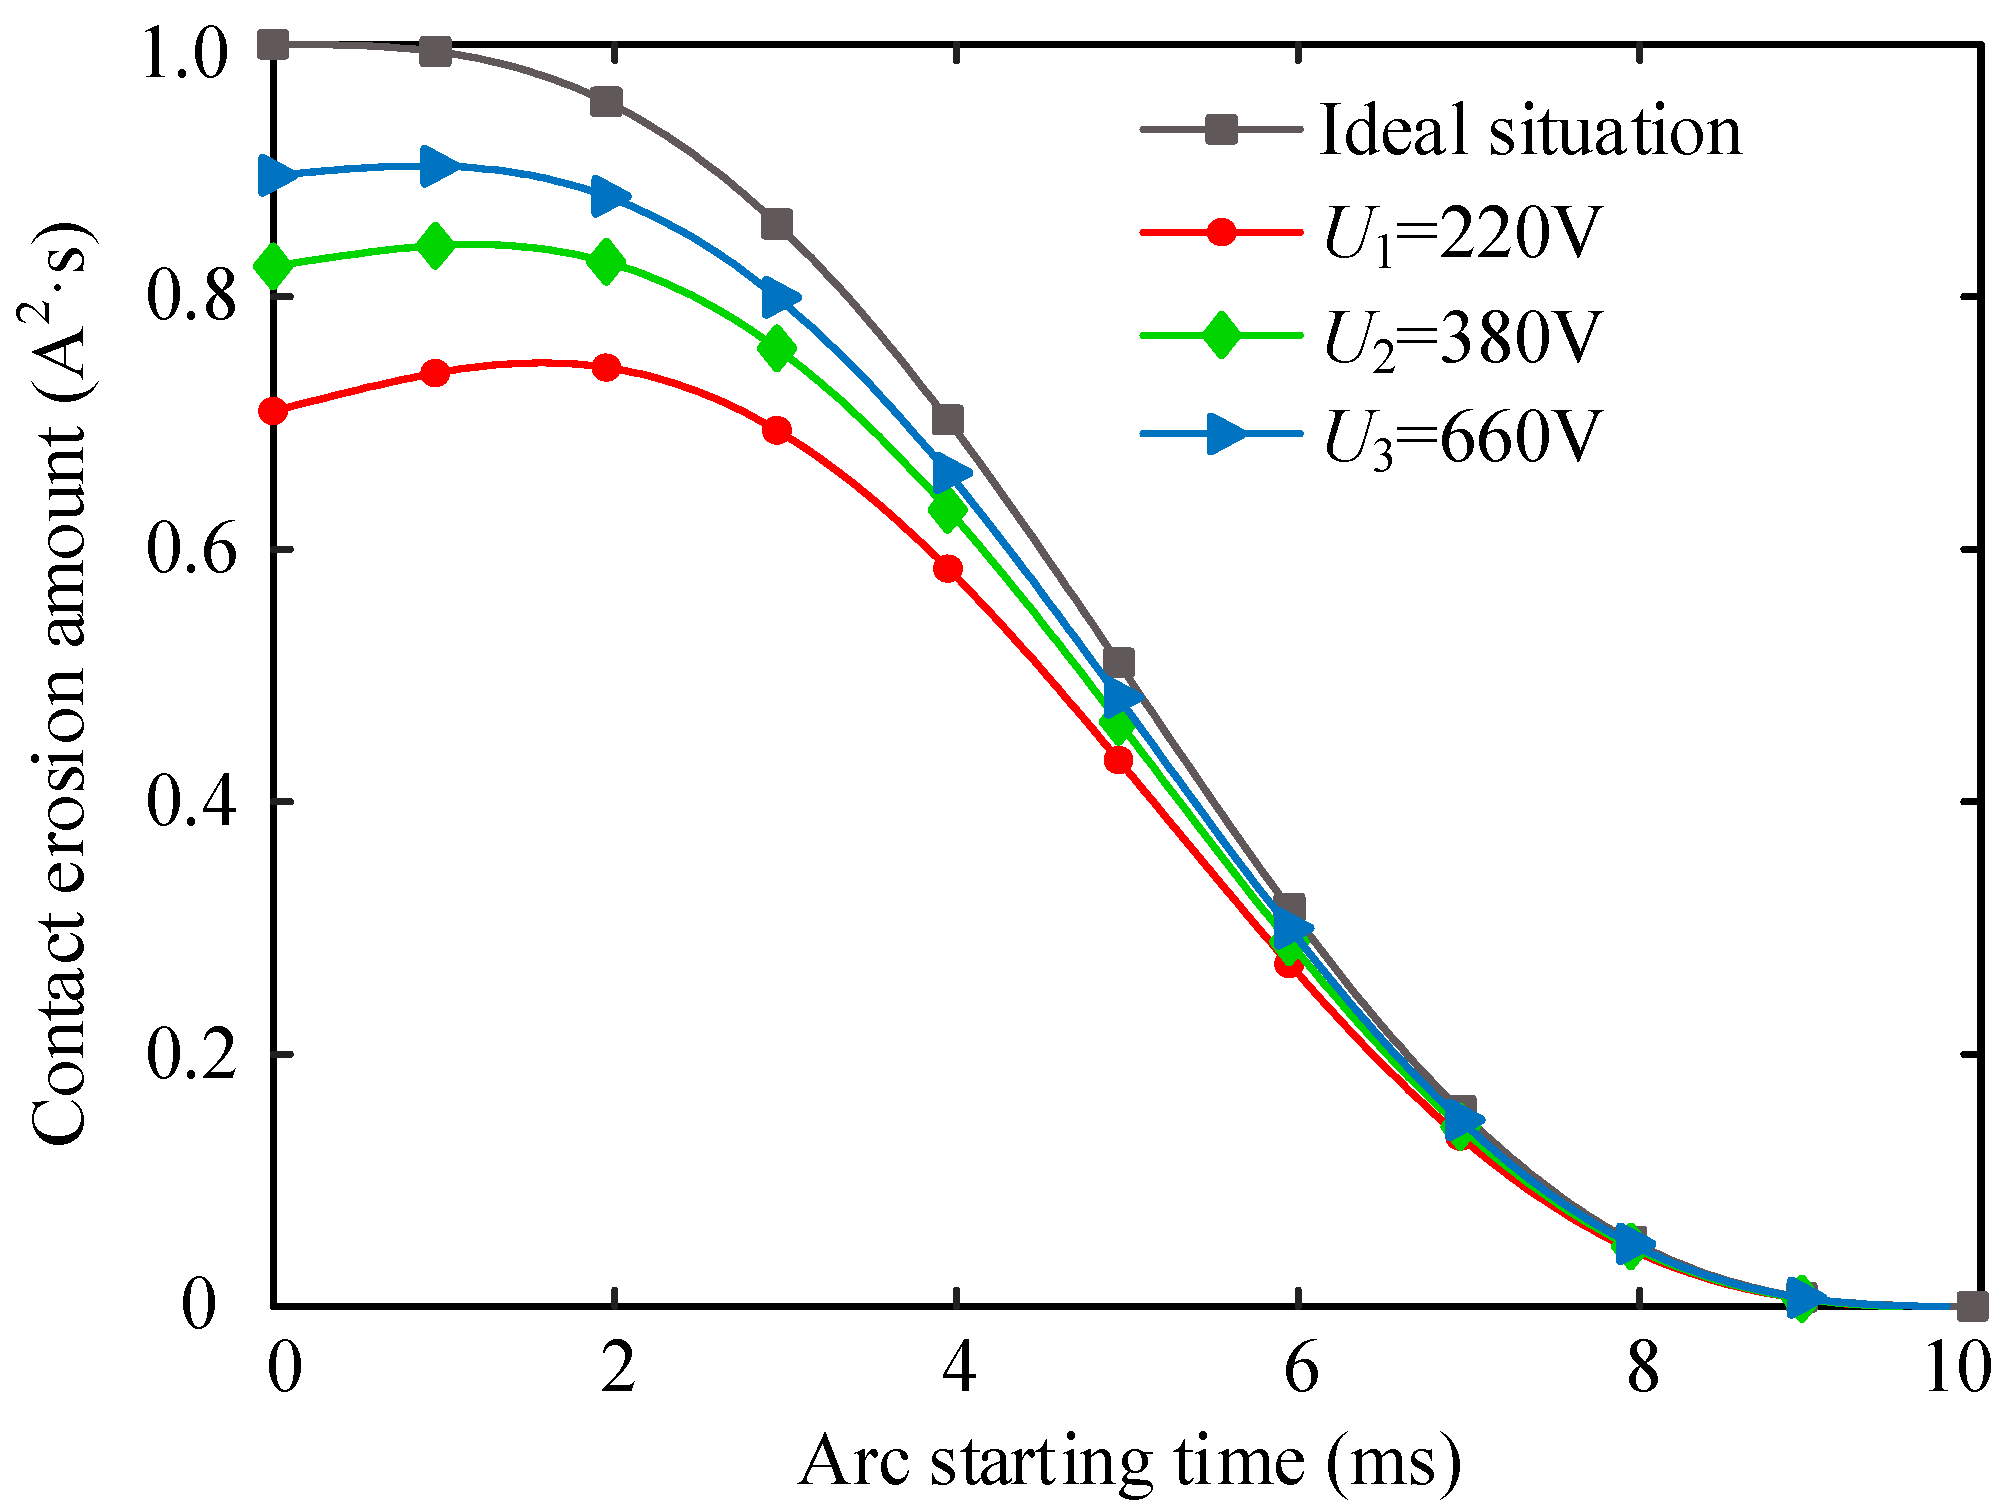
4.1. Variation of CEA with Supply Voltage
The study of the change law of CEA with the AST can further analyze the characteristics of supply voltage effect on the electrical life of the LVCB. The CEA curve under different supply voltages is analyzed by Equation (9). The power factor is fixed at 0.65. The CEA curve is shown in
Figure 7.
The black curve in
Figure 7 is the change rule of the CEA when the arc voltage is not considered (referred to as the erosion curve in the ideal situation). With the increasing AST, the CEA gradually decreases. The other three curves are the change waveforms of the arc erosion amount after considering the arc voltage. The greater the supply voltage, the closer the CEA change curve is to the ideal situation. In addition, the CEA curve does not always show a decreasing trend but increases first and then decreases, which brings a new explanation to the traditional contact erosion law (the longer the arcing time is, the greater the CEA of the LVCB). This phenomenon is because the maximum current decreases while arcing time increases in the
t0 range of 0–2 ms.
As a result, two conclusions may be taken just from the standpoint of the impact of the supply voltage on electrical life. One is that the electrical life test of the low-voltage switching apparatus is carried out before leaving the factory, and the electrical erosion of the contacts is smaller than that obtained by i2 integration under ideal conditions. The electrical life is significantly longer than the theoretical calculation. Second, the higher the supply voltage in actual running, the greater the CEA of the LVCB. It is also true that the electrical life of the LVCB is shorter with a high supply voltage than a low one, despite the same breaking current level.
In addition, by observing the change curve of the CEA, it can be found that when the supply voltage is low, the maximum CEA is around 2 ms. Consequently, it can be concluded that if the AST is approximately 2 ms, the electrical life is reduced accordingly. This finding should be considered while researching the link between AST distribution and the electrical life and when constructing the breaking control signal of the intelligent circuit breaker.
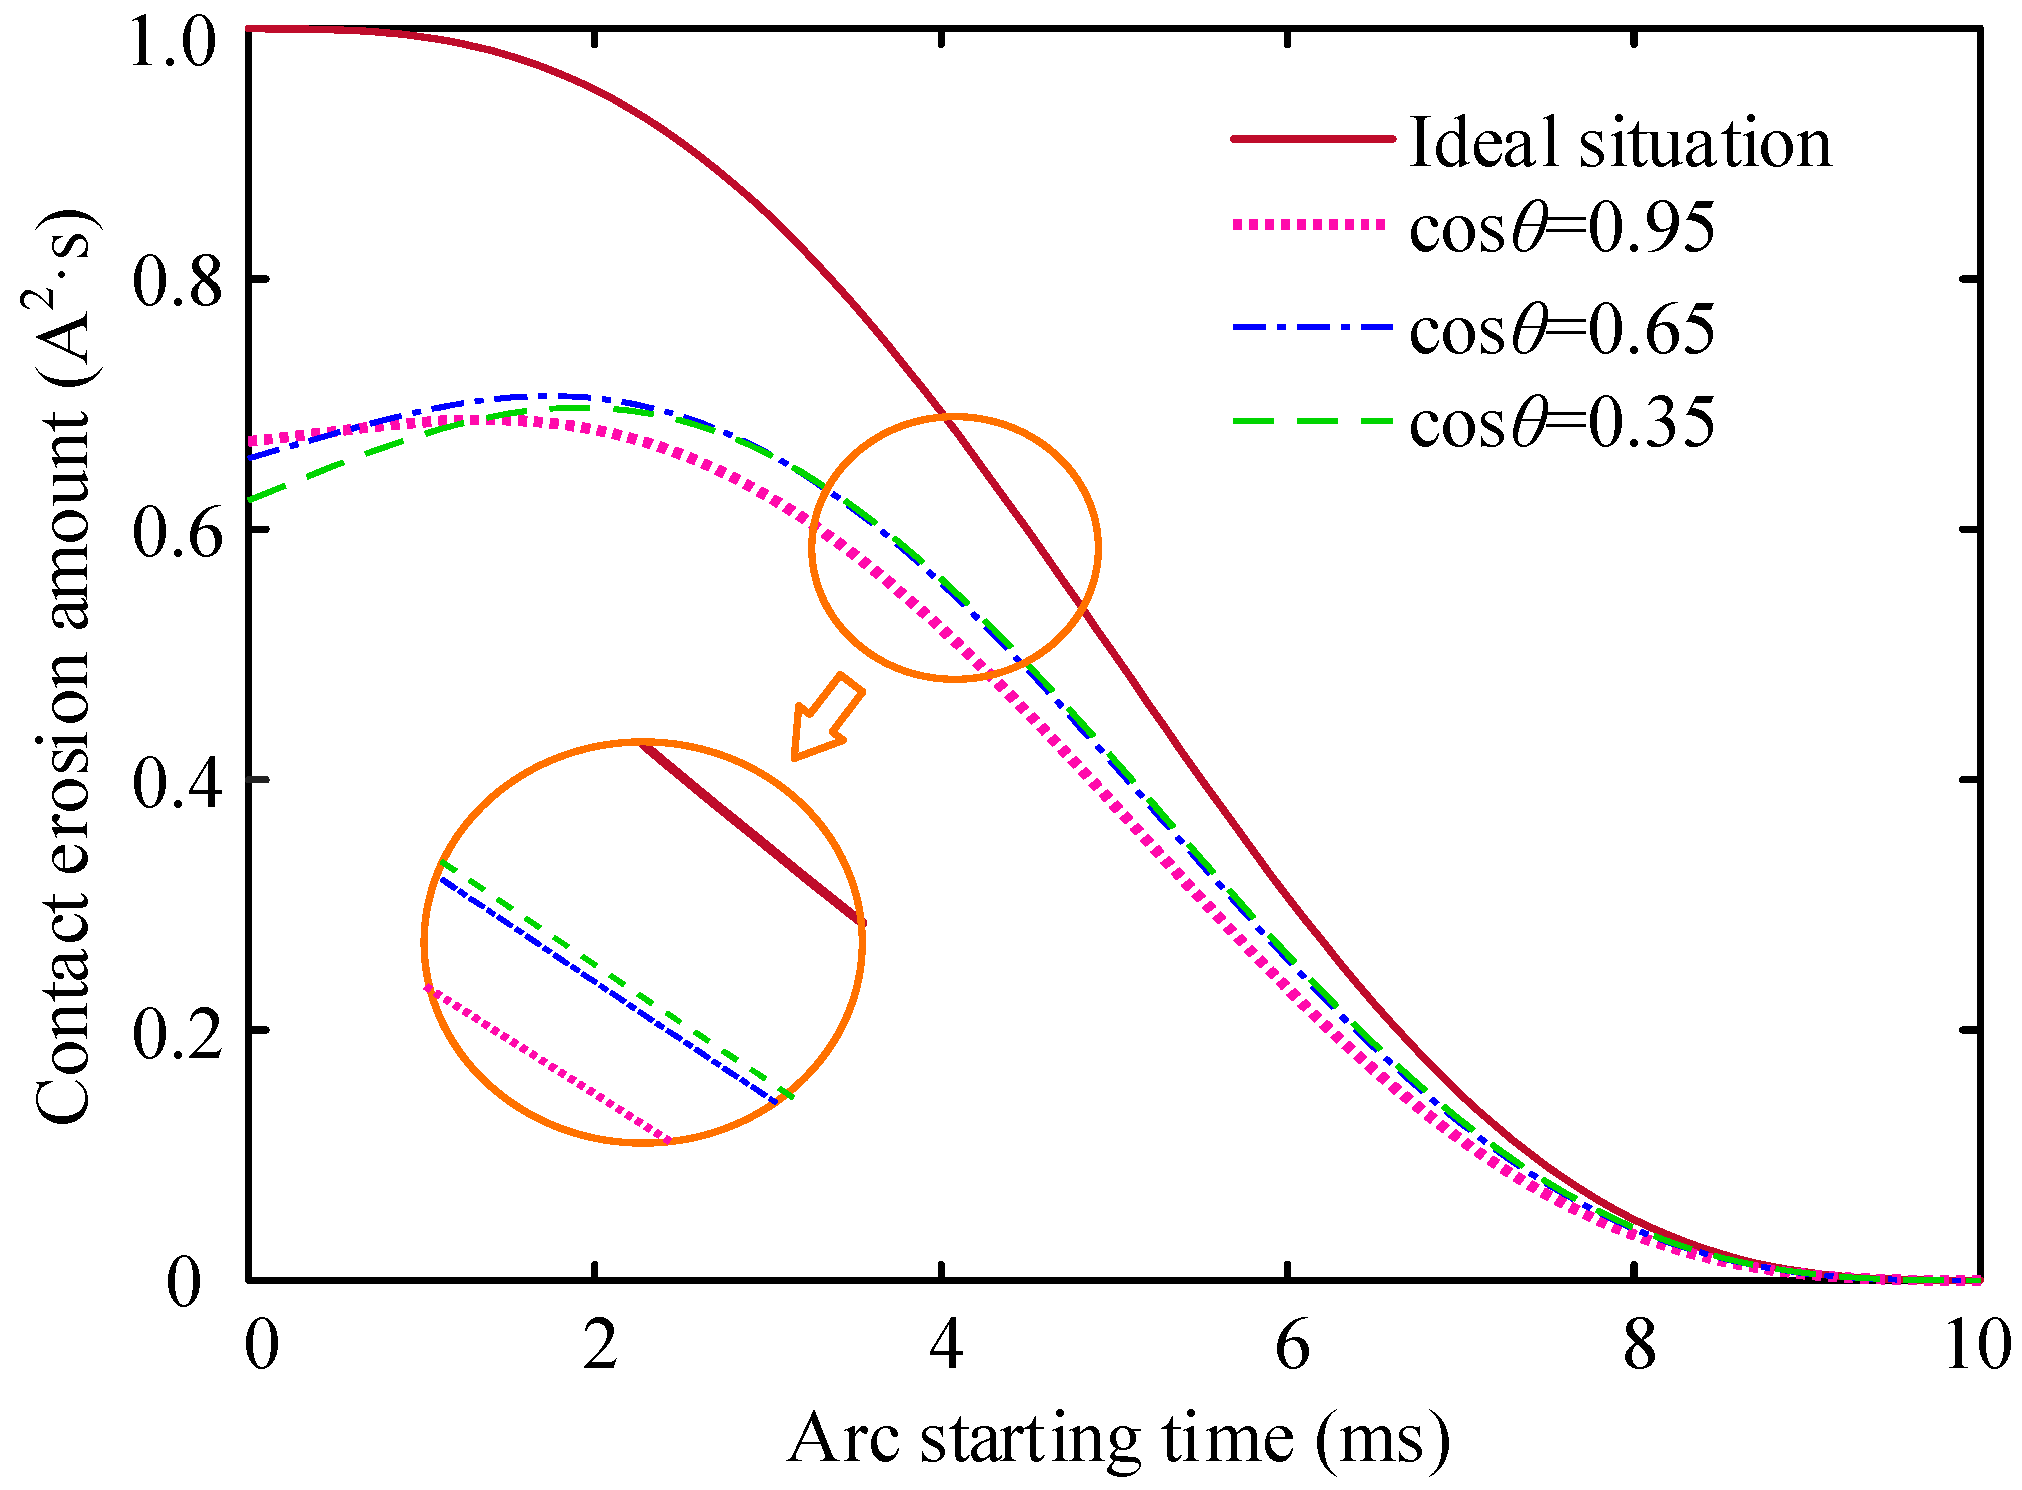
4.2. Variation of CEA with Power Factor
By Equation (9), the CEA curve in a single operation with the AST for various power factors is obtained, as shown in
Figure 8. The CEA change curves under different power factors show the crossing phenomenon, and the intersections of the three curves are different. After
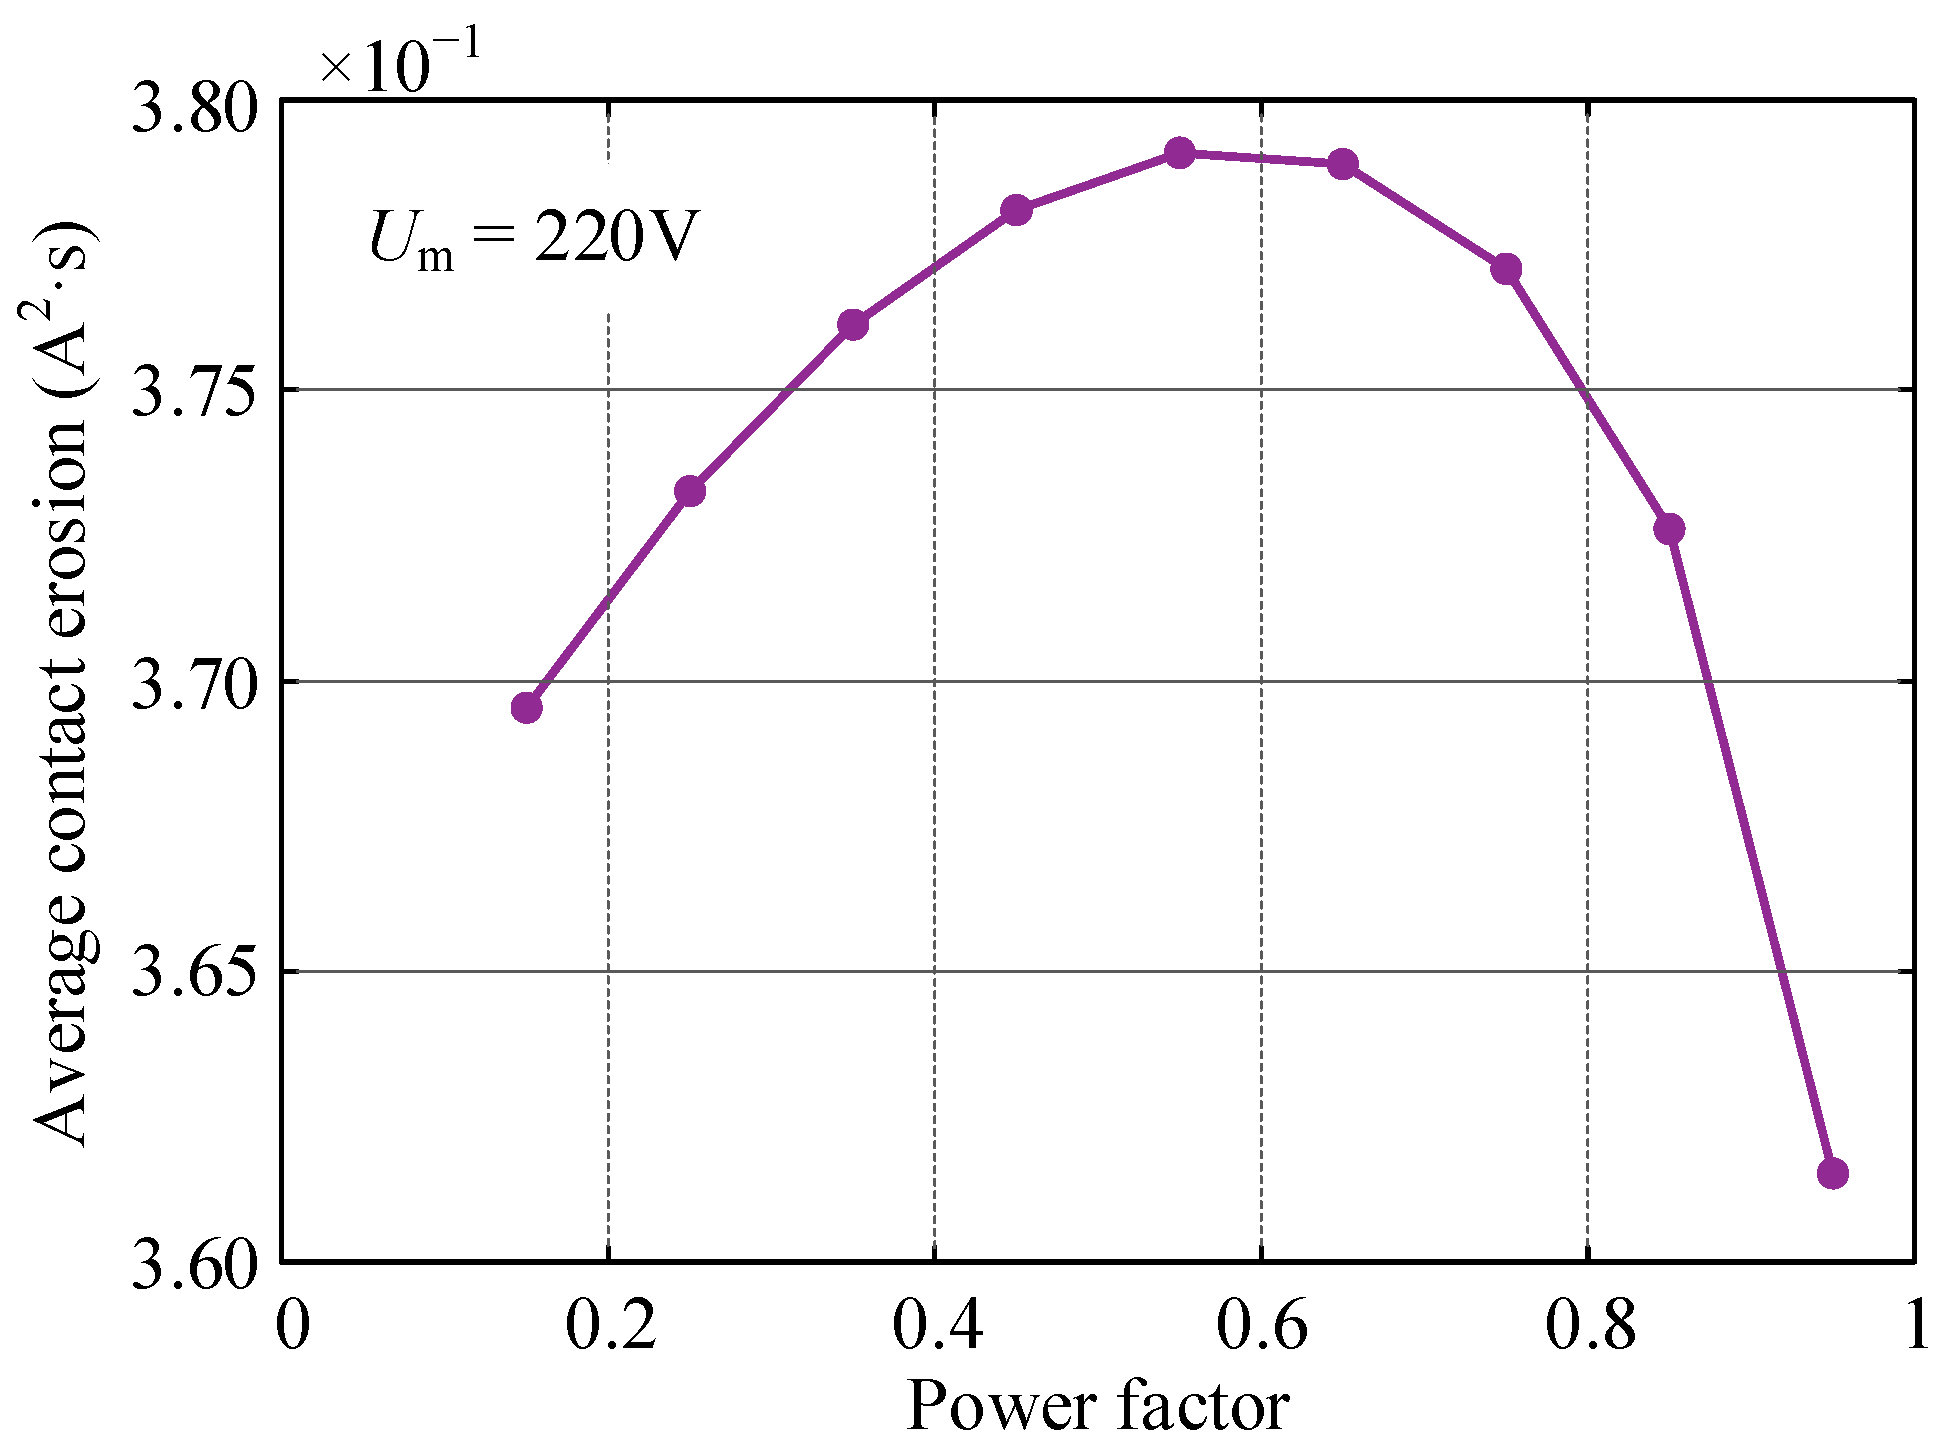
t0 = 3 ms, the CEA and the power factors have the same change trend. To further analyze the effect of the power factor, this paper integrates the CEA curve in the range of [0, T/2) and takes the average CEA. It takes the average value to calculate the CEA under different power factors. The curve of the average CEA is shown in
Figure 9.
Figure 9 shows that the average CEA does not increase or decrease linearly with the increasing power factor. The change curve is arched, and the maximum value is around 0.6. It shows that for the switching apparatus whose AST is randomly distributed, the CEA of the LVCB is the largest at this time, which also explains the difference in the electrical life of the LVCB under different loads.
6. Experimental Validation
An LVCB electrical life test is designed to verify the effectiveness of this method. The switch model is DZ47-63, the rated voltage is 415 V, and the test current is 10 A. The selected parameter combination is (220 V, 0.35/0.65/0.95), (380 V, 0.65).
Figure 12 illustrates the electrical life test device, and the collected voltage and current waveforms are shown in
Figure 13.
According to the sampling points of the arc current, the CEA at different ASTs is calculated and compared with the change curve of the CEA obtained by simulation, as shown in
Figure 14. The supply voltage is set to 220 V, and the power factor is 0.65.
Figure 14 shows that after considering the arc voltage, the change curve of the CEA is closer to the actual value.
Because there is a particular deviation in the electrical life of different LVCB samples, this paper uses the concept of relative remaining life to compare the similarities and differences between the life changes obtained by testing and simulation under different parameters. For the LVCB with evenly distributed ASTs, the relative remaining life equation is as follows:
When the life of the LVCB ends, N = Q/q*. For the LVCB with the same threshold, q* is inversely proportional to Q.
In this paper, four sets of parameter combinations are selected for testing. The CEA threshold is 5000 (A
2·s) according to
Section 5.1. After calculation, the electrical life of the LVCB under different parameter combinations is shown in
Table 2.
Due to the existence of line resistance and inductance during actual operation, the current-limiting impact of the LVCB is greater than the theoretical analysis value. The actual electrical life in
Table 2 is slightly longer than the simulation life. However, the change law of electrical life between the two cases is similar, indicating that simulations can be used to evaluate life under different operation conditions in the future.


