Article

Reservoir Pore Characteristics Based on Depositional Microfacies Control in the Neogene Guantao Formation, Bohai Bay Basin, China

School of Geoscience and Technology, Southwest Petroleum University, Chengdu 610500, China
*
Author to whom correspondence should be addressed.
Energies 2022, 15(8), 2870; https://doi.org/10.3390/en15082870
Submission received: 1 March 2022 / Revised: 11 April 2022 / Accepted: 12 April 2022 / Published: 14 April 2022

Abstract

:
The Neogene Guantao Formation Reservoir in the PLOilfield is a unconsolidated sandstone with high porosity and high permeability. The reservoir diagenesis is weak and dominated by compaction diagenesis. At present, insufficient research into the relationship between the pore characteristics and sedimentary microfacies of shallow delta sandstone reservoirs restricts the prediction of favorable reservoir distribution. This article takes the unconsolidated sandstone reservoir of the Guantao Formation as the research object and analyzes the potential coupling relationship between pore characteristics and sedimentary microfacies. In this study, seven typical sedimentary microfacies were identified and the microscopic characteristics of different sedimentary microfacies reservoirs are described. The results show that the pore structure of various sedimentary microfacies is comprehensively influenced by the sedimentary rock texture, siliceous minerals, and clay mineral distribution. Characterized by more abundant hard quartz and feldspar minerals, positive skewness, and lower pore sorting coefficients, the arenaceous microfacies possess larger pore throat radius and lower pore fractal dimensions than argillaceous microfacies. Finally, due to the difficulty of coring in offshore oilfields and the lack of data on mercury injection experiments, empirical formulas for the porosity, permeability, and pore throat radius of conventional core tests were established, and the pore radius that corresponded to 35% mercury saturation (r35) was used as the characteristic pore structure parameter. The grey correlation method was used to analyze the influence of sedimentary structure factors and mineral content differences on r35 and to determine the main controlling factors.

1. Introduction

According to the oilfield development experience, microscopic pore structure controls the reservoir capacity and seepage characteristics and ultimately exerts a profound influence on oilfield recovery factors [1,2]. Pore structure is a comprehensive reflection of pore throat size, shape, and connectivity [3]. As a result of the non-homogeneity of pore structure, significant problems have arisen during the development process such as the high injection pressure, rapid rise in water content, and high start-up pressure [4].
The processes of deposition and diagenesis occurring together can potentially cause the complex processes of diverse pore types, complex pore structures, and non-homogeneity in the reservoirs to occur simultaneously [5,6]. Sedimentation has an obvious effect on clastic rock mineral’s composition, structure, sorting, rounding, and miscellaneous base content, which, in turn, exerts a profound influence on its porosity and permeability [7,8,9]. The increase in burial depth will make the microscopic pore structure more complex [10,11]. Dissolution can increase the secondary porosity of the reservoir and has positive effects on reservoir quality whilst cementation and compaction have negative effects [12].
The PL Oilfield is one of the largest offshore oil fields discovered in China to date [13] and its main oil-bearing zone, the Neogene Guantao Formation, is a highly porous and highly permeable unconsolidated sandstone characterized by weak diagenesis and is dominated mainly by compaction, and the reservoir pore structure is controlled by deposition. The change in depositional environment has a pivotal and direct role in the control of clastic reservoir properties [7]. The long oil-bearing zone of the PL Oilfield, the longitudinal evolution of the depositional mechanism, the lateral changes in the sedimentary microfacies, and hydrodynamic factors have led to large differences in reservoir pore structure both within and between layers, resulting in many problems in the development process such as quickly decreasing fluid production and quickly decreasing water absorption capacity. In recent years, extensive research has been undertaken in relation to the target layer of this study, the majority of which have focused on the sedimentary evolution, oil gas reservoir-forming conditions, and provenance systems, however, the coupling between sedimentary microfacies and pore structure was found to be relatively insignificant.
Reservoir rock pore structure parameters are crucial indicators for reservoir evaluation, and how to objectively determine these parameters is a problem that many petrologists have long been trying to solve. At present, the commonly used research methods include μ-CT [14,15,16], high-pressure mercury injection (HPMI) [17,18,19,20], scanning electron microscopy (SEM), nuclear magnetic resonance (NMR) [21,22], logging methods, etc. These methods, which characterize the pore structure, have their advantages, but HPMI is the most appropriate experimental method based on the reservoir characteristics in this study area [23].
The difficulties of coring in offshore fields make it impossible to test the reservoir sections of all wells with mercury injection data. In recent decades, geophysicists have established a series of empirical equations to determine easily accessible physical property parameters and pore throat radius with the objective to replace mercury intrusion experiments with other easier and safer methods.
Winland (1972) [24] chose a pore throat radius at 35% mercury saturation to divide the cutoff value for net production from clastic reservoirs because the best correlation is obtained at this point.
logr 35 = 0.732 + 0.588 logK air 0.864 log core
where r 35 is the pore throat radius at 35% mercury saturation; core is the core porosity; and K air is the core permeability measured using air flow.
The R35 has been applied in many oil fields after being proposed by Winland (1972) [24]. However, studies in different oil fields have shown that the correlation between porosity, permeability, and pore throat radius is inconsistent with Winland’s conclusion. Pittman (1992) [18] gave empirical equations to calculate pore throat radius for mercury injection saturations from 10% to 75%, and identified the best correlation at the mercury injection saturation as 25%.
logK air = 1.221 + 1.415 core + 1.512 logr 25
Spearing et al. (2001) [25] considered this value to be 45% using core analysis. Nabawy (2009) [26] suggested that it is more reliable to establish the equation when mercury saturation is at 30%.
logr 30 = 0.529 logK air + 2.758 log core 4.918
In summary, this paper combines the sedimentary microfacies and their mineral compositions, obtained by core description, XRD mineral analysis, and logging interpretation, with the pore structure characteristics obtained by HPMI, casting thin sections and SEM, focusing on the following aspects: (1) studying sedimentary systems and identifying sedimentary microfacies; (2) finding the difference in the pore structures of different sedimentary microfacies including the pore throat type, pore size distribution, and fractal dimension representing the pore structure complexity; (3) establishing pore throat radius matching relationships for porosity and permeability and then achieving a quantitative characterization of the pore throat radius in non-cored well areas; and (4) conducting a grey correlation analysis based on the similarity between the geometric shapes of the sequence curves to judge whether the relationship is close and the calculation amount is small, and if there is no requirement for the number of samples, applying the grey correlation theory to quantitatively investigate the major control elements affecting the pore structure. This paper studied the coupling relationship between the shallow-water braided river delta sedimentary system and the pore structure to fill the gaps in this type of sedimentary system and proposed comprehensive pore structure parameters that are suitable for unconsolidated sandstone reservoirs, providing a reference for the characterization of pore structure in this kind of oilfield, which is lacking a core.

2. Geological Background

The Bohai Bay Basin is a typical Cenozoic continental petroliferous basin in eastern China, with a total area of 20 × 104 km2 (Figure 1A) [27,28]. The PL structure is a faulted anticline structure, which developed at the base of the Bonan Uplift (Figure 1C). Two strike-slip faults parallel to the structural strike developed in the PL Oilfield. The strike-slip faults and their near-northeast-trending derivative normal faults cut the PL anticline into fault blocks of horsts and grabens. The high part of the central structure between the two strike-slip faults is the main production area of the PL Oilfield. Several previous studies have used heavy minerals, paleomorphology, and the ZTR index in the PL Oilfield to conclude that the provenance of the Guantao Formation was mainly the Jiaoliao Uplift and Liaodong Uplift. The sedimentary environment of the Neogene Guantao reservoir is shallow braided river delta [29].
The reservoir rocks of the PL Oilfield are the Neogene Guantao (Ng) and Lower Member of Minghuazhen (Nm) formations of sandstone with a shallow burial depth (from −745 m to −1540 m). This oil field is divided into 13 oil-bearing groups and 47 small layers (Figure 1B). The oil-bearing interval of the lower Minghuazhen formation is divided into five oil groups (L00~L40 oil groups), the upper Guantao formation is divided into three oil groups (L50~L70 oil groups), and the lower Guantao formation is divided into five oil groups (L80~L120 oil groups) (Figure 1B). Oil and gas distribution is controlled by the distribution characteristics of sand bodies and can be classified as a typical lithologic-structural reservoir (Figure 2).
The results of these rock core experiments indicate that the average permeability is 1321 mD and average porosity is 27%. The reservoir lithology is medium-fine-grained feldspar sandstone with loose particle cementation and poor sorting. The grain size is mainly distributed between 1 mm and 0.05 mm and the roundness ranged from angular to suborbicular. The content of silt and mud in the reservoir is 5.9~42.5%, with an average of 25.2%. The content of small particles is relatively high, and the reservoir is prone to particle migration.

3. Materials and Methods

Core data were obtained from four sealed coring wells and the sedimentary units were identified and described by the naked eye, hand microscopes, and binocular microscopes, and the sedimentary structure. Sediment color and grain size characteristics were fully examined. Combined with logging curves (AC, GR, SP, etc.), the logging model of sedimentary microfacies was established to analyze the vertical and planar distribution characteristics of sedimentary microfacies (Table 1). The X-ray diffraction method and the mineral clay quantitative analysis method were used to study the mineral composition of 81 samples from seven wells. The casting thin section method analyzed the minerals, diagenesis, and pore throats of 188 samples from 14 wells. A total of 129 samples from 13 wells were selected for SEM analysis. Characterizing the particle size, sorting, and skewness of sample particles using a laser particle size analyzer (LPSA) showed the depositional environment and the lithological features of the sediments from 234 samples of 18 wells.
High-pressure mercury reservoirs (HPMI) were tested with an Auto Pore IV9500 mercury porosimeter and the measurement conditions were as follows: the measurement of the pore diameter was from 0.003 to 950 μm and had a maximum pressure of 6000 psi. A total of 41 samples were completed, and the mercury saturation of the samples under different capillary pressures was obtained. The pore throat radius can be obtained by using the Washbrun equation as follows [31]:
r = 2 α cos θ P
where P is the capillary pressure (MPa); r is the pore radius (μm); α is the surface tension (mN/m); and θ is the contact angle (°) [31,32,33].
Fractal dimension is a parameter that characterizes the degree of self-similarity of objects with fractal characteristics, which can be applied to reveal the heterogeneity of the pore throat structure [34]. The fractal dimension can be calculated using Equation (5) [35,36]. If the pore structure in the rock sample satisfies the fractal characteristics, the connection between mercury saturation and capillary pressure should satisfy a power function, which is a straight line under double logarithmic coordinates. The slope of the straight line represents the fractal dimension of the rock sample [37].
lg ( 1 S H g ) = ( D f 3 ) lg P c + 3 D f lg P m i n
where Pc is the capillary pressure corresponding to the pore throat radius (r) (MPa); Pmin is the capillary pressure to the maximum pore throat radius (rmax) (MPa); SHg is the accumulative mercury saturation (%), and its slope can be used to calculate the fractal dimension using Equation (6) [38]:
D f = S + 3
The fractal dimension D f is the slope S of lg 1 S H g lg P c plots. The range of fractal dimension is 2~3. The closer the Df is to 3, the greater the tortuosity of the pore structure.

4. Results

4.1. Sedimentary Facies

4.1.1. Sedimentary Facies Signs

1.
Mudstone color
The authigenic color of depositional rocks can directly determine the climatic conditions, the water medium conditions, and the quality of source rocks. In particular, the color of mudstone plays a pivotal role in distinguishing the sedimentary environment. According to the observation of the naked eye, hand mirrors, and binocular microscopes, the mudstone color of the Guantao Formation reservoir in the PL Oilfield is mainly gray (Figure 3A), light gray (Figure 3B), gray-green (Figure 3C), brown-red variegated (Figure 3D), and red (Figure 3E), indicating that the depositional environment changes from shallow water exposed to the environment. On the plain, the adjacent well sections change rapidly, indicating that the depositional environment also changes rapidly. According to the change in color characteristics, it can be seen that the depositional environment of the PL Oilfield undergoes a transition from a weak reduction to an oxidation environment, from the bottom to the top.
2.
Rock type
By analyzing the identification results of thin rock sections from seven wells, the sandstone composition data of different interest intervals were drawn into the sandstone composition triangle (Figure 4). The triangle chart shows that the sandstone composition of the lower Guantao Formation and upper Guantao Formation is mainly Lithic arkose sandstone and feldspathic litharenite, indicating that the rock composition maturity is medium. From the lower Guantao Formation to the upper Guantao Formation, the types of rocks are gradually concentrated and the range of lithology changes is gradually reduced, indicating that the provenance and depositional environment tend to be stable. In addition, the low-maturity rock types gradually decreased, indicating that the provenance tended to concentrate on the distant provenance.
3.
Grain size characteristics
The grain size distribution of sediments is mainly affected by hydrodynamic changes. Therefore, grain size analysis reflects the original sedimentary conditions and the strength of the hydrodynamic conditions [5]. The grain size probability curve shows that the reservoir is mainly composed of three sections, reflecting rolling, jumping, and suspension transport modes, of which jumping is the key component (Figure 5A–D). As shown in the C–M figures (Figure 5E,F), the tractive flow deposition features are prominent, indicating fluvial deposition characteristics. In summary, the lithology of the main oil-bearing intervals in the study area gradually becomes thinner from the bottom to top, the sorting becomes better, and the maturity increases, which reflects the depositional process of hydrodynamic conditions from strong to weak, and the depositional environment tends to be more stable.
4.
Sedimentary structure and texture
The sedimentary structure reflects the deposition rate, hydrodynamic strength, and depositional medium so the sedimentary structure can be used to determine the environment when the rock was formed, and then the further divide in the depositional environment. On the basis of core observation, there are sedimentary structures such as granular sequence bedding (Figure 6A), parallel bedding (Figure 6B), plate cross bedding (Figure 6C), trough cross bedding (Figure 6D), corrugated cross bedding (Figure 6E), and a scoured surface (Figure 6F), which demonstrate that the hydrodynamic strength changes greatly.
5.
Paleontological features
Paleontological analysis confirmed the presence of Bohaidina, Para-bohaidina, Filisphaeridium, Sentusidinium, Granodiscus, and Leio-spaeridia (Figure 7), representing shallow lacustrine facies in the green mudstone of the Guantao Formation, and the fossils of lacustrine assemblage such as Pseudocandona and Sinocytheridea impressa indicate that the oilfield changed from a fluvial environment to a shallow lacustrine environment [29].

4.1.2. Sedimentary Microfacies

By analyzing the core data, well logging facies and previously completed research, we established the opinion that the Guantao Formation is a shallow-water braided delta deposit. The following seven key depositional microfacies were identified: distributary bars (DBs), braided channels (BCs), mouth bars (MBs), flood plains (FPs), distributary channels (DCs), sheet sands (SSs), and interdistributary bays (IBs) (Table 1).
1.
Braided channels (BCs)
BC is a common type of microfacies in delta plain deposits, deposited in the area between DB. BC sand bodies are mainly gray, off-white medium-fine-grained feldspar sandstone (Figure 8A). BCs mainly developed through cross-bedding, followed by plate cross-bedding (Figure 8B). This description indicates that the channel scour was strong and frequent during the sedimentary period. The BC sedimentary sequence has classic normal sequence characteristics. The GR curve is in the form of a serrated bell-shaped, small cylinder, or bell–cylinder combination, and the sand body has a wide distribution range (Figure 9A).
2.
Distributary bars (DBs)
The DB is located between BCs. Vertically, the grain size has the characteristics of normal sequence or compound rhythm, the bedding scale gradually decreases and the lithology gradually becomes finer, following gravel-bearing coarse sandstone (Figure 8C). The plate cross-bedding (Figure 8D) is the most common in the DBs and indicates that the Guantao Formation had a strong hydrodynamic force and strong river scouring during the deposition period. The DBs generally have the characteristics of box-shaped SP and GR logging curves with large thickness and good plain continuity (Figure 9B).
3.
Flood plains (FPs)
FPs mainly refer to the floodplain between the rivers. These are formed by the river overflowing from the river channel during the flood period. Therefore, their sedimentation is the same as the river’s sedimentation source, but more granular. They are mainly composed of suspended sediment in rivers and some silty sandstones. After the river sediments are accumulated, the river water recedes, and the sediments will be exposed. FPs are formed by the river channels bursting in different periods, so they have the characteristics of multiple layers. The characteristics of different layers may be quite similar or may be different (Figure 9B).
4.
Distributary channels (DCs)
The lithology of the distributary channel sand body is mainly brown pebbly sandstone (Figure 8E), medium sandstone, and fine sandstone. Cross bedding (Figure 8F) and wavy bedding are common in sedimentary structures with an eroded basement surface containing mud and gravel at the bottom (Figure 8G,H). The GR curves are in the form of mid-to-high amplitude, and are slightly dentate bell-shaped or box-shaped. There is a positive rhythm in the vertical direction and the grain size becomes finer in the upward direction, reflecting the lateral movement of the channel (Figure 9C).
5.
Interdistributary bays (IBs)
The IBs are low-lying bay areas between distributary channels. These are the separation zones or receding zones between different distributary channels, similar to the FPs. The IBs are mainly deposited with gray-green and light gray mudstones, intercalated with thin layers of siltstone. They sometimes develop small-scale sand beddings. SP and GR curves are linear and slightly serrated with low amplitude (Figure 9D).
6.
Mouth bars (MBs)
Due to the rapid advancement of shallow water deltas and the gentle slope in the basement, the estuary dams and remote sand dams deposited in the early stage are easily washed and thinned by the later diversion channels or even, in some circumstances, disappear altogether. The mouth bar and far sand bar deposited in the early stage are easily scoured and thinned by the later diversion channels or even, in some circumstances, disappear altogether. Therefore, the MB sand body in the PL Oilfield is less developed, and the thickness is generally very thin. The lithological gray-black fine sandstone (Figure 8I) and siltstone are developed in the main. There is an obvious anti-rhythm in the sedimentary sequence, low-energy bedding is developed, and the thickness is thin. The GR curve is funnel-shaped, with obvious anti-rhythm features (Figure 9E).
7.
Sheet sands (SSs)
The SSs are mainly thin layers of gray or gray-black silt sandstones, which are often interbedded with argillaceous and vertical sediments. Parallel bedding, wavy bedding, and convolution bedding are more common, and the GR curves have features such as tines and finger features (Figure 9F).

4.1.3. Sand Body Characteristics and Evolution Analysis

The thickness of the target layer does not change much and the overall thickness is characterized by being thin in the west and thick in the east. In the vertical direction, multiple sets of shallow braided river delta sedimentary sand bodies are superimposed, BC sand bodies, and DB bodies in the upper Guantao Formation are relatively developed, and a high number of BC sand bodies in the lower Guantao Formation are developed. Reservoir sand bodies have a variety of superimposed styles, mainly of independent, multilateral, and cut superimposed types.
1.
Lower Guantao Formation
The L100 oil group in the lower Guantao Formation is in the low capacity space background, forming shallow-water braided river delta upper plain deposits. When the base level rises, sediments accumulate; when the base level drops, erosion and scouring occur. During the deposition period of the L80–L90 oil group in the lower Guantao Formation, the capacity space was close to the sediment supply and the shallow braided river delta deposits were in a transitional environment, where water and land frequently interacted. This period was dominated by the transitional environmental deposits of the delta plain and the delta front. The sedimentary structure is dominated by small-scale cross-bedding and corrugated cross-bedding, reflecting weak hydrodynamic energy. Braided channel sedimentary structures have major cross-bedding, indicating frequent hydrodynamic changes (Figure 10).
2.
Upper Guantao Formation
The lower L60 and L70 oil groups in the upper Guantao Formation formed shallow braided river delta deposits dominated by narrow channels, against the background of high-capacity space. The deposition period from the upper part of the L60 oil group to the L50 oil group is the shallow braided river delta upper plain deposited under the background of low-capacity space, mainly including distributary bars, braided channels, flood plains, and other microfacies. The sorting and roundness of the rock are both medium–poor grade, the proportion of unstable cuttings is high, and the structure and composition maturity are generally low. From the bottom and upward, the sand bodies have the characteristics of strips, thin strips, and continuous flakes. The sand layer is mainly composed of multi-stage sand bodies that overlap with each other, and there are obvious scouring surfaces between different channels. The later channel has obvious cutting, erosion, and scouring damage in comparison to the previous channel (Figure 10).

4.2. Pore Characteristics

4.2.1. Pore Types

By means of casting thin sections and SEM, the reservoir space of the Guantao Formation was found to mainly comprise primary intergranular pores, followed by intergranular and intragranular dissolved pores (Figure 11A,D,E,F). Most of the pores are irregular and parts of the pores are filled with clay minerals (Figure 11E,F). In this study area, the primary intergranular pores account for more than 90% of the total pore volume. The throat type is point throat (Figure 11C), followed by necking and laminated throat (Figure 11B). The throat radius is generally between 0.01 mm and 0.03 mm.

4.2.2. Pore Size Distribution

The pore size distribution can be obtained by using the change in mercury in the unit increment of the logarithmic value of the pore radius (dV/dlogD) to measure the rate of change in the pore volume with the pore diameter [39,40] (Figure 12B).
The study area is controlled by shallow water delta deposits with strong reservoir heterogeneity and extremely uneven pore throat distribution. The mercury intrusion experiments show that the length and dip angle of the mercury intrusion curves of different types reservoirs have obvious differences. The better the reservoir quality, the longer the horizontal steps and the weaker the heterogeneity of the pore structure (Figure 12A). The pore size distribution curve shows that the pore throat radius distribution is heterogeneous with single peaks, double peaks, and even triple peaks (Figure 12B). The smaller the peak in the pore throat radius, the worse the quality of the reservoir.

4.3. Mineral Composition

XRD shows that the mineral content is as shown in Table 2. The Guantao Formation is relatively enriched in quartz and feldspar minerals. The content of siliceous minerals (quartz, feldspar) is 74.59%, among which the content of quartz is 42.27%, orthoclase content is 12.88%, and plagioclase content is 16.44%.
The content of clay minerals in samples from different sedimentary environments is also significantly different. The content of clay minerals varies between 2.18% and 59.22%, with an average of 23.14%. The types and contents of clay minerals are shown in Table 2.

5. Discussion

5.1. Pore Structure of Different Sedimentary Microfacies

5.1.1. Pore Throat Characteristics of Different Sedimentary Microfacies

As shown in Table 3, the samples of DB, BC, and DC microfacies had the largest mercury saturation (>75%), the largest pore throat radius (26.23~34.50 μm), and the lowest displacement pressure (0.02~0.03 MPa). The sorting ranged from 3.23 to 3.92, and the pore throat skewness ranged from 0.64 to 1.42. These three types of sedimentary microfacies are the best reservoir types in the PL Oilfield. The pore throat characteristics within different sedimentary microfacies showed significant differences.
SS and MB microfacies samples had low mercury saturation (67.72% to 69.76%), a small pore throat radius, high displacement pressure (0.12 MPa to 0.14 MPa), and the maximum pore throat radius between 5.53 μm and 6.36 μm. Skewness ranged between 0.10 and 0.28. Shallow water deltas have fast deltaic progradation rates and a very slow slope of basement. The mouth bar and far sand bar deposited in the early stage are easily eroded by distributary channels in the later stage and eventually disappear. Therefore, the mouth bar sand in this study area is less developed and is very thin.
IB and FP had the smallest pore size, the lowest mercury saturation, and the highest displacement pressure. The sorting coefficient was 2.82~3.15 and the skewness was relatively fine. Compared with other microfacies, these two types of argillaceous facies reservoirs had a lower porosity, lower permeability, and poor storage capacity.
The pore characteristics within different depositional microfacies showed that parameters such as the mean pore throat, coefficient of variation, skewness, sorting, fractal dimension, or permeability had some correlations and their major characteristics were as follows: (1) The mean value of pore throat (ϕ) was negatively correlated with the variation coefficient; (2) the pore throat skewness of good reservoirs (DBs, BCs, DCs) were all positive, and poor reservoirs were mainly negative; (3) pore throat radius was positively correlated with reservoir physical properties; and (4) the sorting of the study area was complicated. It is not simply that the lower the sorting, the better the quality of the reservoir. This is because the pore throat distribution range of the argillaceous microfacies is smaller and the distribution probability is more concentrated. However, the high-quality microfacies have a wider distribution of pore throats, which will cause the sorting coefficient of some arenaceous microfacies to be larger than that of argillaceous microfacies. Therefore, the sorting coefficient should be compared within the same sedimentary microfacies type.

5.1.2. Pore Size Distribution of Different Sedimentary Microfacies

The DBs in the PSD curves are mainly single-peak characteristics (Figure 13A). The PSD range corresponding to the main peak is 10~25 μm and the pore volume contribution rate in this range is about 40%. DBs have large pore throat and are relatively homogeneous.
The PSD curves of BCs and DCs had similar multi-peak characteristics (Figure 13B,C). The pore throat radius of the main peak ranged from 8 μm to 20 μm and the pore volume contribution rate was 35%. The pore throat radius of the secondary peak ranged from 5 μm to 8 μm and the pore volume contribution rate was 10%. The BCs and DCs were more heterogeneous compared with the DBs.
SSs (Figure 13D), FPs (Figure 13E), and IBs (Figure 13F) had poorly developed microfacies pores. The main peak of SS pores was less than 5 μm, and the main peaks of FP and IB pores were less than 2 μm. They all showed small-scale and multi-peak characteristics.
The pore size distribution of the DB, BC, and DC microfacies were significantly larger than those of other microfacies. Therefore, the DB, BC, and DC sandstone reservoirs are the main exploration target of the oil field.

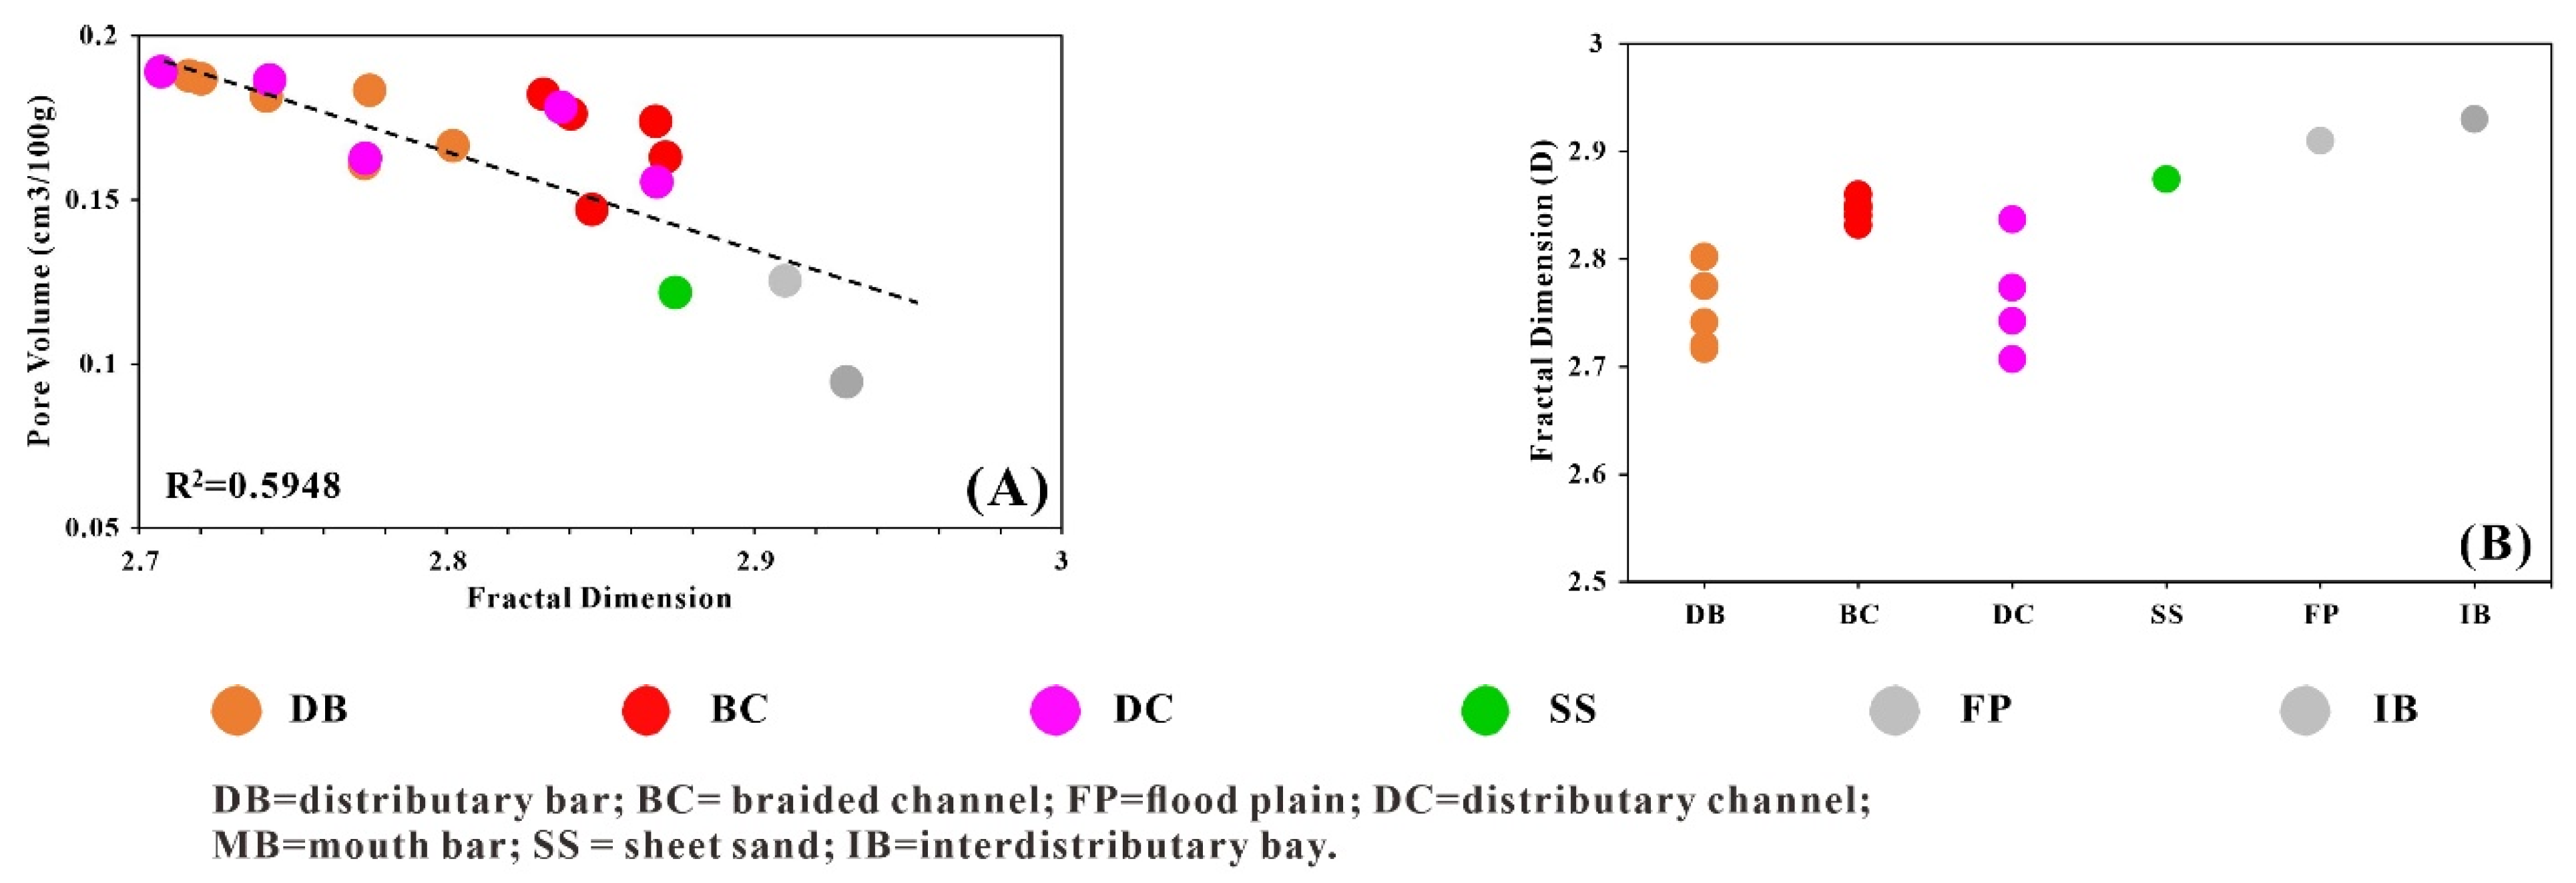
5.1.3. Fractal Dimension of Porous Structure

As shown in Figure 14, the correlations (R2) of all plots were more than 0.9, indicating that they are consistent with the fractal theory [41]. In addition, the sedimentary microfacies control the fractal dimension of the pore structure. The average Df of DB is 2.70 (Figure 14A,B), which is much lower than other microfacies. Both BCs and DCs had lower fractal dimensions, 2.81 (Figure 14C,D) and 2.79 (Figure 14E,F), respectively. However, the average fractal dimension of FPs was 2.93 (Figure 14G) and IBs was 2.94 (Figure 14H), reflecting that the pore structure of argillaceous microfacies has strong heterogeneity.
The fractal dimension is usually correlated with reservoir property [42]. In the PL Oilfield, the larger the fractal dimension, the smaller the pore volume (Figure 15A,B). Arenaceous microfacies are better quality reservoirs because they have a lower fractal dimension. The microfacies between IBs and FPs have the highest fractal dimension, suggesting that they have strong pore structure heterogeneity and small pore volume, which is not a high-quality storage space for oil and gas.

5.2. Sedimentary Control of Pore Throat Characteristics

5.2.1. Sedimentary Rock Texture

Sedimentation and diagenesis are the main controlling factors affecting the pore structure characteristics of clastic rocks [42]. These two processes are controlled by sedimentary rock texture and clastic composition [43,44,45]. The texture refers to grain size, sorting, shape, roundness, and accumulation [7].
The texture and the physical properties of the reservoir have the following characteristics: (1) A coarse-grain size is beneficial to the preservation of intergranular pores so the physical properties of arenaceous sedimentary reservoirs are better than that of fine argillaceous reservoirs (Table 4); (2) the physical properties of the reservoir are negatively correlated with sorting, indicating that when the grain size is similar, the better-sorted reservoirs have better physical properties; and (3) arenaceous microfacies deposited in high-energy environments have greater skewness and poor reservoirs have less skewness, even resulting in negative skewness.
Particles that are well-sorted and coarse-grained will form better pore spaces during the burial process, and poorly sorted, fine-grained sandstone will fill the larger pores during the deposition process, greatly reducing the porosity. Accumulation controls porosity, and the different accumulation methods of particles affect the change in intergranular pores. Therefore, a reservoir pore structure is influenced by various aspects of sedimentary rock texture including grain size, sorting, and accumulation. As can be seen from the cast thin section, compared with argillaceous microfacies, DB, DC, and BC microfacies have a coarser grain size, and the grain contact is mainly point contact, which has better storage space.

5.2.2. Minerals

1.
Quartz and feldspar minerals
As shown in Table 4, the rigid mineral grains (quartz, orthoclase, and plagioclase) of DB, BC, and DC microfacies were significantly higher than other microfacies (Figure 16A). Previous studies have shown that rigid particles are conducive to the preservation of intergranular pores because rigid particles have stronger resistance to compaction [46]. Conversely, the higher the content of clay and plastic debris, the stronger the compressibility, leading to a greater reduction in porosity. In this study, the greater the maturity of the mineral composition, the higher the quartz content, and the greater the pore volume (Figure 17A,B). On the other hand, the diagenetic dissolution of feldspar improves the physical properties and seepage capacity of the reservoir. Atmospheric leaching occurs more in sedimentary microfacies with high physical properties. In the channel microfacies, there are a few intergranular and intra-granular dissolution pores, while the intra-granular dissolution pores of argillaceous microfacies are basically not developed.
2.
Clay minerals
Compared with clean sandstone, even a small amount of detrital clay will cause a lot of pore loss. Clay minerals are more susceptible to diagenetic compaction [43,44]. Compared with DB, BC, and DC microfacies, IB and FP microfacies contain higher clay mineral content (Table 5). The study area is an unconsolidated sandstone reservoir with relatively weak diagenesis, which only experiences compaction and cementation. The compaction and cementation are weak, and the cement content is low, mainly clay mineral cementation. According to the experimental results, the Guantao Formation reservoir is rich in authentically generated clay minerals including kaolinite, illite, illite/smectite, and chlorite. The occurrence of clay minerals has obvious depositional microfacies’ zonation, which has a great influence on diagenesis, pore characteristics, and reservoir quality. The content of clay minerals (4%, 10%, and 6%) in the microfacies of DB, BC, and DC is far less than that of the IB and FP microfacies (35% and 38%). In particular, compared with other clay minerals, the microfacies of DB, BC, and DC developed relatively more kaolinite (Figure 16B).
Illite fills the pores in filamentous and bridged form (Figure 18A,B), which damages and reduces the pore volume of the reservoir. Illite is mostly generated in deep water environments because when the water is deep, the mud content is high and the clay grains increase, which will generate a high amount of infiltration smectite. During the diagenesis process, the smectite will be transformed into illite, and finally formed illite. Therefore, in high-energy microfacies such as DBs and BCs, the relative content of illite is relatively small and the fine-grained depositional material in the shallow water environment usually contains more authigenic illite. The distribution of chlorite and illite has obvious sedimentary facies zoning and its content varies significantly among different sedimentary microfacies, affecting the heterogeneity of the pore structure. IBs and FPs have higher levels of chlorite (Figure 18C,D) and illite (Figure 18E), which deteriorate the quality of the reservoir.
The illite/smectite layer is the transition product of smectite to illite, which is mainly generated after the early diagenetic stage A, and filled in the pores in the honeycomb shape analyzed by SEM (Figure 18E,F). As shown in Table 5, the content of mixed-layer illite/smectite in the Guantao reservoir was the highest, followed by kaolinite, and the differences among different sedimentary microfacies were also great.
Authoritic kaolinite usually fills pores in a book and wormlike form (Figure 18F,G), dividing large pores into smaller ones, blocking rough channels into thin throats and reducing reservoir properties. Kaolinite takes shape when feldspar is corroded by an acidic medium. Therefore, the permeability of sedimentary rocks will directly affect the formation of kaolinite. For these reasons, compared with other clay minerals, kaolinite has a higher content in terms of arenaceous microfacies with a stronger hydrodynamic force, relatively better sorting, less mud content, good permeability, and coarser grain size. In contrast, it is less developed in the argillaceous microfacies with fine grain size, high mud content, and poor permeability.

5.3. Pore Throat Characteristics Comprehensive Evaluation

It is apparent that the reservoir quality of DB, BC, and DC microfacies are better than other microfacies, mainly for the following reasons: (1) with a better depositional structure, the grain size and sorting of arenaceous microfacies are significantly better than that of argillaceous microfacies; (2) it has a higher content of siliceous minerals with good compression resistance; and (3) it contains relatively higher content of kaolinite content and lower illite and chlorite content. As shown in Figure 19, the clastic particles in the DB, DC, and BC microfacies were mainly in point contact and there was little mud filling in the primary intergranular pores. The lower fractal dimension, coarser grain size, and high porosity of BC, DB, and DC microfacies indicate that good reservoirs have better reservoir heterogeneity and better storage space. This shows that the difference in pore structure of various sedimentary microfacies is comprehensively affected by the sedimentary rock texture (grain size, sorting, accumulation, etc.) and the differential distribution of siliceous minerals and clay minerals.
Previous investigations have conducted some work on the major controlling factors of microscopic pore structures [47]. However, a variety of the research results are limited to qualitative analysis and a description of the influencing factors in reservoir pore throat development, with few containing a quantitative evaluation. In the selection of influencing factors, sorting, grain size, and skewness have been taken as the representatives of primary depositional structure, while quartz, feldspar, and clay mineral content have been taken as the representatives of mineral distribution differences. This study was based on these quantitative parameters.

5.3.1. Feature Pore Characteristics Parameters Selection

Based on the mercury intrusion test, using Pittman’s method, the empirical equations of porosity, permeability, and pore throat radius in the 10–75% mercury saturation interval were established (Table 6). The equation results show that the porosity, permeability, and pore throat radius had the best correlation at 35% mercury saturation, which was similar to the experimental results on high porosity and high permeability sandstone by Nabawy (2009) [26].
Moreover, the correlation between R35 and other characteristic parameters obtained from mercury injection experiments showed that R35 has a good correlation with other parameters (Figure 20), especially with permeability, r50, and skewness coefficients greater than 0.8. Therefore, r35 can be used as the feature pore characteristics parameter.

5.3.2. Major Controlling Factors of Pore Characteristics

The grey system theory was founded by Professor Julong Deng (1989) [48] and has been widely used in many fields such as economics, ecology, military, medicine, and education. Gray relational analysis is not only an important part of gray theory, but also the cornerstone of gray system analysis, prediction, and decision-making. The gray relational analysis basic idea is to judge whether the connection is close according to the similarity of the geometric shape of the sequence curve from things or factors. The closer the curves, the greater the correlation between the corresponding sequences, and vice versa. The gray correlation analysis method makes up for the shortcomings caused by the mathematical statistics method in the system analysis. It is equally applicable to the number of sample sizes and irregular samples, and the calculation is small, and thus very easy to use. In gray correlation analysis, the quantitative results will not be inconsistent with the qualitative results.
1.
Determine the analysis sequence
(1)
The original sequence
The data sequence that can reflect the behavior characteristics of the system is called the original sequence. R35 is a comprehensive function of the pore structure. Therefore, this study defines R35 as the original sequence.
(2)
The reference sequence
The data sequence comprising factors that affect the system behavior is called the reference sequence, which selects median grain size, sorting, skewness, quartz, orthoclase, potash feldspar, plagioclase, mix-layer illite/smectite, chlorite, illite, and kaolinite as a reference sequence of pore evaluation characteristics.
X 0 = x 0 1 , x 0 2 , x 0 n
X i = x i 1 , x i 2 , x i n
where X 0 is the original sequence; X i is the reference sequence; n is the sequence length; and i = 1 , 2 , , m is the number of reference sequence.
2.
Data pre-processing
The data of the original sequence and the reference sequence should be preprocessed for two purposes. One is to de-dimensionalize, so that the data of different dimensions can also be compared. The other is to narrow the range of variables and improve calculation efficiency. In this study, the maximum value method was used to process the data without dimension.
Generally speaking, for the median grain size, skewness, orthoclase, potash feldspar, plagioclase, and kaolinite, the larger the value, the better the reservoir quality. For these parameters, the sequence can be normalized as follows:
X   = x x m a x
For sorting, mix-layer illite/smectite, orthoclase, potash feldspar, plagioclase, and kaolinite, the larger the value, the worse the reservoir quality. For these parameters, the sequence should be normalized as follows:
X   = x m a x x x m a x
3.
Gray correlation
In gray correlation analysis, the degree of correlation between two systems or two sequences is defined as the degree of gray correlation. The gray relation coefficient ε o i j for the jth performance characteristics in the ith experiment can be expressed as Equation (11) after data pre-processing.
ε o i j = Δ m i n + ρ Δ m a x Δ o i j + ρ Δ m a x
where ε o i j is the gray relational coefficient. Δ o i j = | X 0 j X i j | is the absolute difference between the original sequence and the reference sequence. Δ m a x and Δ m i n are the maximum and minimum absolute difference, respectively. ρ = 0.5 is generally used.
4.
Gray correlation degree
The gray correlation degree is defined as:
r o i j = 1 n j = 1 n ε o i j
where r o i j is the gray relational grade and n is the number of parameters.
The gray relational grade is between [0, 1], and the closer it is to 1, the higher the correlation degree with the original sequence. Finally, the parameters are sorted according to the gray correlation degree, from large to small, where the order is as follows: mean grain size > median grain size > potassium feldspar > plagioclase > kaolinite > sorting> mix-layer illite/smectite > skewness > quartz > chlorite > illite.
The gray relational grade of each parameter and R35 shows that particle size has the greatest influence on the R35 among the depositional structure factors (Table 7). The sedimentary environment determines the grain size of sedimentary rocks. Grain size is the most significant structural feature of clastic rock particles. Grain size is the most significant sedimentary rock textural characteristic of clastic rock grains, which can point to their lithology and ultimately affect the physical properties of the reservoir. The pore structure of the reservoir is most closely related to grain size, which indicates that the primary sedimentary environment is the most important factor controlling the pore structure.
The feldspar content has the greatest influence of all the mineral content factors, followed by kaolinite and mix-layer illite/smectite. The high content of feldspar minerals can offer the reservoir stronger compaction resistance; on the other hand, it can make the reservoir develop more secondary dissolution pores. Kaolinite and mix-layer illite/smectite are the two clay minerals with the highest content in the Guantao Formation reservoirs. Kaolinite is more developed in high-energy and good permeability reservoirs and mix-layer illite/smectite is relatively high in argillaceous microfacies. Therefore, these two clay minerals have the most significant influence on pore characteristics.
Unconsolidated sandstone reservoirs are distributed in various oil fields throughout the world, and typical oil fields are shown in Table 8. This kind of oil reservoir usually has the characteristics of a shallow burial depth (buried depth < 1800 m), high porosity and permeability, coarse lithology, and loose cementation. Unconsolidated sandstone reservoirs are mainly distributed in Tertiary strata, and some are also distributed in Carboniferous strata such as the heavy oil fields in Alberta, Canada. The research methods and conclusions of this paper are not only applicable to the study area, but also have reference significance for the research work of all unconsolidated sandstone reservoirs.

6. Conclusions

This work contributes to the research on how the shallow-water braided river delta sedimentary system controls the reservoir pore structure, and also establishes empirical formulas for the pore throat radius, porosity, and permeability of high-porosity and high-permeability sandstone reservoirs. The conclusions of this study are as follows:
  • A total of seven typical sedimentary microfacies were identified in the study area; distributary bars (DBs), braided channels (BCs), distributary channels (DCs), mouth bars (MBs), sheet sands (SSs), interdistributary bays (IBs), and flood plains (FPs).
  • The pore structure of various sedimentary microfacies was found to be comprehensively affected by the textural properties of clastic sediments (grain size, sorting, accumulation, etc.) and the differential distribution of quartz, feldspar, and clay minerals.
  • The pore throat radius with 35% mercury saturation was selected as a comprehensive parameter of reservoir microscopic pore structure. R35 not only has the best correlation with porosity and permeability, but also has a close relationship with other mercury injection parameters.
  • Considering the depositional rock texture and mineral fraction, characteristic parameters (grain size, sorting, skewness, quartz, feldspar, kaolinite, chlorite, illite, illite/smectite) were selected to analyze the dominant controlling factor of the pore throat characteristics. Among them, grain size was selected as the most important control factor, indicating that the sedimentary environment is the main controlling factor for pore throat characteristics. It has been established that feldspar, kaolinite, and mixed-layer illite/smectite are the three types of minerals that have the greatest impact on pore characteristics.

Author Contributions

Z.W.: Methodology, Investigation, Data curation, Writing-original draft, Writing—review & editing, Visualization. H.T.: Conceptualization, Methodology, Validation, Formal analysis, Investigation, Resources, Data curation, Writing—review & editing, Supervision, Project administration, Funding acquisition. J.Y.: Visualization, Software, Investigation Experiment, Formal analysis. L.H.: Visualization, Software, Investigation Experiment. All authors have read and agreed to the published version of the manuscript.

Funding

This research received no external funding.

Institutional Review Board Statement

The study did not involve humans.

Informed Consent Statement

The study did not involve humans.

Data Availability Statement

The study did not report any data.

Acknowledgments

This work was supported by the General Project of Chongqing Natural Science Foundation (cstc2021jcyj-msxmX0897).

Conflicts of Interest

The authors declare no conflict of interest. The funders had no role in the design of the study; in the collection, analyses, or interpretation of data; in the writing of the manuscript, or in the decision to publish the results.

References

  1. Lai, J.; Wang, G.; Cao, J.; Xiao, C.; Wang, S.; Pang, X.; Dai, Q.; He, Z.; Fan, X.; Yang, L.; et al. Investigation of pore structure and petrophysical property in tight sandstones. Mar. Pet. Geol. 2018, 91, 179–189. [Google Scholar] [CrossRef]
  2. Liu, C.; Yin, C.; Lu, J.; Sun, L.; Wang, Y.; Hu, B.; Li, J. Pore structure and physical properties of sandy conglomerate reservoirs in the Xujiaweizi depression, northern Songliao Basin, China. J. Pet. Sci. Eng. 2020, 192, 107217. [Google Scholar] [CrossRef]
  3. Wang, M.; Tang, H.; Tang, H.; Liu, S.; Zhang, L.; Zeng, M.; Cheng, Y. Impact of Differential Densification on the Pore Structure of Tight Gas Sandstone: Evidence from the Permian Shihezi and Shanxi Formations, Eastern Sulige Gas Field, Ordos Basin, China. Geofluids 2019, 2019, 4754601. [Google Scholar] [CrossRef]
  4. Sakhaee-Pour, A.; Bryant, S.L. Effect of pore structure on the producibility of tight-gas sandstones. AAPG Bull. 2014, 98, 663–694. [Google Scholar] [CrossRef]
  5. Ajdukiewicz, J.M.; Lander, R.H. Sandstone reservoir quality prediction: The state of the art. AAPG Bull. 2010, 94, 1083–1091. [Google Scholar] [CrossRef]
  6. Wang, M.; Tang, H.; Zhao, F.; Liu, S.; Yang, Y.; Zhang, L.; Liao, J.; Lu, H. Controlling factor analysis and prediction of the quality of tight sandstone reservoirs: A case study of the He8 Member in the eastern Sulige Gas Field, Ordos Basin, China. J. Nat. Gas Sci. Eng. 2017, 46, 680–698. [Google Scholar] [CrossRef]
  7. Lai, J.; Wang, G.; Ran, Y.; Zhou, Z.; Cui, Y. Impact of diagenesis on the reservoir quality of tight oil sandstones: The case of Upper Triassic Yanchang Formation Chang 7 oil layers in Ordos Basin, China. J. Pet. Sci. Eng. 2016, 145, 54–65. [Google Scholar] [CrossRef]
  8. Morad, S.; Al-Ramadan, K.; Ketzer, J.M.; De Ros, L.F. The impact of diagenesis on the heterogeneity of sandstone reservoirs: A review of the role of depositional facies and sequence stratigraphy. AAPG Bull. 2010, 94, 1267–1309. [Google Scholar] [CrossRef]
  9. Ozkan, A.; Cumella, S.P.; Milliken, K.L.; Laubach, S.E. Prediction of lithofacies and reservoir quality using well logs, Late Cretaceous Williams Fork Formation, Mamm Creek field, Piceance Basin, Colorado. AAPG Bull. 2011, 95, 1699–1723. [Google Scholar] [CrossRef]
  10. Nabawy, B.S.; Géraud, Y. Impacts of pore- and petro-fabrics, mineral composition and diagenetic history on the bulk thermal conductivity of sandstones. J. Afr. Earth Sci. 2016, 115, 48–62. [Google Scholar] [CrossRef]
  11. Sadhukhan, S.; Dutta, T.; Tarafdar, S. Simulation of diagenesis and permeability variation in two-dimensional rock structure. Geophys. J. Int. 2007, 169, 1366–1375. [Google Scholar] [CrossRef] [Green Version]
  12. Lai, J.; Wang, G.; Wang, Z.; Chen, J.; Pang, X.; Wang, S.; Zhou, Z.; He, Z.; Qin, Z.; Fan, X. A review on pore structure characterization in tight sandstones. Earth-Sci. Rev. 2018, 177, 436–457. [Google Scholar] [CrossRef]
  13. Tian, J.; Hao, F.; Zhou, X.; Zou, H.; Lan, L. Charging of the Penglai 9-1 oil field, Bohai Bay basin, China: Functions of the delta on accumulating petroleum. Mar. Pet. Geol. 2014, 57, 603–618. [Google Scholar] [CrossRef]
  14. Blunt, M.J.; Bijeljic, B.; Dong, H.; Gharbi, O.; Iglauer, S.; Mostaghimi, P.; Paluszny, A.; Pentland, C. Pore-scale imaging and modelling. Adv. Water Resour. 2013, 51, 197–216. [Google Scholar] [CrossRef] [Green Version]
  15. Dong, H.; Blunt, M.J. Pore-network extraction from micro-computerized-tomography images. Phys. Rev. E Stat. Nonlinear Soft Matter Phys. 2009, 80, 036307. [Google Scholar] [CrossRef] [Green Version]
  16. Zeng, J.; Feng, X.; Feng, S.; Zhang, Y.; Qiao, J.; Yang, Z. Influence of Tight Sandstone Micro-Nano Pore-Throat Structures on Petroleum Accumulation: Evidence from Experimental Simulation Combining X-ray Tomography. J. Nanosci. Nanotechnol. 2017, 17, 6459–6469. [Google Scholar] [CrossRef]
  17. Amaefule, J.O.; Altunbay, M.; Tiab, D.; Kersey, D.G.; Keelan, D.K. Enhanced Reservoir Description: Using Core and Log Data to Identify Hydraulic (Flow) Units and Predict Permeability in Uncored Intervals/Wells. In Proceedings of the SPE Annual Technical Conference and Exhibition, Huston, TX, USA, 3–6 October 1993. [Google Scholar]
  18. Pittman, E.D. Relationship of Porosity and Permeability to Various Parameters Derived from Mercury Injection-Capillary Pressure Curves for Sandstone1. AAPG Bull. 1992, 76, 191–198. [Google Scholar] [CrossRef]
  19. Weger, R.J.; Eberli, G.P.; Baechle, G.T.; Massaferro, J.L.; Sun, Y.-F. Quantification of pore structure and its effect on sonic velocity and permeability in carbonates. AAPG Bull. 2009, 93, 1297–1317. [Google Scholar] [CrossRef]
  20. Zhang, K.; Pang, X.; Zhao, Z.; Shao, X.; Zhang, X.; Li, W.; Wang, K. Pore structure and fractal analysis of Lower Carboniferous carbonate reservoirs in the Marsel area, Chu-Sarysu basin. Mar. Pet. Geol. 2018, 93, 451–467. [Google Scholar] [CrossRef]
  21. Pape, H.; Clauser, C. Improved Interpretation of Nuclear Magnetic Resonance T1 and T2 Distributions for Permeability Prediction: Simulation of Diffusion Coupling for a Fractal Cluster of Pores. Pure Appl. Geophys. 2009, 166, 949–968. [Google Scholar] [CrossRef]
  22. Zhao, P.; Wang, Z.; Sun, Z.; Cai, J.; Wang, L. Investigation on the pore structure and multifractal characteristics of tight oil reservoirs using NMR measurements: Permian Lucaogou Formation in Jimusaer Sag, Junggar Basin. Mar. Pet. Geol. 2017, 86, 1067–1081. [Google Scholar] [CrossRef]
  23. Li, P.; Zheng, M.; Bi, H.; Wu, S.; Wang, X. Pore throat structure and fractal characteristics of tight oil sandstone: A case study in the Ordos Basin, China. J. Pet. Sci. Eng. 2017, 149, 665–674. [Google Scholar] [CrossRef]
  24. Winland, H.D. Oil accumulation in response to pore size changes. In Amoco Production Research Report; Field, W., Ed.; Scientific Research Publishing Inc.: Wuhan, China, 1972. [Google Scholar]
  25. Spearing, M.; Allen, T.; McAulay, G. Review of the Winland R35 method for net pay definition and its application in low permeability sands. In Proceedings of the 2001 International Symposium of the Society of Core Analysts, Edinburgh, UK, 17–19 September 2001. [Google Scholar]
  26. Nabawy, B.S.; Géraud, Y.; Rochette, P.; Bur, N. Pore-throat characterization in highly porous and permeable sandstones. AAPG Bull. 2009, 93, 719–739. [Google Scholar] [CrossRef]
  27. Allen, M.B.; Macdonald, D.I.M.; Xun, Z.; Vincent, S.J.; Brouet-Menzies, C. Early Cenozoic two-phase extension and late Cenozoic thermal subsidence and inversion of the Bohai Basin, northern China. Mar. Pet. Geol. 1997, 14, 951–972. [Google Scholar] [CrossRef]
  28. Liang, J.; Wang, H.; Bai, Y.; Ji, X.; Duo, X. Cenozoic tectonic evolution of the Bohai Bay Basin and its coupling relationship with Pacific Plate subduction. J. Asian Earth Sci. 2016, 127, 257–266. [Google Scholar] [CrossRef]
  29. Xue, Y.a.; Deng, Y.; Wang, D.; Yang, H.; Lv, D.; Kang, K. Hydrocarbon accumulation conditions and key exploration and development technologies for PL 19–3 oilfield. Pet. Res. 2019, 4, 29–51. [Google Scholar] [CrossRef]
  30. Hao, F.; Zou, H.; Gong, Z.; Deng, Y. Petroleum migration and accumulation in the Bozhong sub-basin, Bohai Bay basin, China: Significance of preferential petroleum migration pathways (PPMP) for the formation of large oilfields in lacustrine fault basins. Mar. Pet. Geol. 2007, 24, 1–13. [Google Scholar] [CrossRef]
  31. Washburn, E.W. The Dynamics of Capillary Flow. Phys. Rev. 1921, 17, 273–283. [Google Scholar] [CrossRef]
  32. Ziarani, A.S.; Aguilera, R. Pore-throat radius and tortuosity estimation from formation resistivity data for tight-gas sandstone reservoirs. J. Appl. Geophys. 2012, 83, 65–73. [Google Scholar] [CrossRef]
  33. Schmitt, M.; Fernandes, C.P.; da Cunha Neto, J.A.B.; Wolf, F.G.; dos Santos, V.S.S. Characterization of pore systems in seal rocks using Nitrogen Gas Adsorption combined with Mercury Injection Capillary Pressure techniques. Mar. Pet. Geol. 2013, 39, 138–149. [Google Scholar] [CrossRef]
  34. Song, Z.; Liu, G.; Yang, W.; Zou, H.; Sun, M.; Wang, X. Multi-fractal distribution analysis for pore structure characterization of tight sandstone—A case study of the Upper Paleozoic tight formations in the Longdong District, Ordos Basin. Mar. Pet. Geol. 2018, 92, 842–854. [Google Scholar] [CrossRef]
  35. Giri, A.; Tarafdar, S.; Gouze, P.; Dutta, T. Fractal pore structure of sedimentary rocks: Simulation in 2-d using a relaxed bidisperse ballistic deposition model. J. Appl. Geophys. 2012, 87, 40–45. [Google Scholar] [CrossRef]
  36. Li, K. Analytical derivation of Brooks–Corey type capillary pressure models using fractal geometry and evaluation of rock heterogeneity. J. Pet. Sci. Eng. 2010, 73, 20–26. [Google Scholar] [CrossRef]
  37. Lu, H.; Tang, H.; Wang, M.; Li, X.; Zhang, L.; Wang, Q.; Zhao, Y.; Zhao, F.; Liao, J.; Mahmoud Aly, A. Pore Structure Characteristics and Permeability Prediction Model in a Cretaceous Carbonate Reservoir, North Persian Gulf Basin. Geofluids 2021, 2021, 8876679. [Google Scholar] [CrossRef]
  38. Lai, J.; Wang, G. Fractal analysis of tight gas sandstones using high-pressure mercury intrusion techniques. J. Nat. Gas Sci. Eng. 2015, 24, 185–196. [Google Scholar] [CrossRef]
  39. Clarkson, C.R.; Solano, N.; Bustin, R.M.; Bustin, A.M.M.; Chalmers, G.R.L.; He, L.; Melnichenko, Y.B.; Radliński, A.P.; Blach, T.P. Pore structure characterization of North American shale gas reservoirs using USANS/SANS, gas adsorption, and mercury intrusion. Fuel 2013, 103, 606–616. [Google Scholar] [CrossRef]
  40. Clarkson, C.R.R.; Wood, J.M.M.; Burgis, S.E.E.; Aquino, S.D.D.; Freeman, M. Nanopore-Structure Analysis and Permeability Predictions for a Tight Gas Siltstone Reservoir by Use of Low-Pressure Adsorption and Mercury-Intrusion Techniques. SPE Reserv. Eval. Eng. 2012, 15, 648–661. [Google Scholar] [CrossRef]
  41. Kuila, U.; Prasad, M. Specific surface area and pore-size distribution in clays and shales. Geophys. Prospect. 2013, 61, 341–362. [Google Scholar] [CrossRef]
  42. Hao, L.; Tang, J.; Wang, Q.; Tao, H.; Ma, X.; Ma, D.; Ji, H. Fractal characteristics of tight sandstone reservoirs: A case from the Upper Triassic Yanchang Formation, Ordos Basin, China. J. Pet. Sci. Eng. 2017, 158, 243–252. [Google Scholar] [CrossRef]
  43. Ramm, M. Reservoir quality and its relationship to facies and provenance in Middle to Upper Jurassic sequences, northeastern North Sea. Clay Miner. 2000, 35, 77–94. [Google Scholar] [CrossRef]
  44. Bjørlykke, K. Relationships between depositional environments, burial history and rock properties. Some principal aspects of diagenetic process in sedimentary basins. Sediment. Geol. 2014, 301, 1–14. [Google Scholar] [CrossRef]
  45. Xi, K.; Cao, Y.; Jahren, J.; Zhu, R.; Bjørlykke, K.; Haile, B.G.; Zheng, L.; Hellevang, H. Diagenesis and reservoir quality of the Lower Cretaceous Quantou Formation tight sandstones in the southern Songliao Basin, China. Sediment. Geol. 2015, 330, 90–107. [Google Scholar] [CrossRef]
  46. Bloch, S.; Lander, R.H.; Bonnell, L. Anomalously High Porosity and Permeability in Deeply Buried Sandstone Reservoirs: Origin and Predictability. AAPG Bull. 2002, 86, 301–328. [Google Scholar] [CrossRef] [Green Version]
  47. Yang, W.; Wang, Q.; Wang, Y.; Jiang, Z.; Song, Y.; Li, Y.; Liu, D.; Zuo, R.; Gu, X.; Zhang, F. Pore characteristic responses to categories of depositional microfacies of delta-lacustrine tight reservoirs in the Upper Triassic Yanchang Formation, Ordos Basin, NW China. Mar. Pet. Geol. 2020, 118, 104423. [Google Scholar] [CrossRef]
  48. Deng, J.L. Introduction to grey system theory. J. Grey Syst. 1989, 1, 1–24. [Google Scholar]
Figure 1. (A) The location of the PL Oilfield [30]. (B) The geologic column of the Guantao Formation in well PL19−3−b. (C) PL: The E−W seismic profile of the PL oilfield is steep in the west and slow in the east [29].
Energies 15 02870 g001
Figure 2. The PL Oilfield reservoir profile [29]. The oil and gas is locally controlled by sandstone pinchout, which is a typical lithologic−structural reservoir.
Energies 15 02870 g002
Figure 3. Mudstone color of well PL−19−H. (A) Gray mudstone, L124, 1713.4 m. (B) Light gray mudstone, L100, 1475.3 m. (C) Gray green mudstone, L50, 1180.5 m. (D) Brown red mudstone, L70, 1304.6 m. (E) Red mudstone, L120, 1574.8 m.
Energies 15 02870 g003
Figure 4. Sandstone composition triangle. (A) The triangle chart of sandstone classification in the upper Guantao Formation. (B) The triangle chart of sandstone classification in the lower Guantao Formation.
Energies 15 02870 g004
Figure 5. The probability cumulative grain size curves and C−M diagram. (A) The probability cumulative grain size curves of the PL19−3−A well. (B) The probability cumulative grain size curves of the PL19−3−B well. (C) The probability cumulative grain size curves of the PL25−C well. (D) The probability cumulative grain size curves of the PL25−C well. (E) C−M diagram of the upper Guantao Formation (L50−L70, N = 69). (F) C−M diagram of the lower Guantao Formation (L80−L120, N = 86).
Energies 15 02870 g005
Figure 6. Typical sedimentary structure. (A) Graded bedding, PL19−3−H, 1059.2~1059.9 m. (B) Parallel bedding, PL25−6−C, 1450.5 m. (C) Tabular cross-bedding, PL19−3−F, 1190.5 m. (D) Crescent type cross bedding, PL19−3−F, 1181.3 m. (E) Sand cross bedding, PL19-3-F, 1166.2 m. (F) Erosional basal surface, PL19−3−D, 1364 m.
Energies 15 02870 g006
Figure 7. Neogene shallow lacustrine paleontological assemblages in the PL Oilfield [29].
Energies 15 02870 g007
Figure 8. (A) PL19−3−F, 1127.8 m, BC, Gray medium sandstone. (B) PL19−3−F, 1190.4 m, BC, Cross−bedding. (C) PL19−3−E, 1190.1 m, DB, Gray fine sandstone. (D) PL19−3−F, 1190.43 m, DB, Tabular cross-bedding. (E) PL19−3−H, 1157.1 m, DC, Brown pebbly sandstone. (F) PL19−3−H, 1158.1 m, DC, Cross−bedding. (G) PL19-3-D, 1369.0 m, DC, Erosional basal surface. (H) PL19−3−H, 1421.1 m, DC, Erosional basal surface. (I) PL19−3−F, 1135.2 m, MB, Gray−black fine sandstone. DC = distributary channel; IB = interdistributary bay; MB = mouth bar; FP = flood plain; SS = sheet sand; BC = braided channel; DB = distributary bar.
Energies 15 02870 g008
Figure 9. (AF) Log response of typical sedimentary microfacies in wells PL19−3−A, PL19−3−B, and PL19−3−D. DC = distributary channel; BC = braided channel; FP = flood plain; DB = distributary bar; IB = interdistributary bay; MB = mouth bar; SS = sheet sand.
Energies 15 02870 g009aEnergies 15 02870 g009b
Figure 10. Geologic column of the core section of well PL25−6−A. This vertical geologic column includes logging facies, sedimentary microfacies, sedimentary facies spatial distribution, sedimentary rhythm, lithology information, and a similar modern delta sedimentary map, which can intuitively show the vertical changes in geological features.
Energies 15 02870 g010
Figure 11. (A) The primary intergranular pores are the main ones, with a small amount of dissolution pores, and the face ratio is 25%, PL19−3−A well, L50, 1224.00 m. (B) There are two main types of neck-shaped and point-shaped throats, PL19−3−A well, L70, 1319.50 m. (C) The point type throat PL19−9−A well, L82, 1552.73 m. (D) The primary intergranular pores, PL19−9−A well, L82, 1553.08 m; (E) The primary intergranular pores, PL19−9−A well, L82, 1553.08 m. (F) The primary intergranular pores, PL19−9−A well, L50, 1379.61 m.
Energies 15 02870 g011
Figure 12. (A) Capillary pressure curves. (B) Pore throat radius distribution curve. The mercury intrusion curve is comprehensively controlled by the pore throat size, sorting, and skewness, and is a comprehensive reflection of the pore throat structure characteristics. (A) is the original mercury intrusion curve, and (B) is the pore size distribution curve calculated from (A).
Energies 15 02870 g012
Figure 13. Pore size distribution of different sedimentary microfacies reservoirs. (A) Pore size distribution of DBs. (B) Pore size distribution of BCs. (C) Pore size distribution of DC.s (D) Pore size distribution of SSs. (E) Pore size distribution of FPs. (F) Pore size distribution of IBs.
Energies 15 02870 g013
Figure 14. Representative sample plots of lg(Pc) vs. lg(1 − Hg). The correlation coefficients (R2) of all the graphs were greater than 0.9, indicating that the samples conform to fractal characteristics. As the quality of the reservoir deteriorates, the fractal dimension gradually increases. (A) Fractal dimension of DB. (B) Fractal dimension of DB. (C) Fractal dimension of BC. (D) Fractal dimension of BC. (E) Fractal dimension of DC. (F) Fractal dimension of DC. (G) Fractal dimension of SS. (H) Fractal dimension of IB. (I) Fractal dimension of FP.
Energies 15 02870 g014
Figure 15. (A) Fractal dimension and pore volume scatter plots of different sedimentary microfacies. The pore volume decreases as the fractal dimension increases. (B) Fractal dimension of different sedimentary microfacies. With the improvement in reservoir quality, the fractal dimension gradually decreases.
Energies 15 02870 g015
Figure 16. Star diagram shows the mineral distribution characteristics of different sedimentary microfacies. (A) X-ray diffraction method. (B) The quantitative mineral clay analysis method.
Energies 15 02870 g016
Figure 17. (A) Compositional maturity and plane porosity distribution. (B) Correlation between compositional maturity and plane porosity.
Energies 15 02870 g017
Figure 18. SEM images of representative clay mineral samples from the Guantao Formation. (A) PL25-C1, L80. The dissolution of feldspar produces intragranular pores and transforms into silky and scale kaolinite. (B) PL25-C, L80. Octahedral pyrite, silky illite filling intergranular pores. (C,D) PL19-B, L50. (E) PL25-3C1, L60. The filamentous illite/smectite mixed-layer was attached to the particle surface and filled the intergranular pores. (F) PL25-C, L100. A high number of silk-flocculent illite/smectite mixed-layer filled the intergranular pores, and some potassium feldspar particles were dissolved and transformed into book-shaped kaolinite. (G) PL25-C1, L80.Worm-shape kaolinite fills the intergranular pore throats, and the kaolinite transforms into silky illite.
Energies 15 02870 g018
Figure 19. A summary diagram that displays pore characteristics controlled by microfacies in a deltaic depositional environment.
Energies 15 02870 g019
Figure 20. The correlation between R35 and other pore characteristic parameters.
Energies 15 02870 g020
Table 1. Sedimentary characteristics and logging response.
Sedimentary
Facies
Sedimentary
Subfacies
Sedimentary
Microfacies
LithologySedimentary StructureLog Response
Shallow braided river deltaDelta plain
(L50–L70)
Braided Channel (BC)Gray, off-white medium-fine-grained feldspar sandstone and lithic feldspar sandstoneTrough cross-bedding, plate cross-bedding, and erosional basal surfaceDentate small cylindrical or bell shaped, medium-high amplitude, GR and SP curves characteristics
Distributary Bar/Channel Bar(DB)Gravel-bearing coarse sandstone to medium-fine sandstonePlate cross bedding, trough cross bedding and parallel beddingHomogeneity, box-shaped, high amplitude, curves characteristics.
Flood Plain (FP)Reddish-brown, khaki, variegated and gray-green silty mudstones and mudstonesHorizontal bedding, with massive structureThe GR curve is high and dentate, and the SP curve has the characteristics of low amplitude and smooth logging.
Delta front and Delta plain interact
(L80–L120)
Distributary Channel (DC)Gravelly sandstone, medium sandstone, fine sandstoneSlotted cross bedding, parallel bedding, and small cross beddingPositive rhythm, box, or bell shaped, medium to high amplitude, dentate GR and SP curves characteristics
Interdistributary Bay (IB)Gray green, light gray mudstone, and silty mudstoneHorizontal bedding, with massive structureThe GR curve is high and dentate, and the SP curve has the characteristics of low amplitude and smooth logging.
Mouth Bar (MB)Gray to gray-black fine sandstoneLow energy bedding developmentThe GR curve is funnel-shaped, with obvious anti-rhythm
Sheet Sand (SS)Gray to gray-black fine sandstone and siltstoneParallel beddingThe logging curves are in the shape of tines and fingers
Table 2. Mineral composition of the Guantao Formation.
ParameterAbsolute Mineral Content (%)Clay Mineral Relative Content (%)N
QuartzOrthoclasePlagioclaseClayCalciteDolomiteIllite/smectiteKaoliniteIlliteChlorite81
range17.31~81.144.35~35.163.05~42.412.18~59.220~5.420~4.323.21~90.151.02~78.252.21~58.871.15~23.21
average45.2712.8816.4423.140.80.9948.2331.7811.438.56
Table 3. Pore throat characteristics of the Guantao Formation.
MicrofaciesPor/%Perm/mDVp/cm3/100 g x ¯ SkpSpDr
DBs33.14 2256.15 17.686.61 1.42 3.23 0.49
BCs31.77 1937.55 17.06 8.80 0.47 3.92 0.45
DCs30.30 1826.25 16.018.35 0.64 3.43 0.43
SSs20.19 115.89 12.5110.33 −0.10 2.65 0.28
MBs20.90 121.26 13.42 9.73 0.28 2.85 0.29
FPs13.12 64.83 10.8711.09 −0.70 3.15 0.22
IBs12.13 58.65 11.42 11.77 −0.60 2.82 0.21
MicrofaciesP50/MPaR50/μmPd/MPaSmax/%Rmax/μmWe/%R35/μm
DBs0.07 18.81 0.02 89.15 34.50 3.84 20.76
BCs0.20 4.60 0.03 74.51 29.88 10.70 12.88
DCs0.24 6.33 0.03 82.76 26.23 11.38 12.03
SSs2.65 0.28 0.12 69.76 6.36 19.78 0.79
MBs3.12 1.22 0.14 67.72 5.53 23.14 1.52
FPs9.71 0.08 0.38 61.12 1.96 28.48 0.61
IBs7.20 0.10 0.30 59.15 2.60 29.58 0.68
Por = porosity; Perm = permeability; Vp = total pore volume; x ¯ = pore throat even size; Skp = skewness; Sp = pore throat sorting coefficient; Dr = pore throat variation coefficient; P50 = median pressure; R50 = median pore throat radius; Pd = displacement pressure; Smax = maximum mercury saturation; Rmax = maximum pore throat radius; We = mercury withdrawal efficiency; R35 = the pore throat radius that corresponds to 35% mercury saturation.
Table 4. Petrological characteristics and sedimentary environment of shallow braided river delta sedimentary microfacies.
MicrofaciesDistributary Bar
(DB)
Braided Channel
(BC)
Distributary Channel
(DC)
Sheet Sand
(SS)
Flood Plain
(FP)
Interdistributary Bay
(IB)
Sedimentary hydrodynamicsHigh energyHigh energyHigh–moderate energyModerate–low energyLow energyLow
energy
Flow mannerBidirectional flowBidirectional flowUnidirectional flowUnidirectional flowUnidirectional flowUnidirectional flow
Water depthShallowShallowShallowMediumDeepDeep
Provenance distanceProximalProximalProximalMediumDistantDistant
Compositional maturityMediumMediumMediumLowLowLow
Median grain size/μm220180110602520
Sorting1.622.301.502.893.093.07
Skewness0.620.0.540.210.180.15
Particle contactsPointPointPointLineLine-surfaceLine-surface
Porosity/%34.15%32.0532.0125.8020.2419.15
Permeability/mD2885.181504.171259.28142.1035.2140.12
Table 5. Mineral content of different sedimentary microfacies.
MicrofaciesSiliceous Minerals (%)Carbonate Minerals (%)Clay Minerals (%)
QuartzOrthoclasePlagioclaseCalciteDolomiteIlliteKaoliniteChloriteIllite/Smectite
BC46.3813.3826.380.750.8817.1319.759.1354
FP36.899.9411.820.830.675.3925.17762.44
DC54.9517.7519.160.751.615.6551.7510.721.9
MB459.6721.6701.51022.671552.33
SS5569001121662
DB64.1417.43160.291.1426.293714.4322.29
IB37.2510.2113.771.080.76.4224.175.3364.08
Table 6. The empirical equation of porosity, permeability, and pore throat radius at 10~75% mercury saturation.
Mercury Saturation (%)Fitting Formula (φ,%; K, mD)Correlation Coefficient (R2)
10lgR10 = 0.992 + 0.533lgK − 0.928lgφ (N = 41)0.72
15lgR15 = 0.977 + 0.570lgK − 1.048lgφ (N = 41)0.85
20lgR20 = 0.875 + 0.587lgK − 1.053lgφ (N = 41)0.90
25lgR25 = 0.677 + 0.632lgK − 1.050lgφ (N = 41)0.91
30lgR30 = 0.490 + 0.698lgK − 1.098lgφ (N = 41)0.91
35lgR35 = 0.321 + 0.791lgK − 1.227lgφ (N = 41)0.92
40lgR40 = 0.581 + 0.919lgK − 1.725lgφ (N = 41)0.86
45lgR45 = 0.110 + 1.018lgK − 1.684lgφ (N = 41)0.80
50lgR50 = −0.044 + 0.991lgK − 1.606lgφ (N = 40)0.77
55lgR55 = 1.146 + 1.117lgK − 2.779lgφ (N = 40)0.70
60lgR60 = 2.429 + 1.233lgK − 4.025lgφ (N = 40)0.60
65lgR65 = 2.914 + 1.155lgK − 4.335lgφ (N = 37)0.45
70lgR70 = 4.061 + 1.166lgK − 5.339lgφ (N = 37)0.34
75lgR75 = 0.222 + 0.794lgK − 2.156lgφ (N = 32)0.18
Where R is the pore throat radius of different mercury saturations; φ is the core porosity; and K is the core permeability measured using air flow.
Table 7. Gray relational results table.
Gray Relational GradeOriginal SequenceReference Sequence
N = 70
R35MzMdPotPlaKaoSpI/SSkpQtzChlIll
μmμmμm%%%%%%%
10.8310.8220.660.6560.6540.6530.6380.6370.5450.5040.492
R35 = the pore throat radius of 35% mercury saturation; Mz = mean grain size; Md = middle grain size; Pot. = potash feldspar; Pla. = plagioclase; Kao. = kaolinite; S p = pore–throat sorting coefficient; I/S = mixed-layer illite/smectite; Skp = skewness; Qtz. = quartz; Chl. = chlorite; Ill. = illite.
Table 8. Characteristics of some unconsolidated sandstone reservoirs.
CountryRegionOil FieldBurial Depth
(m)
Porosity
(%)
Permeability
(mD)
Sedimentary Facies Type
ChinaBohai Bay BasinGudao Oilfield1120~1350331639Fluvial facies
PL 19-3 Oilfield910~1501261351Shallow braided river delta
Qinhuangdao 32-6 Oilfield950353000Fluvial facies
Nanxiang BasinJinglou Oilfield100~83031.72642Fan delta
Gucheng Oilfield150~104731.32250River delta
Junggar BasinNo.9 District of Karamay Oilfeld215~35031.73000Braided river
SudanMuglide BasinFula Oilfield1200~1500292041Fluvial facies
CanadaEastern AlbertaFrog Lake Oilfield424~600301000–2000Fluvial facies
United StatesGulf of Mexico, CaliforniaKern River Oilfield220~42029.33140Braided alluvial
Wilmington Oilfield63~224030.14260Fluvial facies
Publisher’s Note: MDPI stays neutral with regard to jurisdictional claims in published maps and institutional affiliations.

