Article

Hybrid Vehicles as a Transition for Full E-Mobility Achievement in Positive Energy Districts: A Comparative Assessment of Real-Driving Emissions †

by
Gloria Pignatta
1,* and
Navid Balazadeh
2,*
1
School of Built Environment, Faculty of Arts, Design, and Architecture, University of New South Wales (UNSW), Sydney, NSW 2052, Australia
2
School of Sustainable Energy Engineering, Simon Fraser University, Surrey, BC V3T 0A3, Canada
*
Authors to whom correspondence should be addressed.
This paper is an extended version of our paper presented at the International Conference on Construction, Energy, Environment and Sustainability (CEES 2021), Coimbra, Portugal, 12–15 October 2021.
Energies 2022, 15(8), 2760; https://doi.org/10.3390/en15082760
Submission received: 15 February 2022 / Revised: 18 March 2022 / Accepted: 7 April 2022 / Published: 9 April 2022

Abstract

:
Air pollution is a major concern, particularly in developing countries. Road transport and mobile sources are considered the root causes of air pollutants. With the implementation of zero-carbon and zero-energy concepts at the district scale, cities can make great strides towards sustainable development. Urban planning schemes are moving from mere building solutions to the larger positive energy district (PED) scale. Alongside other technology systems in PEDs, increased uptake of electro-mobility solutions can play an important role in CO2 mitigation at the district level. This paper aims to quantify the exhaust emissions of six conventional and two fully hybrid vehicles using a portable emission measurement system (PEMS) in real driving conditions. The fuel consumption and exhaust pollutants of the conventional and hybrid vehicles were compared in four different urban and highway driving routes during autumn 2019 in Iran. The results showed that hybrid vehicles presented lower fuel consumption and produced relatively lower exhaust emissions. The conventional group’s fuel consumption (CO2 emissions) was 11%, 41% higher than that of the hybrids. In addition, the hybrid vehicles showed much better fuel economy in urban routes, which is beneficial for PEDs. Micro-trip analysis showed that although conventional vehicles emitted more CO2 at lower speeds, the hybrids showed a lower amount of CO2. Moreover, in conventional vehicles, NOx emissions showed an increasing trend with vehicle speed, while no decisive trend was found for NOx emissions versus vehicle speed in hybrid vehicles.

Graphical Abstract

1. Introduction

Air pollution a major concern, particularly in developing countries, and it is a crucial factor in the outbreak of certain illnesses such as cardiovascular and respiratory problems [1,2]. The World Health Organization (WHO) states that air pollution results in almost 4 million premature deaths each year globally, which underscores the need to utilize novel methods to control and mitigate these emissions. Moreover, the impact of some pollutants, for example, CO2, on climate and ecosystem conditions is enormously severe and indisputable. CO2 is dominant among greenhouse gases (GHGs). According to the International Energy Agency (IEA), the global amount of CO2 emissions reached its historic high of 33.1 Gt with the transport section, especially road transportation, being responsible for almost one-quarter of total CO2 emissions, which underlines the importance of mobile sources of air pollution [3,4].
It should be noted that mobile sources are considered the root cause of air pollutants alongside generating tire and road wear particles [5]. For instance, in Tehran, the capital of Iran, mobile sources are accounted as the primary source of air pollutant emissions. According to a recent study, mobile sources were responsible for 85% of the total aggregated pollutants in Tehran, while stationary sources accounted for the remaining 15% [6].
According to international reports, approximately 80% of the world’s energy is consumed in urban areas and cities, with greenhouse gas emissions of up to 60% [7]. The urban area populations are rapidly increasing, and it is estimated that almost 66% of the world’s population will reside in urban parts by 2050 [8]. Cities implementing zero-carbon and zero-energy concepts on larger scales (districts) can make great strides towards sustainable development.
Urban planning schemes must move from mere building solutions to the larger urban scale, targeting positive energy districts (PEDs). PED is a novel concept that defines an urban area where the energy consumed to run the district is lower than the renewable energy generated within or outside the district. This contributes to cities’ energy system transformations towards carbon neutrality, and this district approach allows considering energy interactions between each building and the broader energy system at the local level [9]. In fact, PEDs, due to the fact of their scalability potential, harnessing of renewable energy (which is sometimes impractical for individual buildings), and achievement of a high level of energy efficiency, are advantageous in building decarbonization and promising pathway towards sustainable urban development [7,8,10,11].
The mobility and transportation sector has a share of almost 27% in GHG emissions in Europe [12]. The EU requires passenger cars to reduce their CO2 emissions by 15% by 2025 and 37.5% by 2030 [13]. Sustainable mobility plays an important role in the future of sustainable cities requiring greater efficiency in the transport system together with behavioral change and urban transport electrification [14]. The inclusion of electric vehicles in the fleet can effectively comply with the mentioned emission regulations.
Gradual penetration of electric vehicles (plug-in hybrids and battery-powered electric vehicles) into the European market is being achieved, as their share increased from 0.06% in 2011 to 3.46% in 2019 in newly registered vehicles. Norway, Iceland, the Netherlands, and Sweden showed a 56%, 19%, 16%, and 12% share of electric vehicles in newly registered cars in 2019, respectively [15]. The IEA envisages that under the EV30@30 scenario, the annual sales of electric vehicles will reach 44 million [16].
Increasing uptake of electro-mobility solutions can play an important role in CO2 mitigation at the district level, alongside other technology systems such as energy storage, renewable energy sources (e.g., solar, wind, and geothermal), photovoltaic (PV) panels, combined heat and power (CHP), and bioenergy. In fact, PEDs can incorporate the benefits of electric vehicles, primarily through the implementation of charging infrastructures using renewable energy sources. It is important to note that EVs have an impact on the grid due to the related load and demands; therefore, their share in the PED grid must be taken into account in district and city planning. Increasing EV technology penetration caused the utilization of EVs in PEDs throughout the world. Several projects targeting EVs in district planning are in the implementation stage including Quartier la fleuriaye, MAKING-CITY, +CITYXCHANGE, ATELIER, PoCiTYF, SPARCS, SYN.IKIA and READY. These projects harness EVs as a practical application alongside the other technology systems [17]. For example, the EU-funded smart city project, PoCiTYF, considers e-mobility integration into smart cities as one of the solutions towards energy management, decarbonization of the mobility sector, and citizen’s mobility cost reductions [7].
Several solutions are being implemented progressively to decrease exhaust emissions such as engine downsizing, alternative fuels, and incorporating novel after-treatment systems. By electrifying the power system, hybrid engines can offer efficient fuel economy and fewer exhaust emissions. It is accepted that hybrid electric vehicles (HEVs) have relatively higher fuel economy and lower exhaust emissions than conventional internal combustion engine (ICE) vehicles.
Moreover, it is envisaged that in 2050, electricity will have a 13% share in supplying needed energy in the transport section [18]. The Energy Information Administration (EIA) and an IEA report also show an increasing trend and significant sales number of such vehicles over the next few years [19,20]. Full hybrid electric vehicles, which use ICEs and electric motors together, act as a bridge between conventional vehicles and electric ones and are categorized as series, parallel, and power-split configurations based on power flow and the relationship between the combustion engine and electric motor in power supply. Hybrid vehicles reached a share of 4% in 2019 for new vehicle registration in Europe [15].
Measuring exhaust emissions and fuel economy is undoubtedly essential for predicting the fleet electrification benefit for a district accurately. Laboratory tests using standard driving cycles under controlled conditions are often criticized for not reflecting the vehicle’s real emissions and fuel economy. In other words, the smooth pattern of driving cycles along with the controlled conditions underestimates the real amount of exhaust emissions. Accordingly, portable emission measurement system (PEMS) tests (currently mandatory in Euro 6 alongside the standard laboratory tests) can contribute to estimating emission factors under real driving conditions. In other words, PEMS tests represent real driving emissions (RDEs) that are more realistic and reliable [21], because they can capture the effect on emissions and fuel consumption of road traffic, road slope, ambient conditions, etc. PEMS tests are required as part of the Euro 6 regulation, particularly for NOx and particulate number measurement, and the obtained results from PEMS must not exceed the multiplication of conformity factor and the laboratory results. Based on a report by the International Council on Clean Transportation (ICCT), plug-in electric vehicles emit three to four times more CO2 in real-world driving conditions compared to standard driving cycles [22]. However, other novel methods, such as machine learning techniques with input data from PEMS tests or the hardware-in-the-loop (HiL) test bench, have been recently developed [23,24].
A few studies inspected the PEMS measurement of HEVs under RDE-based routes and compared the exhaust emissions and fuel economy with conventional vehicles. Because this study focused on passenger vehicles, only studies dealing with hybrid electric light-duty vehicles are mentioned here, although PEMS studies are performed on heavy-duty HEVs such as buses [25]. Huang et al. [26] compared the exhaust emissions and fuel economy of two pairs of vehicles; each contained one hybrid vehicle (HV) and its conventional vehicle (CV) counterpart. They conducted PEMS tests on three separate routes that included urban, rural, and highway parts. They concluded that HVs had a higher fuel economy than CVs (23–43% for the first pair and 35–49% for the second one). The fuel savings were more noticeable in low-speed and urban conditions due to the combustion engine’s reducing share. The fuel savings were diminished in highway conditions.
Furthermore, both HVs showed considerably higher carbon monoxide (CO) emissions than CVs, and their exhaust gas temperatures declined strongly in low-speed parts. This can be attributed to the hybrid system’s greater start–stop, which led to the temperature variation in the three-way catalytic converter (TWC). Consequently, it impacted the TWC, which reduced the oxidation process. Nitrogen oxides (NOx) emissions were lower in HVs.
Bielaczyc et al. [27] examined one hybrid and one conventional vehicle’s exhaust emissions utilizing PEMS. The RDE-based test route consisted of a 6 km urban part. The test was performed two times in a similar procedure. The conformity factor (CF) was defined in the article as the ratio of emissions in the PEMS test to the applicable limits. Hydrocarbon (HC) emissions were low in both vehicles, and the CF for HC was <<1. The CO emissions were much higher, and the CF for the conventional vehicle was approximately three, while CO emissions for the hybrid vehicle were an order of magnitude lower. In addition, NOx emissions were very low; therefore, the emission factors of the conventional and hybrid vehicles were 8 and 2.5 mg/km, respectively. There was a substantial difference between the CO2 emissions of the conventional and hybrid vehicles. Hybrid vehicles mitigated CO2 emissions by approximately 55% (132 vs. 284 g/km).
Wu et al. [28] explored the exhaust emissions and fuel consumption of two Toyota Prius HEVs using PEMS and compared them with those of conventional gasoline and diesel vehicles. The test route consisted of urban freeways with a total distance of 36 km. They incorporated vehicle specific power (VSP) and the micro-trip method to inspect and analyze the test results. They found that emissions and fuel consumption almost rose with increasing VSP. The results demonstrated a 27–40% reduction in fuel consumption of HEVs. Moreover, utilizing micro-trip analysis proved that, unlike conventional gasoline vehicles, the CO2 emissions of HEVs were almost insensitive to speed change; thus, CO2 emissions decreased by 35%.
In contrast with gasoline vehicles, NOx emissions of HEVs decreased as the average speed diminished. A considerable 90% reduction in NOx emissions was observed for HEVs. One of the most remarkable outputs of the paper was that the mitigation of emissions, particularly CO2 and NOx, occurred in low-speed and congested traffic conditions. As a result, the authors concluded that HEVs are desired substitutes for conventional gasoline taxi fleets. They also employed economic analysis due to the fact of the reduction in fuel consumption. The results showed that the payback period is about 2~3 years for HEVs. Holmen and Sentof [29] conducted a PEMS test on two Toyota Camry vehicles (one hybrid and one conventional gasoline vehicle). The test route comprised 51.5 km including urban, suburban, and highway sections. The authors defined the benefit factor as the ratio between the emission factors of a conventional vehicle and a hybrid vehicle. The benefit factor of HEV CO2 varied from 0.9 (in higher amounts of VSP) to 6.4 at lower speeds and idle conditions, which indicates the lower emission of the HEV at heavy and low-speed traffic conditions. Additionally, the fuel consumption benefit factor of HEV vehicles were 10, 5, and 2 for city, suburban, and highway conditions, respectively (with the average benefit factor of 2.4 through the entire route). This implies that HEV had better fuel saving at lower VSP and speeds.
A large PEMS measurement of 149 diesel, gasoline, and hybrid passenger cars was carried out by O’Driscoll et al. [30]. The vehicles comprised 75 gasoline vehicles and two hybrid ones. The test route consists of 83 km urban and highway parts. Hybrid vehicles played a crucial role in mitigating CO2 emissions, especially in urban areas. The NOx emissions of hybrid vehicles were 20 times lower than those of gasoline vehicles. An assessment of the emissions of a plug-in hybrid electric vehicle using PEMS was performed by Graver et al. [31]. The tests were performed in eight different routes. The results proved that the fuel consumption was roughly 30% lower in the charge-depleting (CD) than in charge-sustaining (CS) mode. Moreover, the CD mode reduced CO and NOx emissions by 25% and 60% compared to the CS mode. Skobiej et al. [32] categorized plug-in vehicles into three different classes based on their emissions obtained from the RDE test. In addition, Wróblewski et al. [33] inspected the economic aspects of PHEVs and driving style impact on energy consumption. Bagheri et al. [34] conducted an extensive literature review to compare the HEV and conventional vehicles in terms of exhaust emissions. The authors reached a contradiction for CO and PN emissions with 13% and 495% higher median values in PEMS measurement for HEVs compared to conventional passenger vehicles.
Pielecha et al. [35] inspected the exhaust emissions and energy consumption of conventional, hybrid, and electric vehicles in RDE conditions and found that electric vehicles had the lowest total energy consumption followed by plug-in hybrids, with 10% higher energy consumption. In addition, conventional vehicles had the highest energy consumption (30%, compared to electric ones). Similarly, Mamala et al. [36] found that the energy consumption of a conventional vehicle was seven times higher than the plug-in one in the RDE test.
Furthermore, aside from tank-to-wheel emissions, Orecchini et al. [37] performed well-to-wheel (WTW) analyses for different conventional and hybrid vehicles using the RDE data and found a significant reduction in the fuel consumption and exhaust emissions of hybrid vehicles compared to conventional ones.
In this paper, the exhaust emission behavior and fuel economy of several hybrid and conventional vehicles with various weights and engine volumes were inspected using PEMS measurement in real driving conditions along four different routes with urban and highway types and flat and uphill slopes. As seen from the reviewed literature, the emission and fuel consumption behaviors of the HEVs can be different, and sometimes they show higher emissions due to the cooling of the three-way catalyst when the ICE is switched off and the vehicle is in the electric motor operation phase. The main aim of this study was to quantify the fuel consumption (CO2) and exhaust pollutants of the hybrid vehicles to inspect their efficacy in GHG reduction, which can be desirable for PEDs in EV technology inclusion alongside other measures to reach significant decarbonization in the districts. It is important to note that, to the best of the authors’ knowledge, no other studies have been conducted on real-driving emissions measurement of hybrid vehicles in Iran. This is the first research work addressing the PEMS study of hybrid vehicles’ GHG reduction capability. The paper is structured into five main sections including this Introduction (Section 1). Section 2 details the applied methodology providing a technical specification of the performed test, the relevant standards, and the investigated vehicles and routes. Section 3 and Section 4 present the results of the comparison analysis performed between conventional and hybrid vehicles and a discussion of the study, respectively. The conclusions of the study are reported in Section 5 and are presented together with future investigation and developments in the context of positive energy districts.

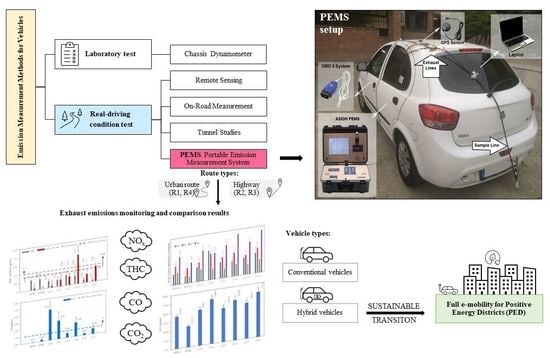
2. Materials and Methods

In this study, PEMS tests were conducted on the vehicles using an Axion OEM-2100 AX portable gas analyzer as shown in Figure 1. The gas analyzer, powered by a 12 V battery, was located in the vehicle’s back seat. The sample line collected exhaust gases from the tailpipe and guided them through the filter and then the gas analyzer. Finally, the exhaust gases were emitted into the atmosphere through the exhaust line. Two portable gas analyzers recorded the second-by-second information of O2, CO, CO2, HC, and NOx. The concentrations of CO, CO2, and HC were measured using the non-dispersive infrared (NDIR) method, and O2 and NOx emissions were detected by the electrochemical cells method.
Figure 2 shows the connection ports of the Axion portable gas analyzer, and Table 1 reports the PEMS unit specifications.
A GPS sensor was connected to the laptop to record vehicle speed along the driving route, considered useful information to be linked with the collected data on the emissions. An OBD II reader device was utilized to log the information of manifold absolute pressure (MAP) and intake air temperature (IAT) on the same laptop necessary for obtaining mass-based emission factors (EFs) or fuel consumption. The mass of the emissions in g can be obtained as the concentration in % of the emissions provided by the gas analyzers plus the pressure and air temperature. The mass of the emissions in g was required to divide grams with distance (km = velocity ∗ time) of the route of the vehicle.
In this study, six spark-ignited, gasoline-fueled conventional vehicles (i.e., CV1, CV2, CV3, CV4, CV5, and CV6) were investigated. In addition, two different fully hybrid vehicles (also with gasoline) were examined (i.e., HVB1 and HVB2). The conventional vehicles belonged to Iran’s market, while the hybrid ones were not from domestic sources. All cars were EURO 4 certified and gasoline fueled. The gasoline fuel had an octane number of 92, a density of 0.742 kg/L, and a carbon weight fraction of 87.7%. Due to the fact of confidentiality reasons, the brands of the vehicles are not disclosed. Hybrid vehicle brand one (HVB1) comprised four identical vehicles with different mileages including HVB1-1 to HVB1-4. In addition, hybrid vehicle brand two (HVB2) included two identical vehicles which had different mileages (HVB2-1 and HVB2-2). A different mileage is one of the uncertainties and involved issues in PEMS. The specifications of the six conventional vehicles and two hybrid brands are shown in Table 2. All the parameters in the table affected the emissions and fuel consumption results. The vehicles’ performance values (i.e., power and torque) were similar and within the same range.
Four different RDE routes were chosen for the PEMS tests, including urban and highway types with flat and uphill road grades, to incorporate into the test all conditions and vehicle operating points. These routes were chosen to reflect the different drive cycles and their impact on engine operating points. Highway routes are associated with more cruising and engaging efficient parts of the engine operating map, while urban routes consist of many start–stops, falling into inefficient zones of the engine map. Choosing these routes led to a more accurate comparison between conventional and hybrid vehicles.
Figure 3 presents the selected routes on Google map, and Table 3 summarizes the essential route characteristics. Road grade was obtained by averaging altitude difference per 100 m during the route; it was also reported based on percentage in which 100% represented 45°.
The tests excluded the cold-start part. In other words, before the test began, each vehicle idled for five minutes until the coolant temperature reached a specific value (85 °C). Moreover, the same driver ran all the tests in order to lower the impact of driving style on the results. Each route was repeated three times in each PEMS test, and each vehicle was tested two times. The tests were conducted between 9:00 a.m. and 1:00 p.m. on different days of the same week in autumn 2019.
In each PEMS test, the average emission factor (EF) and fuel consumption results were calculated using Equation (1), with the weighted average scheme as follows:
E F o v e r a l l = i = 1 4 V K T i × E F i i = 1 4 V K T i
where i is the route index, EFi specifies the emission factor (or fuel consumption) of each route, and VKTi indicates the mileage traveled by the ith route. In this study, the routes were chosen in Tehran city, and the percentage of mileage traveled for each one (VKTi) was obtained from the results in Reference [38], because they studied the same routes using PEMS and reported the route usage percent. In fact, the multipliers of Equation (1), VKTi, were obtained from the link-based activity data from the travel demand model. The mentioned model, using 17,441 individual links in Tehran, has estimated the percentage of kilometers traveled by passenger cars in Tehran city [39]. VKTi is equal to 18.3%, 9.9%, 65.2%, and 6.6% for R1, R2, R3, and R4, respectively.
The velocity profile for four RDE routes, obtained in one the PEMS tests for CV1, are depicted in Figure 4. It was essential to investigate the kinematic characteristics of the RDE routes, which are helpful in understanding and analyzing the existing emission behaviors of RDE routes. For this reason, some of the related kinematic parameters were calculated and can be found in Table 4. Moreover, the standard drive cycle of the NEDC (New European Driving Cycle) is included in Table 4. Comparing the kinematic parameters of real-world cycles with a standard driving cycle indicated that the RDE routes were more aggressive. A standard drive cycle of NEDC was chosen for comparison with the RDE routes, since NEDC is the certification cycle for Euro 4 emission standards, and all of the examined vehicles were Euro 4 certified.
From the dynamic viewpoint, the relative positive acceleration (RPA) was used in the following form to investigate the acceleration and severity level of the driving cycles:
R P A = i = 1 n a i × v i s
where ai indicates the positive acceleration at time step i, vi is the velocity at time step i, and s is the total trip distance. The values of RPA were calculated for each RDE route and for the NEDC. The RPA values are compared in Figure 5. It can be found that the overall values of RPA for the on-road routes were higher than those of the standard driving cycles, which means that the on-road routes included severe periods of acceleration. As a result, on-road routes are expected to present higher values of exhaust emissions, especially for NOx, which is considerably correlated to engine speed and load.

3. Results

This section presents the experimental results of this study in terms of fuel economy and weight, fuel consumption associated with each investigated route, vehicle’s CO2 emission factor, vehicles’ total hydrocarbon (THC), nitrogen oxides (NOx), and carbon monoxide (CO) emissions.

3.1. Fuel Economy and Weight

The dimensionless fuel consumption and weight were calculated and illustrated in Figure 6 to compare the fuel consumption of conventional and hybrid vehicles. The dimensionless fuel economy was obtained by dividing the fuel economy by 10 L/100 km value. In addition, dividing the vehicle weight by 2000 kg gave the dimensionless weight. The fuel economy of each route (Figure 7) was used with Equation (1) to calculate the vehicle’s fuel economy. The obtained dimensionless fuel economies are shown in Figure 6, where it can be seen that the HVB2 had the best fuel economy compared to the others. Moreover, the hybrid vehicles had better fuel economy than the conventional vehicles, which was related to stopping the combustion engine at lower velocities and operating points with lower efficiency such as in idle conditions.

3.2. Fuel Consumption

Figure 7 illustrates the fuel consumption of the investigated conventional and hybrid vehicles associated with the four routes (i.e., the urban routes R1 and R4 and the highway routes R2 and R3). The effect of the driving cycle can be seen in this figure. In fact, hybrid vehicles’ benefit in terms of fuel consumption reduction was much more significant in the R1 and R4 urban driving cycles. Since there are several start–stop or acceleration–deceleration events in urban driving cycles, it is beneficial for hybrid vehicles to utilize regenerative braking energy. This result can also be achieved by comparing the RPA results for R1 or R4 with other routes. R1 and R4 had higher RPAs and were more aggressive routes compared to highway ones. In these cycles, the electric motor was in operation rather than the combustion engine for most of the time. The characteristics of hybrid electric vehicles in urban driving cycles showing lower fuel consumption are beneficial for PEDs. However, in highway cycles or almost cruising conditions, the differences in fuel consumption with the other non-hybrid vehicles were reduced.

3.3. CO2 Emission Factor

Figure 8 depicts the CO2 emitted from the vehicles over the four routes in real-world conditions. The results of each route for each vehicle were averaged, considering the weight factors using Equation (1). It was found that HVB1 can mitigate CO2 by almost 5 to 30% compared to conventional vehicles. This CO2 mitigation was even more considerable for HVB2 (i.e., 40 to 50%). Therefore, hybrid vehicles present a higher potential for CO2 mitigation compared to conventional vehicles.

3.4. THC, NOx, and CO Emissions

Figure 9 and Figure 10 show the total hydrocarbon (THC) and nitrogen oxide (NO) emissions and the CO emission of the two hybrid and six conventional examined vehicles, respectively. Similar to the CO2 results, the emission factors of different routes were averaged using Equation (1), considering the road usage percentages.
In the two figures, it can be seen that the hybrid vehicles complied with the Euro 4 emission standards (0.1 g/km for HC emissions and 0.08 g/km for NOx emissions), while CV4 and CV6 exceeded the NOx limit, and CV1, CV2, and CV4 did not comply with the Euro 4 CO level (1 g/km for CO emissions). Moreover, the NOx values for hybrid vehicles were substantially lower than those of conventional ones (nine to seventeen times lower NOx values).
From this study, the experimental conclusions that can be drawn are the following:
  • Hybrid vehicles met the Euro 4 emission limits in real-world conditions;
  • Hybrid vehicles were able to mitigate fuel consumption (or CO2) by 40–50%, especially in urban driving cycles (such as R4), which can be an excellent advantage for utilization in positive energy districts as a bridge to e-mobility and battery electric vehicles;
  • NOx values for hybrid vehicles were substantially lower than those of conventional ones (nine to seventeen times lower NOx values). All hybrid vehicles met the Euro 4 NOx limit, while the two conventional vehicles (i.e., CV4 and CV6) exceeded the limit;
  • All hybrid vehicles complied with the Euro 4 CO standard, while CV1, CV2, and CV4 did not comply with the Euro 4 CO level.

3.5. Micro-Trip Analysis

The micro-trip method [28] was utilized to inspect the impact of driving conditions on the exhaust emissions in the PEMS test. Micro-trip is a great tool to determine the share of different parts of the test route in exhaust emissions.
Figure 11 indicates the correlation between the CV1 emission factors and the average speed of micro-trips at 5 to 60 km/h. As seen, urban sections accounted for the largest amounts of CO2, CO, and HC emissions, which indicates the congested conditions and higher number of start–stop or acceleration–deceleration events in the urban sections. As the average speed increased, the emissions of CO2 and CO dropped sharply. NOx emissions showed a different trend. It increased when the average speed rose. This can be attributed to the higher amounts of engine load and temperature along the highway sections.
On the other hand, HVB1 showed a different correlation.
As seen in Figure 12, no decisive correlation was obtained for HVB1 emission factors with respect to the vehicle speed. However, despite the conventional vehicle CV1, the hybrid vehicle (HVB1) did not show high values of CO2 at lower speeds. This can be related to the usage of the electric motor in urban conditions instead of the ICE.
In urban type routes, the higher potentiality of regenerative braking led to increased operation in the electric mode.
Moreover, NOx emissions in the hybrid vehicle did not show a decisive trend with vehicle speed.

4. Discussion

In this study, the GHG reduction potential of the hybrid electric vehicles was quantified, and their decarbonization capability was assessed using a tank-to-wheel (TTW) approach (not the upstream approach well-to-wheel). This approach refers to the vehicle’s use phase, corresponding to a sub-range in the vehicle chain that extends from the point at which energy is absorbed (fuel pump or charging point) to discharge (when the vehicle is in motion).
The TTW approach was chosen because the overall GHG emissions for hybrid and plug-in hybrid electric vehicles (assessed using the well-to-wheel approach, which includes all phases of a vehicle from the point at which the fuel/energy is extracted to its transportation/supply/storage in the vehicle to discharge) were lower than the conventional ones, and the current and future emissions for the same two categories of hybrid vehicles with gasoline were similar as presented in [40]. Thus, the results from this study on hybrid vehicles can be extended with a good level of approximation to the plug-in hybrid electric vehicles for which we expect similar values of emissions. Both hybrid technologies play an important role in the electric transition of the transport sector in the context of PEDs.
The Sustainable Development Scenario (SDS) presented by the International Energy Agency (IEA) in 2020 [41] expresses the gradual mitigation (decrease) of GHGs per year in the transportation sector that is expected from 2025 to 2070. It also provides the share of transportation in CO2 emissions for the different transportation modes (where for most of them, a gradual decrease in CO2 emissions is expected). In 2019, transport accounted for nearly 30% of global final energy use (a considerable amount) and 23% of total energy sector direct CO2 emissions. Under this representation, transportation has a high share of decarbonization, and the SDS aims to reach zero-carbon emissions, in the TTW assessment, for passenger cars by 2070. The strategies proposed to reach this goal include biofuels, hybridization of vehicles, and electrification of the transportation sector. Therefore, during the transition to zero-carbon emissions, an increased trend in hybrid, plug-in hybrid, and electric vehicles is expected in the future. Similar trends are presented in the Net Zero Emissions (NZE) scenario provided by the International Energy Agency in 2020 [42], where the consumption by fuel type was predicted, and a great share of electricity in the transport energy supply by 2050 was reported. Moreover, plug-in hybrid and electric-battery vehicles’ share in transportation is soaring, and it is envisaged that by 2050, electricity and hydrogen-based fuel vehicles will account for more than 70% of the transport energy demand.
Given the abovementioned expected scenarios, future research directions may include the analysis and comparison of the entire life cycle assessment (LCA) of hybrid, plug-in hybrid, and electric-battery vehicles to estimate the total CO2 emissions associated with the transition from conventional to e-mobility.
The LCA analysis should be then combined with a cost/benefit analysis of harnessing renewable energy sources in positive energy districts for e-vehicle charging stations and the related infrastructure to provide key stakeholders with a holistic perspective on the potential benefits and impact of e-mobility in the context of PEDs.

5. Conclusions

In this study, the preliminary results, which are presented in [43], of two hybrid vehicles and six conventional vehicles were inspected using the portable emission measurement system (PEMS) for their fuel consumption and emission factor behaviors in real-world driving conditions over four different routes including urban and highway routes. It was found that hybrid vehicles were significantly beneficial in CO2 and fuel consumption mitigation by up to 50%, especially in urban driving cycles, which can be a tremendous advantage for utilization in positive energy districts as a bridge to e-mobility and battery electric vehicles. Moreover, the micro-trip analysis showed that hybrid vehicles emitted lower CO2 values in urban conditions due to the operation of the electric motors and utilization of regenerative braking energy. Future studies can inspect LCA and upstream emissions in HEVs as well as plug-in hybrid electric vehicles while considering their load on the grid. Furthermore, harnessing renewable energy sources in the district for EV charging stations and the related infrastructure is a topic of interest, particularly in view of the transition towards the integration of fully electric mobility in positive energy districts.

Author Contributions

Conceptualization, G.P. and N.B.; data curation, N.B.; formal analysis, N.B.; funding acquisition, G.P.; investigation, G.P. and N.B.; methodology: G.P. and N.B.; supervision: G.P.; visualization: G.P. and N.B.; writing—original draft: G.P. and N.B.; writing—review and editing: G.P. and N.B. All authors have read and agreed to the published version of the manuscript.

Funding

This research received no external funding. The APC was funded by the UNSW Scientia Support Package.

Acknowledgments

The authors would like to thank the Tehran Air Quality Control Company (AQCC) for providing the portable emission measurement system (PEMS) setup used for the tests in real driving conditions. This article is related to the work conducted by the first author in the IEA—EBC Annex 83 Positive Energy Districts and in the COST Action: CA19126—Positive Energy Districts European Network. Those bodies had no involvement in preparing the manuscript, methods and results, etc. and this manuscript reflects only the authors’ views.

Conflicts of Interest

The authors declare no conflict of interest.

Nomenclature

PEDPositive Energy District
PEMSPortable Emission Measurement System
EVElectric Vehicle
HEVHybrid Electric Vehicle
RDEReal Driving Emission
CFConformity Factor
VSPVehicle Specific Power
FCFuel Consumption
NDIRNon-Dispersive Infrared
RPARelative Positive Acceleration
MAPManifold Air Pressure
IATIntake Air Temperature
CVConventional Vehicle
HVBHybrid Vehicle Brand
EFEmission Factor
VKTiMileage Traveled Related to ith Route Type
TTWTank-to-Wheel
LCALife Cycle Assessment
CHPCombined Heat and Power
NEDCNew European Driving Cycle

References

  1. Mabahwi, N.A.B.; Leh, O.L.H.; Omar, D. Human Health and Wellbeing: Human Health Effect of Air Pollution. Procedia—Soc. Behav. Sci. 2014, 153, 221–229. [Google Scholar] [CrossRef] [Green Version]
  2. Tam, W.W.S.; Wong, T.W.; Wong, A.H.S. Association between air pollution and daily mortality and hospital admission due to ischaemic heart diseases in Hong Kong. Atmos. Environ. 2015, 120, 360–368. [Google Scholar] [CrossRef]
  3. International Energy Agency (IEA). Global Energy and CO2 Status Report. 2019. Available online: www.iea.org/geco/emissions/ (accessed on 10 February 2022).
  4. International Energy Agency (IEA). CO2 Emissions from Fuel Combustion. 2018. Available online: www.iea.org/statistics/CO2emissions/ (accessed on 10 February 2022).
  5. Baensch-Baltruschat, B.; Kocher, B.; Stock, F.; Reifferscheid, G. Tyre and road wear particles (TRWP)—A review of generation, properties, emissions, human health risk, ecotoxicity, and fate in the environment. Sci. Total Environ. 2020, 733, 137823. [Google Scholar] [CrossRef] [PubMed]
  6. Shahbazi, H.; Taghvaee, S.; Hosseini, V.; Afshin, H. A GIS based emission inventory development for Tehran. Urban Clim. 2016, 17, 216–229. [Google Scholar] [CrossRef]
  7. Pocityf Website. Available online: https://pocityf.eu/ (accessed on 10 February 2022).
  8. Polly, B.; Kutscher, C.; Macumber, D.; Schott, M.; Pless, S.; Livingood, B.; Van Geet, O. From Zero Energy Buildings to Zero Energy Districts. In Proceedings of the 2016 ACEEE Summer Study On Energy Efficiency in Buildings, Pacific Grove, CA, USA, 21–26 August 2016. [Google Scholar]
  9. Saheb, Y.; Shnapp, S.; Paci, D. From Nearly-Zero Energy Buildings to Net-Zero Energy Districts—Lessons Learned from Existing EU Projects; Publications Office of the European Union: Luxembourg, 2019. [Google Scholar]
  10. Alpagut, B.; Akyürek, Ö.; Mitre, E. Positive Energy Districts Methodology and Its Replication Potential. Proceedings 2019, 20, 8. [Google Scholar] [CrossRef] [Green Version]
  11. Bossi, S.; Gollner, C.; Theierling, S. Towards 100 Positive Energy Districts in Europe: Preliminary Data Analysis of 61 European Cases. Energies 2020, 13, 6083. [Google Scholar] [CrossRef]
  12. European Environment Agency. Greenhouse Gas Emissions from Transport in Europe. Available online: www.eea.europa.eu/data-and-maps/indicators/transport-emissions-of-greenhouse-gases-7/assessment (accessed on 10 February 2022).
  13. EU: Cars: Greenhouse Gas Emissions. Available online: https://dieselnet.com/standards/eu/ghg.php (accessed on 10 February 2022).
  14. Banister, D. The sustainable mobility paradigm Transp. Policy 2008, 15, 73–80. [Google Scholar] [CrossRef]
  15. European Environment Agency. New Registrations of Electric Vehicles in Europe. Available online: www.eea.europa.eu/data-and-maps/indicators/proportion-of-vehicle-fleet-meeting-5/assessment (accessed on 10 February 2022).
  16. International Energy Agency (IEA). Global EV Outlook 2019. Available online: www.iea.org/reports/global-ev-outlook-2019 (accessed on 10 February 2022).
  17. Hedman, Å.; Rehman, H.U.; Gabaldón, A.; Bisello, A.; Albert-Seifried, V.; Zhang, X.; Guarino, F.; Grynning, S.; Eicker, U.; Neumann, H.-M.; et al. IEA EBC Annex 83 Positive Energy Districts. Buildings 2021, 11, 130. [Google Scholar] [CrossRef]
  18. International Energy Agency (IEA). Technology Roadmaps, Biofuels for Transport. 2011. Available online: www.iea.org/reports/technology-roadmap-biofuels-for-transport (accessed on 10 February 2022).
  19. U.S. Energy Information Administration (EIA). Annual Energy Outlook 2021 (AEO2021). 2021. Available online: www.eia.gov/outlooks/aeo/ (accessed on 10 February 2022).
  20. International Energy Agency (IEA). World Energy Outlook 2018. 2018. Available online: www.iea.org/reports/world-energy-outlook2018/electricity#abstract (accessed on 10 February 2022).
  21. Franco, V.; Kousoulidou, M.; Muntean, M.; Ntziachristos, L.; Hausberger, S.; Dilara, P. Road vehicle emission factors development: A review. Atmos. Environ. 2013, 70, 84–97. [Google Scholar] [CrossRef]
  22. Plötz, P.; Moll, C.; Bieker, G.; Mock, P.; Li, Y. Real-World Usage of Plug-In Hybrid Electric Vehicles Fuel Consumption, Electric Driving, and CO2 Emissions. 2020. Available online: https://trid.trb.org/view/1742037 (accessed on 10 February 2022).
  23. Mądziel, M.; Jaworski, A.; Kuszewski, H.; Woś, P.; Campisi, T.; Lew, K. The Development of CO2 Instantaneous Emission Model of Full Hybrid Vehicle with the Use of Machine Learning Techniques. Energies 2022, 15, 142. [Google Scholar] [CrossRef]
  24. Krysmon, S.; Dorscheidt, F.; Claßen, J.; Düzgün, M.; Pischinger, S. Real Driving Emissions—Conception of a Data-Driven Calibration Methodology for Hybrid Powertrains Combining Statistical Analysis and Virtual Calibration Platforms. Energies 2021, 14, 4747. [Google Scholar] [CrossRef]
  25. Keramydas, C.; Papadopoulos, G.; Ntziachristos, L.; Lo, T.-S.; Ng, K.-L.; Wong, H.-L.A.; Wong, C.K.-L. Real-World Measurement of Hybrid Buses’ Fuel Consumption and Pollutant Emissions in a Metropolitan Urban Road Network. Energies 2018, 11, 2569. [Google Scholar] [CrossRef] [Green Version]
  26. Huang, Y.; Surawski, N.C.; Organ, B.; Zhou, J.L.; Tang, O.H.H.; Chan, E.F.C. Fuel consumption and emissions performance under real driving: Comparison between hybrid and conventional vehicles. Sci. Total Environ. 2019, 659, 275–282. [Google Scholar] [CrossRef] [PubMed]
  27. Bielaczyc, P.; Merkisz, J.; Pielecha, J.; Woodburn, J. A Comparison of Gaseous Emissions from a Hybrid Vehicle and a Non-Hybrid Vehicle under Real Driving Conditions; SAE Technical Paper 2018-01-1272; SAE International: Warrendale, PA, USA, 2018. [Google Scholar] [CrossRef]
  28. Wu, X.; Zhang, S.; Wu, Y.; Li, Z.; Ke, W.; Fu, L.; Hao, J. On–road measurement of gaseous emissions and fuel consumption for two hybrid electric vehicles in Macao. Atmos. Pollut. Res. 2015, 6, 858–866. [Google Scholar] [CrossRef]
  29. Holmén, B.A.; Sentoff, K.M. Hybrid-Electric Passenger Car Carbon Dioxide and Fuel Consumption Benefits Based on Real-World Driving. Environ. Sci. Technol. 2015, 49, 10199–10208. [Google Scholar] [CrossRef]
  30. O’Driscoll, R.; Stettler, M.E.J.; Molden, N.; Oxley, T.; ApSimon, H.M. Real world CO2 and NOx emissions from 149 Euro 5 and 6 diesel, gasoline and hybrid passenger cars. Sci. Total Environ. 2018, 621, 282–290. [Google Scholar] [CrossRef]
  31. Graver, B.M.; Frey, H.C.; Choi, H.-W. In-Use Measurement of Activity, Energy Use, and Emissions of a Plug-in Hybrid Electric Vehicle. Environ. Sci. Technol. 2011, 45, 9044–9051. [Google Scholar] [CrossRef]
  32. Skobiej, K.; Pielecha, J. Plug-in Hybrid Ecological Category in Real Driving Emissions. Energies 2021, 14, 2340. [Google Scholar] [CrossRef]
  33. Wróblewski, P.; Kupiec, J.; Drożdż, W.; Lewicki, W.; Jaworski, J. The Economic Aspect of Using Different Plug-In Hybrid Driving Techniques in Urban Conditions. Energies 2021, 14, 3543. [Google Scholar] [CrossRef]
  34. Bagheri, S.; Huang, Y.; Walker, P.D.; Zhou, J.L.; Surawski, N.C. Strategies for improving the emission performance of hybrid electric vehicles. Sci. Total Environ. 2021, 771, 144901. [Google Scholar] [CrossRef]
  35. Pielecha, J.; Skobiej, K.; Kurtyka, K. Exhaust Emissions and Energy Consumption Analysis of Conventional, Hybrid, and Electric Vehicles in Real Driving Cycles. Energies 2020, 13, 6423. [Google Scholar] [CrossRef]
  36. Mamala, J.; Śmieja, M.; Prażnowski, K. Analysis of the Total Unit Energy Consumption of a Car with a Hybrid Drive System in Real Operating Conditions. Energies 2021, 14, 3966. [Google Scholar] [CrossRef]
  37. Orecchini, F.; Santiangeli, A.; Zuccari, F. Real Drive Well-to-Wheel Energy Analysis of Conventional and Electrified Car Powertrains. Energies 2020, 13, 4788. [Google Scholar] [CrossRef]
  38. Banitalebi, E.; Hosseini, V. Development of Hot Exhaust Emission Factors for Iranian-Made Euro-2 Certified Light-Duty Vehicles. Environ. Sci. Technol. 2016, 50, 279–284. [Google Scholar] [CrossRef] [PubMed]
  39. Oppenheim, N. Urban Travel Demand Modeling: From Individual Choices to General Equilibrium; John Wiley and Sons: New York, NY, USA, 1995. [Google Scholar]
  40. Nigro, N.; Giang, S. Lifecycle Greenhouse Gas Emissions from Different Light-Duty Vehicle and Fuel Pathways: A Synthesis of Recent Research; Center for Climate and Energy Solutions: Arlington, VA, USA, 2013; Available online: www.c2es.org/document/lifecycle-greenhouse-gas-emissions-from-different-light-duty-vehicle-and-fuel-pathways-a-synthesis-of-recent-research/ (accessed on 10 February 2022).
  41. International Energy Agency (IEA). Energy Technology Perspectives 2020. Available online: www.iea.org/reports/energy-technology-perspectives-2020 (accessed on 10 February 2022).
  42. International Energy Agency (IEA). Net Zero by 2050: A Roadmap for the Global Energy Sector. Available online: www.iea.org/events/net-zero-by-2050-a-roadmap-for-the-global-energy-system (accessed on 10 February 2022).
  43. Pignatta, G.; Balazadeh, N. Assessment of hybrid vehicles using Portable Emission Measurement System (PEMS) as a transition for full e-mobility achievement in positive energy districts. In Proceedings of the International Conference on Construction, Energy, Environment and Sustainability (CEES 2021), Coimbra, Portugal, 12–15 October 2021; Available online: https://cees2021.uc.pt/projectos/cees2020/atas/pdfs/ID37.pdf (accessed on 11 February 2022).
Figure 1. Installation of the PEMS’ main components on the test vehicle.
Energies 15 02760 g001
Figure 2. Connection ports of the Axion portable gas analyzer.
Energies 15 02760 g002
Figure 3. Selected routes for the PEMS tests (source: Google Maps): (a) R1; (b) R2; (c) R3; (d) R4.
Energies 15 02760 g003
Figure 4. Velocity profiles of the four real driving routes obtained from one PEMS test.
Energies 15 02760 g004
Figure 5. The comparison of RPA for the on-road test routes as well as the NEDC.
Energies 15 02760 g005
Figure 6. Dimensionless fuel economy (FC) and weight.
Energies 15 02760 g006
Figure 7. Fuel consumption of the examined vehicles for each route (i.e., R1, R2, R3, and R4).
Energies 15 02760 g007
Figure 8. CO2 emission factor for the examined vehicles.
Energies 15 02760 g008
Figure 9. THC and NOx emissions of the examined vehicles.
Energies 15 02760 g009
Figure 10. CO emissions of the examined vehicles.
Energies 15 02760 g010
Figure 11. Correlation between the emission factors (a) CO2, (b) CO, (c) NOx, and (d) HC and the average speed of micro-trips for CV1. The dashed line indicates the Euro 4 standard limit.
Energies 15 02760 g011
Figure 12. Correlation between the emission factors of (a) CO2, (b) CO, (c) NOx, and (d) HC and the average speed of micro-trips for HVB1. The dashed line indicates the Euro 4 standard limit.
Energies 15 02760 g012
Table 1. AXION OEM-2100 AX specifications.
CompoundMeasurement MethodMeasurement RangeMeasurement Accuracy
HCNDIR0 to 2000 ppm±4 ppm abs or ±3% rel
CONDIR0.00% to 10.00%±0.02% abs or ±3% rel
10.01% to 15.00%±5% rel
CO2NDIR0.00% to 16.00%±0.30% abs or ±3% rel
16.01% to 20.00%±5% rel
NOxElectrochemical cell0 to 5000 ppm±5 ppm abs or ±1% rel
O2Electrochemical cell0.00% to 25.00%±0.02% abs or ±1% rel
Table 2. Specifications of the investigated vehicles.
VehicleCV1CV2CV3CV4CV5CV6HVB1HVB2
ClassSedanSedanSedanSedanSedanSUVSedanSedan
Weight (kg)12581755147114601332176015801383
Mileage (km)39,97062,35651,59828,44514,25030,694120,000 to 140,000<35,000
Engine Volume (L)1.63.32.5 2.42.02.32.51.8
Maximum Power (hp)115 @ 6000 rpm293 @ 6400 rpm178 @ 6000 rpm185 @ 6000 rpm150150 @ 5500 rpm156 @ 5700 rpm121 @ 5200 rpm
Electric Motor: 140 @ 4500 rpmElectric Motor: 72
Maximum Torque (N.m)157 @ 4500 rpm346 @ 5200 rpm230 @ 4000 rpm241 @ 4000 rpm192214 @ 3500 rpm211 @ 4500 rpm157 @ 4500 rpm
Electric Motor: 269 @ 0–1500 rpmElectric Motor: 163
Table 3. Test routes’ characteristics.
Route NameRoute TypeRoute Length (km)Road Grade (%)
R1Urban2.20.12 (flat)
R2Highway6.94.60 (uphill)
R3Highway5.70.14 (flat)
R4Urban1.96.90 (uphill)
Table 4. Comparison of the kinematic characteristics in the speed profiles.
ParameterNEDCR1R2R3R4
Average speed (km/h)33.0016.9056.4055.2050.00
Maximum speed (km/h)120.0049.0083.0076.0016.60
Standing time (%)23.267.956.142.467.84
Cruising time (%)38.8230.7552.1946.8427.69
Acceleration time (%)21.6229.8920.8328.7632.59
Deceleration time (%)16.3131.3920.8321.9131.86
Publisher’s Note: MDPI stays neutral with regard to jurisdictional claims in published maps and institutional affiliations.

