1. Introduction
Recently introduced 5G communication systems can be applied in enhanced mobile broadband (eMBB), ultrareliable and low-latency communication (URLLC), massive machine type communication (mMTC) scenarios [
1]. The multicarrier system is one of the critical technologies of 5G, which improves the spectral efficiency of 5G. Orthogonal frequency division multiplexing (OFDM) is one of the most representative multicarrier modulation (MCM) techniques due to its capability to efficiently cope with frequency-selective channels for 5G broadband wireless communication [
2]. In addition, OFDM is applied in various communication systems [
3]. Japan has developed the Integrated Service Digital Broadcasting-Terrestrial (ISDBT) [
4] standard; China has developed the Digital Television Multimedia Broadcasting (DTMBH) [
5] standard. Due to the anti-multipath fading characteristic of OFDM, OFDM is applied in various IEEE physical layer [
6] name protocols in WLAN. However, OFDM is restricted by obstacles such as the high peak-to-average-power ratio (PAPR) [
7], which drives the OFDM signals to work in the nonlinear region of high-power amplifiers (HPA) [
8] and this leads to the appearance of an undesirable degradation in the bit error rate (BER) [
9] performance. An increase in the back-off of HPA will lead to a loss in power efficiency; therefore, PAPR reduction is necessary and more efficient for energy optimization.
Various PAPR reduction schemes have been proposed to solve this issue, including signal distortion, coding and probability schemes. As a distortion technology, the clipping scheme [
10] reduces PAPR by clipping the peak signal, but it produces additional noise and distortion to the system. Coding technology [
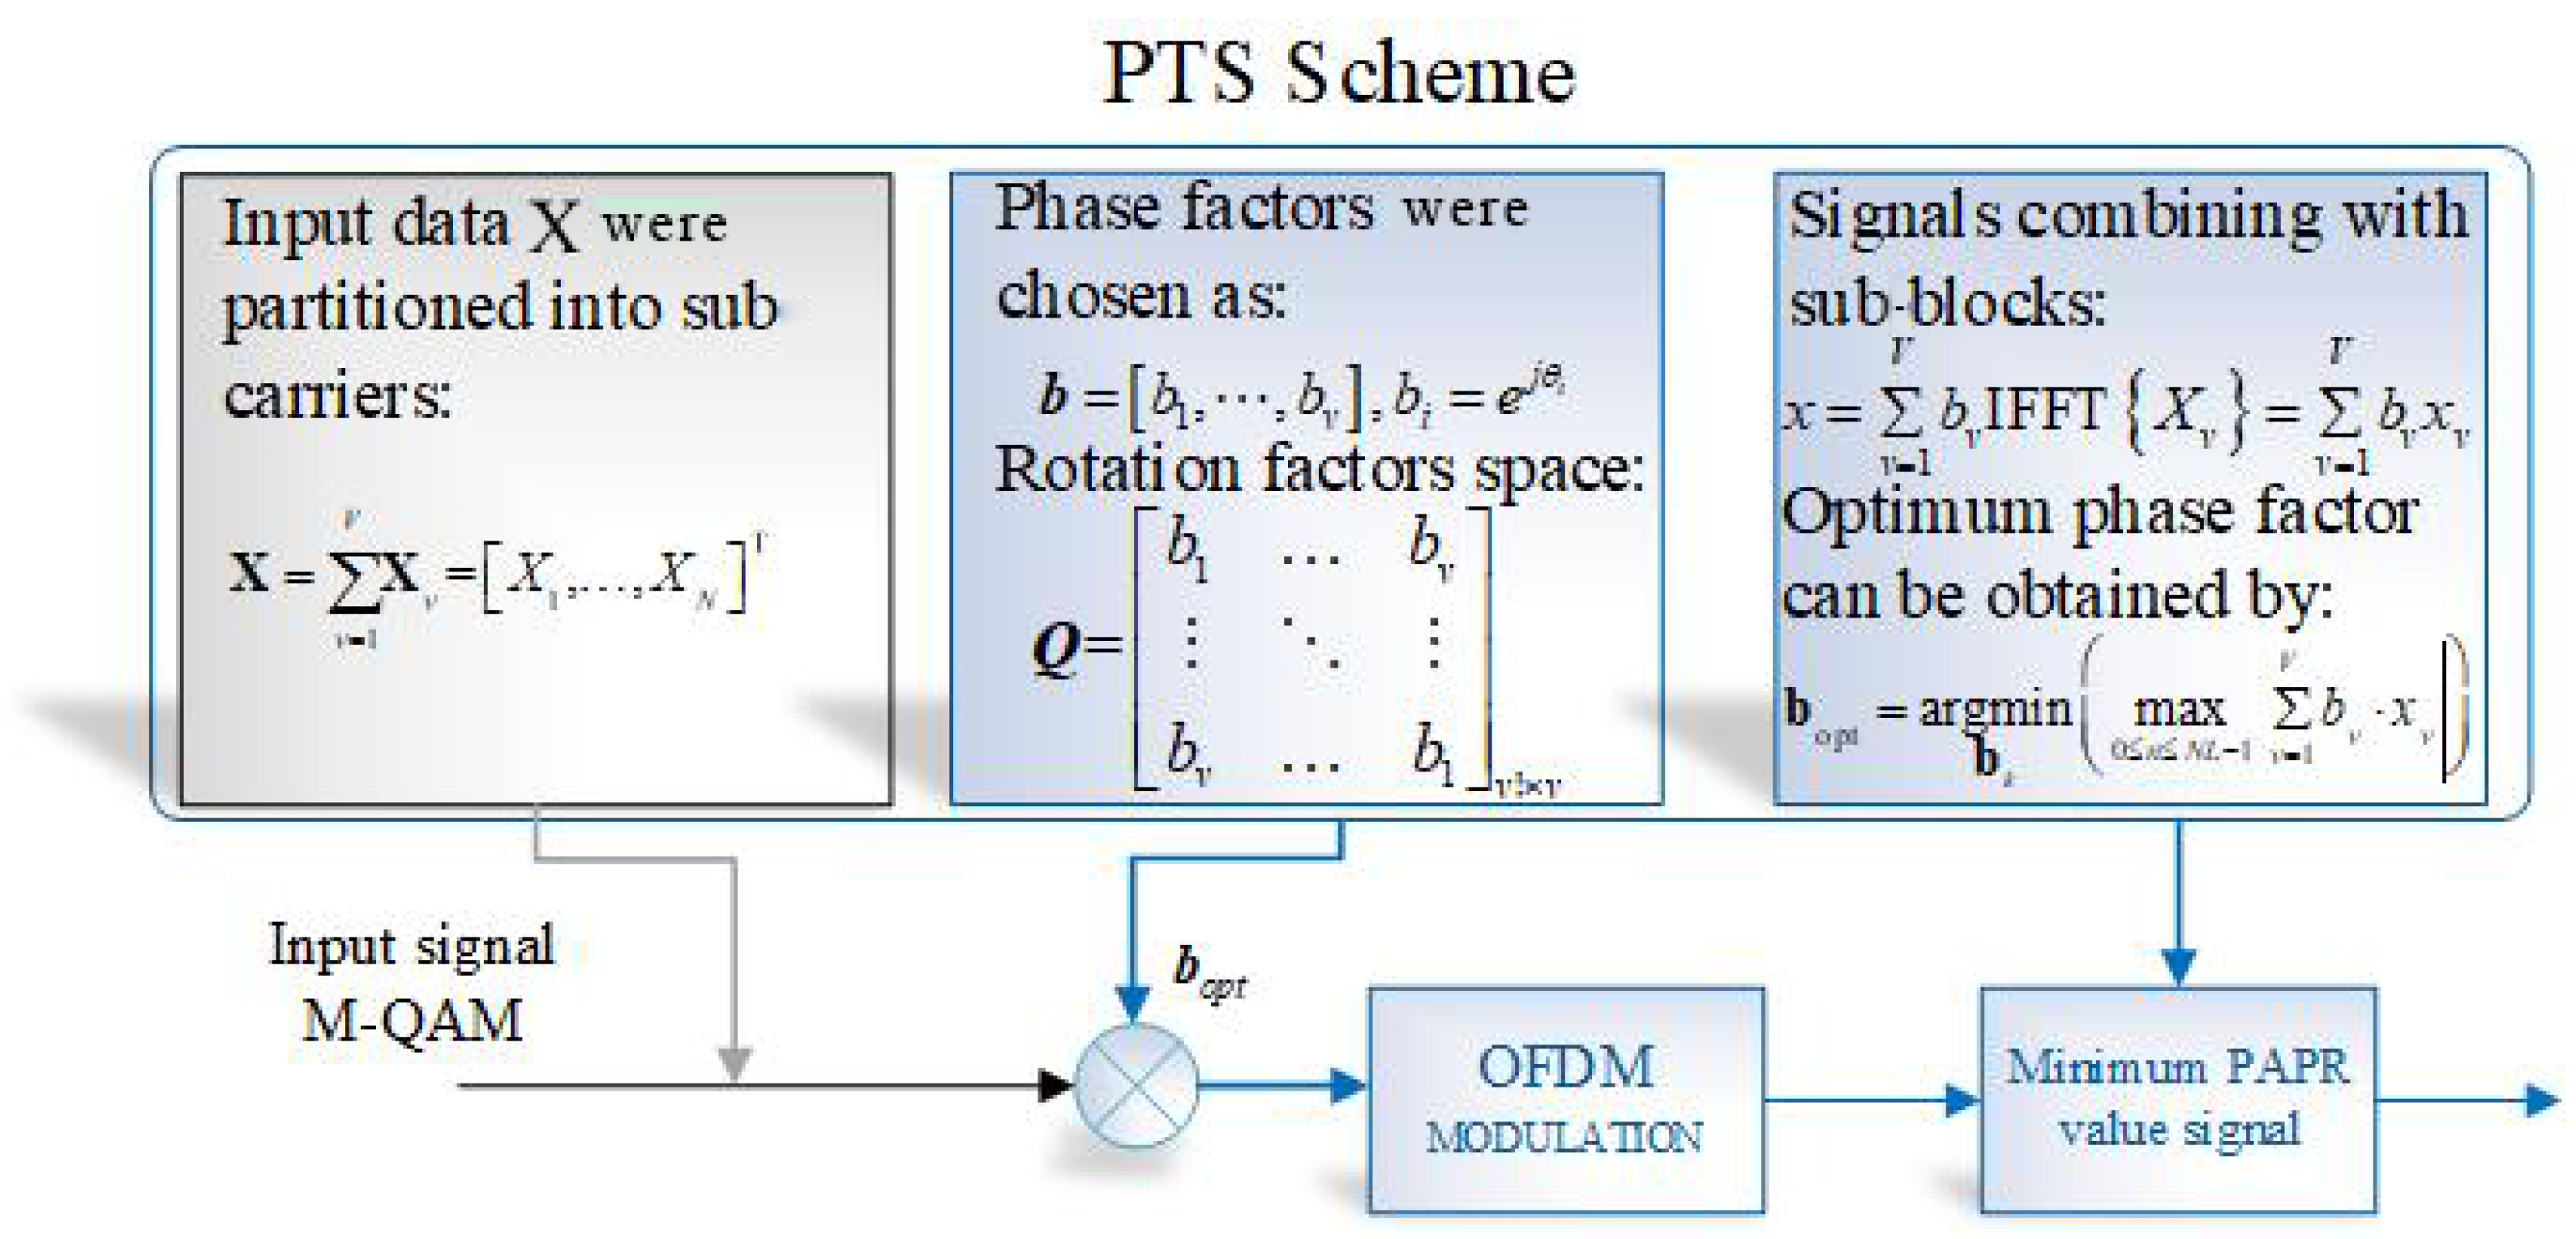
11] encodes the signal without distortion and transmits signals with the lowest PAPR, increasing signal redundancy and reducing spectral efficiency. Probability technologies include particle sequence selection (PTS) [
12], selective mapping (SLM) [
13], tone reservation (TR) [
14] and tone injection (TI) [
15] technologies, which reduce PAPR by changing phase factors without distortion. A comparison of PAPR reduction schemes is given in
Table 1. Among all existing techniques, PTS is very promising for a 5G waveform because of its efficient PAPR reduction performance without any signal distortion. The major drawback of PTS technologies is high computational complexity. To search for the optimal phase combination, large numbers of sub-blocks are inevitable, which increases the searching complexity exponentially [
16]. In low-complexity PTS methods, one of the most attractive methods is using dominant time-domain samples. Unfortunately, a set of multipoint IFFT operations using entire points is required to calculate PAPR values, which significantly increases computational complexity, especially for the PTS algorithm.
Various schemes have been proposed to improve PTS techniques. The pseudo-random and interleaving segmentation PTS method (PR-IL-PTS) [
17] applied adjacent and random joint segmentation to improve PAPR reduction performance with a lower computational complexity, but the effect of the PAPR reduction was not satisfactory. The real and imaginary parts PTS method (RI-PTS) [
18] dispersed the signal’s real and imaginary phase factors, respectively, which improves the PAPR reduction performance but increases the computational complexity. The particle swarm optimization algorithm (PSO) PTS method refers to the phase factor as particles, employs the iterative function to update the particle position iteratively and acquires the best combination of phase factors by particle mutual learning. However, the computational complexity of PSO-PTS rises sharply with the number of iterations. Ref. [
19] applied discrete Fourier transform to improve the PAPR reduction performance with considerable computational complexity.
In this work, a new metric which can select dominant frequency-domain samples accurately is proposed. Specifically, we propose a novel method based on a spacing multiobjective (SMO) processing algorithm to search for a suboptimal PTS scrambling signal [
20]. The PAPR performance is accurately predicted in terms of modifying the relative dispersion before the IFFT operations. Then, the dominant complexity of computing the IFFT is evaded. The proposed low-complexity F-PTS methods can achieve much lower computational complexity without degrading the PAPR reduction performance. We also show that SMO processing has a unique structure that can be exploited to implement the PTS efficiently. Thus, the second proposed scheme, FTD-PTS, may achieve an optimal solution within a faster convergence speed. An evaluation of SMO is conducted to favor a PTS subset before the IFFT operations, instead of randomly selecting a subset. Then, time-domain metrics are used to estimate the PAPR of each candidate signal after finding the preferred PTS subset. Then, time-domain metrics are used to estimate and designate the achievable optimal solution accurately and remove parts of the samples from the procedure of the preferred PTS subset. Compared with the conventional PTS method, the improved PTS method has a reasonable computational complexity and PAPR reduction can reach achievable lower bounds accurately.
To sum up, PTS and its improved versions have issues with high computational complexity or relatively poor PAPR reduction performance. This research proposes two advanced PTS algorithms (F-PTS and FTD-PTS) to reduce the computational complexity and achieve an optimal PAPR reduction performance with reasonable computational complexity.
This paper is arranged as follows.
Section 2 explains the OFDM system and its inherent PAPR issue.
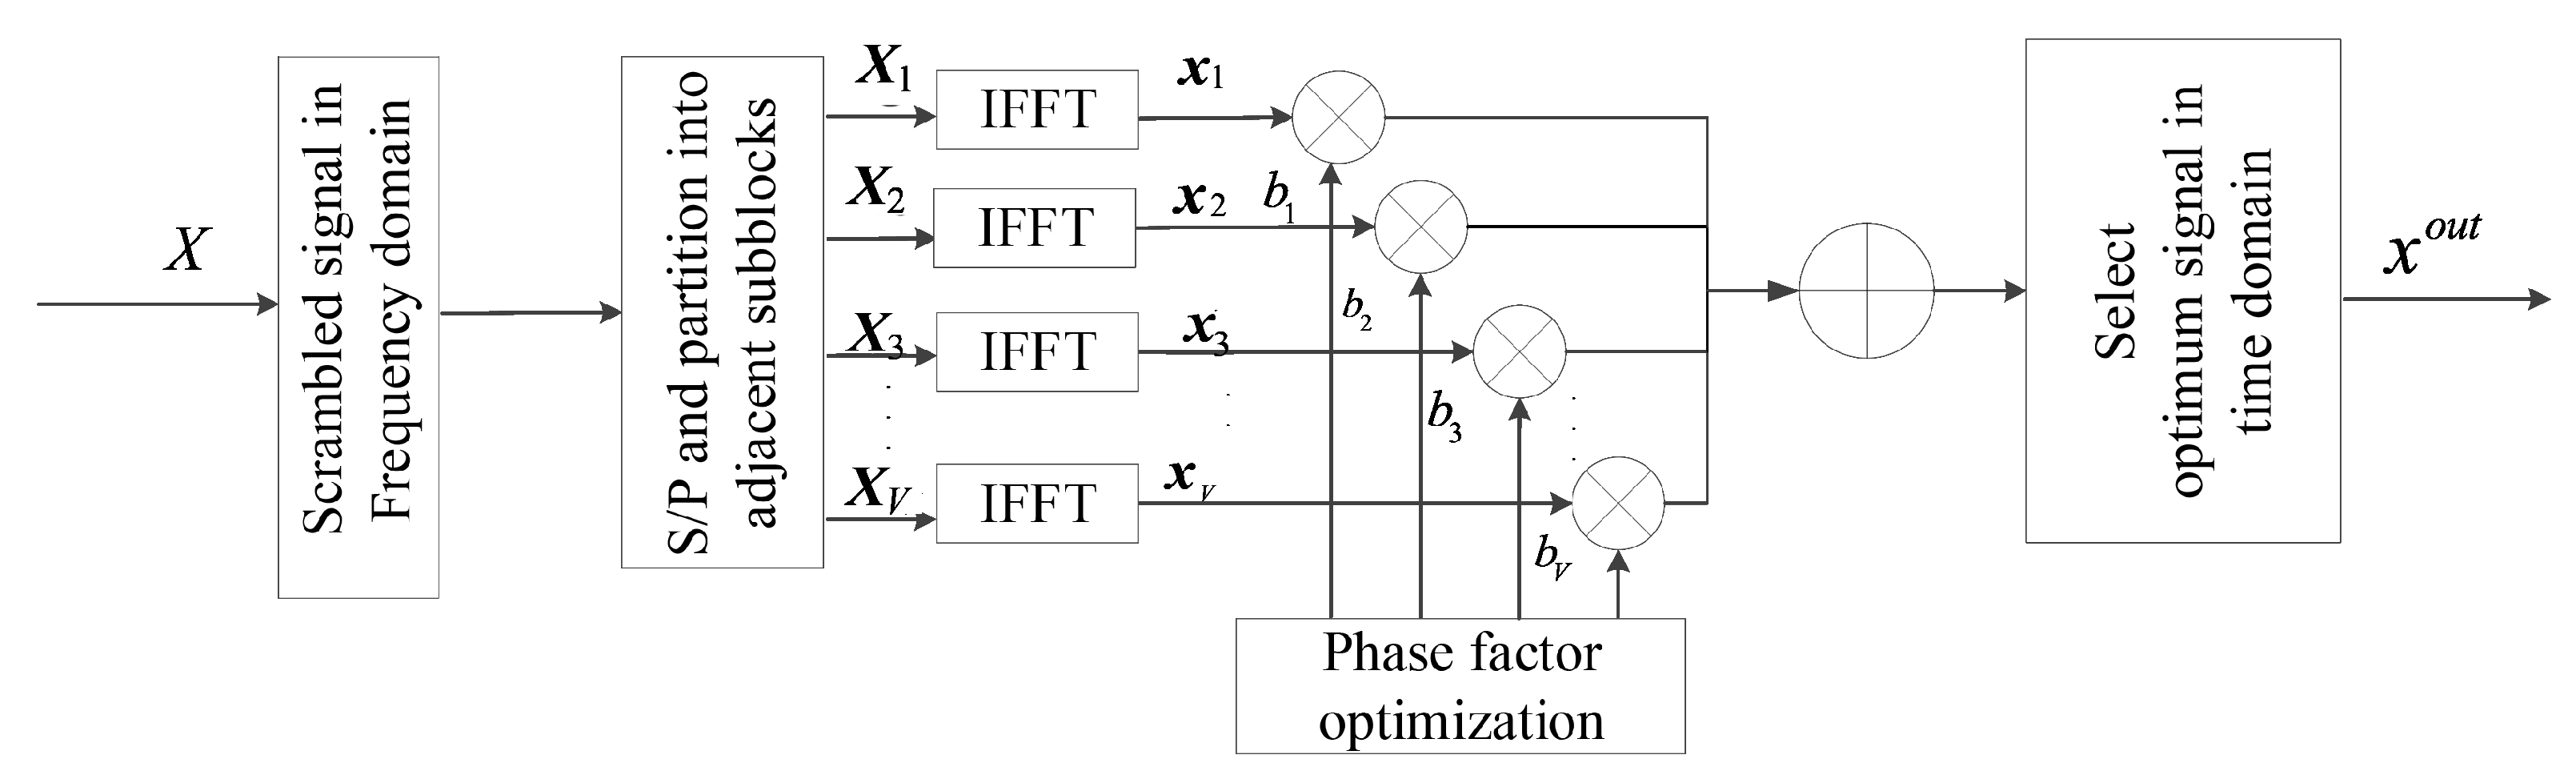
Section 3 introduces the conventional PTS scheme and analyzes its computational complexity.
Section 4, exploring the relationship between the PTS signals correlation and PAPR, proposes a low-computational-complexity F-PTS scheme based on a multiobjective optimization algorithm.
Section 5 improves the F-PTS algorithm and proposes a FTD-PTS algorithm based on the time- and frequency-domain joint evaluation algorithm, which achieves the best PAPR reduction performance within an acceptable computational complexity.
Section 6 presents the simulation results of F-PTS and FTD-PTS.
4. Low-Computational-Complexity F-PTS
Simply put, PAPR is due to the superposition of the peak amplitudes in the adjacent subcarriers, which produces a resonance like effect; it can be inferred that a frequency-domain phase-discretization technique would exist to reduce the probability of PAPR generation.
For evaluating dispersion, the difference in correlation
between rotation factors is analyzed in this section. Assuming that
from
is a sequence of independent complex numbers following
. The correlation among two random signals can be represented as:
where
and
[
28] represent two random signals and
represent corresponding frequency-domain signals. Defining
, after simplification, (13) can be written as:
Substituting a random partitioned standard
and defining the correlation of two random signals as
, (14) can be transformed into:
When
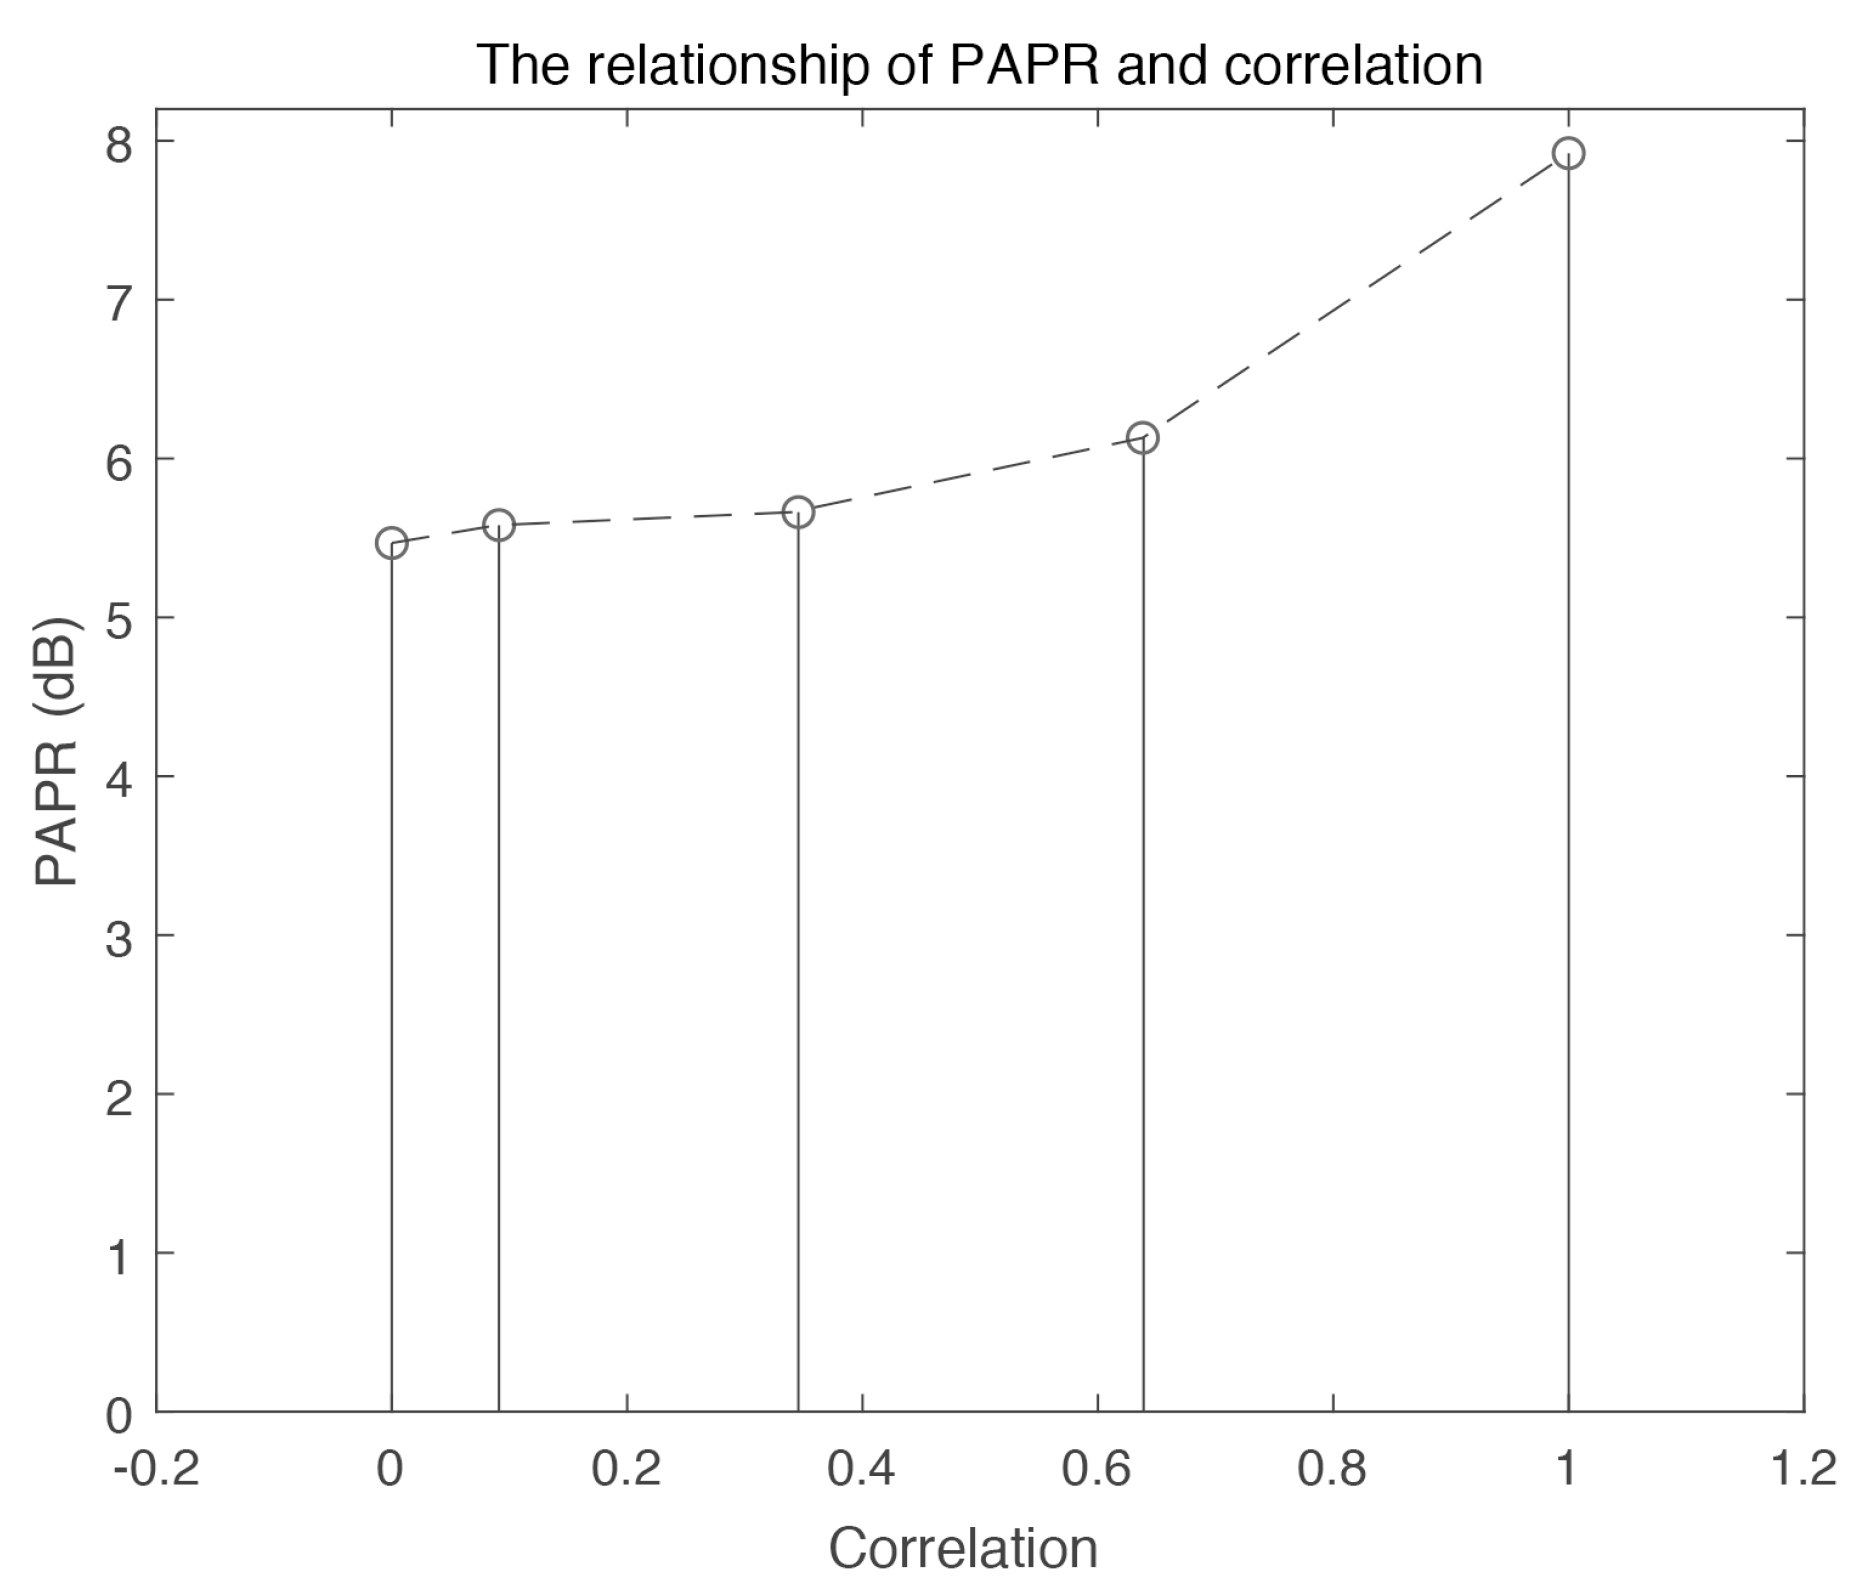
, the correlation of two random points in an identical signal can be evaluated applying (15) and the relationship of PAPR and
is shown in
Figure 3. In general, a scrambled signal with the highest PAPR is provided for reference when the correlation is one; the PAPR increases with the rise of
. Since the positions of the high
signal’s high-amplitude are centralized, a high PAPR is inevitable. Low
can be obtained by increasing the dispersion of phase factors. We assumed that the highest PAPR signal was chosen, whose uncorrelation signal has a minimum PAPR, with a large
.
The above-mentioned analytical result can represent the correlation characteristic in the time domain only, to simplify the complexity of the PTS scheme, and the relationship of the PAPR and frequency domain signals are discussed in following contents. The correlation among two random signals
and
according to (16) can be represented as [
28]:
where
represent two random signals.
and
occupy different phase factors which can be represented as:
is described as the correlation between two random signals; therefore, the range of
can be expressed as:
where the correlation of two candidate signals
mainly depends on the variety
Q. Thus, the maximum
is obtained when
Q = 1, which leads to the approximate PAPR.
In conclusion, the uncorrelation characteristic of the original signal and the scrambled signal is desirable, because the probability of a peak amplitude appearing in the same position in and in the scrambled signal can be minimized in this way.
In the F-PTS technique, dispersion in the frequency domain was evaluated by spacing multiobjective (SMO) optimization was adopted, and the candidate signal with the most dispersion phase factors was chosen.
MO optimization is widely used in various industries and has achieved remarkable success; it is aimed at finding the optimum solution among multiple objectives. Spacing multiobjective (SMO) optimization can tackle engineering problems and has been applied in F-PTS for evaluating phase factors dispersion [
29].
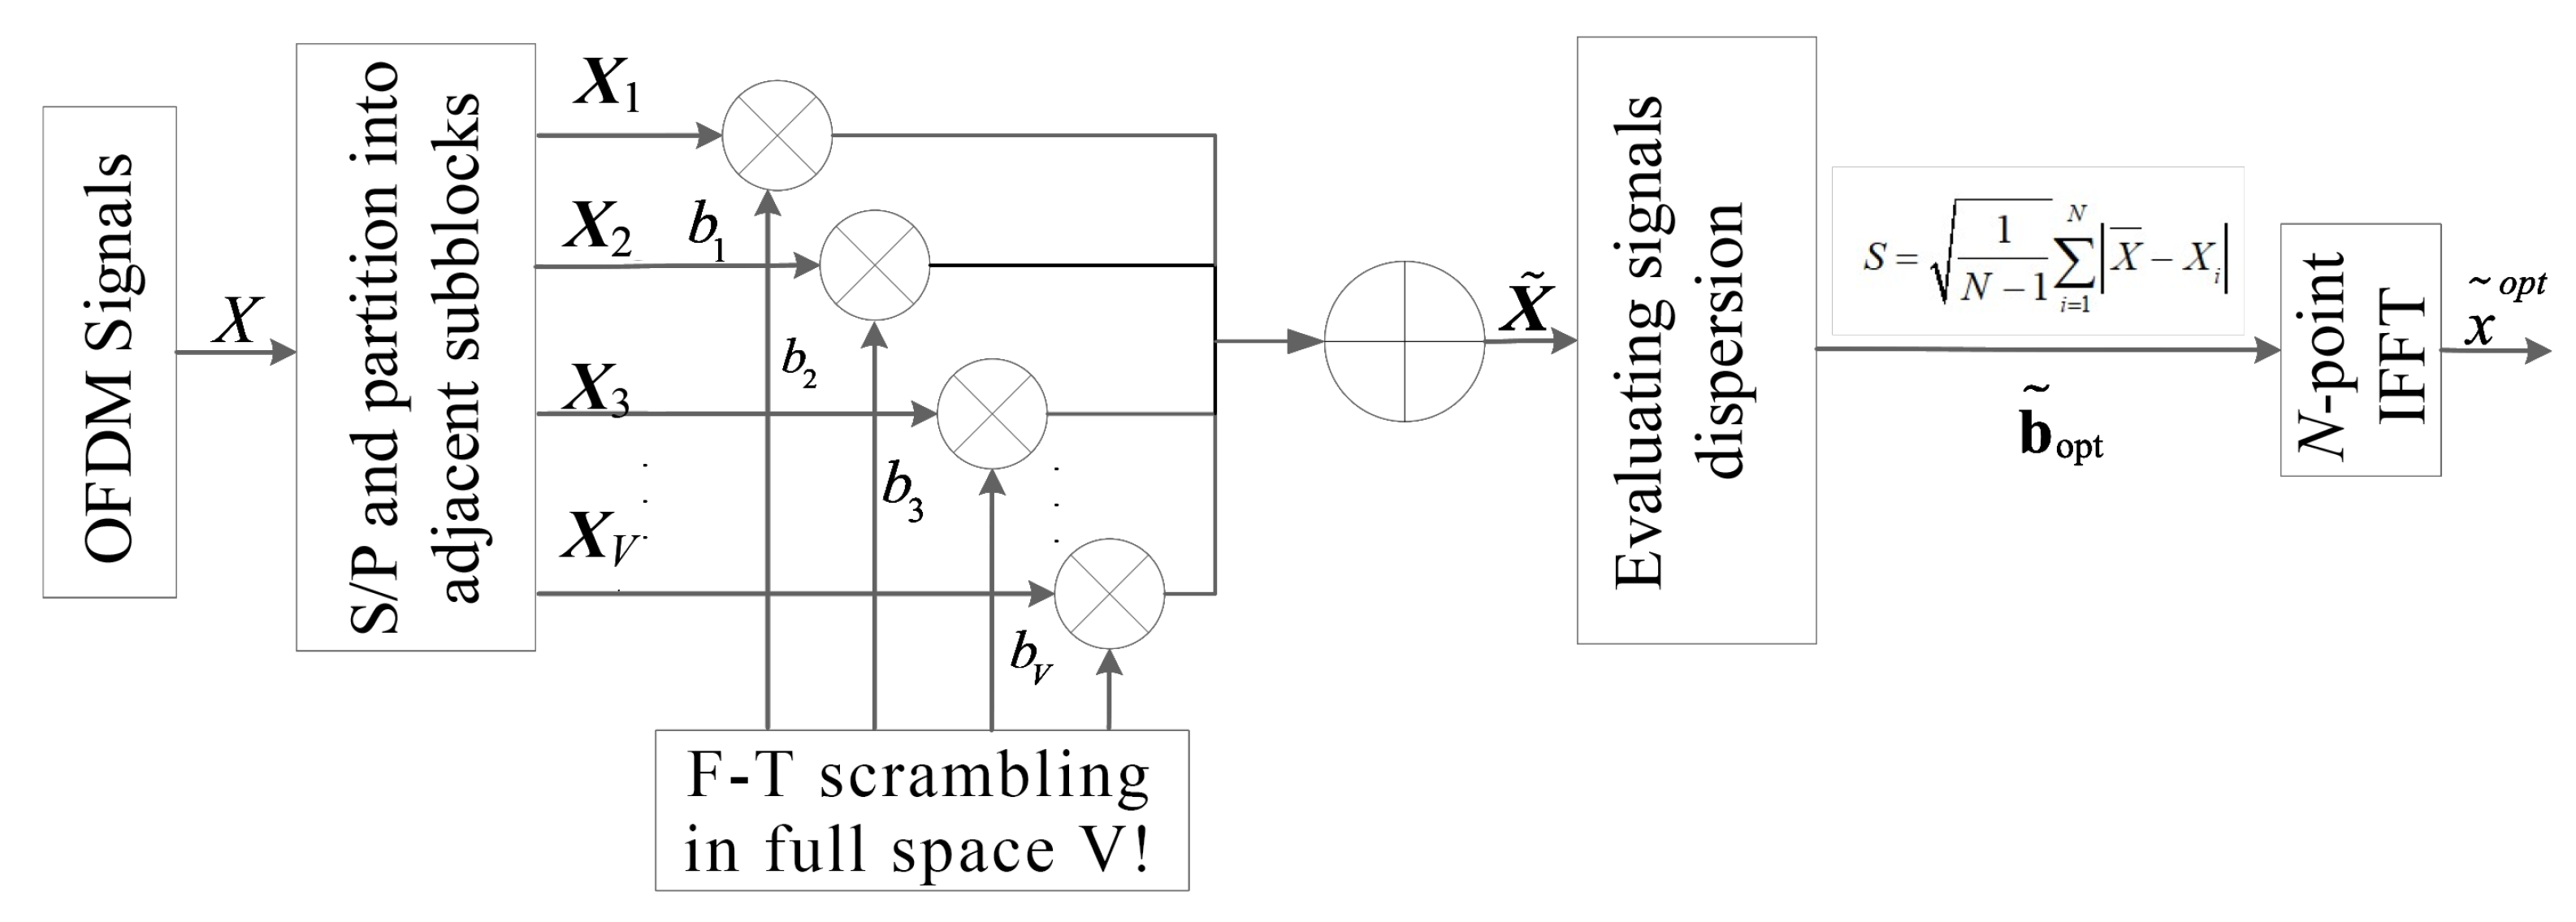
Figure 4 illustrates the system model of the F-PTS scheme: signals were scrambled in the frequency domain, and the signal with the best phase factors dispersion was chosen by SMO and sent to the transmitter after the IFFT transmit. The operation of sub-blocks scrambling and partition can be described as:
where
are the frequency signals after scrambling. To achieve the maximum difference in the signal’s correlation, SMO optimization is introduced, which can be represented as follows:
where
is the plural form of significant points,
is the mean value of all points and
is the ith frequency signal from
. When
, the scrambled signals reach the most discrete state, the dispersion of the constellation gets worse with the increase of S. Therefore, the
V! combinations’ dispersion can be examined as follows:
where
is the scrambled signal combination with the best dispersion.
After applying the above method to evaluate the dispersion of the phase factors combination in the frequency domain, the signal with the most discrete phase factors can been transmitted, which can be expressed as:
where
is the most scrambled signal.
The F-PTS technique applied with a spacing algorithm can be described as Algorithm 1.
| Algorithm 1 F-PTS with low computational complexity |
| Input: OFDM signal in the frequency domain |
| Output: OFDM signal in the time domain with the compromise optimal PAPR reduction performance |
| 1: Begin |
| 2: Initialize the data of the OFDM system |
| 3: Generate groups of phase factors combinations as |
| 4: for do |
| 5: Partition the OFDM signal as: |
| 6: for do |
| 7: Apply the adjacent partition method |
| 8: end for; |
| 9: end for; |
| 10: |
| 11: function MERGER() |
| 12: for
do |
| 13: Scramble the signals as: |
14: Evaluate the frequency-domain signal dispersion as:
|
| 15: end for |
| 16: Select the signal with the best dispersion: |
| 17: Compute the per se signal PAPR as result |
| 18: return
|
| 19: end function
|
| 20: F-PTS achieves suboptimal PAPR reduction performance and outputs an OFDM signal with low PAPR. |
| 21: End |
The algorithm and structure of the F-PTS system are shown in
Figure 4 and
Figure 5, where F-T indicates frequency domain.
The complexity of the F-PTS technique with the SMO algorithm can be represented as:
and,
where
is the complexity of the SMO algorithm, the addition and subtraction operations are both
and the quadratic operation is
.
Signals with higher frequency-domain dispersion performance have a lower probability to produce high PAPR, which is considered as a suboptimal algorithm.
The proposed F-PTS scheme first chooses the scrambled signal with the highest frequency dispersion, then avoids massive IFFT calculation complexity. Since the peak amplitude superimposition can be avoided by evaluating dispersion, only one IFFT is required and a compromise performance can be obtained by the F-PTS technique. As a result, the complexity is dramatically reduced.
5. Frequency-Domain and Time-Domain Evaluation of the PTS (FTD-PTS) Method
The proposed FTD-PTS scheme aims to find the optimal solution with a reasonable computational complexity.
To further explore whether PAPR is only affected by
, the
mth candidate signal can be expressed as:
so that the power of signal
can be described as:
where
and
.
can be converted into the sum of
and
, so that (2) can be transformed as follows:
Equation (
27) shows that the rotation factors and amplitude affect the PAPR performance jointly.
The probability of F-PTS to choose the preferred PTS subject from the full space is much better than that of the conventional PTS. In other words, must have a good dispersion characteristic.
When only frequency-domain dispersion was considered in SMO, there was reduction of probability that high PAPR appears. A novel scheme applied in this section combined dispersion evaluation with affordable complexity, hope to obtain the optimal phase factors combination.
The FTD-PTS scheme is shown in
Figure 6, where T-T indicates time domain; the frequency-domain dispersion evaluation is conducted before the time-domain one and
Q groups included the preferred PTS subject are chosen more likely, instead of randomly selecting
M groups. The optimal solution
is exhaustively searched after finding the preferred PTS subject and is transformed into the time domain. By iteration, the minimum
Q is obtained to ensure that
could be chosen, and to minimize the computational complexity as much as possible.
The main steps of the FTD-PTS technique are described in Algorithm 2.
FTD-PTS method is illustrated in
Figure 4. Initially, the input signals are partitioned and scrambled as follows:
where
is the generated candidate signals in the frequency domain. Then, the signals’ dispersion is evaluated, and the preoptimization
Q groups of high-dispersion candidate signals are as follows:
where
is the
ith frequency-domain signal from
. As the discrete center,
is the mean value of all constellations. The dispersion performance gets worse with the increase of SMO.
| Algorithm 2 FTD-PTS obtains optimum PAPR reduction performance with regular computational complexity |
| Input: OFDM signal in the frequency domain |
| Output: |
| 1: Begin |
| 2: Initialize the data of the OFDM system |
| 3: for do |
| 4: Partition the OFDM signal as: |
| 5: for do |
| 6: Apply the adjacent partition method |
| 7: end for; |
| 8: end for; |
| 9: |
| 10: function Merger() |
| 11: for do |
| 12: Scramble signals as: |
13: Evaluate the frequency-domain signal dispersion as:
|
| 14: end for |
| 15: for
do |
16: Scramble the OFDM signal in the time domain as:
|
| 17: end for |
| 18: Select Q groups of preferred FTD-PTS subsets from the full space based on the SMO algorithm |
19: for do Search the optimal factor as:
|
| 20: end for |
| 21: Select Q groups of signals with the best dispersion |
| 22: Select the best combinations from Q candidate signals as FTD’s PAPR |
| 23: while
do |
| 24:
|
| 25: Select the best combinations from Q candidate signals as FTD’s PAPR |
| 26: end while |
| 27: Output the minimum preselected space Q |
| 28: Compute the per se signal PAPR as result |
| 29: return |
| 30: end function |
| 31: FTD-PTS achieves optimal PAPR reduction performance and outputs the OFDM signal with the lowest PAPR. |
| 32: End |
Thirdly,
Q groups of candidate signals are converted into disjoint sub-blocks and scrambled with phase factors after passing the IFFT blocks as follows:
Finally, we search for the best combinations
from
Q candidate signals. The experiment result shows that the statistical probability approaches stability when the sample space is large enough, which satisfies the principle of probability.
The flow chart of FTD-PTS can be seen in
Figure 7; the minimum preiteration space
Q can be obtained by feedback.
F-PTS only conducts one IFFT calculation, and utilizing the low-complexity frequency-domain dispersion evaluation instead of exhaustively searching in PTS achieves an extremely low complexity.
FTD-PTS maintains an affordable system complexity, combining a frequency-domain evaluation and a search for Q best phase factors combinations to achieve a reasonable complexity.
The complexity of FTD-PTS can be described as:
and,
where
and
represent the additive and multiplicative complexities, respectively. FTD-PTS has the same approximate complexity as PTS.
Overall, the three techniques’ computational complexity is mainly concentrated on the multiplier; F-PTS has the least complexity and FTD-PTS and PTS have a similar one as expressed in
Table 2.
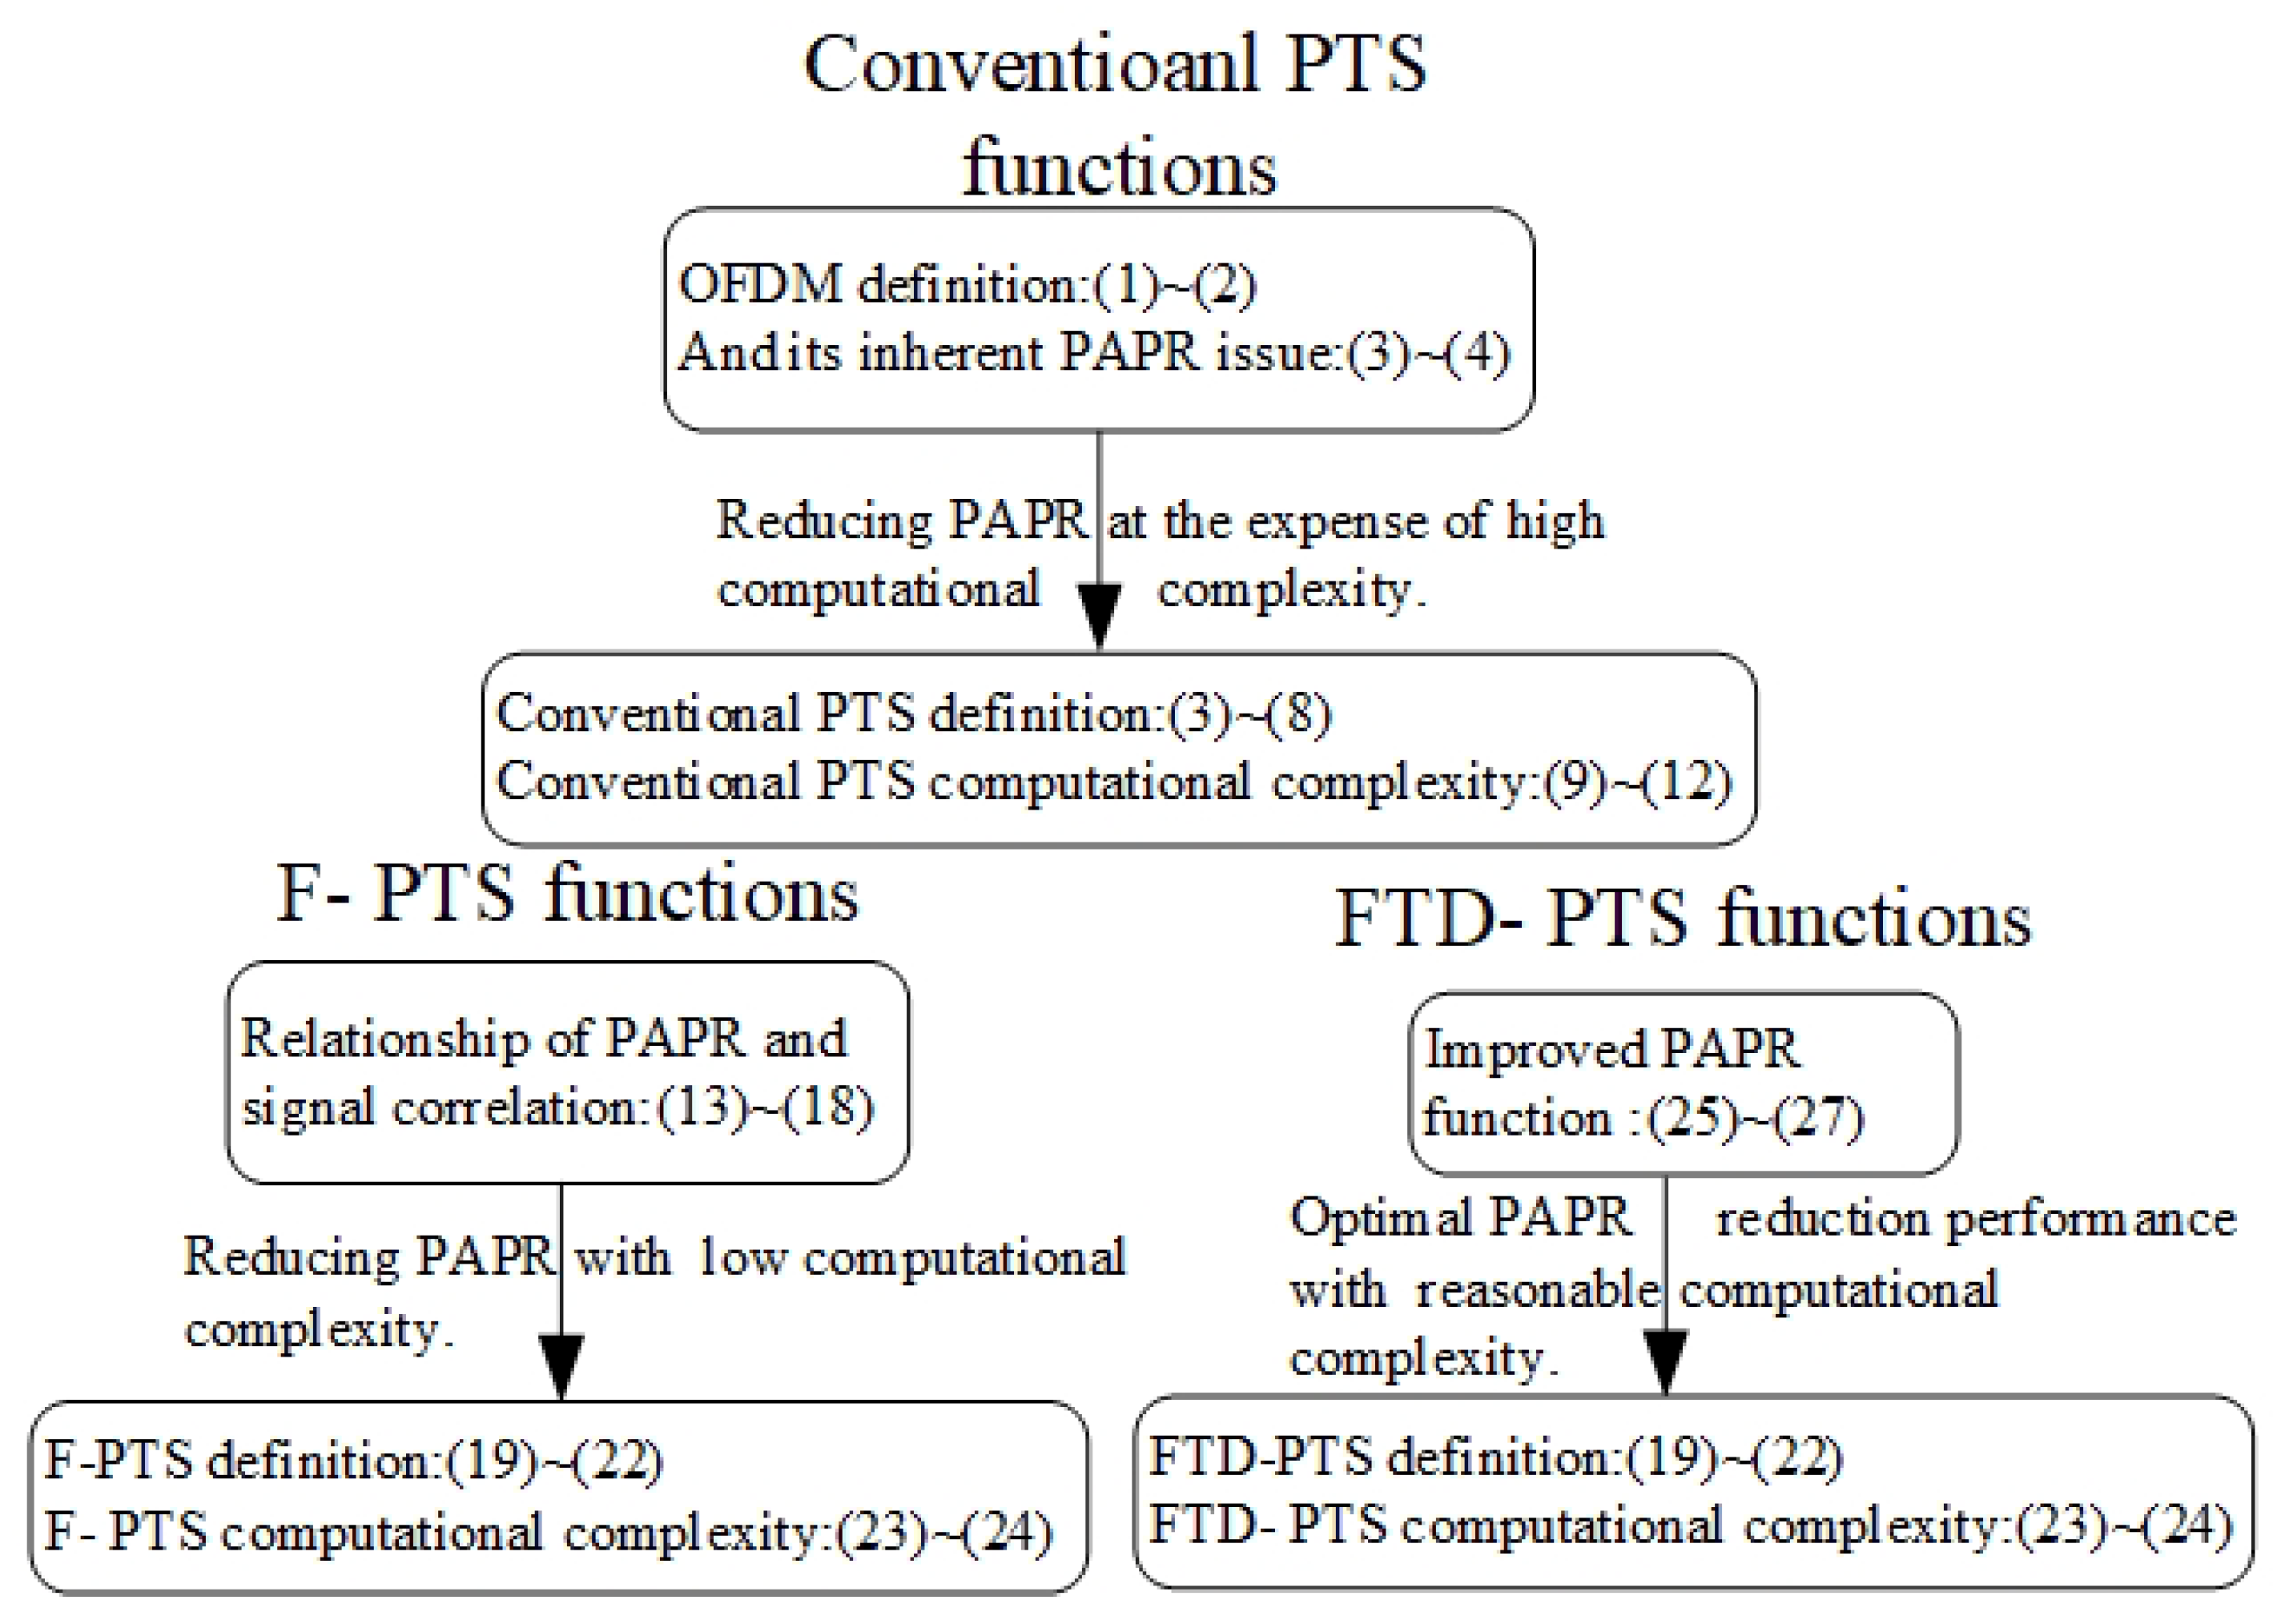
To provide a general understanding of all functions in this paper, this section separates all functions into three parts: conventional PTS, F-PTS and FTD-PTS. The overview of all functions is shown in
Figure 8.
6. Simulation Results and Discussion
In this chapter, the PAPR reduction performance is shown for the proposed F-PTS and FTD-PTS schemes. Each OFDM signal was modulated by 64 QAM and
OFDM data blocks are generated. In F-PTS, the phase factors numbers were selected as
v = 6, the phase partition numbers
W =
V were the same as above, and we adopted a random partitioning method. The parameter setting of the FTD-PTS scheme was identical as that of the F-PTS scheme. All the simulations were completed in MATLAB. The parameters of the simulations are shown in
Table 3.
To demonstrate the relationship between complexity and PAPR reduction performance,
Figure 9 compares the PTS performance with different candidate signals numbers. The exhaustive searching from PTS generates an extremely high computational complexity. For this issue, search was only performed
M times. The comparison of the PTS performance with different
M is shown as
Figure 9; the PAPR reduction performance ascends when the number of sub-blocks is growing, because the probability of choosing the best combinations is growing.
6.1. F-PTS Simulation
F-PTS avoids the extensive IFFT and PAPR calculation workload and employs the SMO dispersion evaluation criterion to select the best dispersion scrambled frequency-domain signals. When , compared with the OFDM system, the conventional PTS, F-PTS and optimal PTS techniques reduce PAPR by 3 dB, 3.3 dB and 3.5 dB, respectively. Since the computational complexity of the SMO dispersion evaluation criterion is much lower than that of the IFFT and PAPR, F-PTS is a computational-complexity-friendly algorithm. The suboptimal performance can be obtained by applying dispersion as the evaluation criterion.
In
Figure 10 and
Table 4, we applied
W =
V = six phase factors and generated 720 phase combinations. The PAPR reduction from best to worst are the optimal PTS scheme, which exhaustively searched the 720 phase combinations, F-PTS, which applied best dispersion phase combinations, PTS, which searched 32 phase combinations, and the OFDM system without PTS, with values of 7.9 dB, 8.1 dB, 8.3 dB and 11.2 dB, respectively, with CCDF =
. As shown in
Figure 10, similar performance was obtained by optimal PTS and F-PTS. For example, optimal PTS and F-PTS had values of 8.0 dB and 8.2 dB for CCDF =
, respectively. In the meantime, F-PTS obtained an extremely low complexity. In conclusion, the performance of F-PTS is better than that of PTS when
m = 32, and slightly inferior to that of PTS when
m = 720, with extremely low complexity. The complexity of F-PTS was almost 50% of PTS.
6.2. FTD-PTS Simulations
F-PTS reduced computational complexity but failed to reach the optimal PAPR reduction performance. FTD-PTS is an enhanced version of F-PTS. It adopts the time- and frequency-domain joint evaluation algorithm to preselect the phase factors combinations containing the optimal solution, obtaining the optimal PAPR reduction performance with an acceptable calculation complexity.
In
Figure 11 and
Table 5, we applied
W =
V = six phase factors and generated 720 phase combinations. The PAPR reduction performance comparison of FTD-PTS and conventional PTS when
is given in
Table 6. When
, FTD-PTS and conventional PTS decreased PAPR by 3.0 dB and 2.0 dB, respectively, and FTD-PTS decreased PAPR by 1 dB more than conventional PTS; when
, FTD-PTS and conventional PTS decreased PAPR by 3.3 dB and 2.5 dB, respectively, and FTD-PTS decreased PAPR by 0.7 dB more than conventional PTS; when
, FTD-PTS and conventional PTS decreased PAPR by 3.6 dB and 3.1 dB, respectively, and FTD-PTS decreased PAPR by 0.5 dB more than conventional PTS; when
, FTD-PTS and conventional PTS decreased PAPR by 3.8 dB and 3.0 dB, respectively, and FTD-PTS decreased PAPR by 0.8 dB more than conventional PTS. Note that FTD-PTS reaches the optimal PAPR reduction performance when
. It can be concluded that FTD-PTS has a lower computational complexity than conventional PTS to achieve a better PAPR reduction performance.
To further represent the achievement of this paper,
Figure 12 compares the PAPR reduction performance of conventional PTS, the FTD-PTS (with Q = 5, Q = 30 and Q = 40), and PSO-PTS (with iterations = 5, iterations = 30, iterations = 40). Because the particle velocity and position require an update in each iteration of PSO, the computational complexity of PSO-PTS rises sharply with the increase of the iterations. For a fair comparison, the alternative phase factor of FTD-PTS and PSO-PTS iterations are the same. The PAPR reduction performance comparison of FTD-PTS and PSO-PTS when
is given in
Table 7. When
, FTD-PTS and PSO-PTS decreased PAPR by 3.2 dB and 2.6 dB, respectively, and FTD-PTS decreased PAPR by 0.6 dB more than PSO-PTS; when
, FTD-PTS and PSO-PTS decreased PAPR by 3.6 dB and 3.2 dB, respectively, and FTD-PTS decreased PAPR by 0.4 dB more than PSO-PTS; when
, FTD-PTS and PSO-PTS decreased PAPR by 3.8 dB and 3.3 dB, respectively, and FTD-PTS decreased PAPR by 0.5 dB more than PSO-PTS. Note that FTD-PTS reaches the optimal PAPR reduction performance when Q = 40. It can be concluded that FTD-PTS has a lower computational complexity than PSO-PTS to achieve better PAPR reduction performance.
7. Conclusions
This paper introduced two novel PTS techniques. F-PTS achieved a 91.8% optimal PAPR reduction performance (0.35 dB less) using 50% operation time compared to conventional PTS, which reduced the computational complexity of multiplier operations dramatically and maintained a compromise PAPR reduction performance.
FTD-PTS adopts a time- and frequency-domain joint evaluation algorithm and expands the candidate signal space for the dispersion evaluation. FTD-PTS improved by 18.7% the PAPR reduction performance (0.6 dB) compared to conventional PTS with a similar computational complexity, which reached the optimal PAPR reduction performance within a reasonable computational complexity and therefore can meet the demand of reducing PAPR in large data transmission systems.
Compared with other research results, the FTD-PTS algorithm improved PAPR reduction performance by 15.1% (0.45 dB) compared to PSO-PTS with a similar computational complexity.
In the future, further development of PAPR reduction schemes can be made in the following directions: enhancing the multicarrier system; redesigning the PAPR reduction schemes optimization objectives; combining artificial intelligence algorithm and PAPR reduction scheme.


