Article

A Novel Torque Matching Strategy for Dual Motor-Based All-Wheel-Driving Electric Vehicles

1
Department of Mechanical Engineering, Sungkyunkwan University, Suwon 16419, Korea
2
Automotive Material & Component R&D Group, Korea Institute of Industrial Technology, Gwangju 61012, Korea
*
Author to whom correspondence should be addressed.
Energies 2022, 15(8), 2717; https://doi.org/10.3390/en15082717
Submission received: 28 February 2022 / Revised: 29 March 2022 / Accepted: 30 March 2022 / Published: 7 April 2022
(This article belongs to the Topic Power Distribution Systems)

Abstract

:
The market for electric vehicles is growing rapidly. Among them, the demand for a dual motor type 4 WD (Four -Wheel Driving) system is increasing. In this paper, we present the Torque Matching Strategy (TMS) method to select the optimal torque distribution ratio for dual motors. The TMS controller operates to set the optimal efficiency point by linearizing the drive efficiency combination of the two motors. Driving simulation and testing were performed through five drive cycles in the driver model interworking environment implemented in MATLAB and Carsim. The optimal distribution ratio was derived according to the front and rear gear ratios under the load condition, and the driving was verified by comparing it with the TMS control method. The efficiency was numerically verified by comparing the power loss of the driving motor. It reduced up to 34% in Urban Dynamometer Driving Schedule and up to 56.3% in Highway fuel efficiency test. The effectiveness of the TMS control method was demonstrated through the distribution rate trend based on the operation cycle and power loss.

1. Introduction

Globally, carbon emission regulations are being applied as a countermeasure to address problems related to air pollution and climate change. In line with carbon emission regulations represented by carbon-pricing, the production of zero-emission electric vehicles is continuing to expand. Despite the rapid growth of electric vehicles, soaring prices are making it difficult for consumers to adopt this technology [1,2]. The battery accounts for a high percentage of the price of an EV, and the capacity of the battery is a factor that cannot be overlooked. Motors are a major contributor to power loss in electric vehicle powertrains [3]. Accordingly, considerable research has been conducted to increase the driving efficiency as well as the efficiency of the battery itself. Loss minimization control (LMC) is used to calculate and apply losses according to design variables, or to control them through real-time control based on models or physics [4].
Most current EV configurations are applied with a two-wheel drive method with a single motor connected to a single axle [5]. At present, the single-motor powertrain is predominant, but a dual-motor four-wheel drive (4WD) type vehicle connected to two axles is being launched in the premium EV market [6,7,8]. Four-wheel drive has the advantage of rough road speed or towing ability compared to general 2 WD, but inevitably, the decrease in fuel efficiency is the biggest disadvantage [9]. In order to solve the problem of fuel efficiency, internal combustion engines distribute driving force using various methods [10]. However, in electric vehicles, it is distributed to the front and rear wheels through a transfer case. Since the loss caused by additional devices such as the drive shaft, differential, and transfer case are small, fuel efficiency can be improved depending on the situation. In fact, In fact, in the automobile industry, 4 WD EVs market is increasing for efficiency and performance. To improve efficiency, a combination of motors with different dominant efficiency region (DER) characteristics is applied [11].
Studies on power distribution have been conducted based on the movement that minimizes loss or the power consumed by each wheel. L. De Novellis et al. examined cost minimization for the wheel torque allocation of electric four-wheel individual drive vehicles, focusing on minimizing tire slip power loss [12,13]. A.M. Dizqah et al. devised a driving method that minimizes loss when driving a four-wheel individual drive vehicle. An optimal torque distribution was formulated as a solution to the parameter optimization problem according to vehicle speed [14]. K. Cao et al. conducted a study to improve efficiency and performance through torque distribution that optimizes wheel slip in dual-motor-based four-wheel drive vehicles [15]. A. Pennycott et al. focused on minimizing power loss during steering by approximating the four-wheel torque distribution function [16]. J. Wang et al. established a driving strategy by synthesizing power loss factors in a four-wheel independent drive vehicle [17].
However, even though many studies have been conducted on the dynamic characteristics and efficiency of vehicles, it is difficult to accurately estimate the characteristics of the applied motor. There is also a difference between the formulated motor and the efficiency curve in actual experiments, so the latter is difficult to accurately predict when applied to an actual vehicle. Even though there is a fuel economy cycle for automobiles, few studies have conducted comparative verification.
Therefore, this paper proposes a torque matching strategy (TMS) method that can minimize loss without formal calculation of motor characteristics based on a verified motor efficiency curve. The system is verified using a reliable user-based driving cycle.
In this paper, based on the designed motor efficiency map, the 4 WD strategy applicable to the upper controller is presented and verified. Figure 1 shows the overall structure of the applied technique. First, for a driving cycle-based simulation environment, a model is designed for a dual motor-based vehicle through driver model and DER calculations. Second, we design and structure a torque matching strategy that determines the torque distribution ratio according to the rotation speed and the required torque. Third, the optimal distribution ratio is derived by simulating the reduction ratio and torque distribution ratio of a 4 WD, and the TMS is verified. Finally, the efficiency of the designed TMS controller is verified by comparing the power loss that occurs in five verified user environment cycles, i.e., EPA Urban Dynamometer Driving Schedule (UDDS), EPA Highway Fuel Economy Test Cycle (HWFET), The California Unified Cycle (LA92), Supplemental Federal Test Procedure (SC03) and EPA New York City Cycle (NYCC) [18].

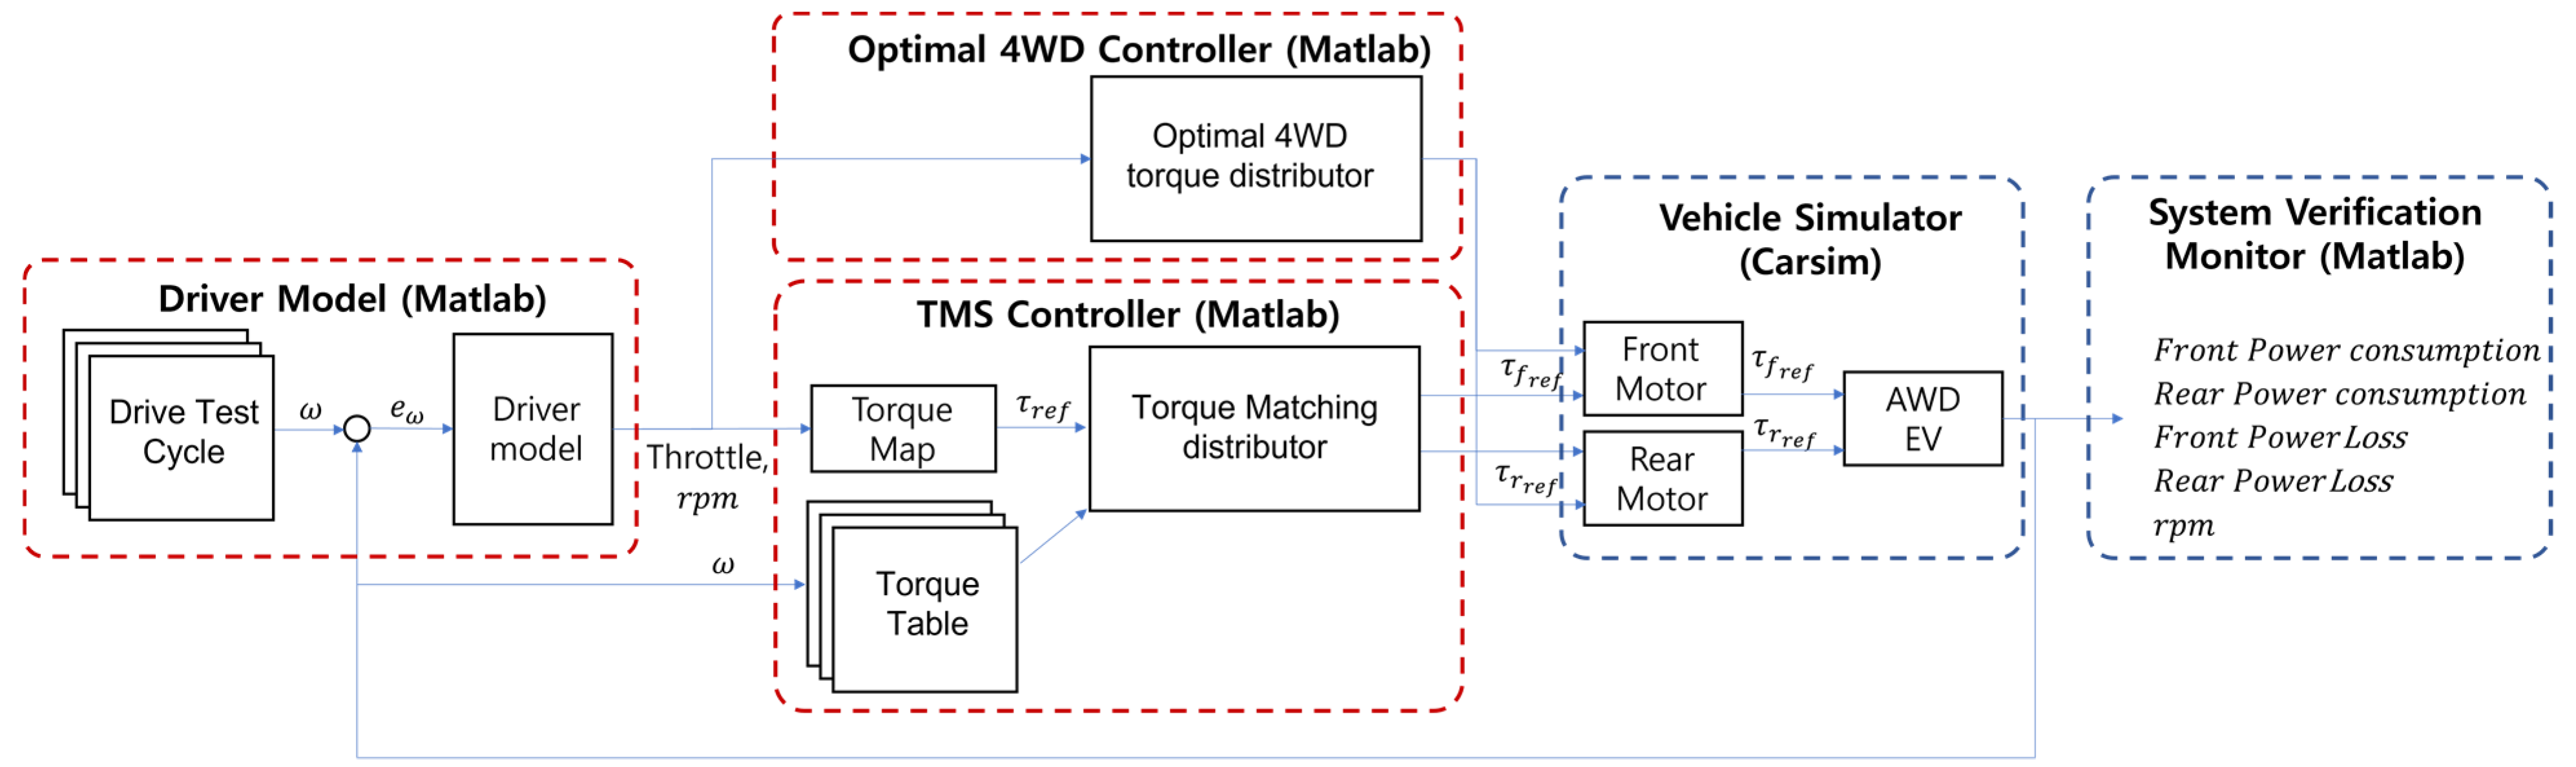
2. TMS Algorithm Verification Environment Configuration

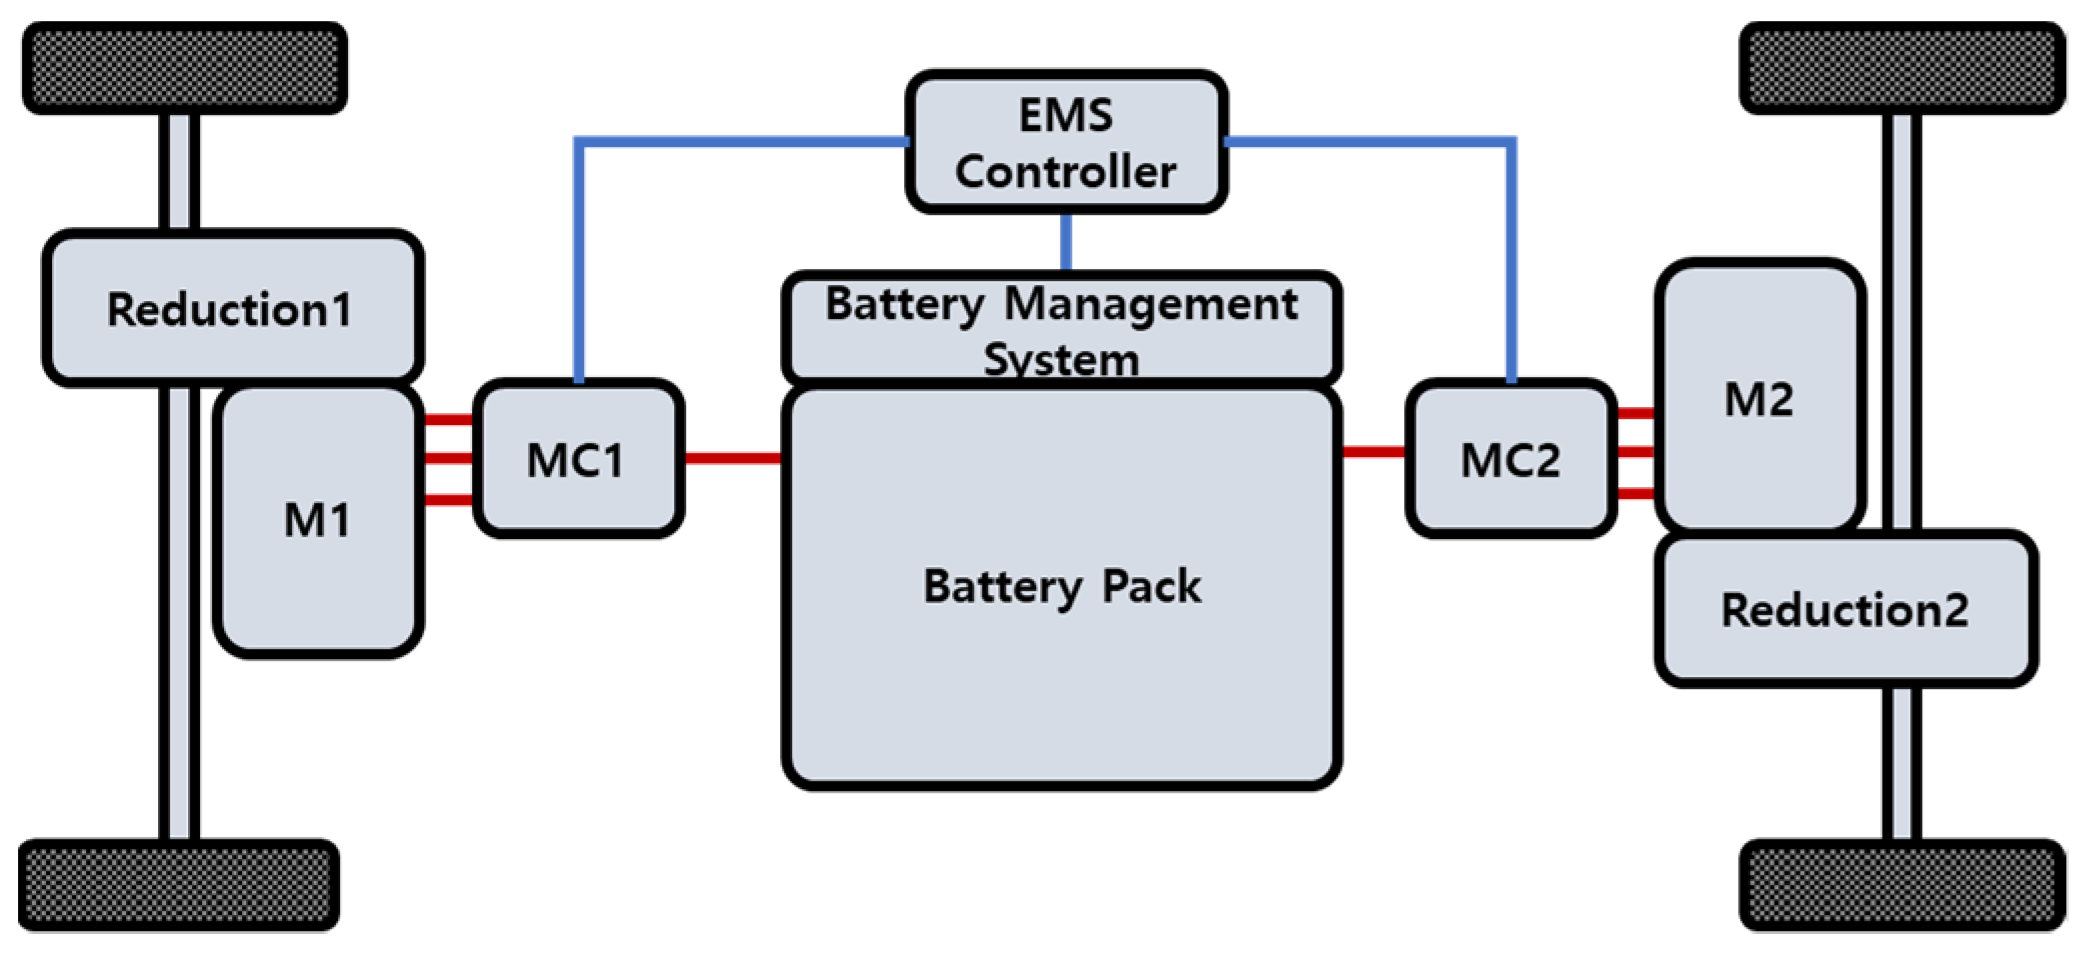
2.1. Dual Motor Based All-Wheel-Drive System Simulation Composition

In this paper, as shown in Figure 2 and Table 1, a dual-motor type all-wheel drive system is used in which drive motors are mounted on both axles of the front and rear wheels. The two driving motors, of permanent magnet synchronous motor (PMSM) type (M1 and M2), are controlled by motor controllers MC1 and MC2. The motor controller has a structure in which the TMS controller controls the torque command from the upper level.
The vehicle’s reduction ratio calculates and applies the characteristics of the target motor through matching with the main driving area data. As the target motor, the 60 kW driving motor of the 2010 Toyota Prius, which shows significant differences in efficiency at specific speeds and torque intervals, was selected. Figure 3 below shows the efficiency contour graph of 60 kW PMSM motor in 650Vdc environment applied to TMS. The data was adapted from 2010 Toyota Prius analysis data. [19,20]. Unlike the transmission of an internal combustion engine vehicle, an electric vehicle uses a final reduction gear.
Depending on the characteristics of the motor, the maximum torque is achieved at low speed, so the need for a transmission is relatively small. Since the characteristics of the vehicle are determined according to the final reduction gear ratio, different output characteristics can be checked according to the reduction gear ratio of the motor. The operating point of the motor can be derived from the axle rotation speed and the torque of the vehicle used in the driving cycle [21].
In this paper, two 60 kW motors are arranged as the front and rear wheels to form a 120 kW setup. Then, the gear ratio is compared with the main driving range of a single motor vehicle. According to the distribution of high frequency operating points, it is possible to confirm the trend in which the efficiency of the motor is used during vehicle operation. It is also possible to determine whether the power consumption of the vehicle is optimal through the designed operating point. To confirm the operating point, the main driving range was evaluated using the most widely used UDDS. Based on the dominant efficiency region (DER) of the 88 kW class PMSM used by the Hyundai Motor Company, the operating point of the driving motor used in mass production vehicles was confirmed.
It was found that the reduction ratio is designed to mainly achieve low torque at a speed close to half the maximum rotational speed in the main driving area used in commercial vehicles [22]. Figure 4 shows the DER of a 4 WD vehicle with reduction ratios of 5:1, 8:1, 10:1, and 12:1, respectively. Compared to the operating point used in commercial vehicles, the closest gear ratio is 8:1 to 10:1; a comparison with the TMS system was performed based on these data.

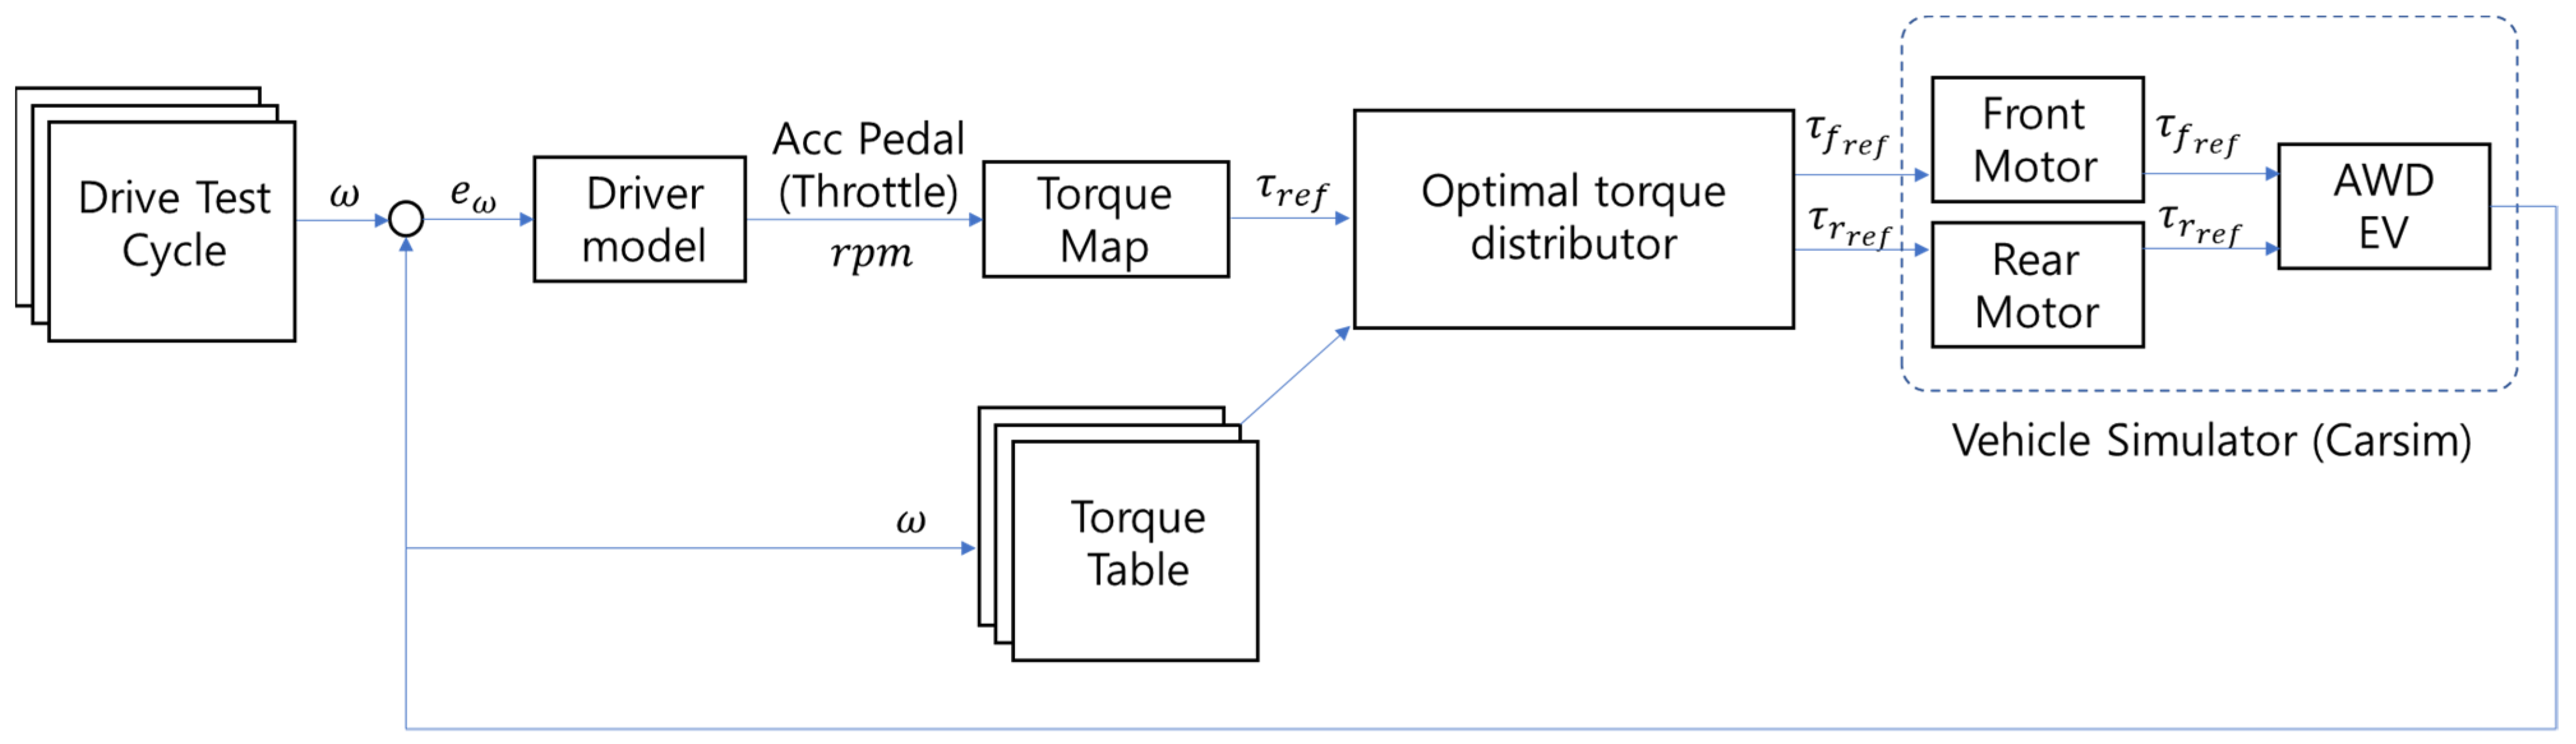
2.2. Simulation Environment Configuration

In order to configure the driving environment of the target vehicle, the driving simulation environment was configured by linking MATLAB Simulink and Carsim. Figure 5 is a simulation environment configured to verify the conventional 4 WD and TMS control performance. Based on the driving test cycle, the upper torque command is calculated through the driver model. A driver model PID controller that adjusts the upper torque command value according to the speed and vehicle condition was designed. The upper torque command value is controlled by transmitting the final torque distribution value to the motor of each axis through the 4 WD and TMS controller, or by dividing it by the brake pressure reference according to the condition. It is configured to use the motor reference torque of the rear axle of the front and rear wheels that is output from Carsim as input torque. The output of each variable from Carsim was classified in the form of a graph or matrix in Matlab and used for verification.

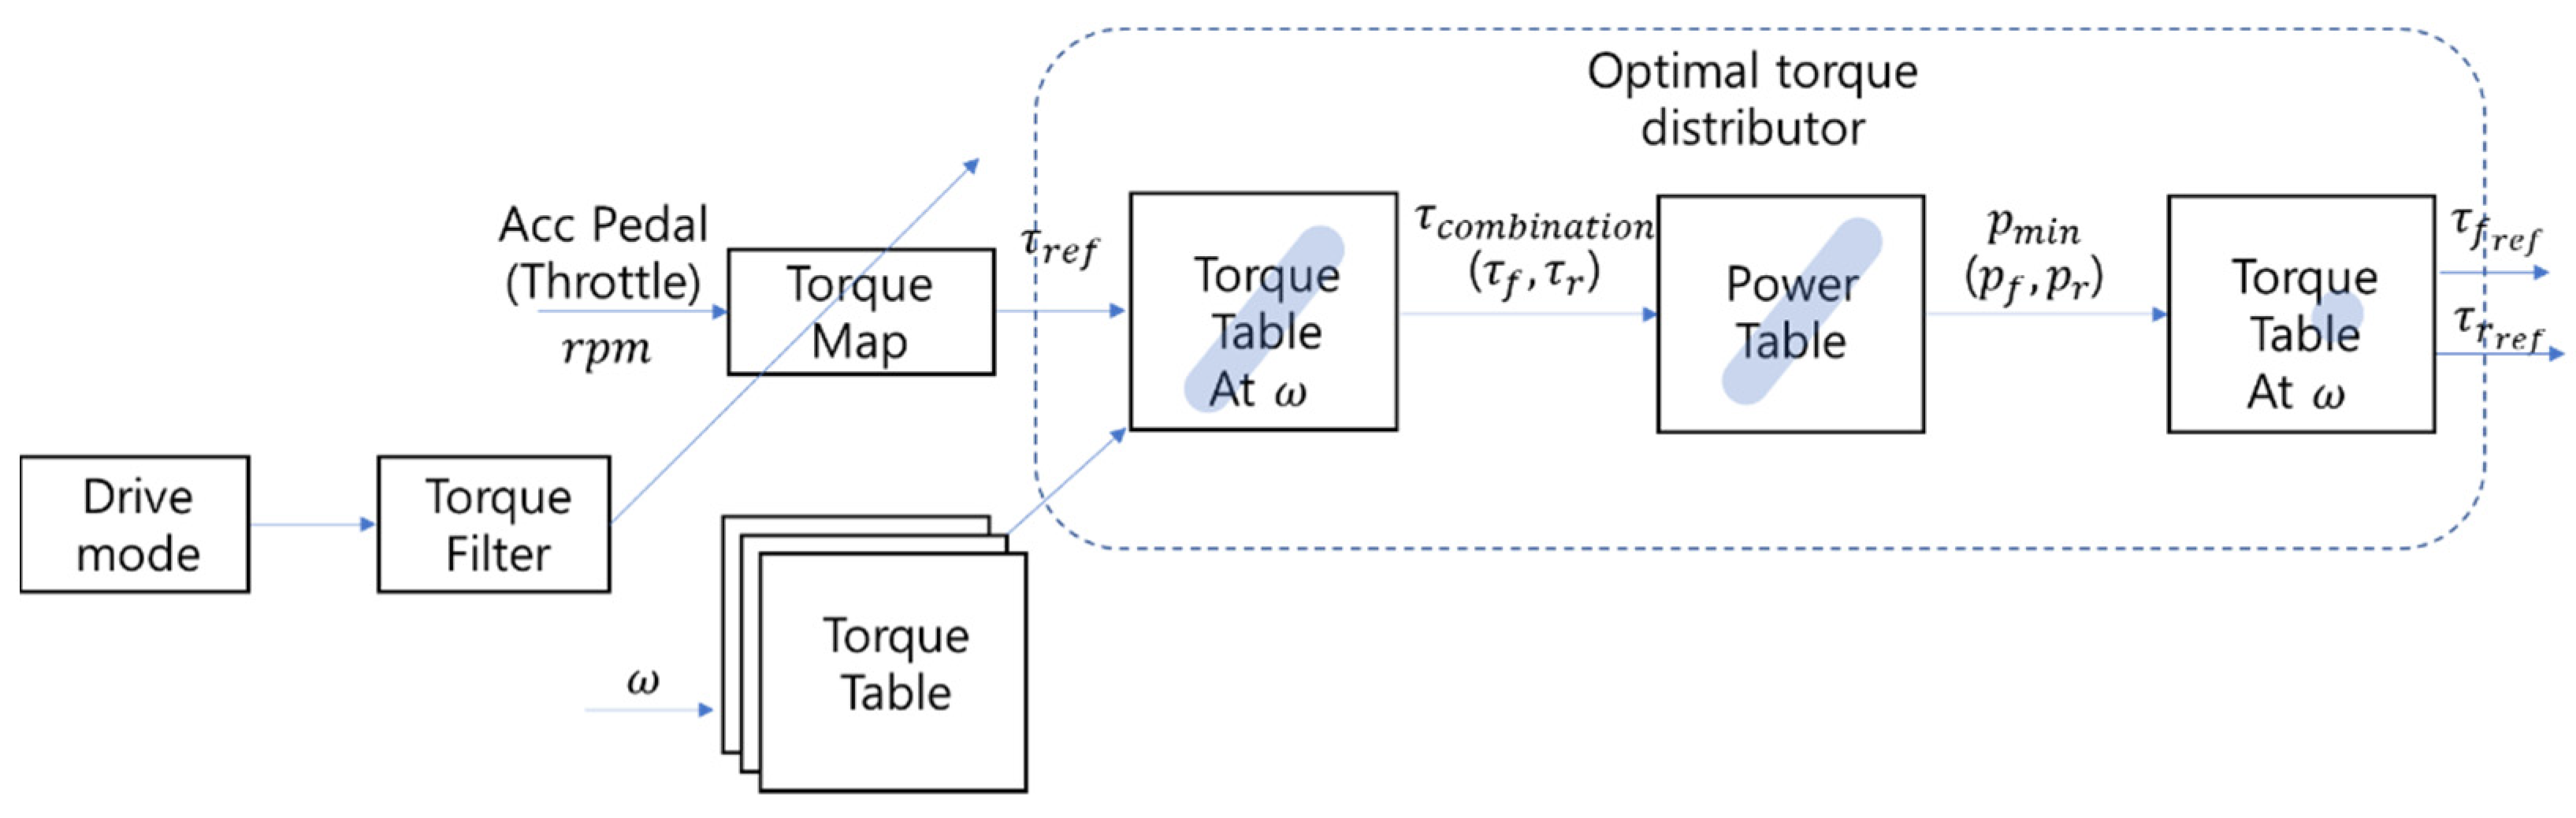
3. Torque Matching Strategy Design

3.1. Drive Torque Distribution Calculation

The output required for actual vehicle driving P v e h i c l e can be expressed as the sum of the front P f _ a x l e and rear P r _ a x l e axle outputs, and the required torque τ v e h i c l e can be determined as the sum of the front τ f _ a x l e and rear τ r _ a x l e axle torque.
P v e h i c l e = P f _ a x l e + P r _ a x l e τ v e h i c l e = τ f _ a x l e + τ r _ a x l e
To check the power consumption, it is necessary to check the state of the vehicle in real time. After the motor is built, it has a nonlinear but fixed efficiency value which can be estimated by three factors. Basically, the rpm and torque of the motor are essential, and the gear ratio of the motor reducer is needed to calculate those values. The power used by the vehicle can be expressed through a motor efficiency map in the form of six variables: the rotation speed ω f , torque τ f , and gear ratio of the front-wheel motor σ f and the rotation speed ω r , torque τ r , and gear ratio of the rear-wheel motor σ r .
P v e h i c l e = f p ( ω f , ω r , τ f , τ r , σ f , σ r )
Since σ f and σ r are constant in a single geared motor environment where the gear ratio of the drive motor is fixed, the power consumption of the vehicle can be calculated using the motor efficiency η f and η r as follows.
P = τ f ω f η f + τ r ω r η r
Since the efficiency value of each motor can be obtained from the contours of torque and rotation speed, it can be defined as a function of rotation speed ω and torque τ . The rotation speed of the motor may be determined through a gear ratio determined according to the driving state of the vehicle. Front η f and rear η r wheel motor efficiency, required to check power consumption, can be simplified as a function of input torque.
η = f ( ω , τ ) g i v e n   ω   :   η f = f ( τ f ) ,     η r = f ( τ r ) P = ω ( τ f f ( τ f ) + τ r f ( τ r ) )
The efficiency values of the front- and rear-wheel motors are simplified in the formula for the distribution ratio as follows:
P m i n = ω τ r e f ( σ o p t i m a l f ( τ r e f σ o p t i m a l ) + ( 1 σ o p t i m a l ) f ( τ r e f ( 1 σ o p t i m a l ) ) )
However, this is not suitable for real-time use, because it is necessary to construct an efficiency graph according to each number of revolutions.
The efficiency point applied to the motor can be expressed as a set of 3D vectors consisting of the number of rotations ω, torque τ, and efficiency η, and can be expressed as a contour or 3D graph, as shown in the Figure 3. The plane P f which is a set of efficiency points applied to the front wheel motor rotating at axle speed ω a x l e , and the plane P r , a set of efficiency points applied to the rear wheel motor, can be expressed as follows:
f : R 3 R ( x , y , z ) P f g r a p h   f = { ( x , y , z )   |   y = ω a x l e } P r g r a p h   f = { ( x , y , z )   |   y = ω a x l e }
The efficiency points η f and η r of the front wheel motor expressed on a plane can be expressed as a vector for torque.
η   : R 2 R ( x , z ) η f = { ( x , z )   | x = τ f r o n t } η r = { ( x , z )   | x = τ r e a r }
At this time, when the torque required for driving is given by the driver, it is arranged as the sum of the torque of the front and rear wheels.
T toal = τ f + τ r H = [ 1 η f 1 1 η r 1 1 η fn 1 η rn ] ,   T = [ τ f 1 τ f n τ r 1 τ r n ]
Since the power P consumed by the drive system is arranged as a product of the reciprocal of the rotation speed and torque efficiency, this can be expressed as a determinant, and the minimum power consumption P m i n and the torque distribution value of the drive system can be confirmed as L .
P = ω axle H T P m i n = P = ω a x l e H T

3.2. Composition of TMS

TMS is an energy control method that adjusts the command values of the torques of the front and rear wheels in order to use the minimum power in a 4 WD vehicle using the front and rear motors. In a motor under the same voltage environment, different efficiencies are determined in terms of rotational speed and output torque according to a given set of design parameters. As this is a characteristic of the motor, it is necessary to determine the design parameters according to the purpose of the vehicle, and many studies are being conducted to obtain high efficiencies [23]. The efficiency map of the designed motor can be estimated as a set of fixed variables under a constant voltage environment as a characteristic of the motor. Therefore, the driving motor of the EV is configured according to the purpose from the design stage for use, and efficiency performance is checked using a motor dynamo, etc. [24,25].
The basic configuration of the TMS can be achieved by matching the efficiency of the two motors. The efficiency curve of the motor can be configured as a 3D graph or a 2D contour graph. For the motor used in this study, the TMS was designed and verified by applying the 2010 Toyota Prius PMSM model used in commercial vehicles.
Figure 6 shows a detailed structural diagram of the TMS system. The throttle of the TMS system is activated by the driver or the autonomous driving controller; the reference torque can then be calculated through a torque map. The input target torque is reconfigured into a drivable torque map for the front and rear wheel motors according to the speed required to set the torque line. The torque line composed of the current input torque value may be used to configure the power line using the motor efficiency map at the corresponding speed. The configured power line indicates the power that is consumed according to the torque distribution ratio of the current front and rear wheel motors. The smallest value indicates the time when the front and rear wheel motors are combined most efficiently; as such, the optimum efficiency point can be found by setting the minimum point. The front and rear wheel target torques derived through the optimum efficiency point are used as control inputs for the vehicle through the inverter.
The TMS system uses matrixed efficiency data to solve the nonlinearity of Equation (2). Since the efficiency of the motor is determined nonlinearly according to the driving rotation speed and torque, it is difficult to formulate it in a single equation. However, the matrixed efficiency data is used as a lookup table in the TMS system and can easily be matched. It is possible to match the torque matrix required by the two motors with the output matrix generated for each torque, and to express the density in the map according to the efficiency.
f η = ( τ f τ r , ω )
When the TMS structure is visualized, it can be configured as a superimposed 3D map, as shown in Figure 7. By matching the optimal efficiency point determined according to the gear ratio of each axle, the torque reference of the vehicle required in real time is set and applied.

4. TMS Operation Verification through Torque Distribution Rate Comparison

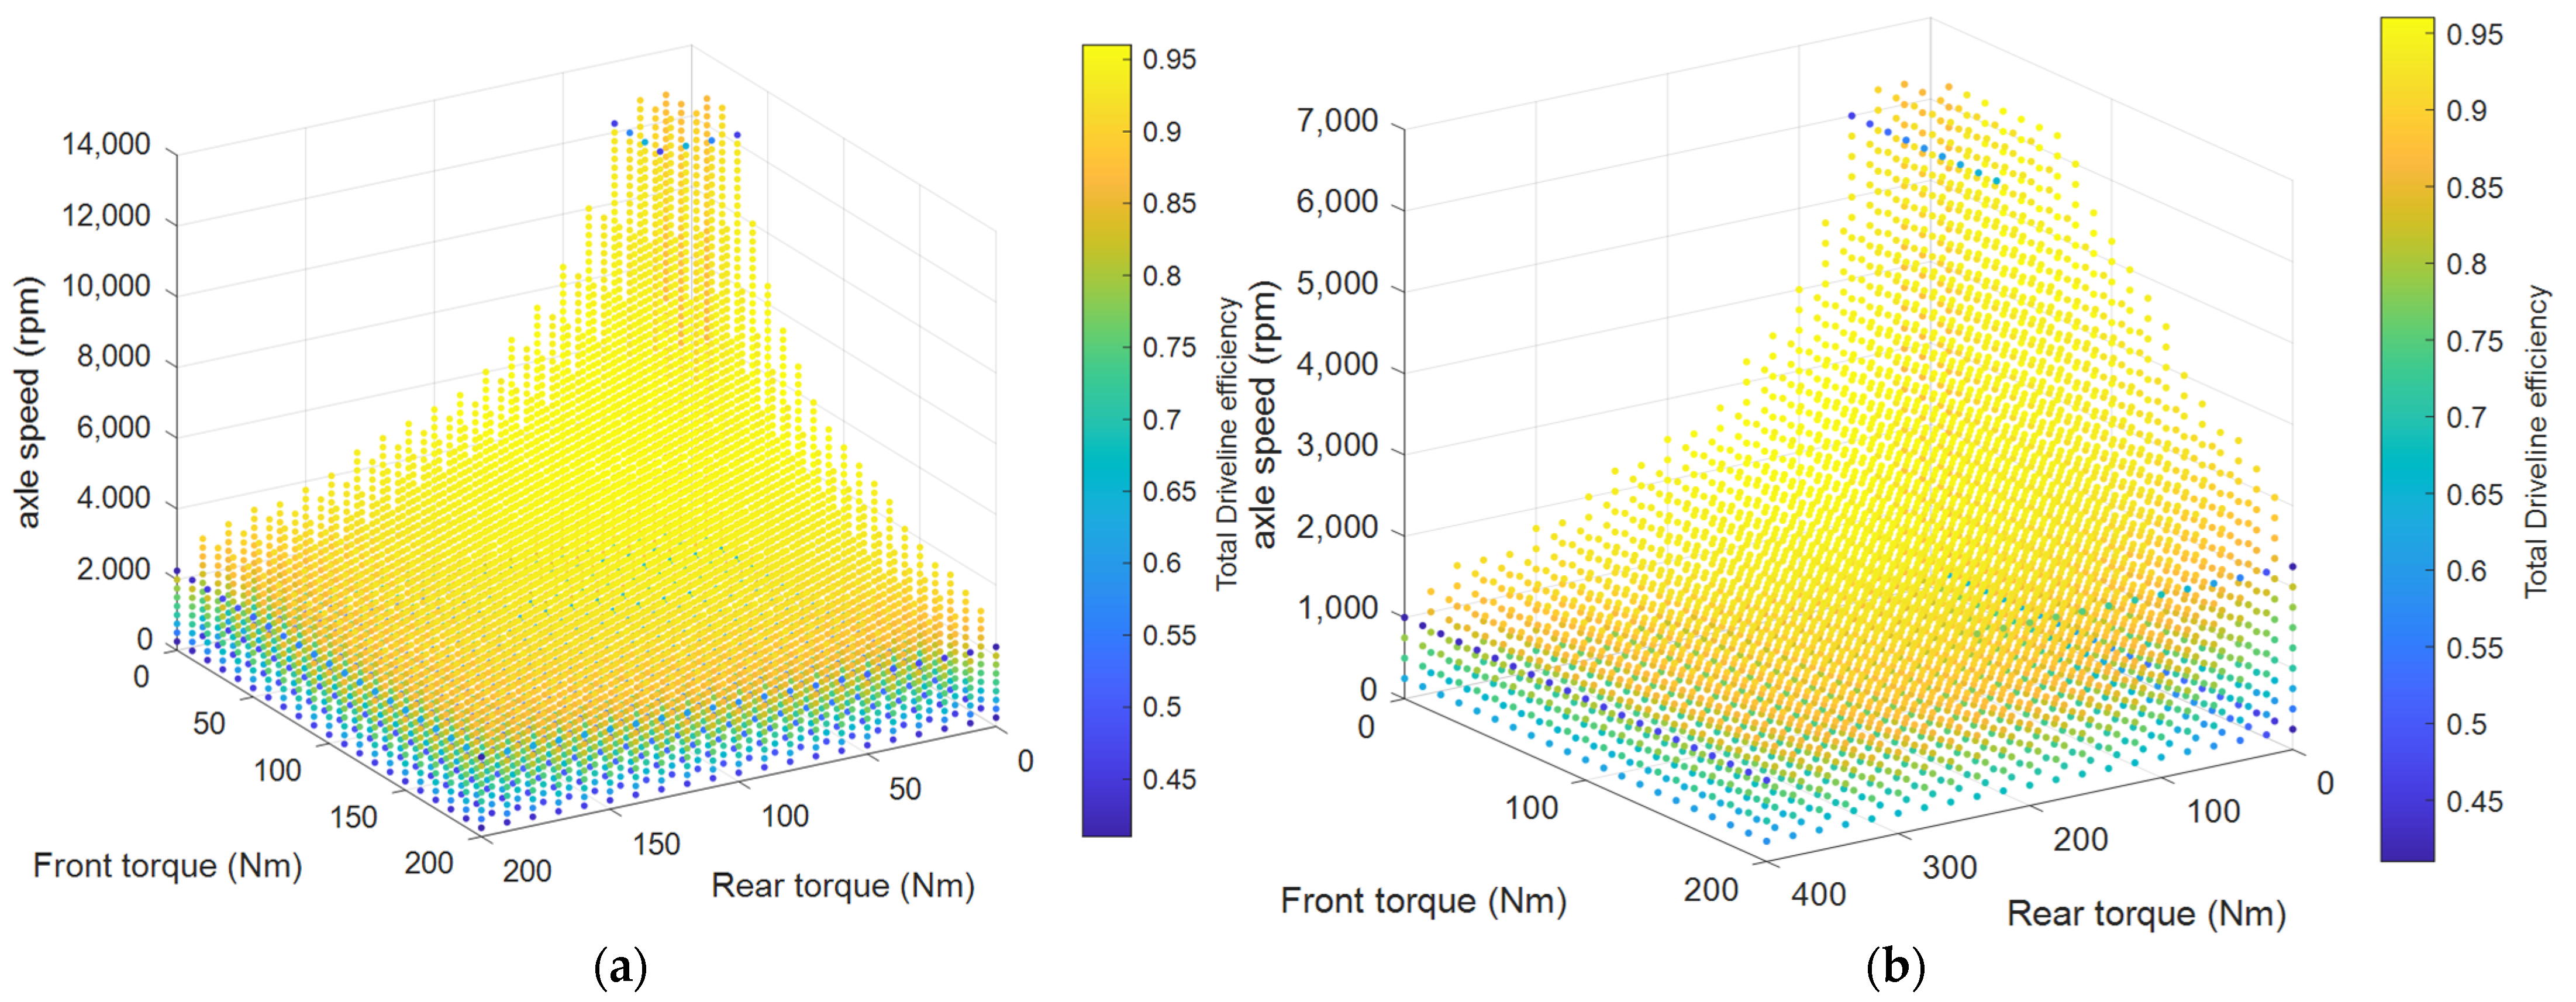
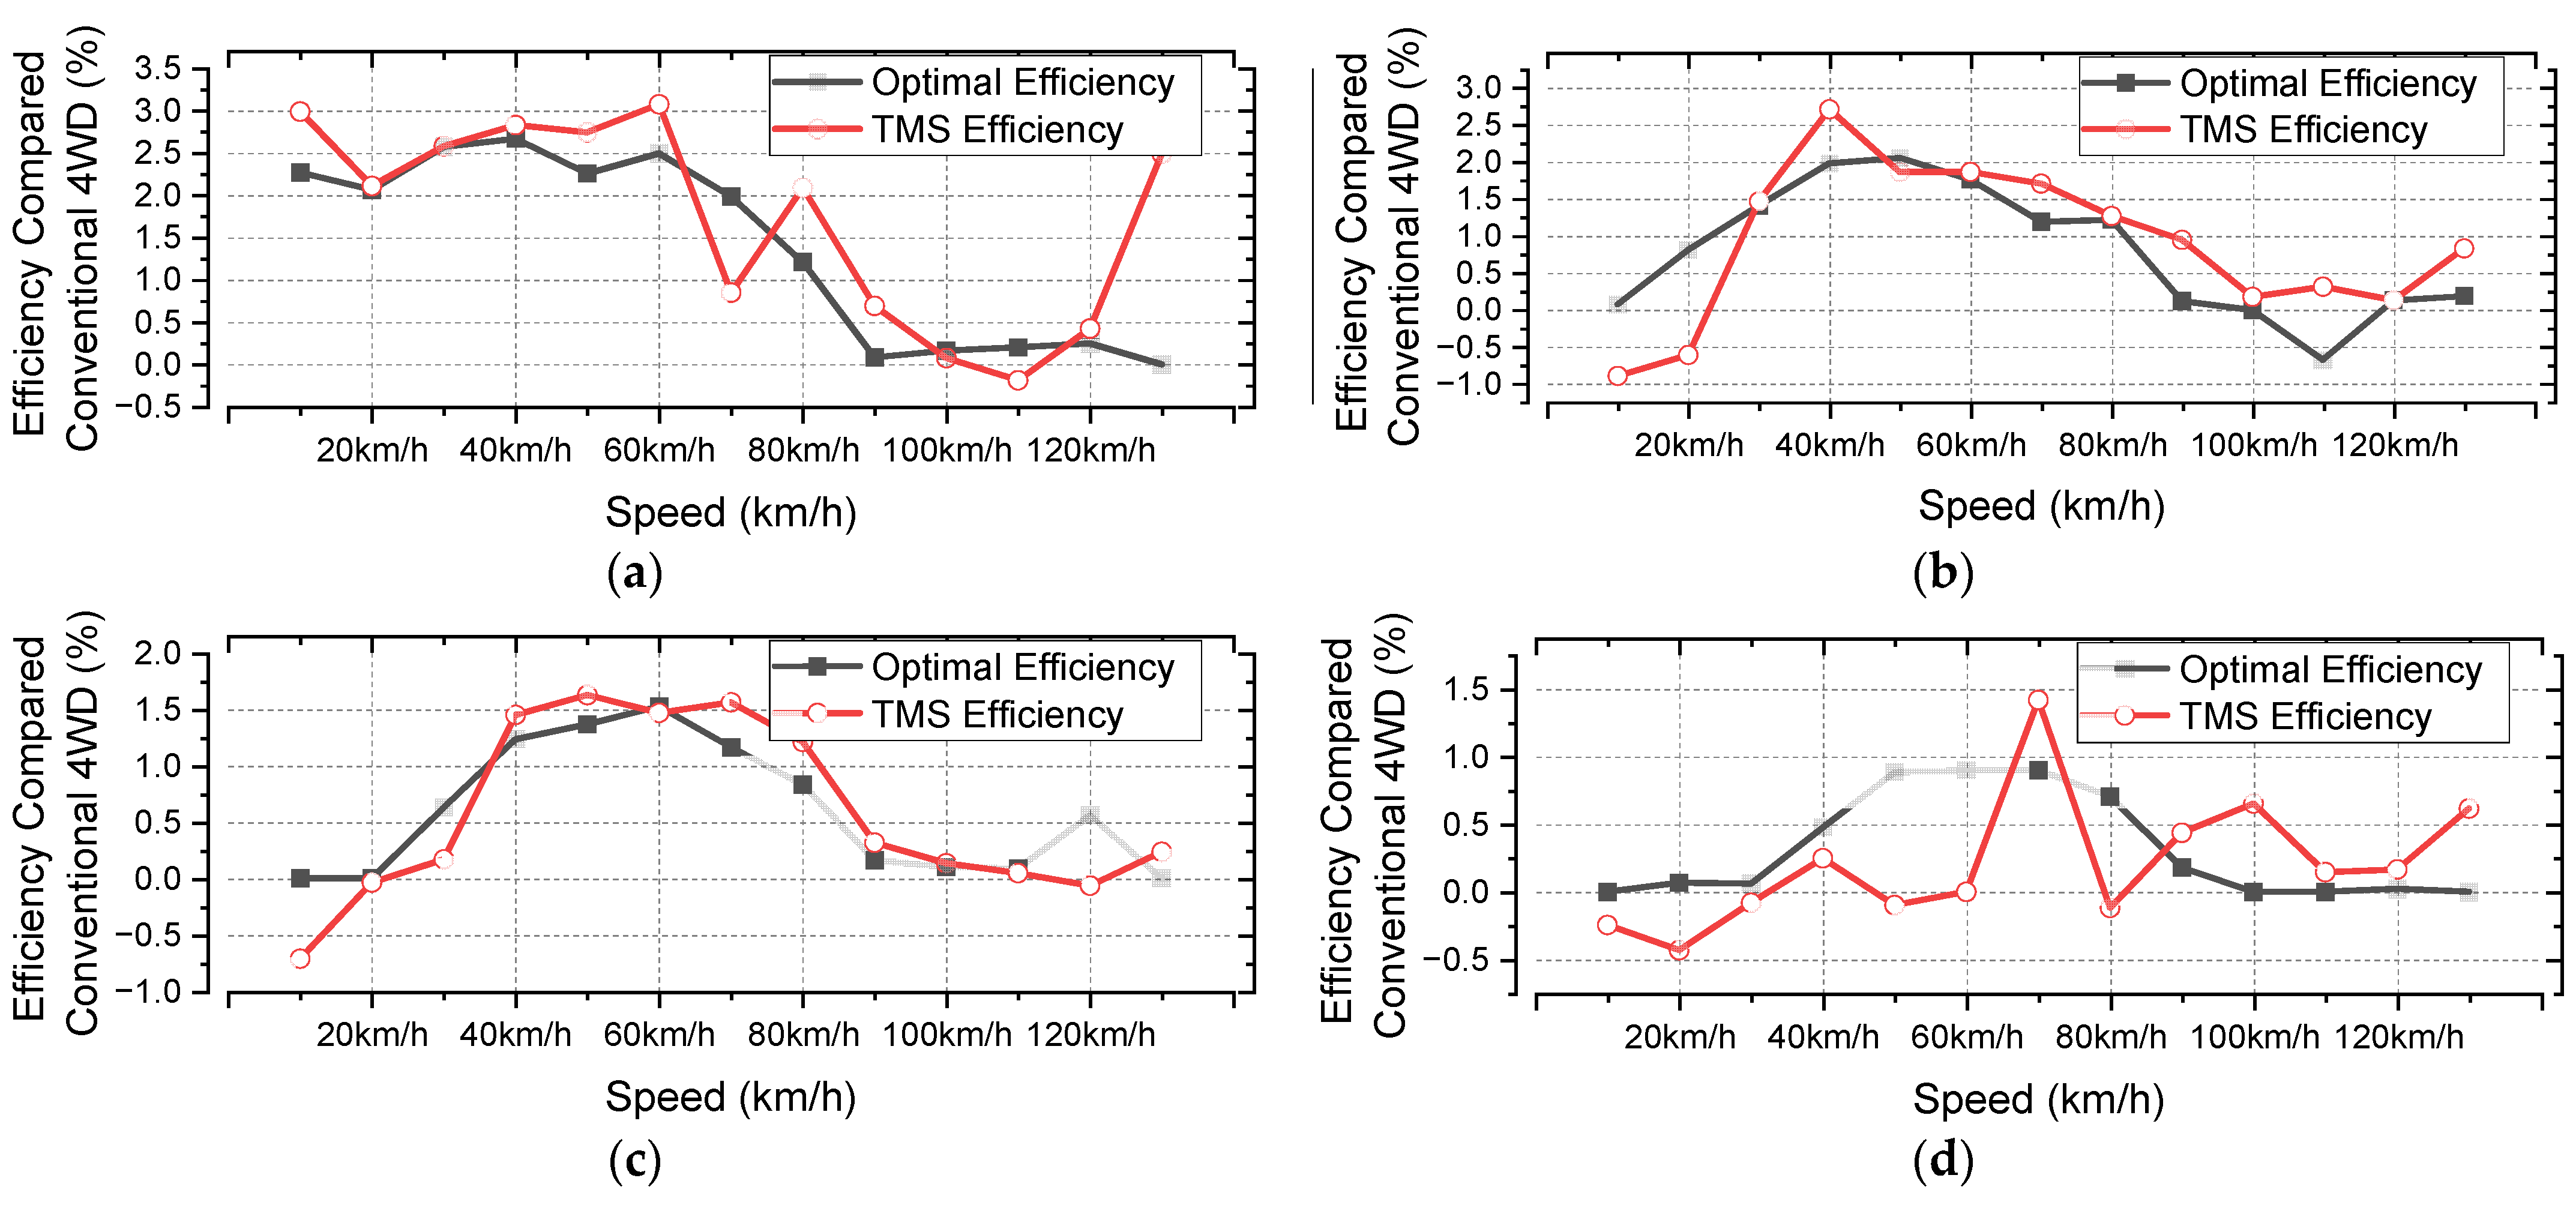
4.1. Optimal Torque Distribution Ratio According to Gear Ratio

In order to verify the driving performance of the TMS controller, power consumption according to the reduction ratio and speed of the front and rear wheels was simulated on a 10% slope. The ramp was evaluated based on the legal maximum longitudinal incline in Korea. Table 2 shows the maximum vertical slope standards of Korea [26].
Arterial roads has a maximum grade of 9%; in this study, the design speed under this condition is 40 kph. The maximum design speed of highways is 110 kph, and 74.4% of driving is considered to occur within 20 kph of this value [27]. Therefore, the efficiency was compared by setting the maximum design speed to 130 kph.
The simulation was performed by dividing the case where the front and rear wheels had the same gear ratio and the case with different gear ratios. In order to confirm the best efficiency, manual optimization was performed by dividing the distribution ratio between the front and rear wheels by 10%, i.e., from 100:0 to 0:100, for each gear ratio setting. As the gear ratio changed, the most efficient distribution ratio changed. In some sections, when the reduction ratio was high, it was found that using a single motor consumed less power than using both motors simultaneously in some sections. At speeds as low as 10 km/h, it was most efficient to use a motor with a high reduction ratio alone. As the speed increased from 20 km/h to 90 km/h, the method of driving alone in the drivetrain with a low gear ratio showed higher efficiency. Above 100 km/h, the method in which both motors were used simultaneously by distributing the torque between the front and rear wheels showed the highest efficiency.

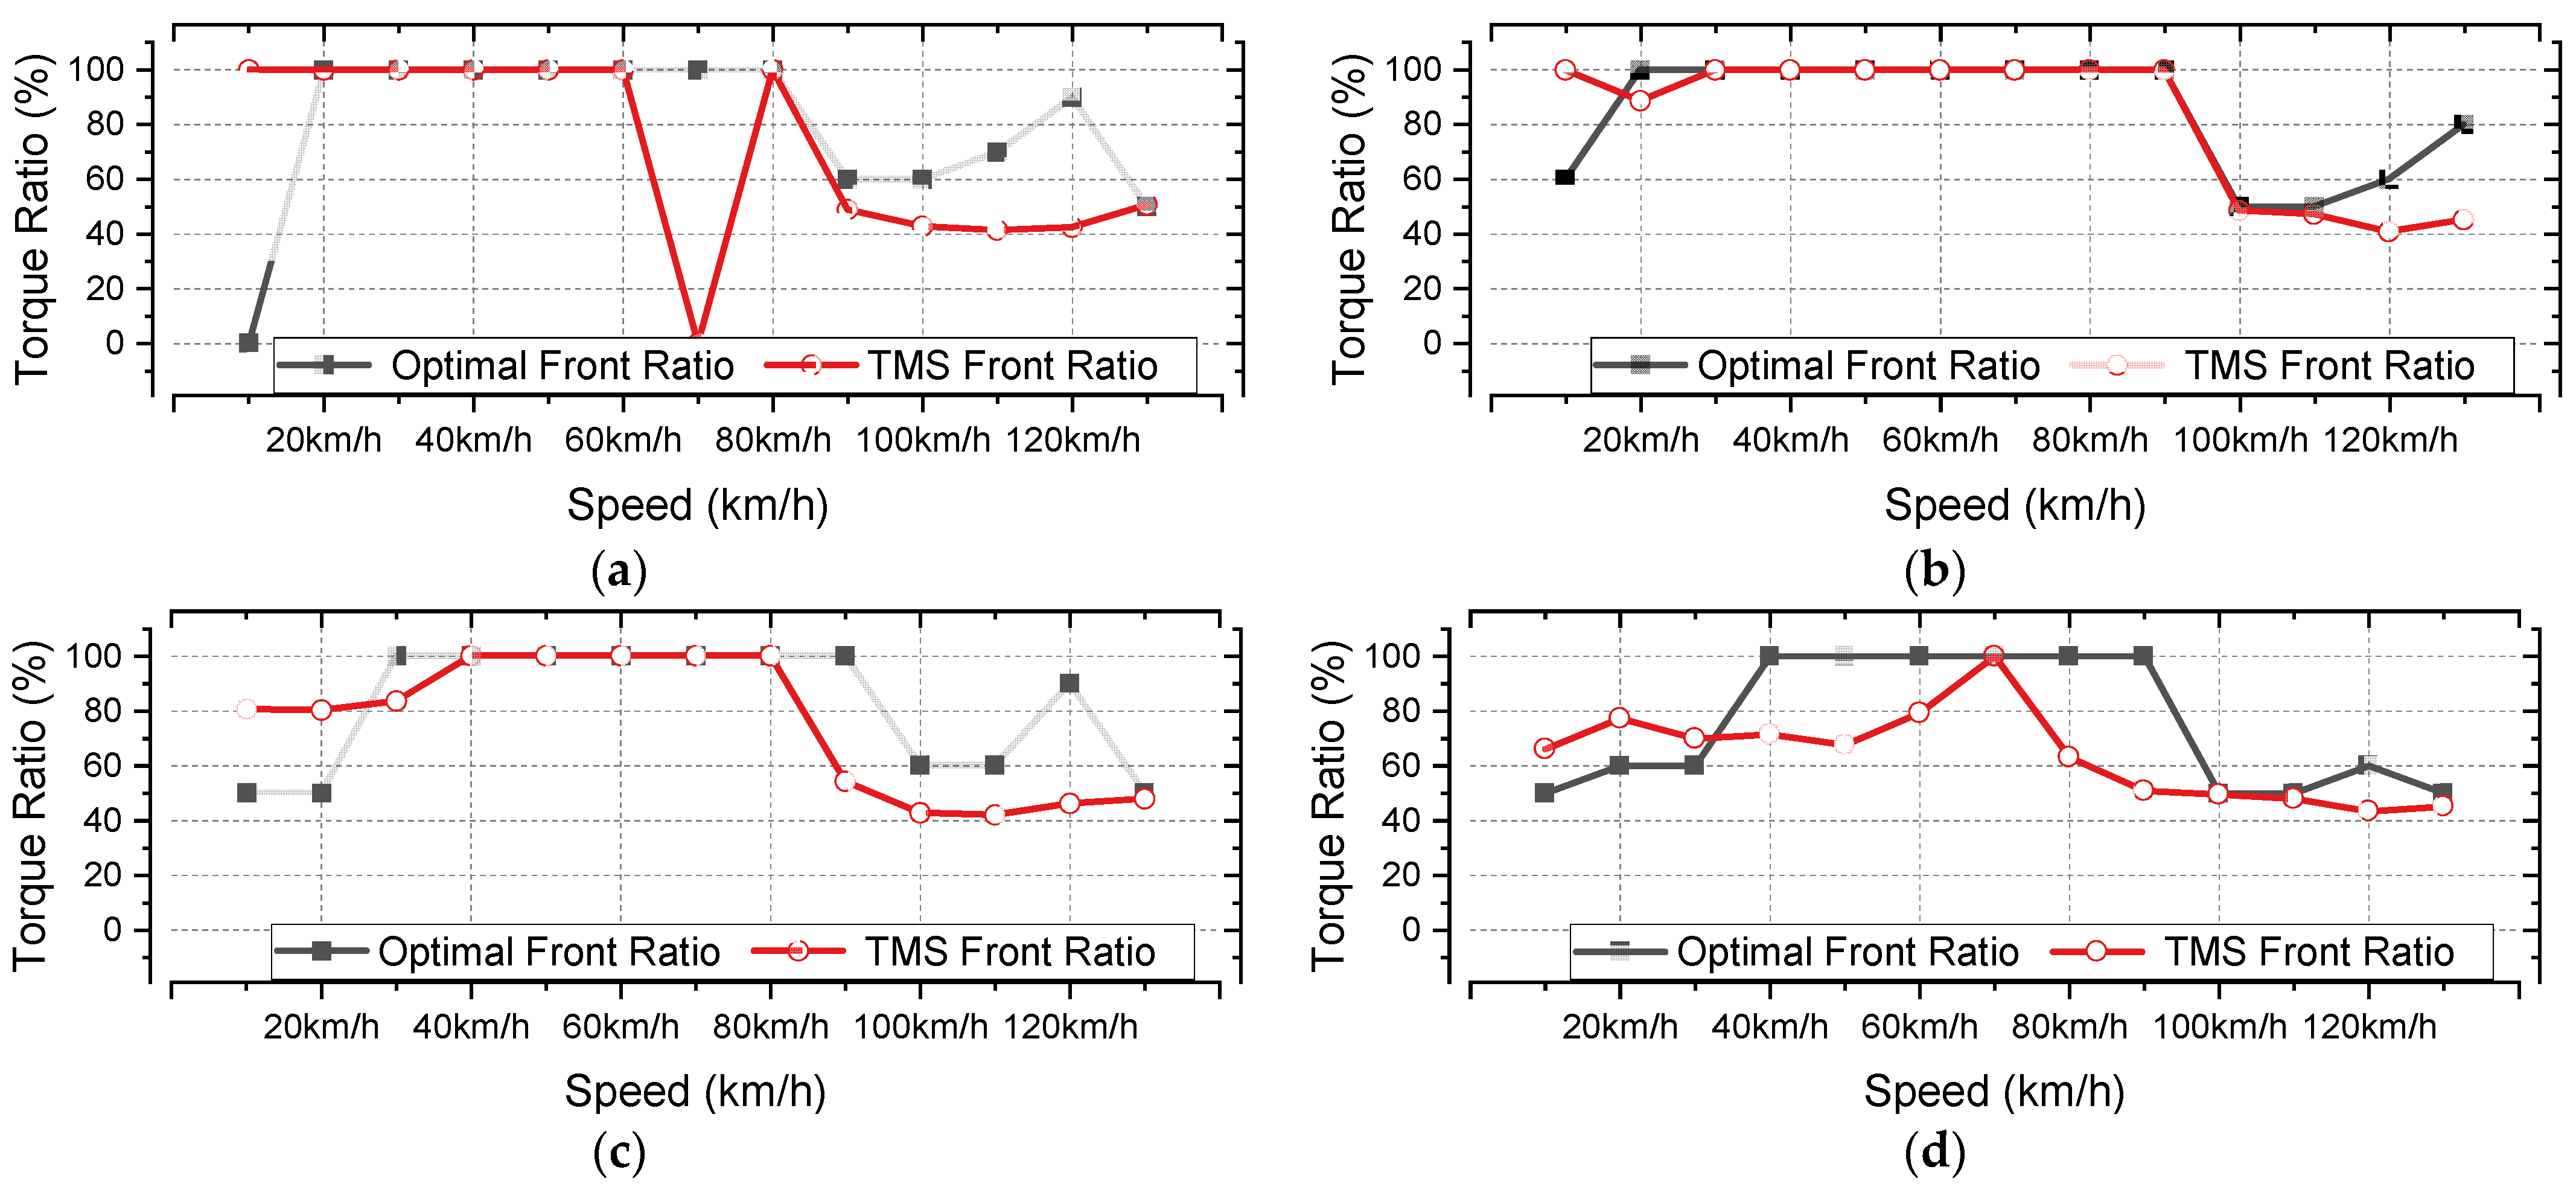
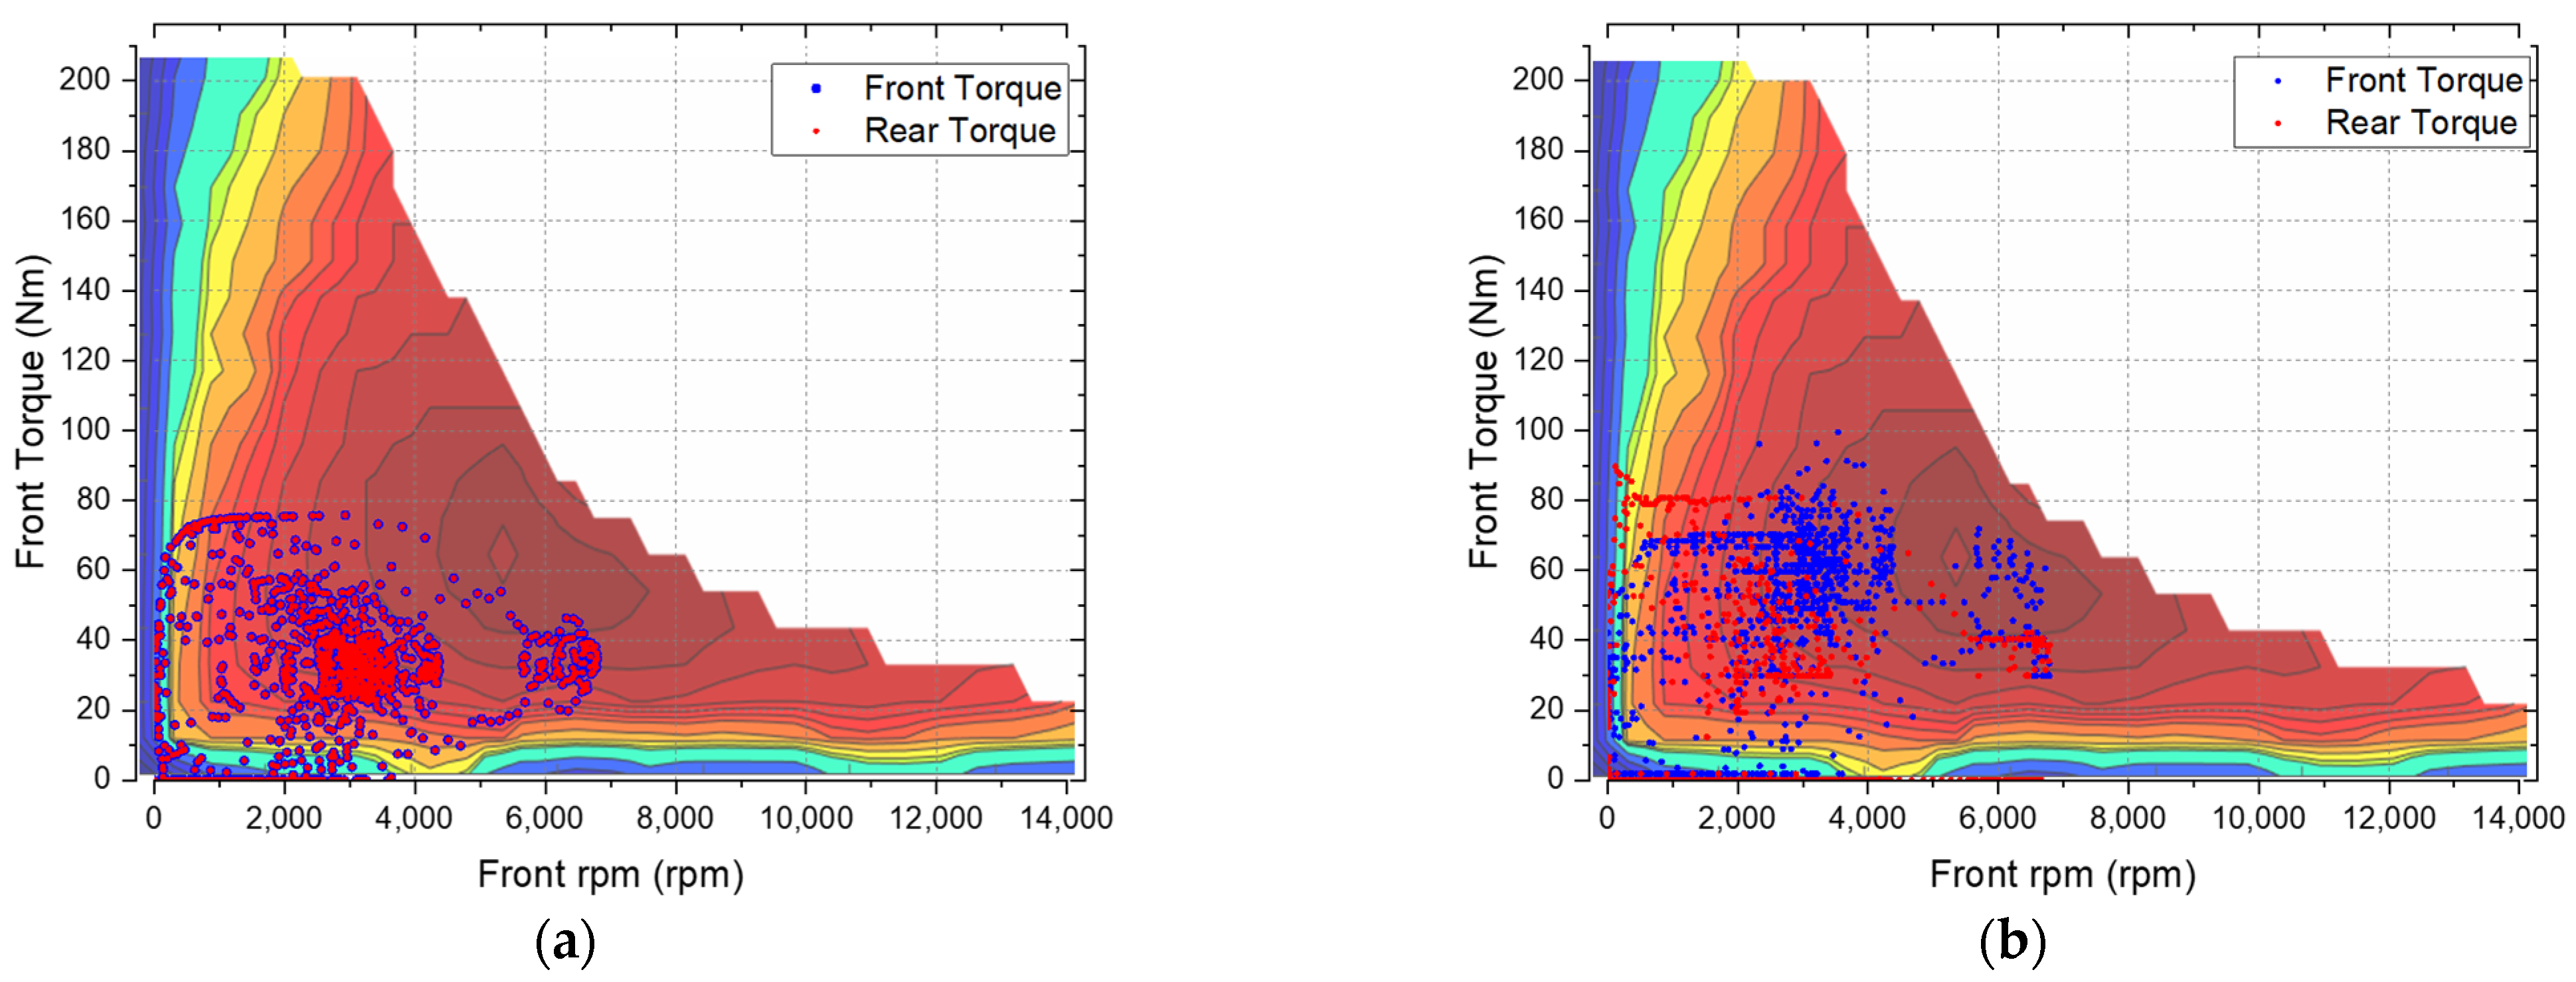
4.2. TMS Operation Verification in Load Environment

Even in the same gear ratio environment, torque distribution as the speed increased showed high efficiency. Figure 8 shows the optimal torque distribution ratio of 4WD and TMS control in each gear ratio environment. As the speed increased, the front and rear motors were driven simultaneously, and it was confirmed that the TMS controller followed the most efficient distribution ratio even though it was not specified.
Figure 9 is a graph comparing the maximum efficiency gain at each gear ratio and the efficiency gain of the TMS controller. The efficiency obtained on the basis of a 50:50 distribution ratio for a typical 4 WD vehicle was compared. Overall, it was confirmed that the TMS controller and the distribution ratio, which showed the best efficiency, showed a similar trend. The higher the gear ratio, the higher the efficiency compared to the conventional 4 WD method; as such, it was confirmed that the TMS system matched more accurately at a gear ratio of 7:1 or higher. The highest efficiency between 10 kph and 60 kph was achieved with a 10:1 gear ratio.
In Section 3, the driving points of the 4 WD and TMS controllers were compared through an EDR constructed for vehicle design. Figure 10 is a DER graph derived through UDDS under a load of 240 kg and a 10% gradient. The position of the torque point cluster near 3000 rpm showing the most operating points revealed improved efficiency in the TMS controller graph.

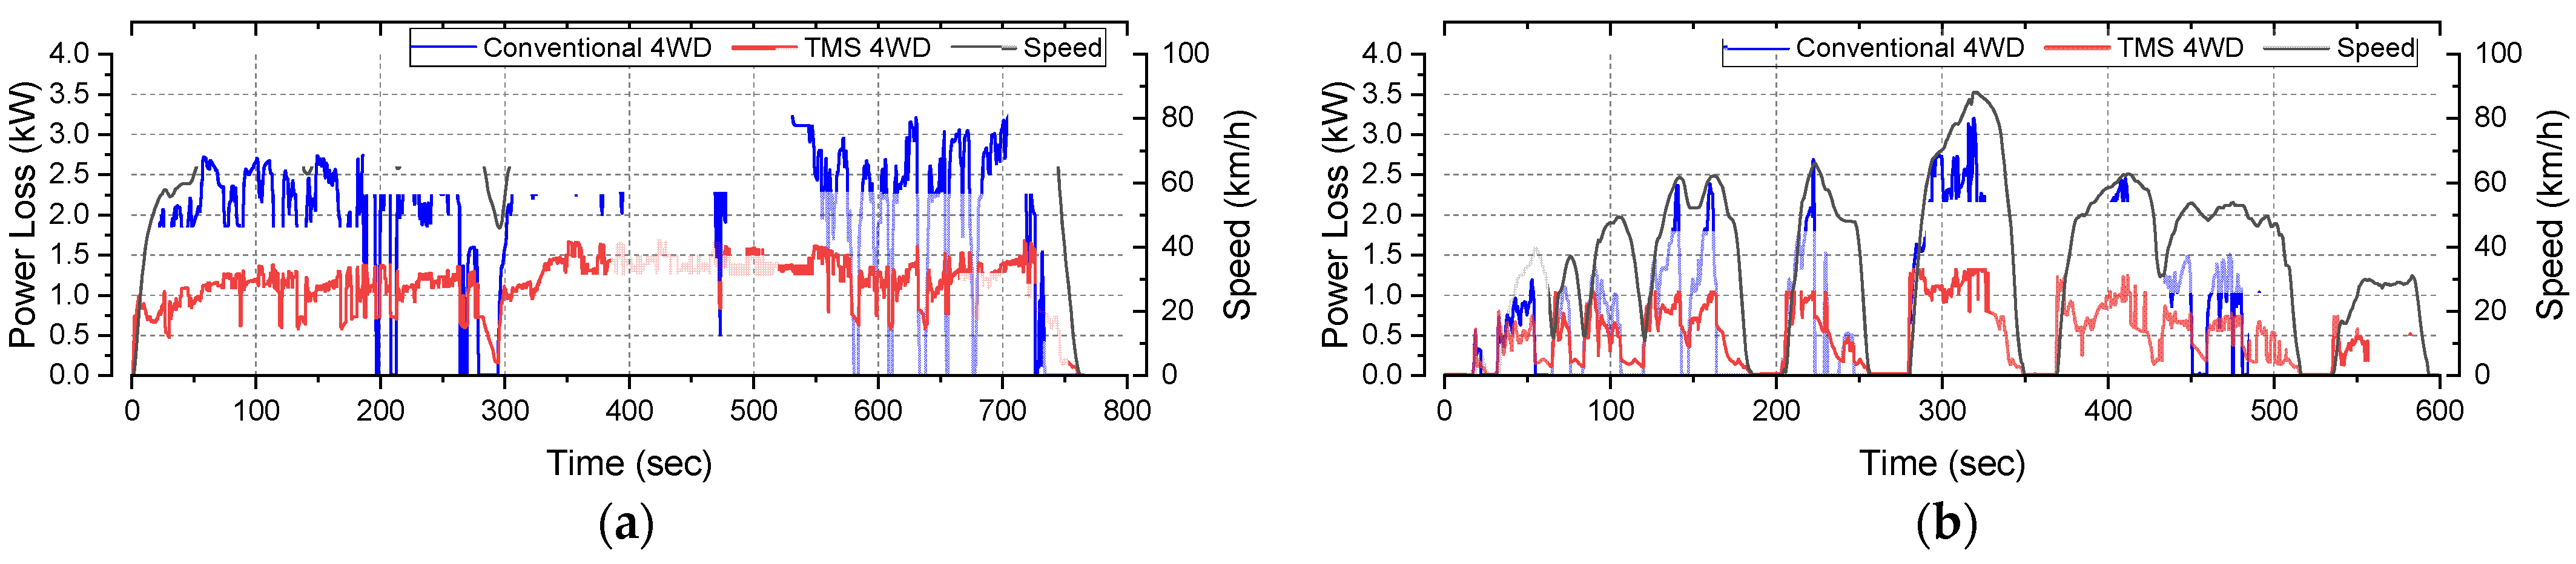
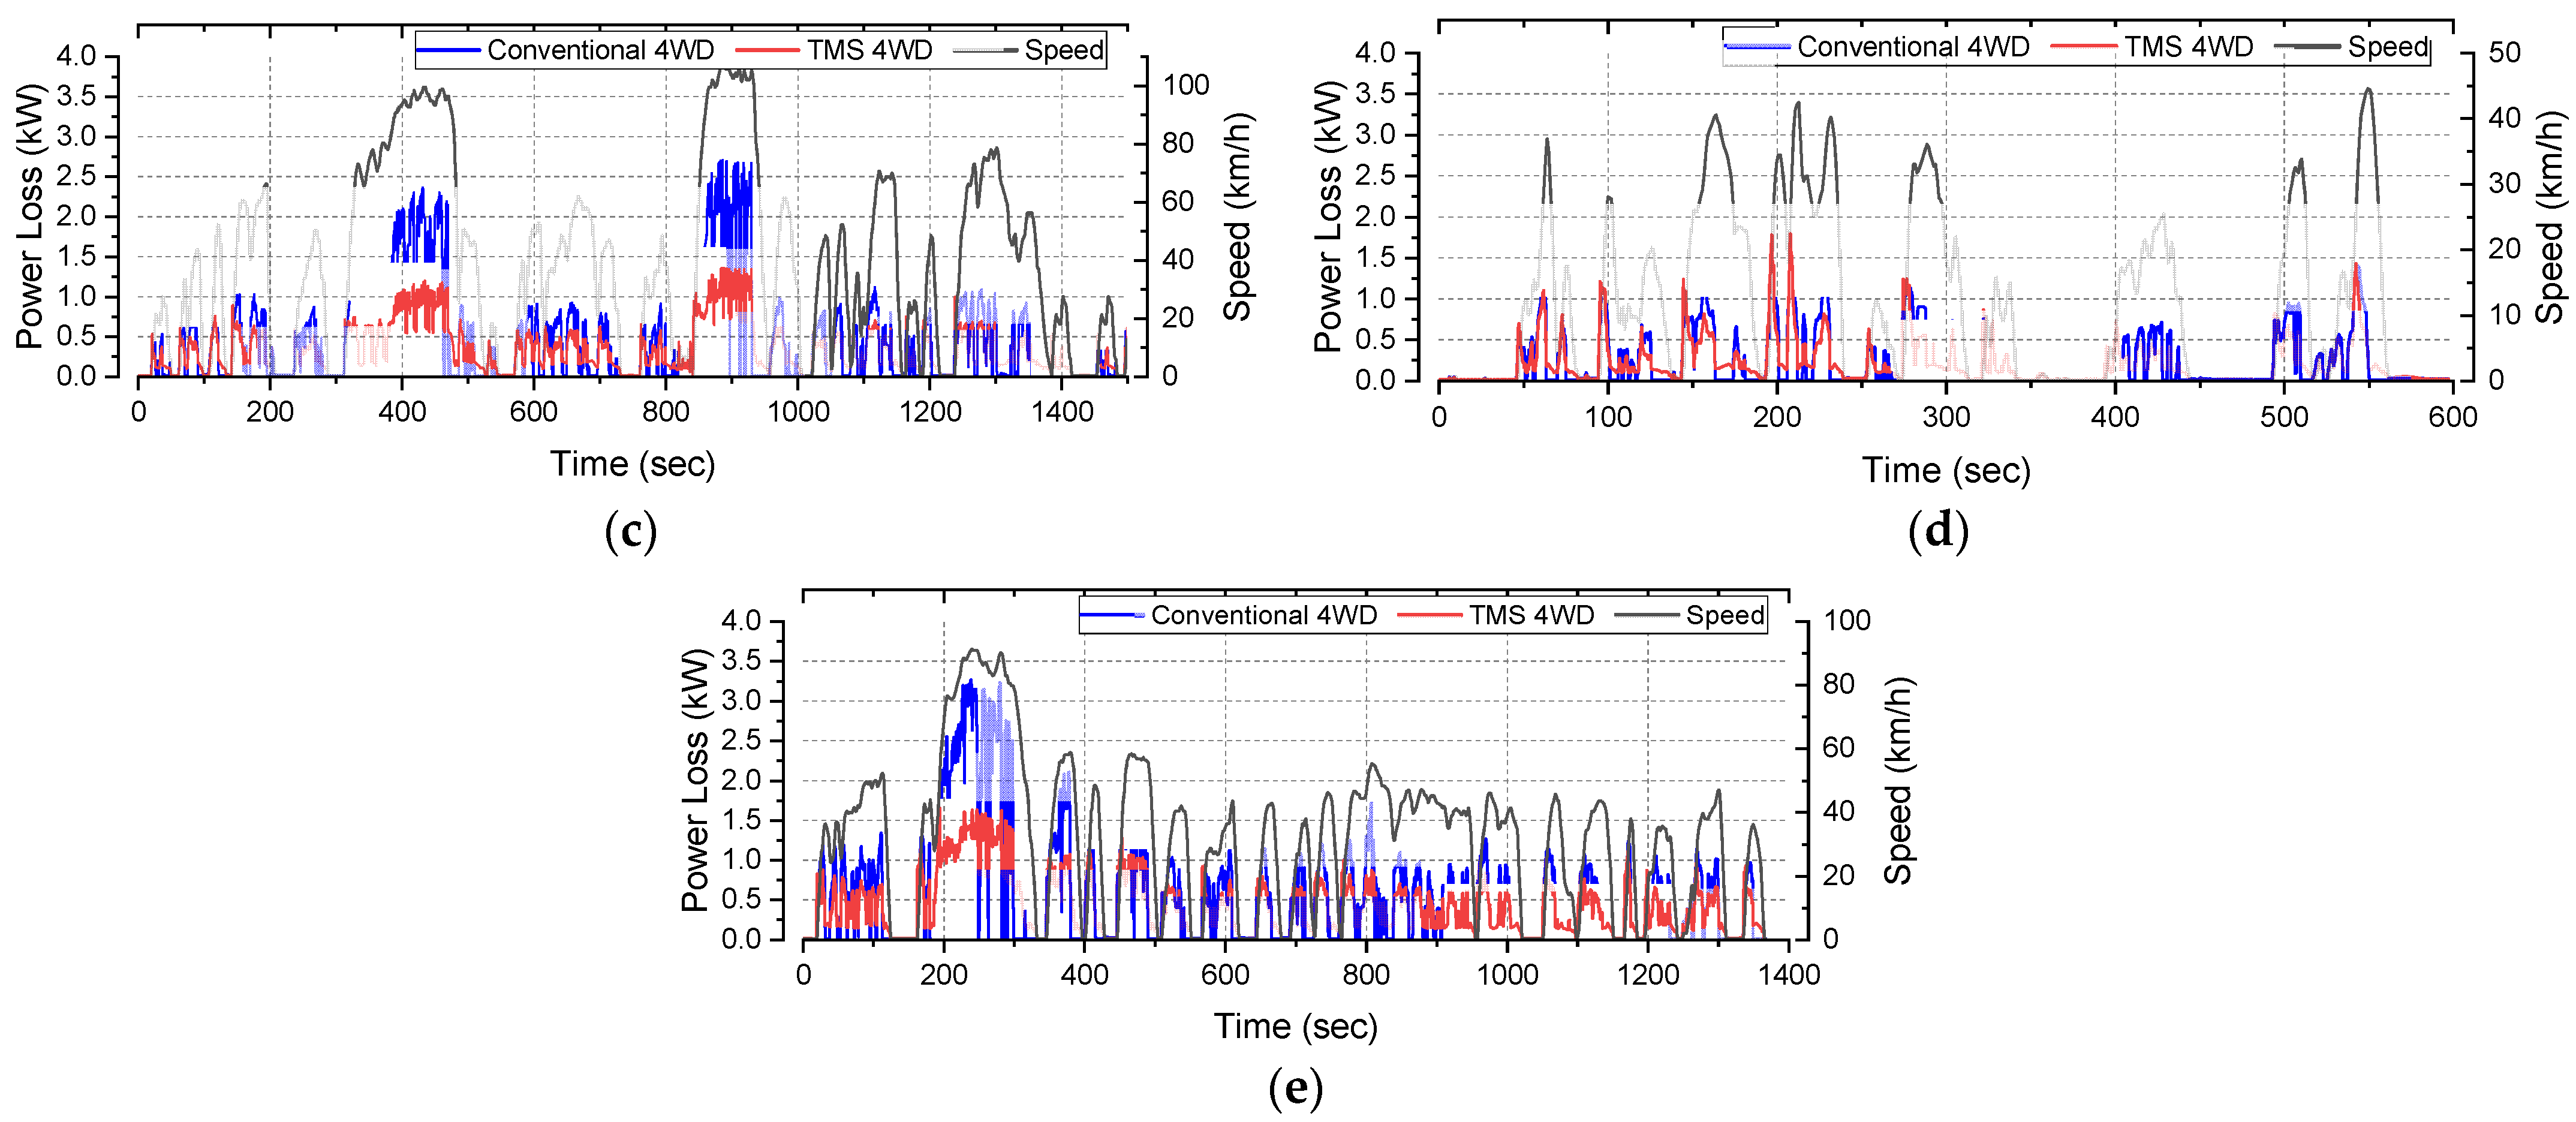
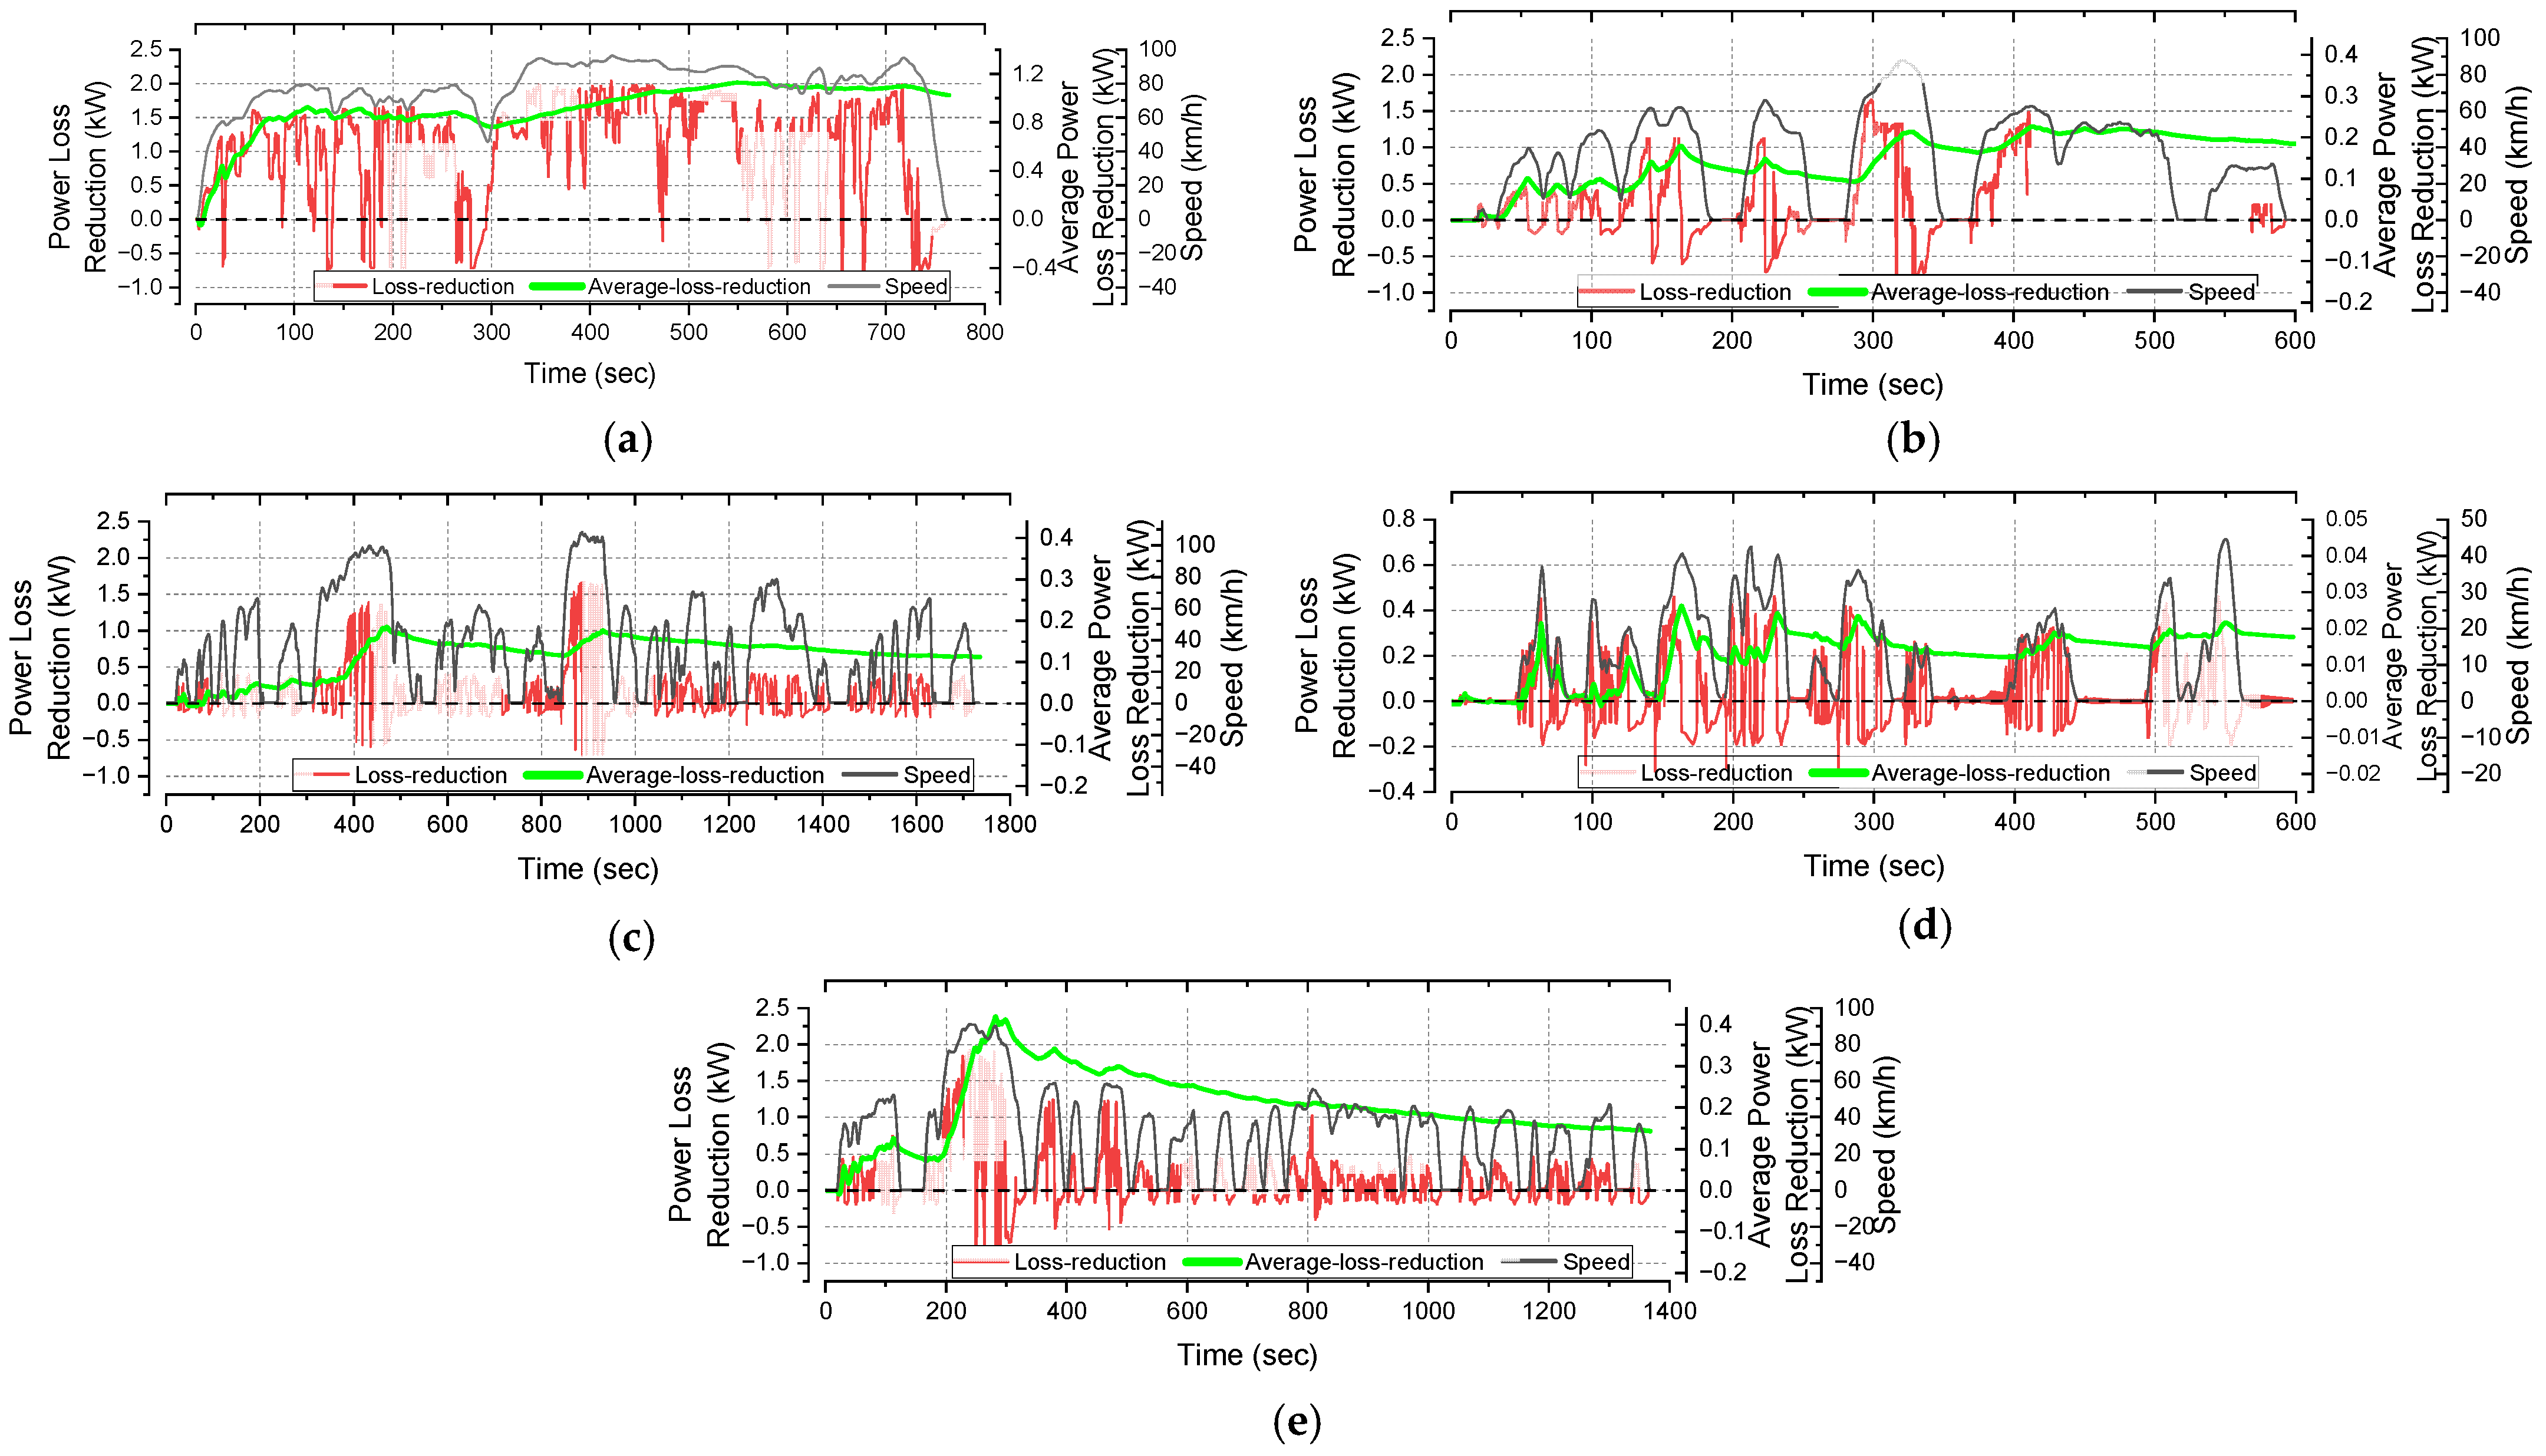
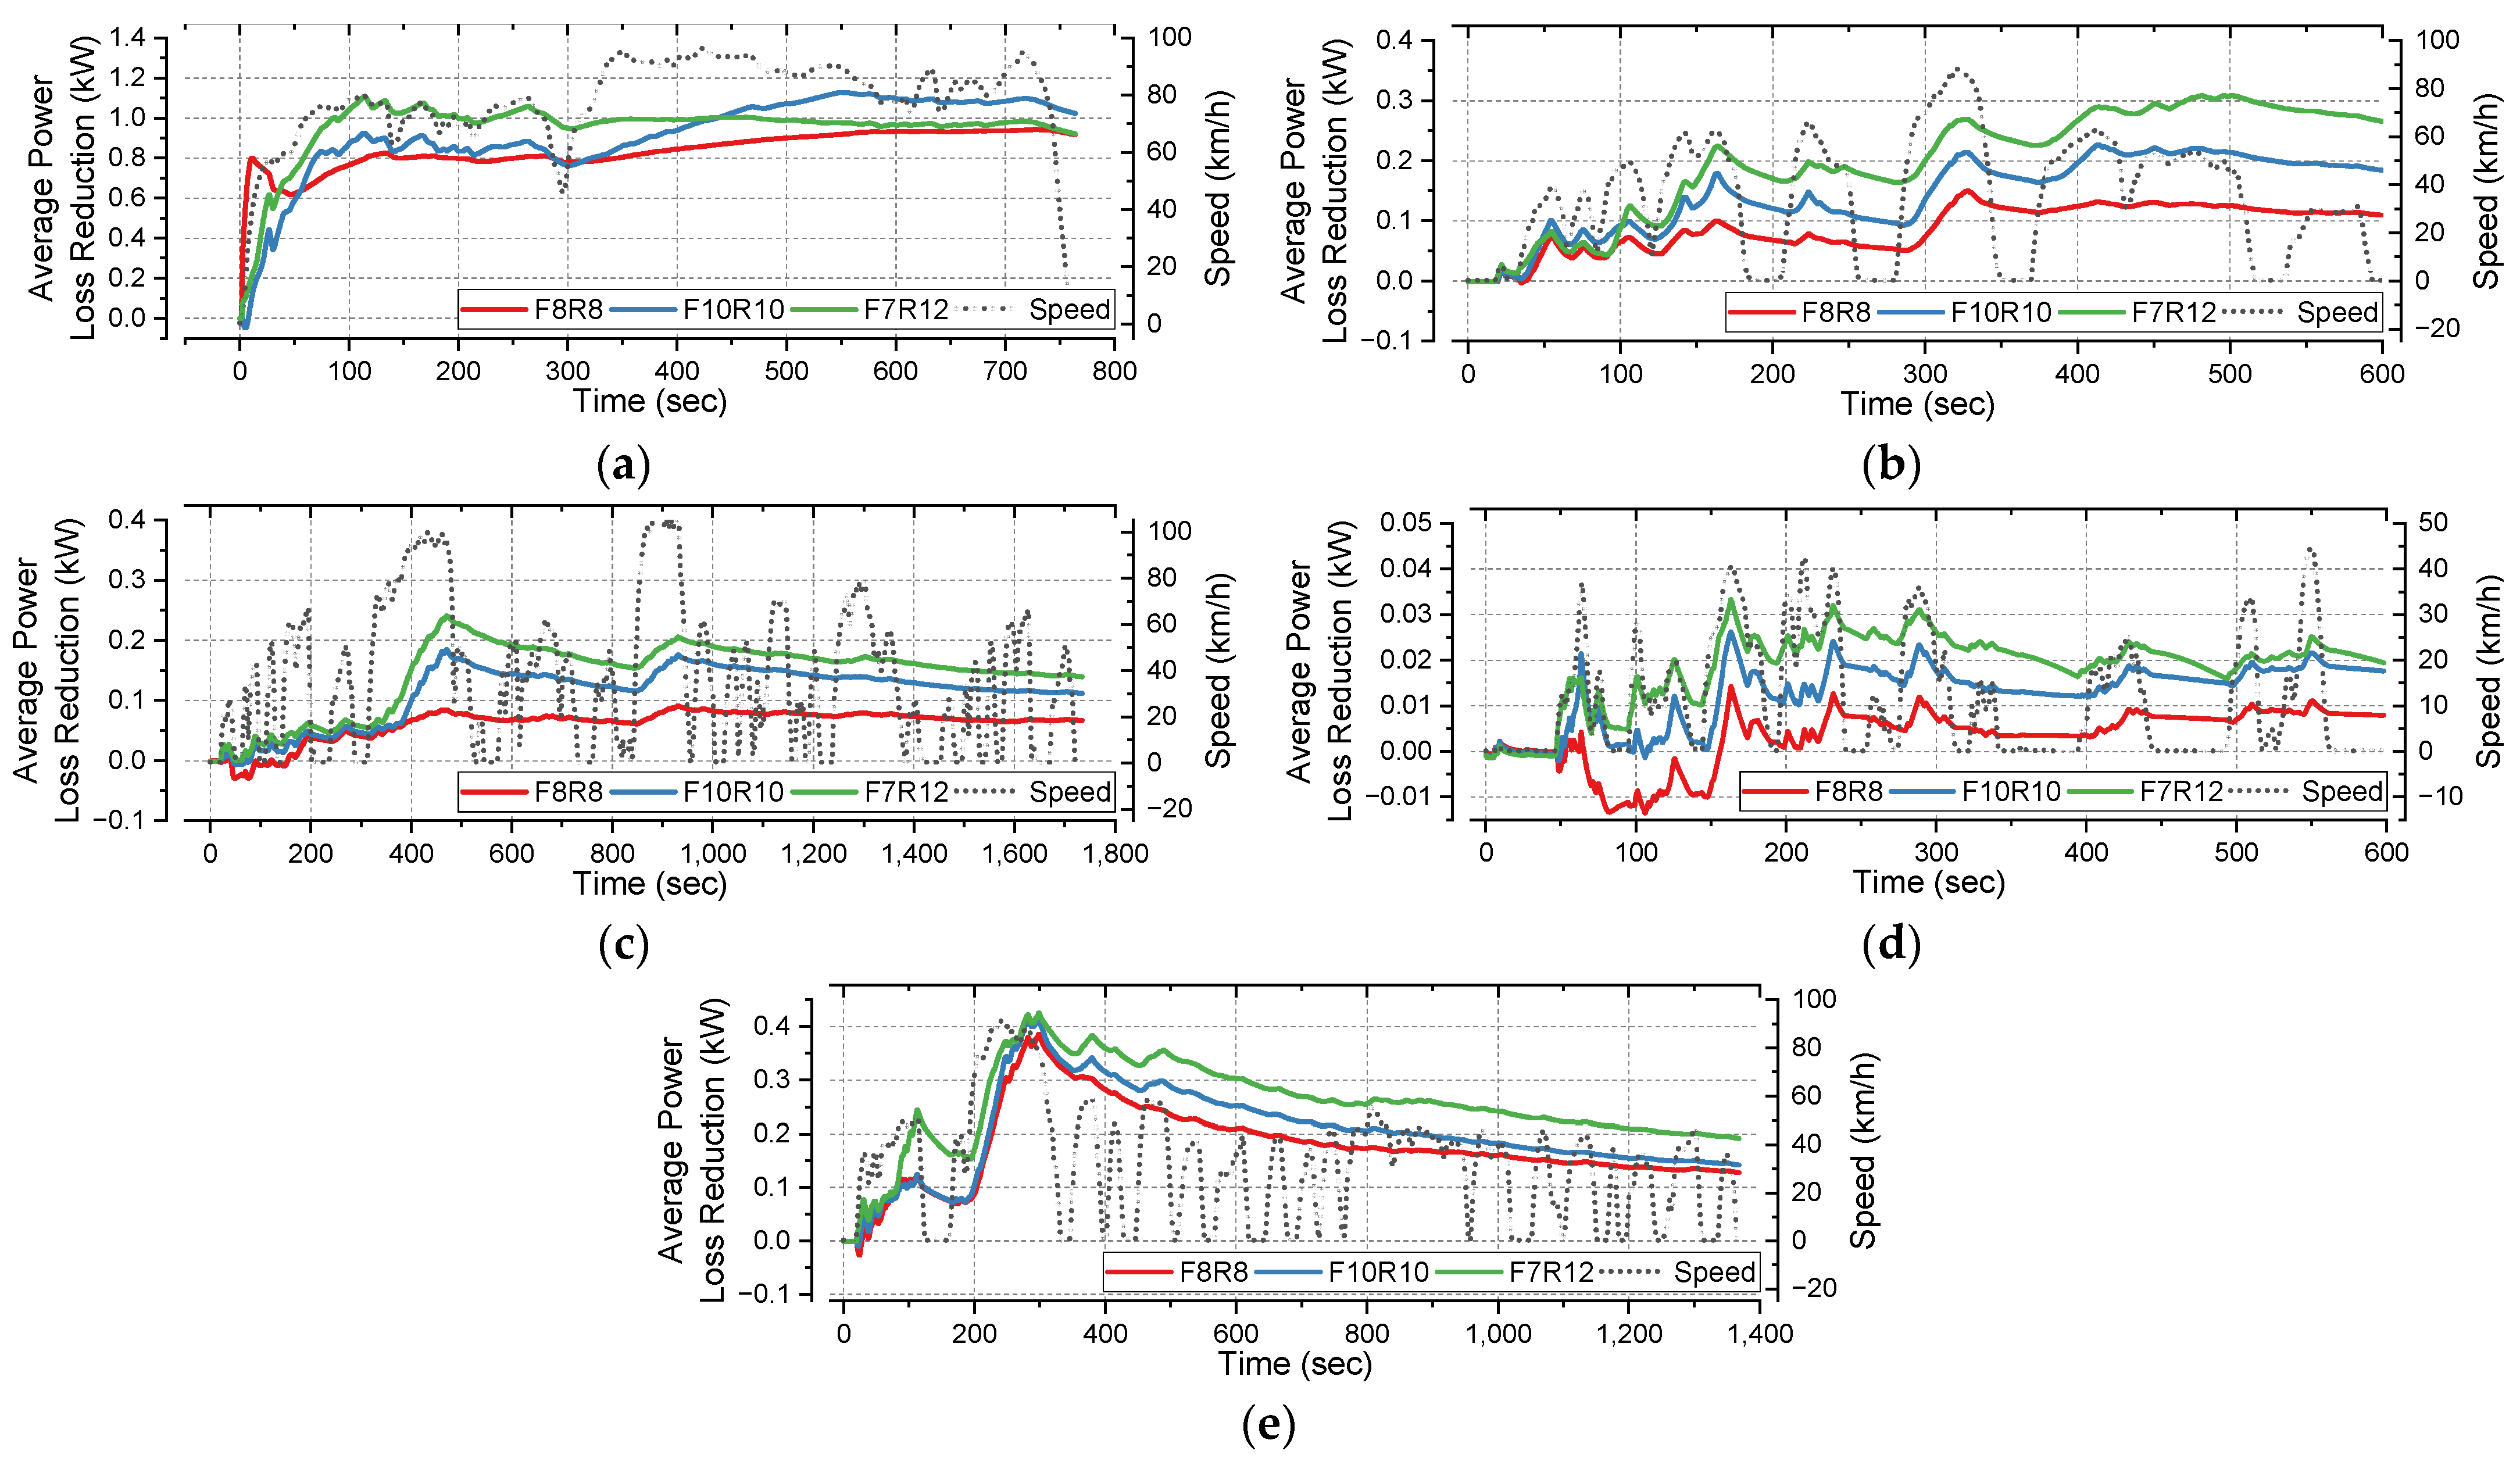
4.3. TMS Performance Verification through Loss Power Comparison

To compare the quantitative performance of the TMS system, the average output loss was compared using five types of driving test cycles, i.e., verified user cases. Power loss is the difference between output and input power, and motor output power and input power were used for comparisons limited to the motor system.
The five driving cycles shown in Figure 11 are HWFET, SC03, LA92, NYCC and UDDS. They were set to run within a speed error range of 0.5 km/h. Regenerative braking was not considered, and mechanical braking was substituted in situations where braking was required. The speed change over time of each cycle can be confirmed in the speed item. The Highway Fuel Economy Driving Schedule (HWFET) represents a 765 s highway driving condition of less than 100 kph (60 mph). SC03 has a cycle of 600 s as an air conditioner “Supplemental FTP” operation schedule. The LA92 has a cycle of 1735 s as a third-class medium-sized vehicle. LA-92 is for Class 3 Heavy-Duty vehicles. The New York City Cycle (NYCC) is a 598-s test characterized by low-speed stop and stop traffic conditions. The EPA Urban Dynamometer Driving Schedule (UDDS) is commonly referred to as the “LA4” or “city test”; it is a 600-s test representing urban driving conditions. It is used for light vehicle testing. Figure 11 compares the power loss of the motor according to the driving cycle in a vehicle using a reduction ratio of 10:1 for the front and rear wheels. It shows that the loss of TMS 4 WD is less than that of a conventional 4 WD.
Figure 12 shows the reduction in power loss and average reduction in power loss of the motor in the cycle performed in Figure 11. In the HWFET cycle, the loss of 1.145 kW compared to the previous 2.168 kW showed a 47.18% reduction, which is an average of 1.023 kW. The SC03 cycle showed a reduction of power loss of 27.91%, which is an average of 0.064 kW with a loss of 0.165 kW compared to the previous one of 0.229 kW. The LA92 cycle showed a reduction in power loss of 25.97%, an average of 0.268 kW, with a loss of 0.320 kW compared to the previous loss of 0.433 kW. In the NYCC cycle, the loss of 0.074 kW compared to the previous loss of 0.081 kW showed a reduction of 7.76%, an average of 0.007 kW. In the UDDS cycle, the loss of 0.333 kW compared to the previous loss of 0.446 kW showed a reduction of 25.20%, i.e., an average of 0.113 kW.
Figure 13 shows the average reduction in power loss of the motor in a cycle according to the gear ratio. The loss reduction trend was evaluated in three situations with the same front and rear gear reduction ratios, i.e., 8:1 and 10:1 respectively, and a reduction ratio of 7:1 front and 12:1 rear. All three gear ratios showed the highest efficiency in the HWFET cycle and the lowest in the NYCC cycle. In the SC03 cycle, the change in efficiency with respect to the gear ratio was the largest. The smallest reduction in power consumption was shown with the front and rear reduction ratio of 8:1, and the largest was shown in the case of 7:1 front and 12:1 rear reduction ratios.
Greater efficiency was observed in high-load sections such as rapid acceleration sections that consume relatively large amounts of power, and highways whereby high speeds are maintained. On the other hand, efficiency decreased in the low-speed acceleration/deceleration section where the load was not large.
Table 3 summarizes the experimental results. The power consumption according to the three gear ratio changes was compared in five cycles. The applied front and rear reduction ratios were 8:1 and 10:1, and different reduction ratios were 7:1 front and 12:1 rear. Each reduction ratio situation is expressed as case 1, case 2, and case 3, respectively. All five cycles showed the highest savings rate in case 3. Absolute power savings also showed reliable results in combinations of different reduction ratios.
HWYFET cycle showed the largest power loss at 1.145 kW in case 2, and the maximum reduction ratio decreased by 0.92 kW to 56.34% in case 3. The SC03 cycle showed the largest average power loss, i.e., 0.413 kW, in case 2, and the largest power saving ratio, i.e., 40.23%, in case 3. NYCC cycle showed the lowest power loss among the five cycles, and case 3 showed the highest TMS efficiency, i.e., 12.34%. In the LA92 cycle, both 4 WD and TMS showed the largest power loss in case 2 and the largest reduction rate, i.e., 34.84%, in case 3. In the UDDS cycle, TMS showed the greatest power loss in case 1, and 4 WD showed the greatest power loss in case 3. The highest efficiency, i.e., a 33.84% reduction, was shown in case 3.
In all three cases and five cycles, the TMS method showed loss reduction compared to 4 WD. In particular, it showed a high loss reduction rate, i.e., more than 19%, in all of the cycles except for the NYCC cycle.

5. Discussion

5.1. Vehicle Applicability

The TMS system can be applied to the same gear ratio or different gear ratios. In addition, matching is possible even when the motors of the front and rear axles are different, so it is possible to obtain benefits not only in terms of efficiency for the end consumer, but also in terms of technology development.
Regarding the ISO 26262 standard, the development process is based on several V-models, and activities for each process step must be performed [28]. Since it can be applied to the development of other vehicles through the same system, the cost and time required for software level development and verification is expected to be reduced. Also, in terms of the software development structure of AUTOSAR, it can be expected that it will be applicable to other parts to cope with the exchange of hardware [29]. It is appropriate for use in the upper drive controller software layer for drive inverter control, and is expected to show benefits in terms of the development efficiency of AUTOSAR-based software and other driving systems.

5.2. Powertrain Efficiency

Through the UDDS cycle, the area mainly used in the vehicle was analyzed. An appropriate gear ratio was selected by comparing it with the actual area used in an existing vehicle. When the front and rear gear ratios of the electric vehicle based on the actual use area were applied, the TMS system was able to obtain a maximum efficiency increase of 3.1% in a steady state environment, i.e., driving up a 10% gradient. In addition, it was confirmed that the TMS was properly tuned to achieve the maximum efficiency through results that were largely consistent with the power distribution ratio graph using only the most efficient part manually. If an electric vehicle transmission that can change gear ratios is applied in the future, TMS is expected to be an efficient shift control method that can improve development efficiency compared to the existing method that requires calculations according to individual gear ratios.
In order to verify the efficiency in an accurate driving environment, five driving cycles were performed. In a driving environment such as NYCC, it showed a low efficiency gain but a higher efficiency as a load was applied to the vehicle. In a high load situation like HWFET, it showed an efficiency gain of up to 56.34% depending on the gear ratio, achieving higher efficiency in special situations such as rapid acceleration. In particular, higher efficiency was shown in vehicles with different gear ratio combinations. As such, improved efficiency is to be expected in the current powertrain configuration trend that uses different motors to configure 4 WD vehicles.
Driving efficiency, as compared with the efficiency contour of the motor, achieved more than 90% under a range of conditions. However, if the efficiency loss of the inverter is applied to the torque transmission path of the powertrain, effective powertrain improvements and higher efficiency gains are possible.

6. Conclusions

In this paper, a torque matching strategy was designed and verified to minimize the power loss of driving motors in 4 WD electric vehicles. It has been confirmed that the proposed torque distribution strategy is highly efficient in various gear ratios. In the five major cycle tests, it was confirmed that the motor power loss of the proposed method was reduced by up to around 50%, depending on the driving situation. Therefore, this study opens the possibility of improving efficiency in electric vehicles using dual motors without additional experiments on gear ratios. It is expected that further research on TMS will make it applicable to various general-purpose EV vehicles in addition to the gear ratios covered in this paper.

Author Contributions

Conceptualization, H.-W.K. and H.-R.C.; methodology, E.K. and H.-W.K.; software, H.-W.K.; validation, H.-W.K.; formal analysis, H.-W.K.; investigation, A.A. and H.-W.K.; resources, M.-H.H., K.K. and H.-W.K.; data curation, H.-W.K.; writing—original draft preparation, H.-W.K.; writing—review and editing, H.-W.K.; visualization, H.K., I.C. and H.-W.K.; supervision, H.-R.C.; project administration, H.-R.C.; funding acquisition, H.-R.C. All authors have read and agreed to the published version of the manuscript.

Funding

This research was funded by the support of the Korea Institute of Industrials Technology as “Development of Core Technologies for a Working Partner Robot in the Manufacturing Field”(KITECH EO-22-0009).

Institutional Review Board Statement

Not applicable.

Informed Consent Statement

Not applicable.

Data Availability Statement

Not applicable.

Acknowledgments

This research was conducted using equipment from KITECH (Gwangju, Korea).

Conflicts of Interest

The authors declare no conflict of interest.

References

  1. Conway, G.; Joshi, A.; Leach, F.; García, A.; Senecal, P.K. A review of current and future powertrain technologies and trends in 2020. Engineering 2021, 5, 100080. [Google Scholar] [CrossRef]
  2. Zarazua de Rubens, G. Who will buy electric vehicles after early adopters? Using machine learning to identify the electric vehicle mainstream market. Energy 2019, 172, 243–254. [Google Scholar] [CrossRef]
  3. Krings, A.; Monissen, C. Review and Trends in Electric Traction Motors for Battery Electric and Hybrid Vehicles. In Proceedings of the 2020 International Conference on Electrical Machines (ICEM), Gothenburg, Sweden, 23–26 August 2020. [Google Scholar]
  4. Bazzi, A.M.; Krein, P.T. Review of methods for real-time loss minimization in induction machines. IEEE Trans. Ind. Appl. 2010, 46, 2319–2328. [Google Scholar] [CrossRef]
  5. De Santiago, J.; Bernhoff, H.; Ekergård, B.; Eriksson, S.; Ferhatovic, S.; Waters, R.; Leijon, M. Electrical motor drivelines in commercial allelectric vehicles: A review. IEEE Trans. Veh. Technol. 2012, 61, 475–484. [Google Scholar] [CrossRef] [Green Version]
  6. Press Release A6 e-Tron. Available online: https://www.audi-mediacenter.com (accessed on 22 February 2022).
  7. Electrified GV70, pr-Center. Available online: https://www.genesis.com (accessed on 22 February 2022).
  8. Cybertruck. Available online: https://electrek.co/guides/tesla-cybertruck/ (accessed on 22 February 2022).
  9. Damanauskas, V.; Janulevičius, A. Differences in tractor performance parameters between single-wheel 4WD and dual-wheel 2WD driving systems. J. Terramech 2015, 60, 63–73. [Google Scholar] [CrossRef]
  10. Keller, A.; Aliukov, S. Rational Criteria for Power Distribution in All-Wheel-Drive Trucks; SAE Technical Paper 2015-01-2786; Commercial Vehicle; SAE International: Warrendale, PA, USA, 2015. [Google Scholar]
  11. Shao, L.; Karci, A.E.H.; Tavernini, D.; Sorniotti, A.; Cheng, M. Design approaches and control strategies for energy efficient electric machines for electric vehicles—A review. IEEE Access 2020, 8, 116900–116913. [Google Scholar] [CrossRef]
  12. De Novellis, L.; Sorniotti, A.; Gruber, P. Wheel torque distribution criteria for electric vehicles with torque-vectoring differentials. IEEE Trans. Veh. Technol. 2014, 63, 1593–1602. [Google Scholar] [CrossRef] [Green Version]
  13. De Novellis, L.; Sorniotti, A.; Gruber, P. Optimal wheel torque distribution for a four-wheel-drive fully electric vehicle. SAE Int. J. Passeng. Cars Mech. Syst. 2013, 6, 128–136. [Google Scholar] [CrossRef]
  14. Dizqah, A.M.; Lenzo, B.; Sorniotti, A.; Gruber, P.; Fallah, S.; de Smet, J. A fast and parametric torque distribution strategy for four-wheel-drive energy-efficient electric vehicles. IEEE Trans. Ind. Electron. 2016, 63, 4367–4376. [Google Scholar] [CrossRef] [Green Version]
  15. Cao, K.; Hu, M.; Wang, D.; Qiao, S.; Guo, C.; Fu, C.; Zhou, A. All-wheel-drive torque distribution strategy for electric vehicle optimal efficiency considering tire slip. IEEE Access 2021, 9, 25245–25257. [Google Scholar] [CrossRef]
  16. Pennycott, A.; de Novellis, L.; Sabbatini, A.; Gruber, P.; Sorniotti, A. Reducing the motor power losses of a four-wheel drive, fully electric vehicle via wheel torque allocation. Proc. Inst. Mech. Eng. Part D J. Automob. Eng. 2014, 228, 830–839. [Google Scholar] [CrossRef] [Green Version]
  17. Wang, J.; Gao, S.; Wang, K.; Wang, Y.; Wang, Q. Wheel torque distribution optimization of four-wheel independent-drive electric vehicle for energy efficient driving. Control Eng. Pract. 2021, 110, 104779. [Google Scholar] [CrossRef]
  18. U.S. Environmental Protection Agency. Fuels and Fuel Additives, Renewable Fuel Standard. Available online: http://www.epa.gov/otaq/fuels/renewablefuels (accessed on 22 February 2022).
  19. Burress, T.; Campbell, S. Benchmarking EV and HEV Power Electronics and Electric Machines. In Proceedings of the IEEE Transportation Electrification Conference and Expo (ITEC), Dearborn, MI, USA, 16–19 June 2013. [Google Scholar]
  20. Burress, T.A.; Campbell, S.L.; Coomer, C. Evaluation of the 2010 Toyota Prius Hybrid Synergy Drive System; Tech. Rep. TM-2010-253; Oak Ridge Nat. Lab.: Oak Ridge, TN, USA, 2011. [Google Scholar]
  21. Jung, H.; Kim, D.; Lee, C.B.; Ahn, J.; Jung, S.Y. Numerical and experimental design validation for adaptive efficiency distribution compatible to frequent operating range of IPMSM. IEEE Trans. Magn. 2014, 50, 881–884. [Google Scholar] [CrossRef]
  22. Chae, W.C.; Bum, K.K.; Kim, J.S.; Moon, S.H.; Cho, H.J.; Kim, Y.H.; Kim, K.N. Optimized Design to Improve the Efficiency of Driving Motors for Electric Vehicles and Reduce Costs. In Proceedings of the KSAE 2016 Annual Spring Conference, Jeju, Korea, 19–21 May 2016. [Google Scholar]
  23. Shao, L.; Navaratne, R.; Popescu, M.; Liu, G. Design and construction of axial-flux permanent magnet motors for electric propulsion applications—A review. IEEE Access 2021, 9, 158998–159017. [Google Scholar] [CrossRef]
  24. Momen, F.; Rahman, K.; Son, Y.; Savagian, P. Electric motor design of general motors’ Chevrolet bolt electric vehicle. SAE Int. J. Altern. Powertrains 2016, 5, 286–293. [Google Scholar] [CrossRef]
  25. Stockman, K.; Dereyne, S.; Vanhooydonck, D.; Symens, W.; Lemmens, J.; Deprez, W. ISO Efficiency Contour Measurement Results for Variable Speed Drives. In Proceedings of the XIX International Conference on Electrical Machines—ICEM 2010, Rome, Italy, 6–8 September 2010. [Google Scholar]
  26. Article 25, Regulation for Structure and Facility Standard of Roads, Road Act, Republic of Korea. Available online: https://www.law.go.kr/법령/도로의구조ㆍ시설기준에관한규칙/(20211213,00922,20211213)/제25조 (accessed on 22 February 2022).
  27. Park, J.S.; Kim, J.H.; Chul, C.S.; Joo, D.H. Analysis of speeding characteristics using data from red light and speed enforcement cameras. J. Korean Soc. Transp. 2016, 34, 29–42. [Google Scholar] [CrossRef]
  28. ISO 26262:2018; Road Vehicles—Functional Safety. ISO: Geneva, Switzerland, 2018.
  29. Autosar Classic platfrom. Available online: https://www.autosar.org/standards/classic-platform (accessed on 22 February 2022).
Figure 1. Simulation structure overview for TMS system configuration and verification.
Energies 15 02717 g001
Figure 2. Target EV structure based on dual motor type 4WD drive system.
Energies 15 02717 g002
Figure 3. Efficiency contour data of 2010 Prius insulted into TMS controller [19,20].
Energies 15 02717 g003
Figure 4. DER of 60 kW motor according to the following gear ratios: (a) 12:1; (b) 10:1; (c) 8:1; (d) 5:1.
Energies 15 02717 g004
Figure 5. Simulation environment configuration for power distribution system application and verification.
Energies 15 02717 g005
Figure 6. Torque Matching Strategy Scheme.
Energies 15 02717 g006
Figure 7. TMS map visualization according to gear ratio: (a) Front and rear reduction ratio 1:1, (b) Front reduction ratio 1:1, rear reduction ratio 2:1.
Energies 15 02717 g007
Figure 8. Torque Distribution ratio of optimal 4WD and TMS: (a) Gear ratio 10:1, (b) Gear ratio 8:1, (c) Gear ratio 7:1, (d) Gear ratio 6:1.
Energies 15 02717 g008
Figure 9. Efficiency gains versus conventional 4 WD: (a) Gear ratio 10:1, (b) Gear ratio 8:1, (c) Gear ratio 7:1, (d) Gear ratio 6:1.
Energies 15 02717 g009
Figure 10. DER of load environment: UDDS, 10% grade and 240 kg load (a) 4WD, (b) TMS.
Energies 15 02717 g010
Figure 11. Five driving cycles used for performance verification with a reduction ratio of 10:1 for the front and rear wheels: (a) HWFET, (b) SC03, (c) LA92, (d) NYCC, (e) UDDS.
Energies 15 02717 g011aEnergies 15 02717 g011b
Figure 12. Loss-reduction and average-loss-reduction of drive motor power in five driving cycles using a reduction ratio of 10:1 for the front and rear wheels: (a) HWFET, (b) SC03, (c) LA92, (d) NYCC, (e) UDDS.
Energies 15 02717 g012
Figure 13. Average power loss reduction of the motor according to the gear ratio configuration: (a) HWFET, (b) SC03, (c) LA92, (d) NYCC, (e) UDDS.
Energies 15 02717 g013
Table 1. Specification of 120 kW target electric vehicle.
SpecificationValue
Length/width/height (mm)3868/1889/1314
Sprung mass (kg)1434
DriveFour wheel Drive
PowertrainElectric 120 kW (60 kW × 2)
Motor typePermanent Magnet Synchronous
Maximum motor speed (rpm) 13,000
Maximum motor torque (Nm)200
Table 2. Maximum road gradients according to Korean Road regulations.
Maximum Road Grade (%)
Design Speed (km/h)HighwayArterial RoadCollection and Connecting RoadLocal Road
FlatMountainFlatMountainFlatMountainFlatMountain
12034
11035
1003536
904646
80464769
70 57710
60 58710713
50 58710714
40 69711715
30 712816
20 816
Table 3. Average power loss of the motor of the conventional system and TMS according to the gear ratio configuration in five cycles.
Drive Cycle Gear RatioPower Loss (kW)
Drive Mode Case 1Case 2Case 3
HWFETTMS
(Reduction ratio)
0.920
(−49.2%)
1.145
(−47.18%)
0.920
(−56.34%)
Conventional1.8202.1682.108
SC03TMS
(Reduction ratio)
0.413
(−21.09%)
0.165
(−27.91%)
0.396
(−40.23%)
Conventional0.5230.2290.662
NYCCTMS
(Reduction ratio)
0.077
(−3.65%)
0.074
(−7.76%)
0.209
(−12.34%)
Conventional0.0800.0810.238
LA92TMS
(Reduction ratio)
0.279
(−19.25%)
0.320
(−25.97%)
0.264
(−34.84%)
Conventional0.3450.4330.405
UDDSTMS
(Reduction ratio)
0.396
(−24.37%)
0.333
(−25.20%)
0.378
(−33.84%)
Conventional0.5230.4460.571
Publisher’s Note: MDPI stays neutral with regard to jurisdictional claims in published maps and institutional affiliations.

