Article

Cumulative Emissions of CO2 for Electric and Combustion Cars: A Case Study on Specific Models

1
Faculty of Technical Sciences, University of Warmia and Mazury in Olsztyn, 10-719 Olsztyn, Poland
2
Department of Agricultural Engineering & Technology, Faculty of Agriculture, Ege University, Bornova, Izmir 35100, Turkey
*
Author to whom correspondence should be addressed.
Energies 2022, 15(7), 2703; https://doi.org/10.3390/en15072703
Submission received: 1 March 2022 / Revised: 27 March 2022 / Accepted: 1 April 2022 / Published: 6 April 2022
(This article belongs to the Section E: Electric Vehicles)

Abstract

:
This work includes calculations of the cumulative CO2 emissions of two comparable cars—the VW Golf VII—one with a combustion engine and the other with an electric motor. Calculation of CO2 emissions was performed, taking into account the stages of production, utilization and use of the above-mentioned vehicles. For the use phase, it was assumed that the total mileage of the car will be 150,000 km over 10 years. For the electric vehicle, calculations were made assuming five different sources of electricity (from coal only, from natural gas only, from PV and wind turbines, an average mix of European power sources and an average mix of Polish power sources; W1–W5 designations, respectively). For individual sources of electricity, cumulative CO2 emissions were taken into account, that is, resulting both from the production of electricity and the use of the resources (for example, technical service per 1 kWh of electricity produced). The obtained results of the analysis show that for the adopted assumptions regarding operation, for variants W2–W5, the use of an electric car results in lower cumulative CO2 emission than a the use of a combustion car. For a combustion car, the value was 37,000 kg-CO2, and for an electric car, depending on the variant, the value was 43, 31, 16, 23 and 34 thousand kg-CO2 for variants W1 to W5, respectively. Based on the emissions results obtained for individual stages of the use of selected vehicles, a comparative analysis of cumulative CO2 emissions was performed. The purpose of this analysis was to determine whether the replacement of an existing combustion car (that has already been manufactured; therefore, this part of the analysis does not include CO2 emissions in the production stage) with a new electric car, which has to be manufactured, therefore associated with additional CO2 emissions, would reduce cumulative CO2 emissions. Considering three adopted average annual car mileages (3000, 7500 and 15,000 km) and the previously described power options (W1–W5), we sought an answer as to whether the use of a new electric car would be burdened with lower cumulative CO2 emissions. In this case we assumed an analysis time of 15 years. For the worst variant from the point of view of CO2 emissions (W1, electricity from coal power sources only), further use of a combustion car is associated with lower cumulative CO2 emissions than the purchase of a new electric car over the entire analyzed period of 15 years. In turn, for the most advantageous variant (W3, electricity from PV or wind power sources) with an annual mileage of 3000 km, the purchase of a new electric car results in higher cumulative CO2 emissions throughout the analyzed period, whereas for an annual milage of 7500 or 15,000 km, replacing the car with an electric car “pays back” in terms of cumulative CO2 emissions after 8.5 or 4 years, respectively.

1. Introduction

The greenhouse effect occurs naturally on Earth, resulting in an optimal temperature for life, which would be much lower without it. However, since the industrial revolution, the concentration of greenhouse gases in the atmosphere has increased sharply as a result of human activity. Global temperature has risen by approx. 1.2 °C since the industrial period. Such growth disturbs the natural balance of the environment, which increases the risk of dangerous and irreversible changes. Its impact affects all sectors of the economy and people’s lives. In the last century, the concentration of CO2 has rapidly increased by more than 30%. The increase in the average global temperature depends on the concentration of carbon dioxide in the atmosphere; therefore, it is necessary to stop this phenomenon as soon as possible [1].
Limiting CO2 emissions is a huge problem today. CO2 emissions are related to various types of human activity [2,3]. One of these areas is transport, in particular, land transport [4]. The growing number of vehicles each year causes increasing emissions of this gas into the atmosphere. In the European Union, almost 72% of total CO2 emissions come from the transport sector [5]. Numerous actions have been taken to change this by prohibiting the sale of combustion cars or prohibiting their entry into city centers [6]. We can reduce CO2 emissions from vehicles by increasing vehicle efficiency [7], implementing better infrastructure for road networks, or using greener energy, such as biofuels [8]. In addition, we can reduce carbon dioxide emissions by increasing the role of public transport.
The graph in Figure 1 shows that passenger cars account for the largest share of emissions in the transport sector in Europe: 60.7%. Although they emit less carbon dioxide than heavy trucks by, constituting such a large share of the total number of vehicles, they are responsible for the largest amount of CO2 emissions from road transport.

2. Literature Review

The passenger car industry is dominated by combustion cars with spark-ignition engines. However, recently, the market has seen an increase in the number of vehicles using alternative fuels of approx. 14% and an increase in the number of hybrid cars, although they currently account for less than 0.5% of all vehicles. These numbers are still changing in favour of electric cars, although there are relatively few of them in Poland, for example [11] (Figure 2).
Electrically powered vehicles are usually associated with the fact that they are less harmful to the environment because the car itself does not emit CO2 into the atmosphere. When driving such a vehicle, it does not burn fuel, but despite the strong emphasis on the “electrification” of passenger cars, it is not fully proven that they are the best (i.e., the most ecological) solution to the problem of transport among the currently available technical solutions. We can compare, for example, work [12] in which the authors also analyzed an internal combustion engine powered with hydrogen from renewable sources.
Carbon dioxide emissions depend on the source by which the vehicle’s batteries are powered. If only electricity from renewable sources is considered, it can be assumed that an electric car is environmentally cleaner during its operation than a vehicle with a spark-ignition engine. However, taking into account the share of renewable energy sources in Poland and CO2 emissions produced in the production of electric cars, the difference in carbon dioxide emissions between these vehicles does not necessarily speak in favour of electric cars [13]. However, the production process of traction batteries has the greatest potential to reduce emissions of harmful greenhouse gases. Research shows that approx. 50% of the emissions of these gases are related to the energy consumption in the production of cells themselves. The remainder is related to the materials used in the production of the cell (approx. 20%), the shield (approx. 10–15%) and the remaining parts (15–20%) [14]. Differences in emissions of harmful gases are also caused by the place where the batteries are produced; those produced in European factories result in much lower emissions than those produced in China. Producers are starting to cut back on energy use or use renewable energy for production; therefore, battery manufacturing could emit almost half the harmful greenhouse gases in the coming years than it does today. Thus, electric cars have a great advantage over combustion engine vehicles in terms of emission reduction potential in production. However, the big problem with these cars is the development of batteries that are no longer suitable for further work because the disposal of used batteries from electric vehicles is very harmful to the environment and also results in high CO2 emissions [15,16,17].
The increasing number of electric vehicles and the recommendation of manufacturers to replace batteries every 5 years results in a huge number of batteries that must be disposed of after being withdrawn from use, which translates into additional carbon dioxide emissions from these processes. Countries with a large number of electric cars have begun to deal with this problem, reusing batteries that are operational but no longer suitable for powering vehicles. In Japan, Nissan uses these old batteries to illuminate cities, mounting them in streetlamps powered by photovoltaic cells [18,19].
Many researchers have compared the CO2 emissions of electric and combustion cars but only for a distance of 1 km, which does not make it possible to compare the total cumulative emissions for the entire life cycle of vehicles [20,21]. Comparative analyses of this type, e.g., for hybrid cars, show the importance of the problem and the multitude of factors affecting the final emissivity of individual means of transport, as described in [22].
In turn, in [23,24], the authors described and compared the costs (in cash expenditure) of owning and using an electric vs. a combustion car. However, the financial costs do not give a true CO2 picture, as they can be ‘falsely’ inflated, for example, by required city center tolls for combustion cars.
The specific conditions of individual countries should also be taken into account during analysis. For example, in [25,26], the authors analyzed opportunities for the development of the electromobility market in Poland; a more detailed analysis of barriers that may slow down the development of such as market can be found in [27,28]. Due to the varying share of renewable electricity sources in the overall balance of electricity produced in different countries, the results of similar analyses may not always be uncritically transferred. This is summarized in Table 1.
To sum up, no studies have been conducted comparing the cumulative CO2 emissions for the stages of production and use of an electric car with those of (only for the use stage) of an already existing (i.e., CO2 emissions at the production stage have already taken place) combustion car. There are no such comparisons about CO2 emissions in the production of electricity needed to power an electric car and varying average annual mileage for both compared cars, regardless of the adopted method of analysis, i.e., the usual method (points c. and d. in Table 1) or with the use of LCA methods (point e. in Table 1) [29,30,31].
Since there is no such analysis, the aim of this work is to compare CO2 emissions related to the production and use of a new electric car and the continued use of an old (operational) combustion car, not taking into account CO2 emissions at the stage of construction of the combustion car (because it is already built and emissions have already taken place). Such analysis should be taken into account in the development of national policies regarding the rules for the use and sale of cars.
The new contributions of this work are:
  • Assessment of when, from the point of view of CO2 emissions, the replacement of an internal combustion vehicle with an electric one is justified;
  • The assessment was carried out for five variants of electricity production and three scenarios of car use based on average annual mileage.

3. Material and Methods

3.1. Purpose and Scope of the Analysis

With this analysis, we aimed to determine if and when the continued use of an existing (functional and already produced) combustion car would result in a greater total CO2 emission than replacing the car with a new electric one (the production and use of which is also burdened with total CO2 emissions). The analysis included five variants of electricity production used to power an electric car with varying degrees of CO2 emissions, as well as three different scenarios for the annual mileage of new electric and old combustion cars. The performed analyses are the basis for assessing when (from the point of view of CO2 emissions) an old, operational combustion car should be replaced with a new electric car, with the goal of reducing CO2 emissions.
The scope of this work covers the description of CO2 emissions in particular stages of life of two similar selected cars (electric and internal combustion) based on source data.
In summary, the aim of the work is:
1.
Determination of the cumulative CO2 emissions in the production, use and disposal stages for two comparable cars:
  • With a combustion engine;
  • With electric drive; in this case, the analysis was performed for five variants of electricity sources to charge the vehicle
The above-mentioned analysis was carried out assuming a total mileage of vehicles during use of 150,000 km over 10 years.
2.
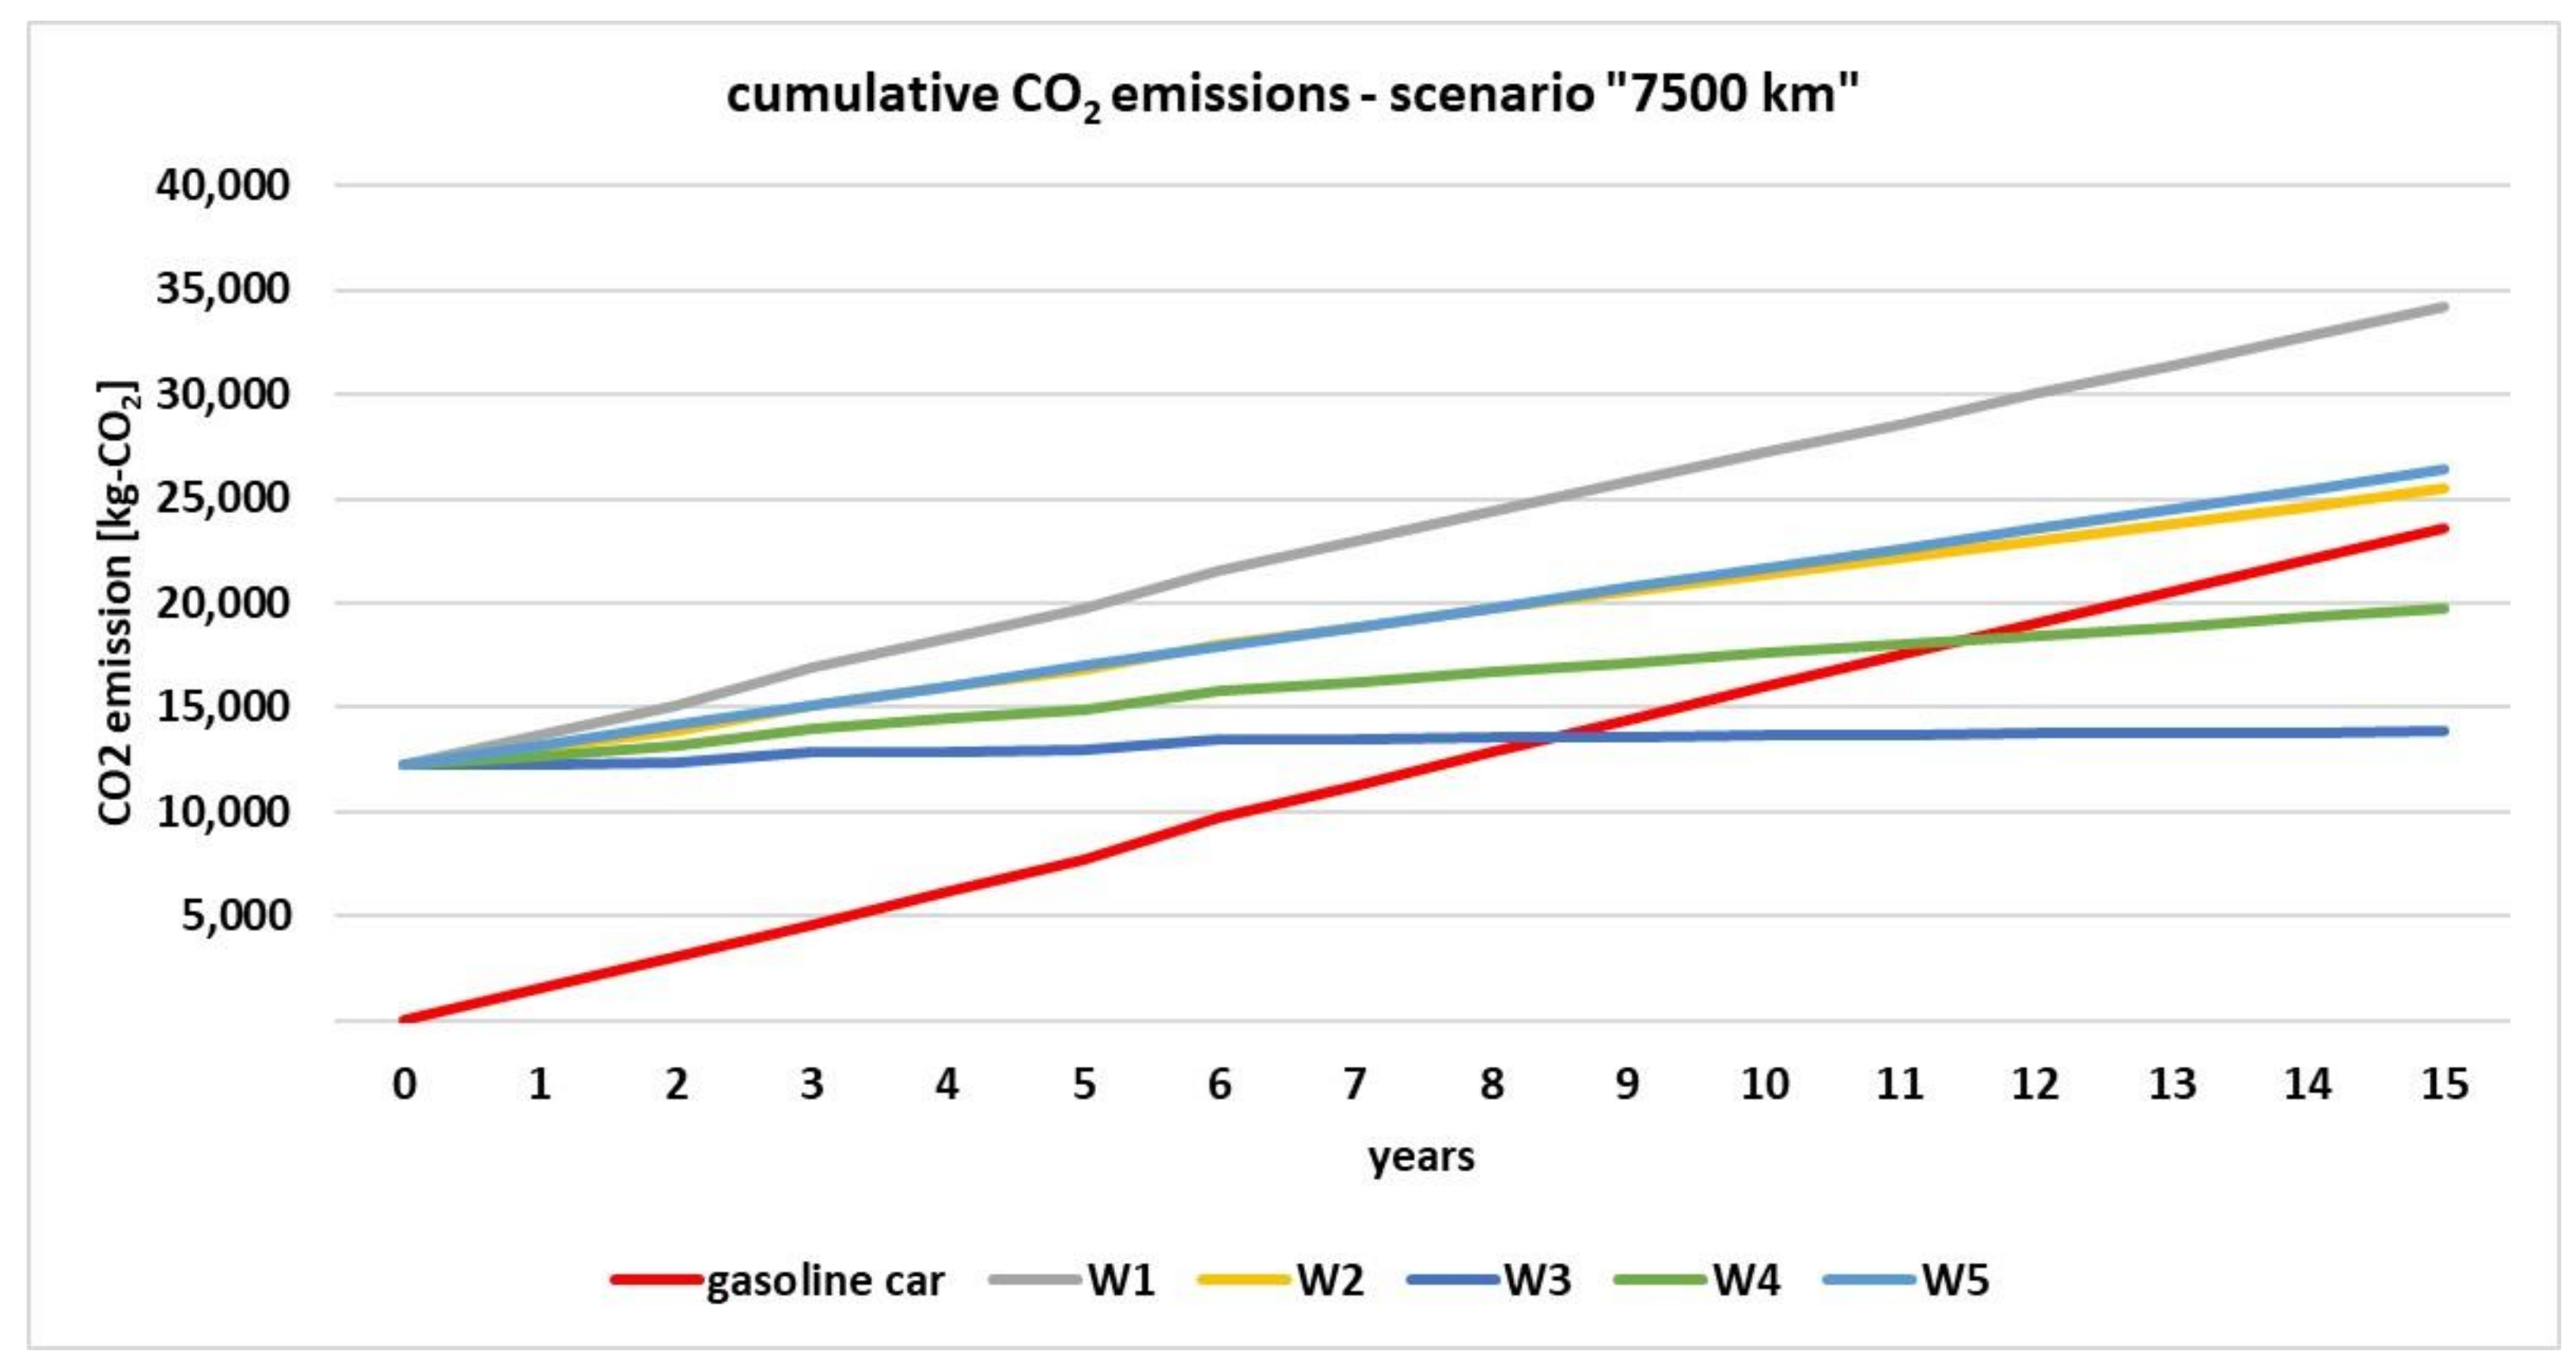
Based on the results and analysis obtained in point 1, determination of when, from the point of view of cumulative CO2 emissions, the replacement of an old (functional) combustion vehicle with a new electric one is justified. The analysis was performed for three scenarios, based on average annual mileage of 3000, 7500 and 15,000 km.

3.2. Data Selection and Analysis

The analysis was carried out on the same car model in two configurations: a typical representative of the C segment—mid-range passenger cars, i.e., Volkswagen Golf VII generation. The first configuration is a gasoline vehicle with a 1.4 TSI 140 KM/103 kW engine. The second vehicle is an e-Golf equipped with a 100 kW electric motor and 35.8 kWh battery capacity (based on publicly available data) [32].
The dataset needed to calculate the cumulative life cycle CO2 emissions of both vehicles is comprised of 5 steps:
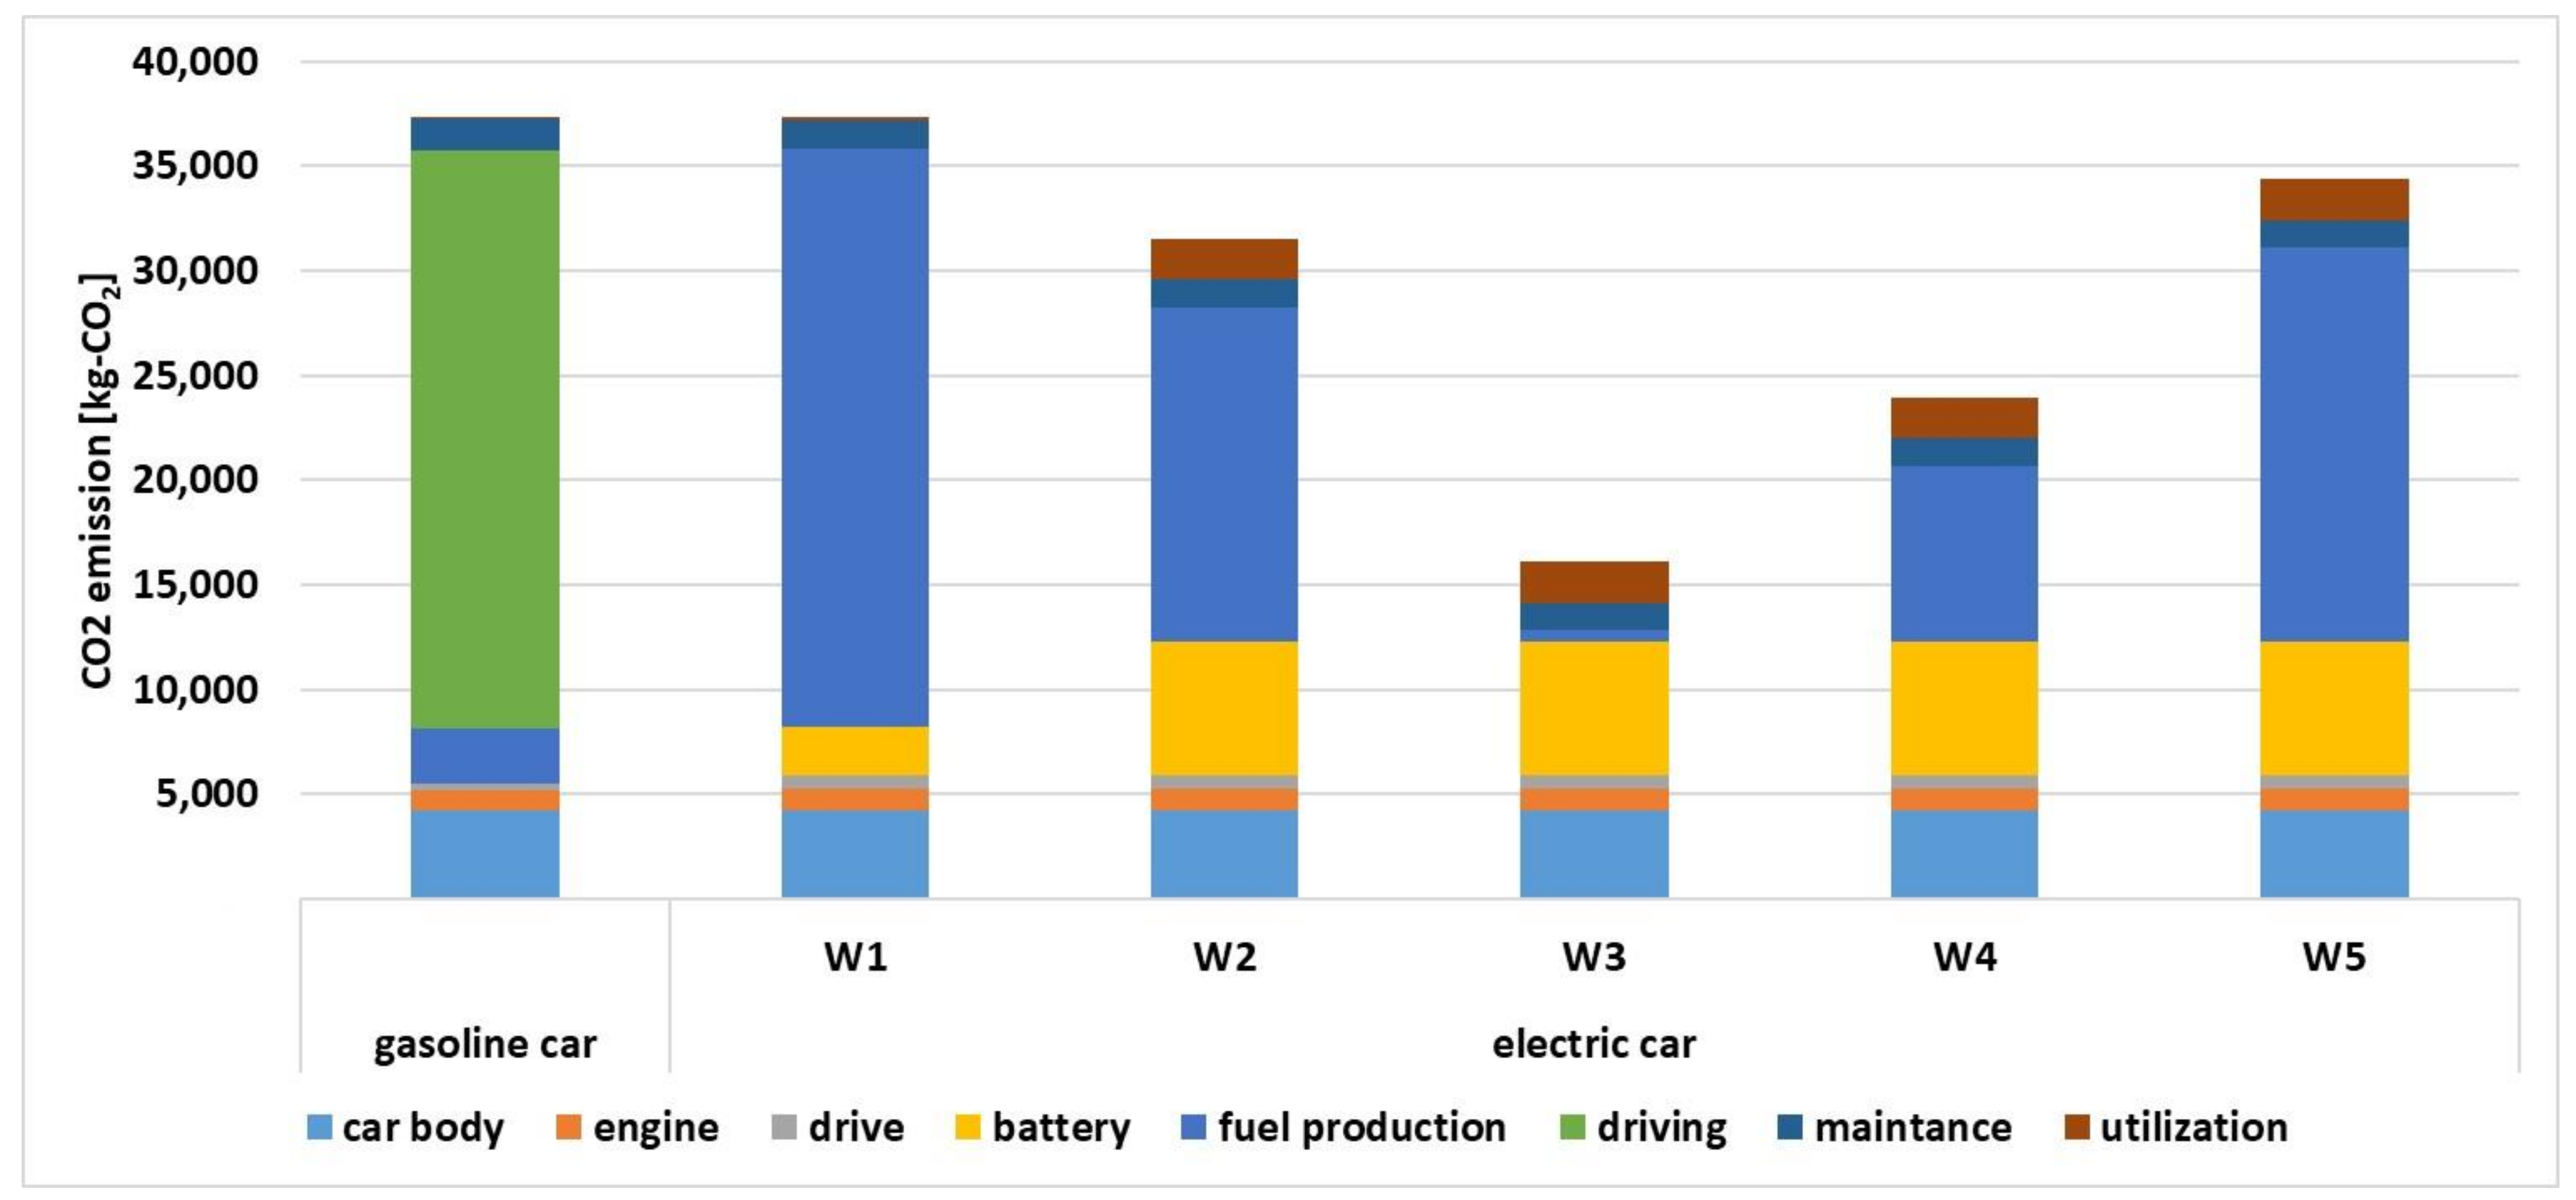
  • Step 1 relates to the production of the vehicle, which includes the extraction of raw materials, the fabrication of parts and components and their assembly;
  • Step 2 includes the production of fuel for a gasoline engine car and generation of electricity for an electric car;
  • Step 3 concerns the use of the vehicle, including fuel consumption while driving;
  • Step 4, relates to maintenance, which takes into account CO2 emissions in the production of spare parts and their disposal;
  • Step 5 deals with disposal after use, i.e., the disposal of the vehicle and the recycling of the dismantled parts.

3.2.1. Vehicle Production

There are differences when calculating the CO2 emissions in the production stage for a combustion vehicle and an electric vehicle. However, by selecting the same car model, the vehicle parts, such as chassis, interior fittings, tires, etc., are identical in both cases. The only differences are in the production of engines and drive systems.
The amount of CO2 emissions during production was based on data available in the literature. Taking into account the extraction of ore metal and materials, the production of parts and components and their assembly for all vehicle components, excluding the engine and drive system, the CO2 emission level for both cars was determined to be 4219 kg-CO2 [30,33]. For a combustion vehicle, emissions of carbon dioxide in the production of the engine and drive system were 1274 kg-CO2, for a total amount of 5493 kg-CO2 [30].
According to [34], emissions amount to 1070 kg-CO2 for production of an electric engine, plus 641 kg-CO2 for the drive system (see [35]). According to several literature sources, the emission level for battery production [36,37] is very different. In [38,39], the authors determined CO2 emissions from the extraction of materials to finite batteries and described the emissions in the production of two types of lithium-ion batteries: NMC (with a lithium–nickel–manganese–cobalt cathode) and LFP (with a lithium–phosphor–iron cathode).
Large differences in the CO2 emissions of batteries reported in the literature have to do with where they are produced, the type of cathode and the components used for their production [40,41]. Consequently, based on the calculations in [30], the CO2 emission value was assumed to be 177 kg-CO2/kWh. The total for the whole battery in an electric car is 35.8 × 177, for a total of 6336.6 kg-CO2.
The calculation results for the vehicle production stage are shown in Table 2.

3.2.2. CO2 Emissions in Fuel Production and Electricity Generation

The fuel (gasoline) production process comprises multiple stage, including extraction, transport, refining, etc. In each of these stages, carbon dioxide is released, which should be included in the cumulative CO2 emissions of the vehicle. Emissions depend on the place of extraction, the quality of crude oil and all production processes. In Europe, CO2 emissions from gasoline production are 224 g-CO2/L [42,43].
The level of cumulative CO2 emissions related to the production of fuel during the operation of the car depends on the average fuel consumption of the vehicle, the carbon dioxide emission factor during fuel production and the number of kilometers traveled in the life cycle of the tested car (Equation (1)):
E p p =   e p   ·   S b   ·   l 100   g C O 2
where:
Epp—total CO2 emissions during fuel production, related to kilometers traveled over the whole considered operation period of the vehicle (g-CO2);
ep—CO2 emissions from gasoline production (g-CO2/L);
Sb—average gasoline consumption by the vehicle (L/100 km);
l—number of kilometers traveled during the considered operation period of the vehicle (km).
According to the available data, the Volkswagen Golf VII 1.4 TSI 140 KM has an average fuel consumption of 5.2 L/100 km, which is comparable with the fuel consumption and CO2 emissions of other passenger cars [32,44]. However, tests carried out by the PSA Group on the actual fuel consumption showed that the values given by the manufacturer are, on average, underestimated by 2–3 l/100 km. This is mainly because manufacturers carry out combustion tests under laboratory conditions, which are significantly different from those on the road [45]. When calculating the actual CO2 emissions related to fuel production, the above-mentioned average value (2.5 L) was used for the calculations, and consequently, the actual combustion value, “Sb”, is equal to 7.7 L/100 km for driving in the mixed mode.

CO2 Emissions from Electricity Production

To best illustrate the differences in carbon dioxide emissions, five variants of electricity generation sources and their intensity of cumulative CO2 emissions were analyzed [46,47,48], including about 10% of emissions related to transport, extraction, etc., of the fuel itself:
  • W1—CO2 emission intensity during electricity generation from coal only: 1160 gCO2/kWh;
  • W2—CO2 intensity during electricity generation from natural gas: 671 gCO2/kWh;
  • W3—CO2 intensity during electricity generation from wind energy or PV panels between 20 and 25 gCO2/kWh (assumed): 23 gCO2/kWh;
  • W4—CO2 intensity during electricity generation for the average European mix: 353 gCO2/kWh;
  • W5—CO2 emission intensity during electricity generation for the average Polish mix: 790 gCO2/kWh. Data were determined based on the electricity benchmark from the National Center for Emissions Management in Poland and taking into account transmission losses [48].
The energy consumption provided by the manufacturer of the Volkswagen e-Golf electric car with an engine power of 100 kW is 12.7 kWh/100 km. However, the real consumption of electricity, as provided by the Environmental Protection Agency, is, depending on the car model, higher than the catalogue consumption by 15–35% [49]. The actual consumption was assumed to be 25% higher.
The level of total CO2 emissions during the production of electricity needed to power the vehicle depends on the electricity consumption of the vehicle, the emission factor and the number of kilometers traveled in the life cycle of the tested car. The result is the amount of CO2 that will be emitted during the generation of electricity needed to power the electric vehicle during its entire (considered) life cycle (Equation (2)):
E p e n =   w n   ·   Z e l   ·   l 100   g C O 2
where:
Epen—total CO2 emissions of electricity generated to power the vehicle in the given period (mileage) (g-CO2);
Zel—electric energy consumption by the vehicle (kWh/100 km);
wn—CO2 emission factor (gCO2/kWh) for variants 1–5;
l—number of kilometers traveled during the considered phase of vehicle operation (km).
The results of cumulative CO2 emissions from electricity production for the actual electric energy consumption of the vehicle while driving (on average, 25% greater than those given in the technical data of the vehicle), amounting to 15.88 kWh/100 km, taking into account the indicators of CO2 emissions from electricity sources for individual production variants and the number of kilometers traveled during the life of the vehicle at the level of 150,000 km.

3.2.3. Fuel Combustion in the Use Phase

An electric vehicle has zero combustion in the use phase; all emissions related to its operation are generated in the electricity generation stage. A gasoline-powered car, in addition to emissions produced during the fuel production phase, generates emissions during the use phase by burning fuel. The level of CO2 emissions in the operation phase of a combustion vehicle depends on the average fuel consumption of the vehicle, carbon dioxide emissions during the combustion of 1 L of fuel and the number of kilometers traveled in the life cycle of the tested car. According to [50] and chemical calculation, carbon dioxide emissions produced during the combustion of 1 L of gasoline total 2392 g-CO2/L. The result is the amount of CO2 that will be emitted during the use phase of a combustion car over its entire life cycle (Equation (3)):
E j =   e s   ·   S b   ·   l 100   g C O 2
where:
Ej—total CO2 emissions in the considered vehicle operation phase (g-CO2);
es—CO2 emissions during fuel combustion (g-CO2/L);
Sb—average gasoline consumption by the vehicle (L/100 km);
l—number of kilometers traveled during the considered phase of vehicle operation (km).

3.2.4. Vehicle Maintenance

While the vehicle is in use, consumable items, such as motor oil, coolant and tires must be replaced. Other consumables, due to their low impact on CO2 emissions and the fact that they are present in both vehicles, were omitted in this study. In the operation phase of internal combustion vehicles, it is necessary to take into account the replacement of the lead-acid battery, the replacement frequency of which, unlike other spare parts during the use of the car, does not depend on the number of kilometers traveled but on the years and method of operation. The need to replace the lead-acid battery depends on many factors, such as long stops or a large number of short routes. The Volkswagen service manual states that the battery should be replaced every 5 years [18,51] and even more frequently under conditions of short journeys with frequent start-ups (city driving). CO2 emissions during battery production were assumed at the level of 19.5 kg-CO2 [30]. The results are summarized in Table 3.

3.2.5. Management after Use

In the final stage of a vehicle’s life, regardless of its type, it emits a relatively low amount of CO2 compared to the previous stages. An electric car, however, has slightly higher emissions at this stage due to the presence of batteries. In most LCA studies, the release of CO2 in battery recycling is neglected due to difficult access and the small amount of data on the process. No detailed analysis has been conducted in the available literature on the cumulative CO2 emissions related to the disposal of electric batteries. Based on the experience of the authors in [53], it was assumed at a level of 30% of the emissions in the production stage. The largest share of carbon dioxide emissions in this stage is the storage of disassembled parts, as well as their shredding and sorting. Dismantling has a negligible contribution to CO2 emissions and is therefore usually neglected. Table 4 shows the end-of-life processes and their carbon dioxide emissions [30,34,54].
The parts disposed of at this stage include in the internal, external and body fittings. By using the same car model, the CO2 emissions related to this stage were assumed to be the same for both vehicles. At this stage, the model does not include emissions related to, e.g., transport of scrap to the steelworks, assuming such emissions as part of the cumulative emissions of new manufactured materials.

3.3. Calculation of Cumulative CO2 Emissions

Cumulative life cycle CO2 emission calculations for both vehicles were performed for European conditions. This calculation covers the period from production to management after use, with a use phase of 10 years and an assumed traveled distance of 150,000 km. For the electric car, five variants of electricity production were considered. Calculations of the cumulative CO2 emissions were determined as the sum of the values calculated in Section 3.2.1.–3.2.5 for internal combustion and electric cars. The obtained results are shown in Figure 3 and Table 5.

4. Results

As a result of using the same car model for both vehicles, there was not much difference in carbon dioxide emissions in the production phase; differences are caused by the presence of batteries in electric cars and the location of production. CO2 emissions related to an electric vehicle depend on the energy sources used to power its batteries, which depend on the place of use, with differing operational emissions. All variants were adopted for a vehicle lifetime of 150,000 km; driving more kilometers in the case of an electric car would involve the need to replace the battery, which would result in a significant increase in cumulative CO2 emissions during the vehicle life cycle. The need to replace the battery after this period has been described in [55,56], in which the authors determined the guaranteed “life” of a battery in an eclectic Volkswagen to be 160,000 km.
It is worth noting that in the case of electric cars powered by electricity derived from coal combustion, CO2 emissions in the analyzed period of operation are more than 10% higher for the electric car.
It should also be emphasized that in the case of using all other sources for electricity production, the electric car emits a lower amount of CO2 in the analyzed period: electricity from gas, by 15%; from wind farms or PV installations, by as much as 56%; and for the average European “basket”, by 35%. In the case of W5 (average CO2 emissions in the mix of electricity production for Poland), the electric car emits 8% less CO2 over the entire period of its intended use.
From the data shown in Table 5, it can also be seen that even in the above-described case for electricity obtained only from coal (W1), the fact that the combustion car emits less CO2 is influenced by CO2 emissions related to the construction of electric car batteries. If this value were only 2300 kg-CO2 (instead of the adopted 6337), then an electric car powered by the worst scenario—W1—would have comparable but still slightly lower CO2 emissions. It can be hoped that with the increasing production of batteries for electric cars, the technological process (for the entire production stage, from the extraction of materials to the final transport of the finished element) will become more ecological (efficient), and consequently, the total CO2 emissions related to battery construction will decrease. However, based on the comparison in [57], until now, nothing has changed with respect to these factors. Based on the obtained results, it can be concluded that in the “car body” production stage of the engine and drive, there are no differences in the level of CO2 emissions for the two analyzed car models. The biggest differences are in the production of batteries: 6337 and 19.5 kg-CO2 in the case of electric and internal combustion cars, respectively. Similarly, at the disposal stage, the disposal of an electric car requires more than 1900 kg-CO2 higher emissions. This is mainly due to the high CO2 emissions associated with the disposal of batteries. In turn, the annual maintenance of both vehicles produces comparable CO2 emissions. However, the type of power source has the greatest impact on the ecological use of an electric car in relation to a combustion engine. In the case of the W3 variant (electricity from PV or wind), the cumulative CO2 emissions for an electric car are more than twice as low as those for a combustion vehicle.
Unfortunately, it is impossible to build an electricity supply system based on PV and wind turbines alone [58,59,60]. As a result, national energy systems must include generation capacities from technologies/sources with higher cumulative CO2 emissions (e.g., electricity from gas turbines, W2), as they are needed to stabilize the system. Hence, the analysis should take into account a mix of sources of electricity production (even if individual electric cars will be charged mainly from, e.g., PV panels), and the overall balance must also include CO2 emissions from other sources of electricity generation, e.g., variant W4 (European mix) or W5 (Polish mix). In the end, this means that the electric car, under the W4 variant, produces only about 14,000 kg-CO2, which is lower than amount produced by a combustion car under the same scenario.
The question can be raised as to whether all running combustion cars should be replaced with new electric car (ignoring the possibility of producing such a large number of electric cars in such a short time), as they are greener and emit less CO2 overall. To verify this, based on the obtained CO2 emission results for individual stages, further analyses can be carried out (which were absent in the cited sources) regarding the ecological profitability (related to CO2 emissions) of replacing existing and operational combustion cars with new electric cars.
For the electric car, CO2 emissions at the production stage were taken into account, according to data from Section 3.2.1 and Table 2. For the combustion car, CO2 emissions at this stage were not taken into account because, according to our assumptions, the car is already manufactured, so the CO2 emissions related to the production stage have already been produced.
The cumulative CO2 emissions in individual years of operation were calculated according to Equations (1) and (2) (Section 3.2.2) for the five variants (W1-W5) for an electric car and a combustion car according to Equation (3) (Section 3.2.3). The CO2 emissions related to inspections were also taken into account according to the data in Table 3.
On this basis, the total cumulative CO2 emissions for 15 consecutive years of operation of the analyzed vehicles were calculated for three scenarios related to the average annual mileage of the car and the five power variants (W1–W5). Based on the data from Table 5, three simulations were carried out.
It was assumed that each of the cars will drive 15,000 km each year and be subjected to periodic inspections and maintenance (oil change, tire change, etc.) based on the assumptions given in Section 3.2.4. As a consequence, the cumulative CO2 emissions related to the use of the two cars—the old but efficient combustion car and the new electric car—for five different sources of electricity were calculated according to the assumptions described in Section 3.2. The results are shown in Figure 4.
It was assumed that each of the cars will drive 7500 km each year, with all other parameters unchanged. The results are shown in Figure 5.
It was assumed that each of the cars will drive 3000 km a year, with all other parameters unchanged. The results are shown in Figure 6.
The average mileage for passenger cars in Poland is about 8000 km [61]; this corresponds to the data adopted in the “B” scenario. The choice of the average mileage value for individual scenarios was based on literature data. In [62], the average annual mileage of private passenger cars was assumed to be 10,000, 15,000 and 20,000 km. In [63], the average mileage of the car was given as 13,785 km, which corresponds to the adopted scenario of 15,000 km. In [64], the average mileage for various European countries was given, equal to: for France, 7946 km; for the UK, 9946 km, which corresponds to the 7500 km scenario. The 3000 km scenario corresponds to the minimum annual mileage generated for a second family car based on [64,65]. The results are summarized in Table 6.

5. Discussion

In the case of electricity generation “from coal”, in practice, the replacement of a combustion car with an electric car will not improve global CO2 emissions in any of the scenarios.
Even in the case of electricity production from wind and PV, in the case of low annual mileage (scenario 3000 km), replacing a combustion car with an electric one will result in greater total CO2 emissions than using the old combustion car throughout the entire planned period/mileage. In the case of the Polish electricity production mix (case W5), with higher annual mileage, the replacement of a combustion car with an electric one (15,000 km/year scenario) will “pay back” after 9 years from the point of view of CO2 emissions. However, in the remaining scenarios (7500 km and 3000 km/year), it will not be ecologically beneficial. In the case of the average European mix, replacing a combustion car with an electric car will pay for itself in the 15,000 km/year scenario after 5.5 years and in the 7500 km/year scenario after 12 years. In the low-mileage case (up to about 4000 km/year), the total CO2 emissions associated with replacing a combustion car with a new electric one will be higher over the entire assumed simulation period.
These results should influence national policies regarding the replacement and use of internal combustion cars. Top-down prohibition or obstruction of the use of combustion cars (old but functional), e.g., by increased fees, taxes, additional fees for entering city centers (or a complete ban on entry for combustion cars) may result in higher cumulative CO2 emissions caused by the purchase of new electric cars by residents.
A similar result was not found in any of the quoted literature (Table 1) because in the analysed literature, the authors focused on the impact of purchasing a new electric or combustion car on total (cumulative) CO2 emissions.
The obtained results are completely different than those reported in [66], in which the authors showed that replacing combustion cars with electric cars is always beneficial from the point of view of CO2 emissions. This is true only if the emissions related to the driving of the car itself are taken into account; however, if emissions are taken into account (especially) at the stages of production and maintenance, unfortunately, the conclusions are exactly the opposite.
The advantage of an electric car over a combustion car is its enormous potential in the fight against global warming by reducing CO2 emissions related to the constantly developing technologies during battery production and the pursuit of an increasing share of renewable energy sources in electricity production. On the other hand, using old but still functional combustion cars, depending on the average annual mileage, will not increase global CO2 emissions at all. Of course, combustion cars emit CO2, e.g., in city centers, and CO2 emissions from electric cars (in the W1, W2, W4 and W5 scenarios) are produced outside city centers. Additionally, combustion cars emit not only CO2 but also other harmful gases, e.g., NOx. It is true that in the case of obtaining electricity from the combustion of fossil fuels or biomass (scenarios W1, W2, W4 and W5), harmful compounds are also emitted (e.g., SO2, PM and others), but, again, outside of city centers.

6. Conclusions

Two main conclusions result from the conducted analyses:
  • When a passenger car needs to be replaced or purchased, from a CO2 emissions point of view, it is always better to buy a new electric car. This will result in lower cumulative CO2 emissions.
  • However, in the case of an efficient combustion car, its replacement with an electric car will result in greater cumulative CO2 emissions than the further use of the internal combustion car, although this depends on the average annual mileage and the source of electricity production, according to the data in Table 6.
A few detailed conclusions based on the calculations and simulations for the first part are as follows:
  • An internal combustion car produces cumulative CO2 emission for its entire life cycle (production, operation, maintenance and disposal) equal to 37,000 kg-CO2.
  • The obtained results of the analysis show that for the adopted operating assumptions, in variants W2–W5, the use of an electric car produces lower cumulative CO2 emissions than the use of a combustion car. For the electric car, the values of cumulative emissions were obtained depending on 43,000, 31,000, 16,000, 23,000 and 34,000 kg-CO2 for variants W1 to W5, respectively.
  • In the case of electric cars, the production and disposal of batteries have a very large impact on cumulative CO2 emissions. In this stage, producers of electric cars can improve their processes so that electric cars are more environmentally friendly by reducing CO2 emissions. Another factor that significantly affects the amount of CO2 emissions from electric cars is the type of electricity source (variants W1–W5).
  • Consequently, the main conclusion from this part of the research for a compact “B” class car is that when it is necessary to purchase a new car, an electric car will be greener (from the point of view of CO2 emissions) for the W2–W4 variants.
Furthermore:
  • In the case of an old (but still good) combustion car, the simulations (Table 6) show that in many cases, the total CO2 emissions will be much lower with continued use of the old but operational combustion car instead of buying a new electric one;
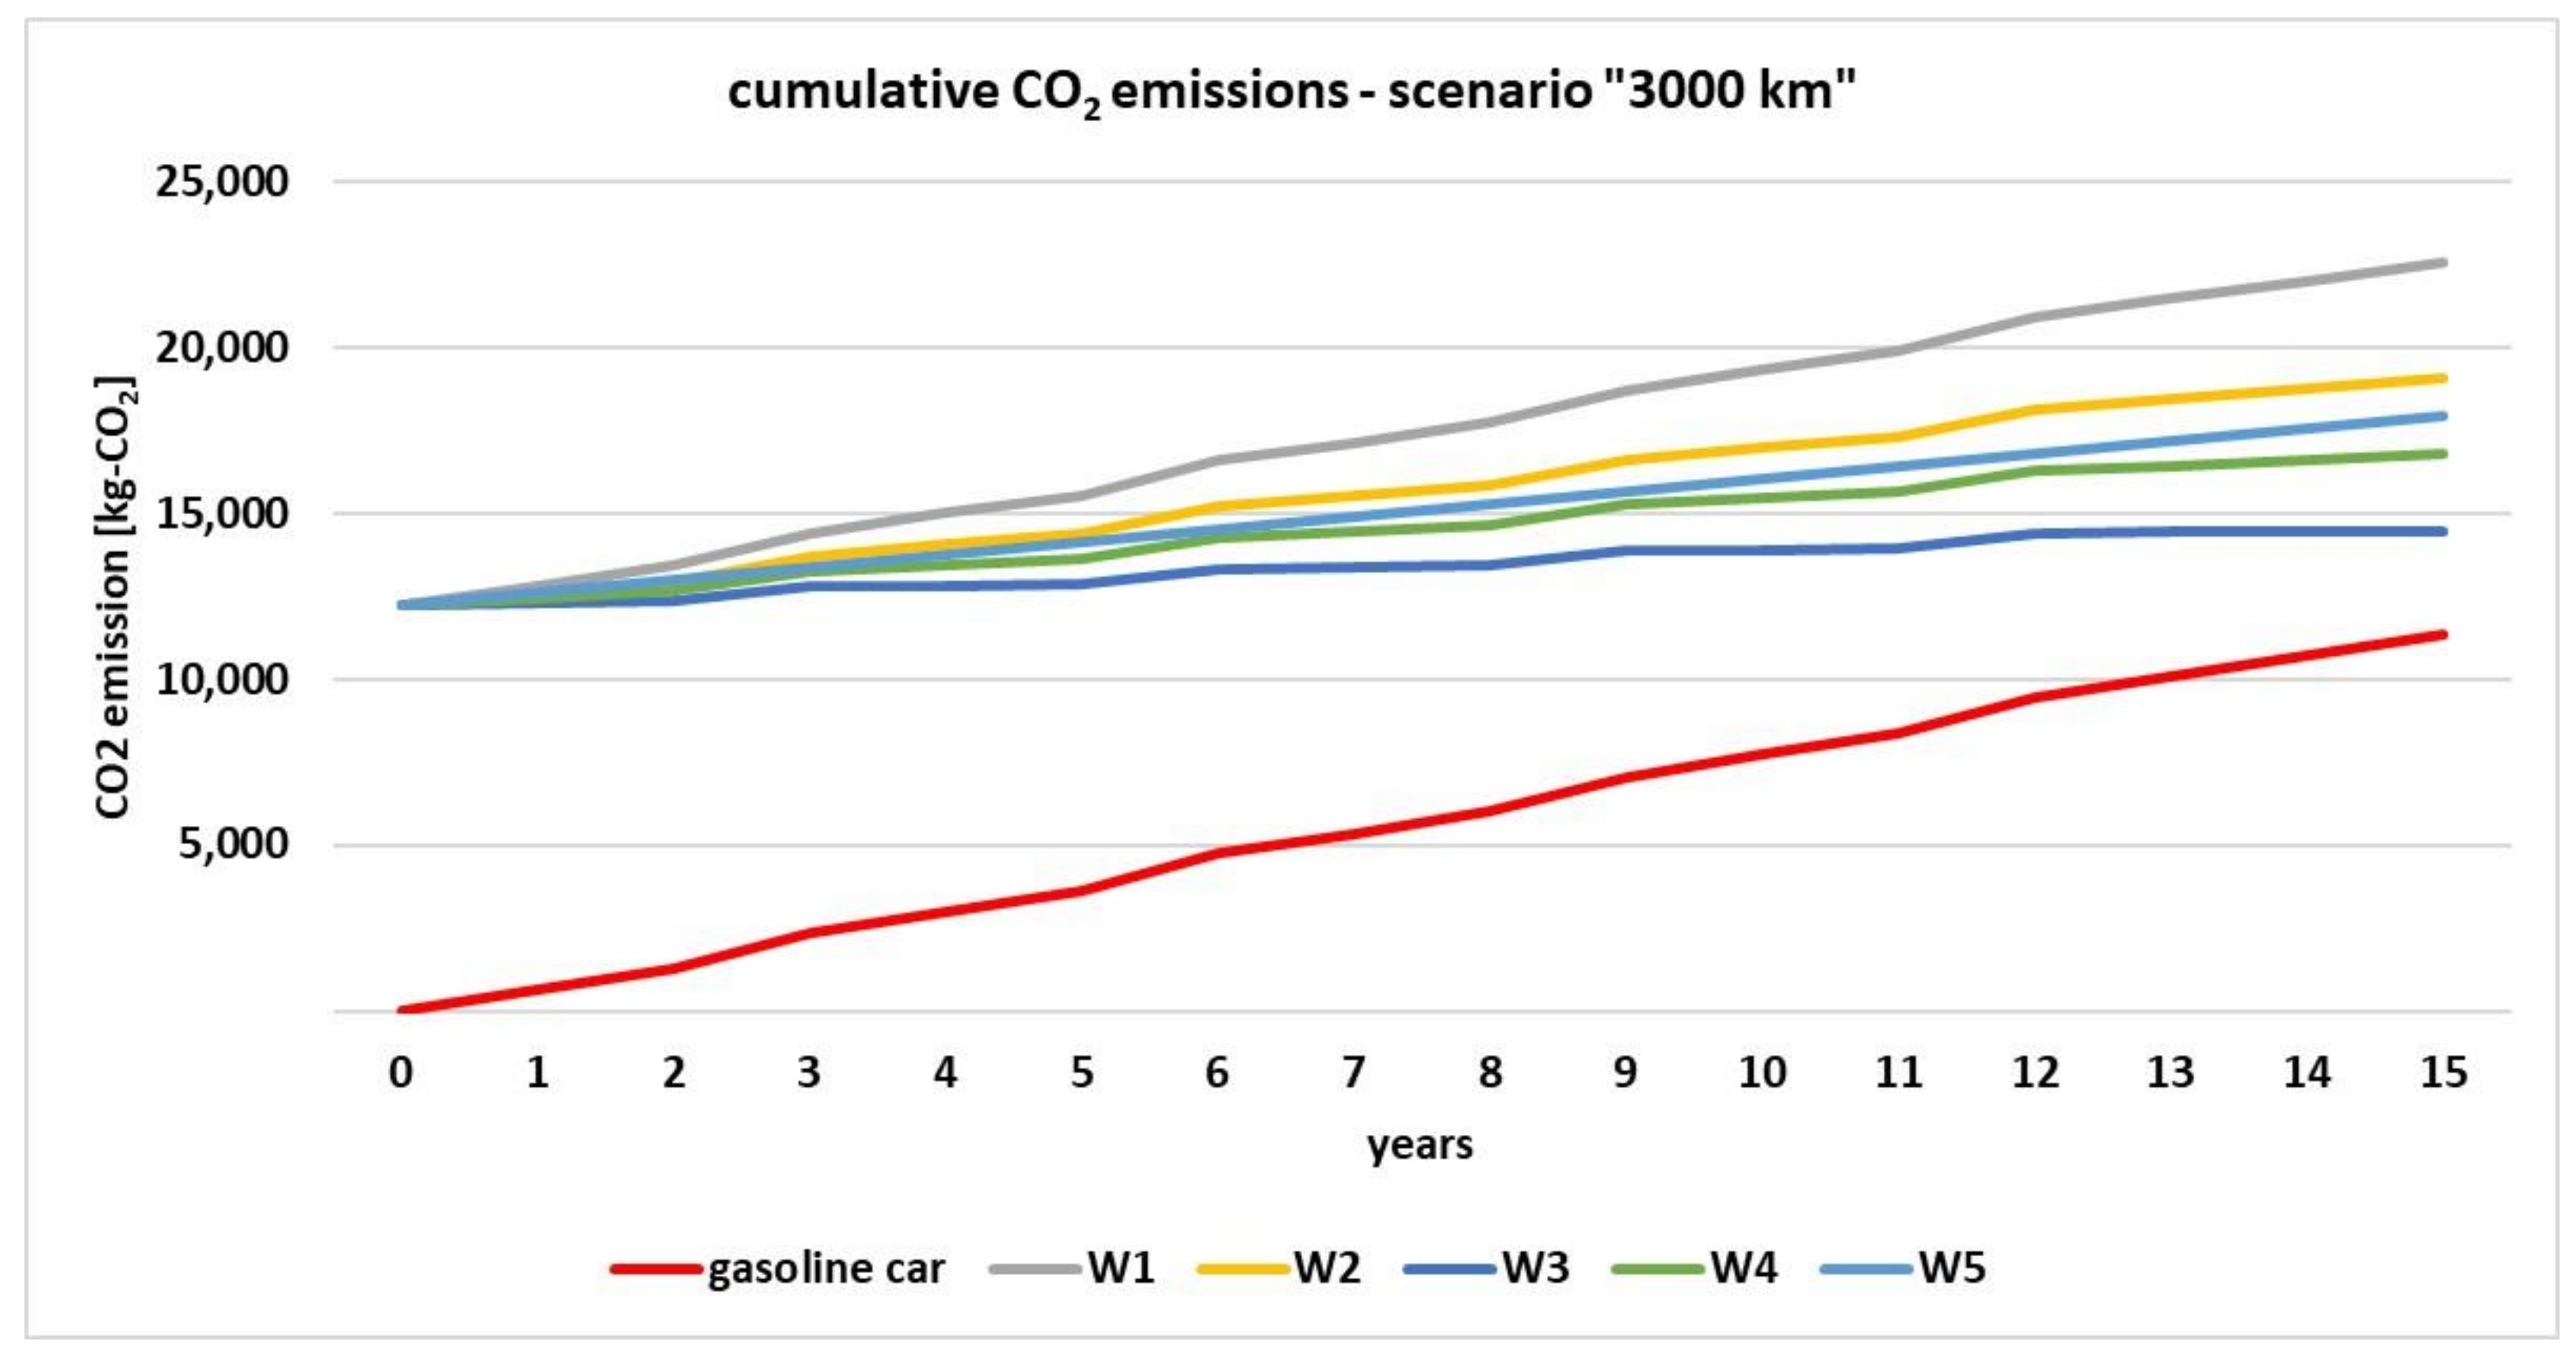
  • For the worst variant from the point of view of CO2 emissions (W1, production of electricity only from coal), further use of a combustion car will be associated with lower cumulative CO2 emissions than the purchase of a new electric car over the entire analyzed period of 15 years. In turn, for the most advantageous variant (W3, production of electricity from PV or wind) with an annual mileage of 3000 km, the purchase of a new electric car will result in higher cumulative CO2 emissions throughout the analyzed period, whereas for 7500 and 15,000 km of annual mileage, replacing the car with an electric one will “pay back” in terms of cumulative CO2 emissions after 8.5 and 4 years, respectively.
In summary, electric cars are not zero-emission, as some parts of society seem to be. To reduce CO2 emissions in real terms, the habits of residents, especially in cities, should be changed in practice around the world (not only in Europe) by promoting the idea of using public transport, bicycles or other greener means of transport or the idea of a “15 min city” (https://www.15minutecity.com/ (accessed on 18 October 2021) because this is the only way to reduce real CO2 emissions.
Even a weighty argument that limiting the use of combustion cars, even if it does not significantly reduce CO2 emissions, will contribute to the reduction in smog in cities is difficult to defend in the light of data, e.g., from “Arly” [67] showing that in summer, despite the comparable intensity of traffic in large cities of central Europe, air quality is much better than in winter. However, with little information related to battery recycling and CO2 emissions related to this process, it is currently difficult to say what the environmental impact of the continuous production of new batteries will be.
Ultimately, the replacement of an electric car every five years with a new model, from the point of view of cumulative CO2 emissions and based on our calculations and simulations, will result in more CO2 emissions than the consistent use of an old combustion car for the remainder of the vehicle life cycle. This shows that only a complete change in “consumption” habits can help reduce CO2 emissions and fight global warming.

Author Contributions

M.N.: conceptualization, methodology, writing—original draft, writing—review and editing; A.Ż.: writing—original draft—introduction, data preparation; O.E.: investigation, resources, graphics processing. All authors have read and agreed to the published version of the manuscript.

Funding

This research received no external funding.

Institutional Review Board Statement

Not applicable.

Informed Consent Statement

Not applicable.

Data Availability Statement

Not applicable.

Acknowledgments

This publication was written as a result of the author’s internship in Ege University in Izmir, co-financed by the European Union under the European Social Fund (Operational Program Knowledge Education Development), carried as part of the Development Program at the University of Warmia and Mazury in Olsztyn (POWR.03.05. 00-00-Z310/17).

Conflicts of Interest

The authors declare no conflict of interest. The funders had no role in the design of the study; in the collection, analyses, or interpretation of data; in the writing of the manuscript, or in the decision to publish the results.

References

  1. Koutsoyiannis, D.; Kundzewicz, Z.W. Atmospheric Temperature and CO2: Hen-Or-Egg Causality? Science 2020, 2, 83. [Google Scholar] [CrossRef]
  2. Huang, J.; Zhang, G.; Zhang, Y.; Guan, X.; Wei, Y.; Guo, R. Global desertification vulnerability to climate change and human activities. Land Degrad. Dev. 2020, 31, 1380–1391. [Google Scholar] [CrossRef]
  3. Yoro, K.O.; Daramola, M.O. CO2 emission sources, greenhouse gases, and the global warming effect. In Advances in Carbon Capture; Woodhead Publishing: Sawston, UK, 2020; pp. 3–28. [Google Scholar]
  4. Hulshof, D.; Mulder, M. Willingness to Pay for CO2 Emission Reductions in Passenger Car Transport. Environ. Resour. Econ. 2020, 75, 899–929. [Google Scholar] [CrossRef] [Green Version]
  5. Smeds, E.; Cavoli, C. Pathways for Accelerating Transitions towards Sustainable Mobility in European Cities; Barcelona Centre for International Affairs (CIDOB): Barcelona, Spain, 2021. [Google Scholar]
  6. Alataş, S. Do environmental technologies help to reduce transport sector CO2 emissions? Evidence from the EU15 countries. Res. Transp. Econ. 2021, 101047. [Google Scholar] [CrossRef]
  7. Holmberg, K.; Erdemir, A. The impact of tribology on energy use and CO2 emission globally and in combustion engine and electric cars. Tribol. Int. 2019, 135, 389–396. [Google Scholar] [CrossRef]
  8. Krause, J.; Thiel, C.; Tsokolis, D.; Samaras, Z.; Rota, C.; Ward, A.; Prenninger, P.; Coosemans, T.; Neugebauer, S.; Verhoeve, W. EU road vehicle energy consumption and CO2 emissions by 2050–Expert-based scenarios. Energy Policy 2020, 138, 111224. [Google Scholar] [CrossRef]
  9. Gis, M. Emisja dwutlenku węgla z transportu drogowego-cz. 1 samochody klasy LDV. Transp. Samoch. 2017, 4, 67–76. [Google Scholar]
  10. Aktualności Parlamentu Europejskiego. Emisja CO2 z Samochodów Fakty i Liczby. 2020. Available online: https://www.europarl.europa.eu/news/pl/headlines/society/20190313STO31218/emisje-co2-z-samochodow-fakty-i-liczby-infografika (accessed on 18 October 2021).
  11. The European Automobile Manufacturers Association. ACEA—Trends in Fuel Type of New Cars Between 2020 and 2021, by Country. Available online: https://www.acea.auto/figure/passenger-car-fleet-by-fuel-type/ (accessed on 18 October 2021).
  12. Wanitschke, A.; Hoffmann, S. Are battery electric vehicles the future? An uncertainty comparison with hydrogen and combustion engines. Environ. Innov. Soc. Transit. 2020, 35, 509–523. [Google Scholar] [CrossRef]
  13. Transport & Environment’s 2020. How Clean Are Electric Cars? Available online: https://www.transportenvironment.org/challenges/cars/lifecycle-emissions/how-clean-are-electric-cars/ (accessed on 18 October 2021).
  14. Kim, H.C.; Wallington, T.J.; Arsenault, R.; Bae, C.; Ahn, S.; Lee, J. Cradle-to-Gate Emissions from a Commercial Electric Vehicle Li-Ion Battery: A Comparative Analysis. Environ. Sci. Technol. 2016, 50, 7715–7722. [Google Scholar] [CrossRef]
  15. Martins, L.S.; Guimarães, L.F.; Junior, A.B.B.; Tenório, J.A.S.; Espinosa, D.C.R. Electric car battery: An overview on global demand, recycling and future approaches towards sustainability. J. Environ. Manag. 2021, 295, 113091. [Google Scholar] [CrossRef]
  16. Harper, G.; Sommerville, R.; Kendrick, E.; Driscoll, L.; Slater, P.; Stolkin, R.; Walton, A.; Christensen, P.; Heidrich, O.; Lambert, S.; et al. Recycling lithium-ion batteries from electric vehicles. Nature 2019, 575, 75–86. [Google Scholar] [CrossRef] [PubMed] [Green Version]
  17. Fan, E.; Li, L.; Wang, Z.; Lin, J.; Huang, Y.; Yao, Y.; Chen, R.; Wu, F. Sustainable recycling technology for Li-ion batteries and beyond: Challenges and future prospects. Chem. Rev. 2020, 120, 7020–7063. [Google Scholar] [CrossRef] [PubMed]
  18. Bednarz, P. Nissan Oświetli Akumulatorami Miasto Duchów. Available online: https://businessinsider.com.pl/firmy/nissan-akumulatorami-chce-oswietlac-ulice-recykling-baterii/ww8mmp2 (accessed on 18 October 2021).
  19. Hausfather, Z. Factcheck: How electric vehicles help to tackle climate change. Carbon Brief. 2019. Available online: https://www.carbonbrief.org/factcheck-how-electric-vehicles-help-to-tackle-climate-change (accessed on 1 February 2022).
  20. Athanasopoulou, L.; Bikas, H.; Stavropoulos, P. Comparative Well-to-Wheel emissions assessment of internal combustion engine and battery electric vehicles. Procedia CIRP 2018, 78, 25–30. [Google Scholar] [CrossRef]
  21. Bieker, G. A global comparison of the life-cycle greenhouse gas emissions of combustion engine and electric passenger cars. Communications 2021, 49, 1–81. [Google Scholar]
  22. Ehrenberger, S.I.; Konrad, M.; Philipps, F. Pollutant emissions analysis of three plug-in hybrid electric vehicles using different modes of operation and driving conditions. Atmos. Environ. 2020, 234, 117612. [Google Scholar] [CrossRef]
  23. Franckx, L. Total Cost of Ownership of Electric Cars Compared to Diesel and Gasoline Cars in Belgium; Report FPB; Federal Planning Bureau: Brussels, Belgium, 2019. [Google Scholar]
  24. Danielis, R.; Giansoldati, M.; Rotaris, L. A probabilistic total cost of ownership model to evaluate the current and future prospects of electric cars uptake in Italy. Energy Policy 2018, 119, 268–281. [Google Scholar] [CrossRef]
  25. Plewa, F.; Strozik, G. Energy and environmental implications of electromobility implementation in Poland. In IOP Conference Series: Earth and Environmental Science; IOP Publishing: Bristol, UK, 2019; Volume 261, p. 012042. [Google Scholar]
  26. Tucki, K.; Orynycz, O.; Świć, A.; Mitoraj-Wojtanek, M. The Development of Electromobility in Poland and EU States as a Tool for Management of CO2 Emissions. Energies 2019, 12, 2942. [Google Scholar] [CrossRef] [Green Version]
  27. Wappelhorst, S.; Pniewska, I. Emerging Electric Passenger Car Markets in Europe: Can Poland Lead the Way? Working Paper (2020-19); International Council on Clean Transportation (ICCT): San Francisco, CA, USA, 2020. [Google Scholar]
  28. Sendek-Matysiak, E.; Rzędowski, H. The Costs of Charging Electric Vehicles in Poland. Commun.-Sci. Lett. Univ. Zilina 2022, 24, A1–A11. [Google Scholar] [CrossRef]
  29. Kawamoto, R.; Mochizuki, H.; Moriguchi, Y.; Nakano, T.; Motohashi, M.; Sakai, Y.; Inaba, A. Estimation of CO2 emissions of internal combustion engine vehicle and battery electric vehicle using LCA. Sustainability 2019, 11, 2690. [Google Scholar] [CrossRef] [Green Version]
  30. Helmers, E.; Dietz, J.; Weiss, M. Sensitivity analysis in the life-cycle assessment of electric vs. combustion engine cars under approximate real-world conditions. Sustainability 2020, 12, 1241. [Google Scholar] [CrossRef] [Green Version]
  31. Del Pero, F.; Delogu, M.; Pierini, M. Life Cycle Assessment in the automotive sector: A comparative case study of Internal Combustion Engine (ICE) and electric car. Procedia Struct. Integr. 2018, 12, 521–537. [Google Scholar] [CrossRef]
  32. Technical Data Volkswagen VII 1.4 Tsi, 140 KM. Available online: https://www.volkswagen.pl/idhub/content/dam/onehub_pkw/importers/pl/swiat-volkswagena/ochrona-srodwiska/dane-o-emisji-co2/emisja_co2_10-2016.pdf (accessed on 18 October 2021).
  33. ILCAJ (The Institute of Life-Cycle Assessment Japan). LCA Database2015fy, 4th ed.; ILCAJ: Tokyo, Japan, 2015; Available online: http://ilcaj.org/en/database.php (accessed on 18 October 2021).
  34. Hawkins, T.R.; Singh, B.; Majeau-Bettez, G.; Strømman, A.H. Comparative environmental life cycle assessment of conventional and electric vehicles. J. Ind. Ecol. 2013, 17, 53–64. [Google Scholar] [CrossRef]
  35. De Souza, L.L.P.; Lora, E.E.S.; Palacio, J.C.E.; Rocha, M.H.; Renó, M.L.G.; Venturini, O.J. Comparative environmental life cycle assessment of conventional vehicles with different fuel options, plug-in hybrid and electric vehicles for a sustainable transportation system in Brazil. J. Clean. Prod. 2018, 203, 444–468. [Google Scholar] [CrossRef]
  36. Amarakoon, S.; Smith, J.; Segal, B. Application of Life-Cycle Assessment to Nanoscale Technology: Lithium-Ion Batteries for Electric Vehicles; EPA: Washington, DC, USA, 2013. [Google Scholar]
  37. Majeau-Bettez, G.; Hawkins, T.R.; Strømman, A.H. Life cycle environmental assessment of lithium-ion and nickel metal hydride batteries for plug-in hybrid and battery electric vehicles. Environ. Sci. Technol. 2011, 45, 4548–4554. [Google Scholar] [CrossRef]
  38. Zackrisson, M.; Avellán, L.; Orlenius, J. Life cycle assessment of lithium-ion batteries for plug-in hybrid electric vehicles–Critical issues. J. Clean. Prod. 2010, 18, 1519–1529. [Google Scholar] [CrossRef]
  39. Ellingsen, L.A.W.; Hung, C.R.; Strømman, A.H. Identifying key assumptions and differences in life cycle assessment studies of lithium-ion traction batteries with focus on greenhouse gas emissions. Transp. Res. Part D Transp. Environ. 2017, 55, 82–90. [Google Scholar] [CrossRef]
  40. Ellingsen, L.A.W.; Hung, C.R.; Majeau-Bettez, G.; Singh, B.; Chen, Z.; Whittingham, M.S.; Strømman, A.H. Nanotechnology for environmentally sustainable electromobility. Nat. Nanotechnol. 2016, 11, 1039–1051. [Google Scholar] [CrossRef]
  41. Olofsson, Y.; Romare, M. Life Cycle Assessment of Lithium-ION batteries for Plug-In Hybrid Buses. Master’s Thesis, Chalmers University of Technology, Gothenburg, Sweden, 2013. [Google Scholar]
  42. Maas, H.; Reid, A.; Nelson AGodwin, S.; Rose, K.D.; Lonza, L.; Edwards, R.; Hass, H.; Huss, A.; Krasenbrink, A.l. Well-to-Wheels Analysis of Future Automotive Fuels and Powertrains in the European Context: Well-to-Tank Appendix 4; Institute for Environment and Sustainability (Joint Research Centre): Ispra, Italy, 2013. [Google Scholar] [CrossRef]
  43. Prussi, M.; Yugo, M.; De Prada, L.; Padella, M.; Edwards, R.; Lonza, L. JEC Well-to-Wheels Report Version 4.a: JEC Well-to-Tank. In Report V5: Jec Well-to-Wheels Analysis: Well-to-Wheels Analysis of Future Automotive Fuels and Powertrains in the European Context; Joint Research Centre of the European Commission: Ispra, Italy, 2020. [Google Scholar] [CrossRef]
  44. Informacje o Zużyciu Paliwa i Emisji Co2 W Samochodach Osobowych (Rozporządzenie Prezesa Rady Ministrów z Dnia 29 Kwietnia 2004 Roku w Sprawie Zestawień Istotnych Z punktu Widzenia Ochrony Środowiska Informacji o Produktach-Dz. U. z 2004 r., Nr 98, poz. 1512–1629). Available online: https://www.volkswagen.pl/idhub/content/dam/onehub_pkw/importers/pl/swiat-volkswagena/ochrona-srodwiska/dane-o-emisji-co2/zestawienie_zuzycie_paliwa_co2_VGP-21_02_2018.pdf (accessed on 18 October 2021).
  45. Groupe PSA. Available online: https://www.groupe-psa.com/en/newsroom/automotive-innovation/groupe-psa-fne-te-bureau-veritas-publient-rapport-detaille-mesures-de-consommation-usage-reel/ (accessed on 18 October 2021).
  46. Edenhofer, O. (Ed.) Climate Change 2014: Mitigation of Climate Change; Cambridge University Press: Cambridge, UK, 2015; Volume 3. [Google Scholar]
  47. Dołęga, W. Ekologia w wytwarzaniu. Energ. Gigawat 2016. Available online: https://www.cire.pl/pliki/2/wytwarzanieenergiiaakologia.pdf (accessed on 1 February 2022).
  48. KOBiZE. Krajowy Ośrodek Bilansowania i Zarządzania Emisjami, Wskaźniki Emisyjności CO2, SO2, NOx, CO i Pyłu Całkowitego dla Energii Elektrycznej 2020. (In English: National Center for Balancing and Management of Emissions, CO2, SO2, NOx, CO and Total Dust Emission Factors for Electricity 2020). Available online: https://www.kobize.pl/pl/file/wskazniki-emisyjnosci/id/156/wskazniki-emisyjnosci-dla-energii-elektrycznej-za-rok-2019-opublikowane-w-grudniu-2020-r (accessed on 18 October 2021).
  49. Environmental Protection Agency (EPA). Available online: www.fueleconomy.gov (accessed on 18 October 2021).
  50. Manel, B.M.; Abdelmadjid, T. The Ecological Efficiency of Green Fuel’s Distribution in NAFTAL Laghouat Using Data Envelopment Analysis (DEA). Financ. Bus. Econ. Rev. 2021, 5, 320–330. [Google Scholar]
  51. Volkswagen. 2021. Available online: https://volkswagentarnow.pl/serwis-i-akcesoria/czesci/akumulatory/ (accessed on 18 October 2021).
  52. MotoIntegrator.com. Volkswagen—Service plan, oils and operating fluids. Available online: https://motointegrator.com/pl/pl/poradniki/porady-eksploatacyjne/volkswagen-plan-serwisowy-oleje-i-plyny-eksploatacyjne (accessed on 5 February 2021).
  53. Wang, L.; Wang, X.; Yang, W. Optimal design of electric vehicle battery recycling network–From the perspective of electric vehicle manufacturers. Appl. Energy 2020, 275, 115328. [Google Scholar] [CrossRef]
  54. Daimler, A.G. Environmental Certificate Mercedes-Benz B-Class Electric Drive; Daimler AG: Stuttgart, Germany, 2014. [Google Scholar]
  55. Mubi. Akumulator w Samochodzie Elektrycznym, Kupno, Wynajem Lub Wymiana Akumulatora do Samochodu Elektrycznego—Co Się Najbardziej Opłaca? Available online: https://mubi.pl/poradniki/akumulator-do-samochodu-elektrycznego/?__cf_chl_jschl_tk__=pmd_HReS5A7GY31atCdRjcgxu91Dgry86MWHEJMCdDwdZ5k-1634564197-0-gqNtZGzNAnujcnBszRWR#na-ile-wystarczy-akumulator (accessed on 18 October 2021).
  56. Wasilewski, J. Żywotność Akumulatorów: Auta Elektryczne i Hybrydowe. (In English: Battery Life: Electric and Hybrid Cars). Motofakty.pl. Available online: https://www.motofakty.pl/artykul/zywotnosc-akumulatorow-auta-elektryczne-i-hybrydowe.html (accessed on 18 October 2021).
  57. Aguirre, K.; Eisenhardt, L.; Lim, C.; Nelson, B.; Norring, A.; Slowik, P.; Tu, N. Lifecycle Analysis Comparison of a Battery Electric Vehicle and a Conventional Gasoline Vehicle; California Air Resource Board: Sacramento, CA, USA, 2012. [Google Scholar]
  58. Kebede, F.S.; Bouyguet, S.; Olivier, J.C. Photovoltaic System Sizing for Reliability Improvement in an unreliable Power Distribution System. 2020 Fifteenth International Conference on Ecological Vehicles and Renewable Energies (EVER), Monte-Carlo, Monaco, 10–12 September 2020; IEEE: Piscataway, NJ, USA; pp. 1–8. [Google Scholar]
  59. Sanni, S.O.; Oricha, J.Y.; Oyewole, T.O.; Bawonda, F.I. Analysis of backup power supply for unreliable grid using hybrid solar PV/diesel/biogas system. Energy 2021, 227, 120506. [Google Scholar] [CrossRef]
  60. Zeb, K.; Islam, S.U.; Khan, I.; Uddin, W.; Ishfaq, M.; Busarello, T.D.C.; Muyeen, S.; Ahmad, I.; Kim, H. Faults and Fault Ride Through strategies for grid-connected photovoltaic system: A comprehensive review. Renew. Sustain. Energy Rev. 2022, 158, 112125. [Google Scholar] [CrossRef]
  61. Warner, A. Polacy Jeżdżą o Połowę Mniej niż Duńczycy Czy Austriacy. (In English: Poles Drive Half as Much as Danes or Austrians). Motoryzacja. 020. Available online: https://moto.rp.pl/tu-i-teraz/art17360571-polacy-jezdza-o-polowe-mniej-niz-dunczycy-czy-austriacy (accessed on 18 October 2021).
  62. Trela, M. Comparison of financial and external costs related to the use of selected electric and conventional passenger cars–the example of Poland. Environ. Prot. Nat. Resour. 2019, 30, 18–24. [Google Scholar] [CrossRef]
  63. Plötz, P.; Funke, S.Á.; Jochem, P. The impact of daily and annual driving on fuel economy and CO2 emissions of plug-in hybrid electric vehicles. Transp. Res. Part A Policy Pract. 2018, 118, 331–340. [Google Scholar] [CrossRef]
  64. Müller, M.; Biedenbach, F.; Reinhard, J. Development of an integrated simulation model for load and mobility profiles of private households. Energies 2020, 13, 3843. [Google Scholar] [CrossRef]
  65. Haustein, S.; Jensen, A.F. Factors of electric vehicle adoption: A comparison of conventional and electric car users based on an extended theory of planned behavior. Int. J. Sustain. Transp. 2018, 12, 484–496. [Google Scholar] [CrossRef] [Green Version]
  66. Teixeira, A.C.R.; Sodré, J.R. Impacts of replacement of engine powered vehicles by electric vehicles on energy consumption and CO2 emissions. Transp. Res. Part D: Transp. Environ. 2018, 59, 375–384. [Google Scholar] [CrossRef]
  67. Airly. Available online: https://airly.org/map/pl/ (accessed on 18 October 2021).
Figure 1. Distribution of CO2 emissions in the transport sector and distribution of emissions in road transport (own drawings based on [9,10]).
Energies 15 02703 g001
Figure 2. Classification of passenger cars by fuel type (own drawings based on [11]).
Energies 15 02703 g002
Figure 3. Emissions in kg-CO2 for the entire life cycle of the cars (150,000 km, 10 years).
Energies 15 02703 g003
Figure 4. Comparing the cumulative CO2 emissions for a gasoline car and an electric car in each year of operation (15,000 km/year scenario).
Energies 15 02703 g004
Figure 5. Comparing the cumulative CO2 emissions for a gasoline car and an electric car in each year of operation (7500 km/year scenario).
Energies 15 02703 g005
Figure 6. Comparing the cumulative CO2 emissions for a gasoline car and an electric car in each year of operation (3000 km/year scenario).
Energies 15 02703 g006
Table 1. Comparative analysis of existing papers.
Lp.Main Topic Discussed in the PublicationRef. No.
a.The impact of electric and internal combustion cars on the environment.[12,13]
b.CO2 emissions from the production of batteries for electric cars.[14,18,19]
c.Comparison of CO2 emissions after driving 1 km for electric and combustion cars (without taking into account CO2 emissions at the stage of production, inspection and disposal), among others, using the LCA method.[20,21,22]
d.Assessment of costs (in line with the costs resulting from ecological policy, e.g., related to fees for entering city centers) of using electric and combustion cars.[23,24,25]
e.Use of the LCA method to assess the impact of electric vehicles on the environment.[15,16,17]
f.Barriers affecting the development of electromobility (e.g., problems with the efficiency of electric car batteries and the availability of materials for the production of batteries).[27,28]
g.LCA calculations for the life cycle of cars.[29,30,31]
Table 2. Cumulative carbon dioxide emissions in the production phase of both vehicles. Based on, among others, [30].
Vehicle TypePart of the VehicleEmission [kg-CO2]
GasolineCombustion engine980
Drive system294
Car frame with all elements except the above-mentioned
4219
ElectricElectric motor1070
Drive system641
Battery6337
Car frame with all elements except the above-mentioned
4219
Table 3. Frequency of replacement of materials and consumable items during vehicle maintenance and their cumulative emissions based on Volkswagen data [52].
Vehicle TypePartReplacement FrequencyEmission
[kg-CO2/Element]
Quantity
[pcs or l]
GasolineMotor oil15,000 km (or 1 year)3.224
Battery5 years19.51
Electric/
gasoline
Tire45,000 km1084
Coolant5/2 years7.037
Table 4. CO2 emissions for the utilization processes of vehicles.
ProcessEmission [kg-CO2]
Parts transportation4
Shredding and sorting24
Storage38
Battery (electric car only)1901
Table 5. List of emissions in kg-CO2 for the entire life cycle of the vehicle (150,000 km, 10 years).
ProductionFuel/Energy ProductionDrivingMaintenanceUtilizationTotal
Car BodyEngineDriveBattery
Gasoline car 421998029419.52597.227,63015186437,322
Electric
car
W142191070641633727,630-1324196543,186
W242191070641633715,980-1324196531,536
W3421910706416337550-1324196516,106
W44219107064163378400-1324196523,956
W542191070641633718,817-1324196534,373
Table 6. Simulation results: after what time a gasoline car will produce higher kg-CO2 emissions than an electric car, depending on the average annual mileage and electricity sources.
Scenario15,000 km7500 km3000 km
Variant
W115>15>15>
W2915>15>
W348.515>
W45.51215>
W5915>15>
Publisher’s Note: MDPI stays neutral with regard to jurisdictional claims in published maps and institutional affiliations.

