Article

Numerical Investigation and Optimization of Cooling Flow Field Design for Proton Exchange Membrane Fuel Cell

1
School of Mechanical Engineering, Guizhou University, Guiyang 550025, China
2
School of Data Science, Guizhou Institute of Technology, Guiyang 550003, China
*
Author to whom correspondence should be addressed.
Energies 2022, 15(7), 2609; https://doi.org/10.3390/en15072609
Submission received: 3 March 2022 / Revised: 25 March 2022 / Accepted: 30 March 2022 / Published: 2 April 2022

Abstract

:
High temperatures and non-uniform temperatures both have a negative bearing on the performance of proton exchange membrane fuel cells. The temperature of proton exchange membrane fuel cells can be lowered by reasonably distributed cooling channels. The flow field distribution of five different cooling plates is designed, and the temperature uniformity, pressure drop and velocity of each cooling flow field are analyzed by computational fluid dynamics technology. The results show that while the pressure drop is high, the flow channel distribution of a multi-spiral flow field and honeycomb structure flow field contribute more to improving the temperature uniformity. As the coolant is blocked by the uniform plate, it is found that although the flow field channel with a uniform plate has poor performance in terms of temperature uniformity, its heat dissipation capacity is still better than that of the traditional serpentine flow field. The multi-spiral flow field has the strongest ability to maintain the temperature stability in the cooling plate when the heat flux increases. The increase in Reynolds number, although increasing the pressure drop, can reduce the maximum temperature and temperature difference of the flow field, ameliorate the temperature uniformity and improve the heat transfer capacity of the cooling plate.

1. Introduction

As one of the solutions to the global energy crisis and environmental problems, the proton exchange membrane fuel cell (PEMFC) has the advantages of near-zero emissions and high conversion efficiency [1,2,3,4,5]. However, the commercialization process of PEMFC still faces many challenges. Among them, the hydrothermal management of PEMFC also needs effective technical breakthroughs, which is the research focus of scholars today [6,7]. During the operation of a PEMFC, heat will be generated with the generation of electric energy. Fuel cells primarily generate heat from the entropic heat of reactions, the irreversibility of the electrochemical reactions, ohmic resistances and heat from the condensation of water vapors [8]. The increase in temperature in a certain range is conducive to improving the activity of the catalytic layer and accelerating the rate of the electrochemical reaction, but if the heat energy is not discharged in time, the overall temperature of the PEMFC will be too high and the local temperature distribution will be uneven, which will seriously degrade its performance [9,10,11].
A cooling plate is an indispensable structure of a fuel cell stack. It can reduce the temperature of the PEMFC and improve the temperature distribution in terms of non-uniformity [12,13]. Many studies have proven that a reasonably distributed flow channel can effectively improve the uniformity of temperature distribution during fuel cell operation, reduce the pressure drop of the cooling flow channel, avoid the occurrence of fluid blockage and cause the cooling liquid to circulate quickly.
Kurnia et al. [14] studied the heat transfer performance of parallel, serpentine, wavy, coiled and novel hybrid channels, and the coiled-base channel was discovered to be a desirable option, particularly in sensitive applications where cooling performance is crucial. Jeon [15] examined the cyclic and single cells and discovered that at high current densities, the cyclic cell’s voltage was lowered due to increasing ohmic losses. The innovative serpentine channel exhibits the highest uniformity index of temperature distribution, power density and pressure drop, according to Atyabi et al. [16]. In comparison to other types, the design obtained the lowest temperature observed at the catalyst layer. The cooling field in serpentine channels had several passes and a high channel length, which allowed heat to be removed from the system but resulted in a substantial pressure drop across the system. Matian et al. [17] reported that increasing the size of the cooling channels resulted in a more uniform temperature distribution because more air could pass through the channels for a given pressure drop, allowing more thermal energy to be exchanged between the plate and cooling air. According to the research of Wilberforce et al. [18], a mixture of serpentine and parallel flow channels was intended to deliver better performance, owing to the prevalence of the serpentine channel portion, while still ensuring an overall lower pressure drop given the presence of parallel bypass channels, and the adapted serpentine designs with bypass channels presented a pressure drop 50 times lower than the classical serpentine design. Rahgoshay et al. [19] performed numerical analysis on two conventional cooling plates with serpentine and parallel flow fields, and found that modifying the rate of heat transfer has an effect on the performance of PEMFC and PEMFC with serpentine cooling flow fields compared to parallel cooling flow fields. In terms of effective physical parameters, the serpentine flow field offers greater cooling performance. According to the research of Yang et al. [20], operating temperatures have been shown to have significant effects on water distribution, and cells running at low temperatures have been shown to be more prone to severe water flooding, particularly downstream. Shian et al. [21] also discovered the essentiality of downstream water management; they investigated traditional straight channel cooling plates and innovative non-uniform flow channel designs, and the results showed that the downstream flow area improves the heat dissipation performance of the cooling plate. The results show that the optimum thermal, water, and gas management may be found in serpentine-based channel designs, and because of the substantially smaller pressure drop, the innovative hybrid parallel-serpentine-oblique-fin channel design generates the most net power. Sasmito et al. [22] evaluated numerically the performance of various gas and coolant channel designs simultaneously. Due to the existence of complex turns, Ravishankar et al. [23] presented four new designs and discovered that in comparison to serpentine, the pressure drop needed to accelerate the flow is higher in spiral and innovative designs. Castelain et al. [24] created an experimental device in order to characterize the chaotic geometries’ thermal properties under consideration, and the measurements corroborated the simulated values, which indicate that for chaotic geometries, the interior convective heat transfer coefficient significantly increases when compared to the tube with no bends. Liu et al. [25] used the genetic algorithm with several objectives to optimize the operating condition, and then used the multi-objective genetic algorithm to optimize the PEMFC’s channel design based on the ideal operating condition. The best channel produced through optimization was a tapered channel with heights of 0.3909 mm and 0.2042 mm at the inlet and outflow, respectively.
Innovative heat dissipation methods combined with a traditional cooling flow field are also being studied. Wen et al. [26] cut six pieces of heat conducting pyrolytic graphite into a channel shape, bound them to six central cathode airway plates and added forced convection; the results showed that this significantly reduced the volume, the temperature control system’s weight and cooling capacity. Lin et al. [27] carried out a numerical analysis of a PEMFC stack with water cooling to determine the impact of configurations and cathode operating parameters on stack power density and efficiency of the system. The orthogonal analysis method has been shown to be reliable in obtaining the best with a confidence level nearing 95%, a mixture of setups and cathode operating conditions was discovered. Using graphite plates, Yin et al. [28] developed a new kW-scale air-cooled PEMFC stack. The experimental results confirmed that the stack with a channel on the edge performs better than the standard stack without edge channels. Because of the improved internal water balance, the counter-cross flow operation is better for stack performance than the co-cross flow operation. To improve the thermal management of a 10-cell air-cooled PEMFC stack. As heat spreaders, Zhao et al. [29] used five vapor chambers. The findings suggest that a high effective thermal conductivity can improve heat transfer and even out the temperature in the stack. Afshari et al. [30] compared the cooling performance of four different design methods, parallel flow field, serpentine flow field and metal foam porous medium flow field, among the models tested, a model with a porous metal foam flow field is the right alternative for decreasing the surface temperature difference, highest surface temperature, and average surface temperature. According to the simulation, Zhang et al. [31] investigated a novel method of cooling for a PEMFC stack; low membrane hydration is also caused by a higher temperature in the stack and, as a result, cell performance is limited, and the current density distribution is not uniform. The current cooling technique may be improved by boosting the heat transfer co-efficient between the stack and the coolant to minimize local overheating and improve the cell performance, according to the findings. To eliminate the need for a bulky humidifier and to lighten the cooling load of PEMFCs. Hwang et al. [32] used an external-mixing air-assist atomizer to build a cathode humidification and evaporative cooling system, and discovered that the humidification impact increased stack performance while the evaporative cooling effect decreased coolant temperature at the stack output. Saeedan et al. [33] proposed using water-CuO nanofluid as the coolant fluid and filling the flow field in the cooling plates with metal foam. The results showed that at low Reynolds numbers, the role of nanoparticles in improving temperature uniformity is more prominent. Furthermore, metal foam can lower the maximum temperature in the cooling channel by approximately 16.5 K and uniformize the temperature distribution, while the pressure drop increases only slightly. Asghari et al. [34] investigated the design of a cooling flow field as well as a thermal management sub-system of a 5 kW PEMFC system. The numerical simulation results show that a higher flow rate of coolant results in a more uniform temperature distribution, whereas a lower flow rate results in less pressure drop and parasitic losses. Ghasemi et al. [35] designed and simulated six cooling flow field designs. The results show that the spiral cooling flow field has the most uniform temperature distribution, but the pressure drop is large.
According to the literature created by predecessors, the design of a PEMFC cooling flow field shows a diversified trend, but there are still few field designs, especially for high-temperature PEMFCs, and most designs are lacking in innovation. This paper presents five innovative PEMFC cooling flow field designs, and analyzes the heat dissipation performance of the cooling plate by comparing the temperature and temperature uniformity, maximum temperature, pressure drop and cooling liquid velocity between the traditional serpentine cooling flow field and each new flow field. In addition, the operating conditions are optimized according to the numerical analysis.

2. Model Description

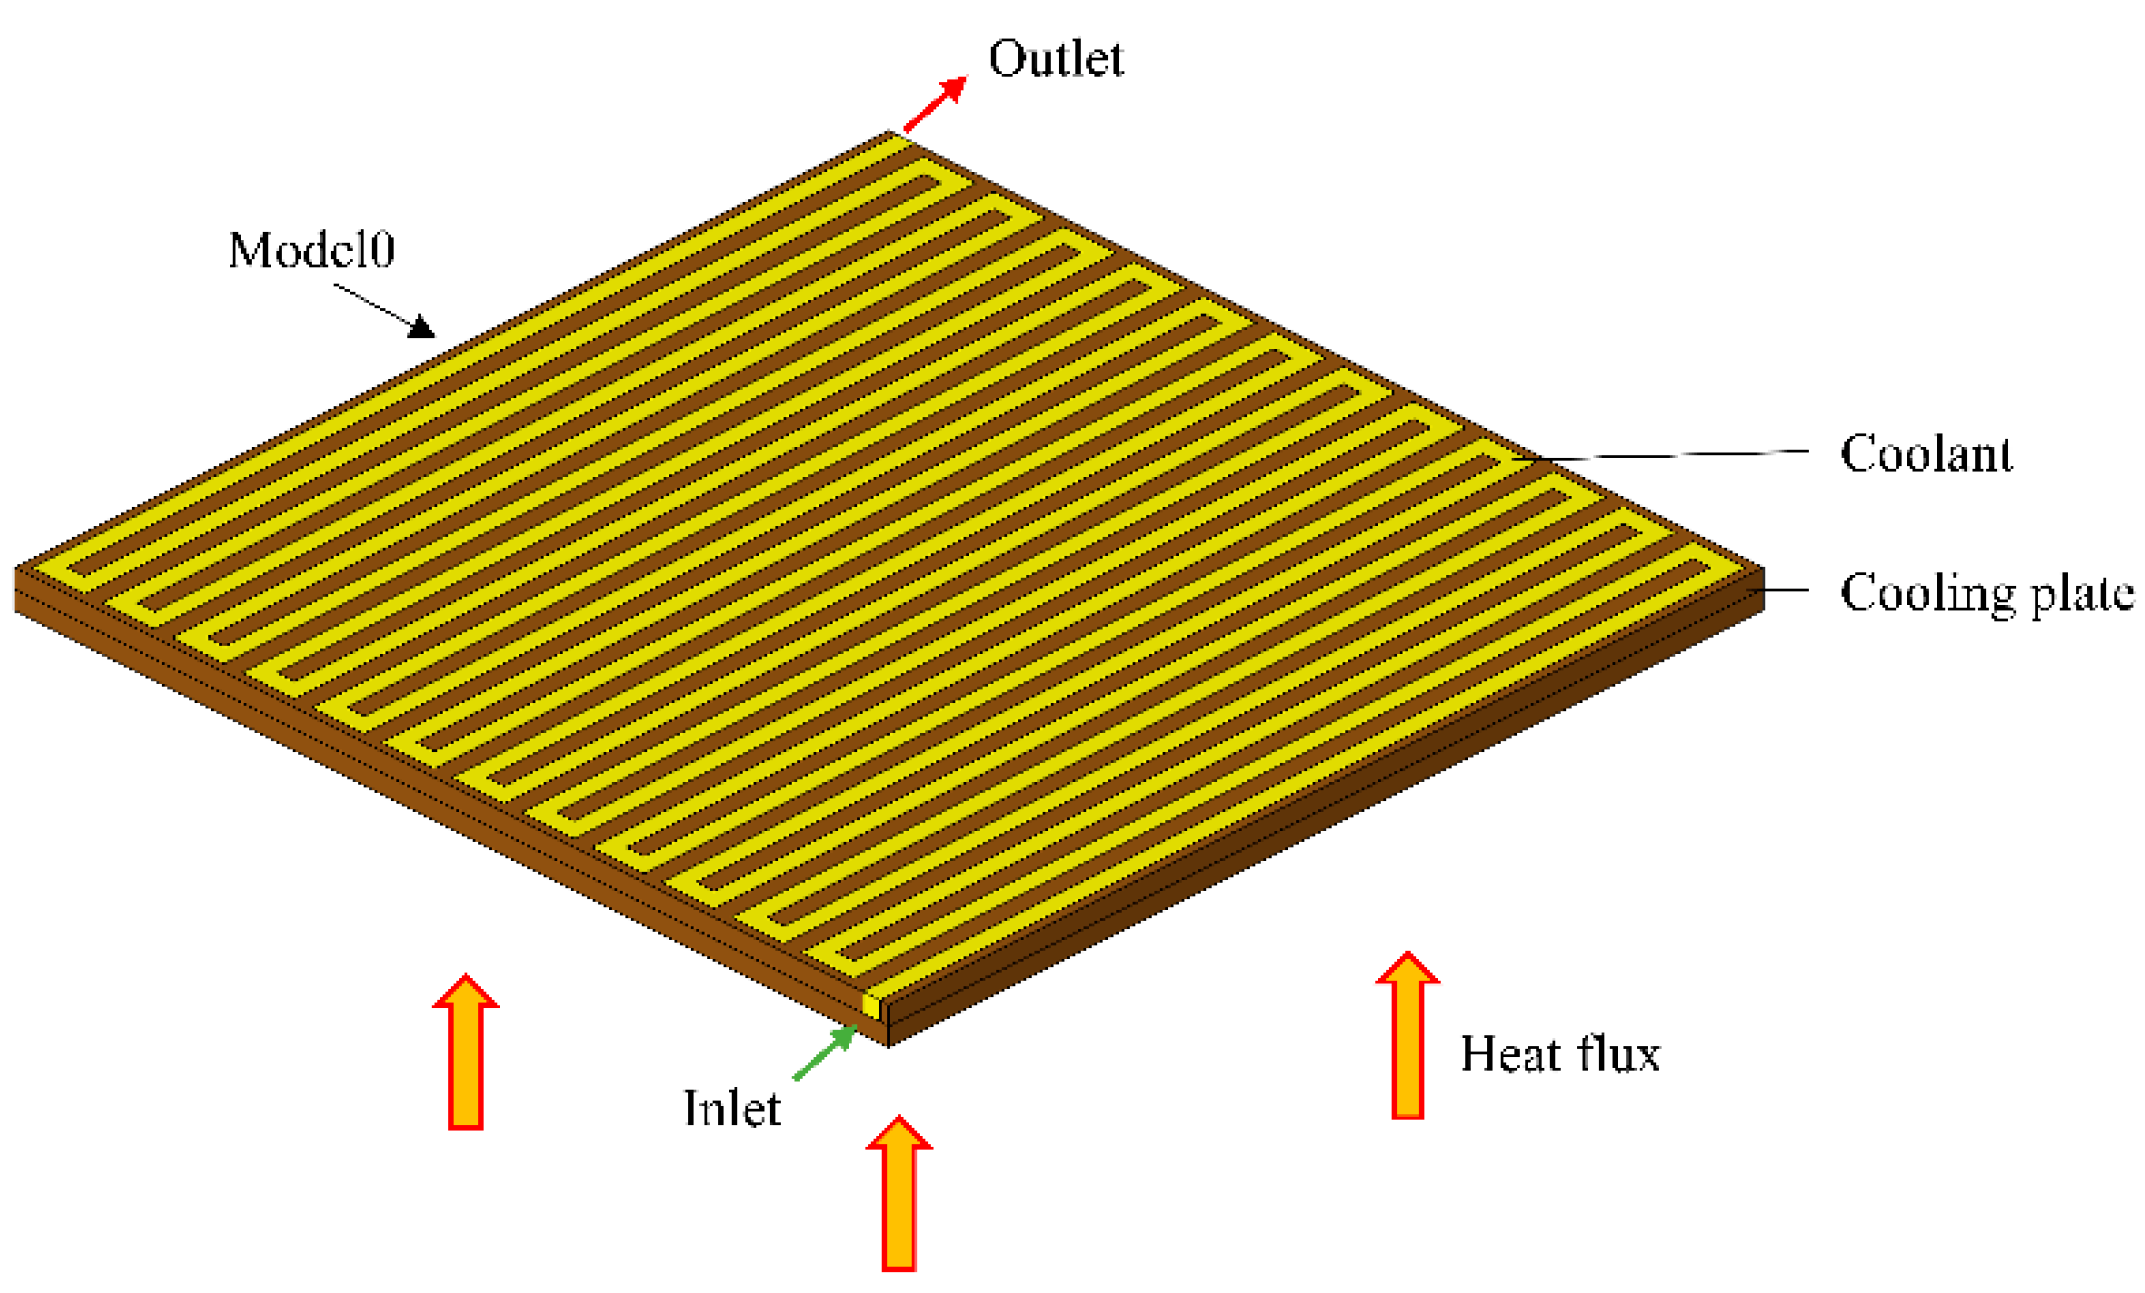
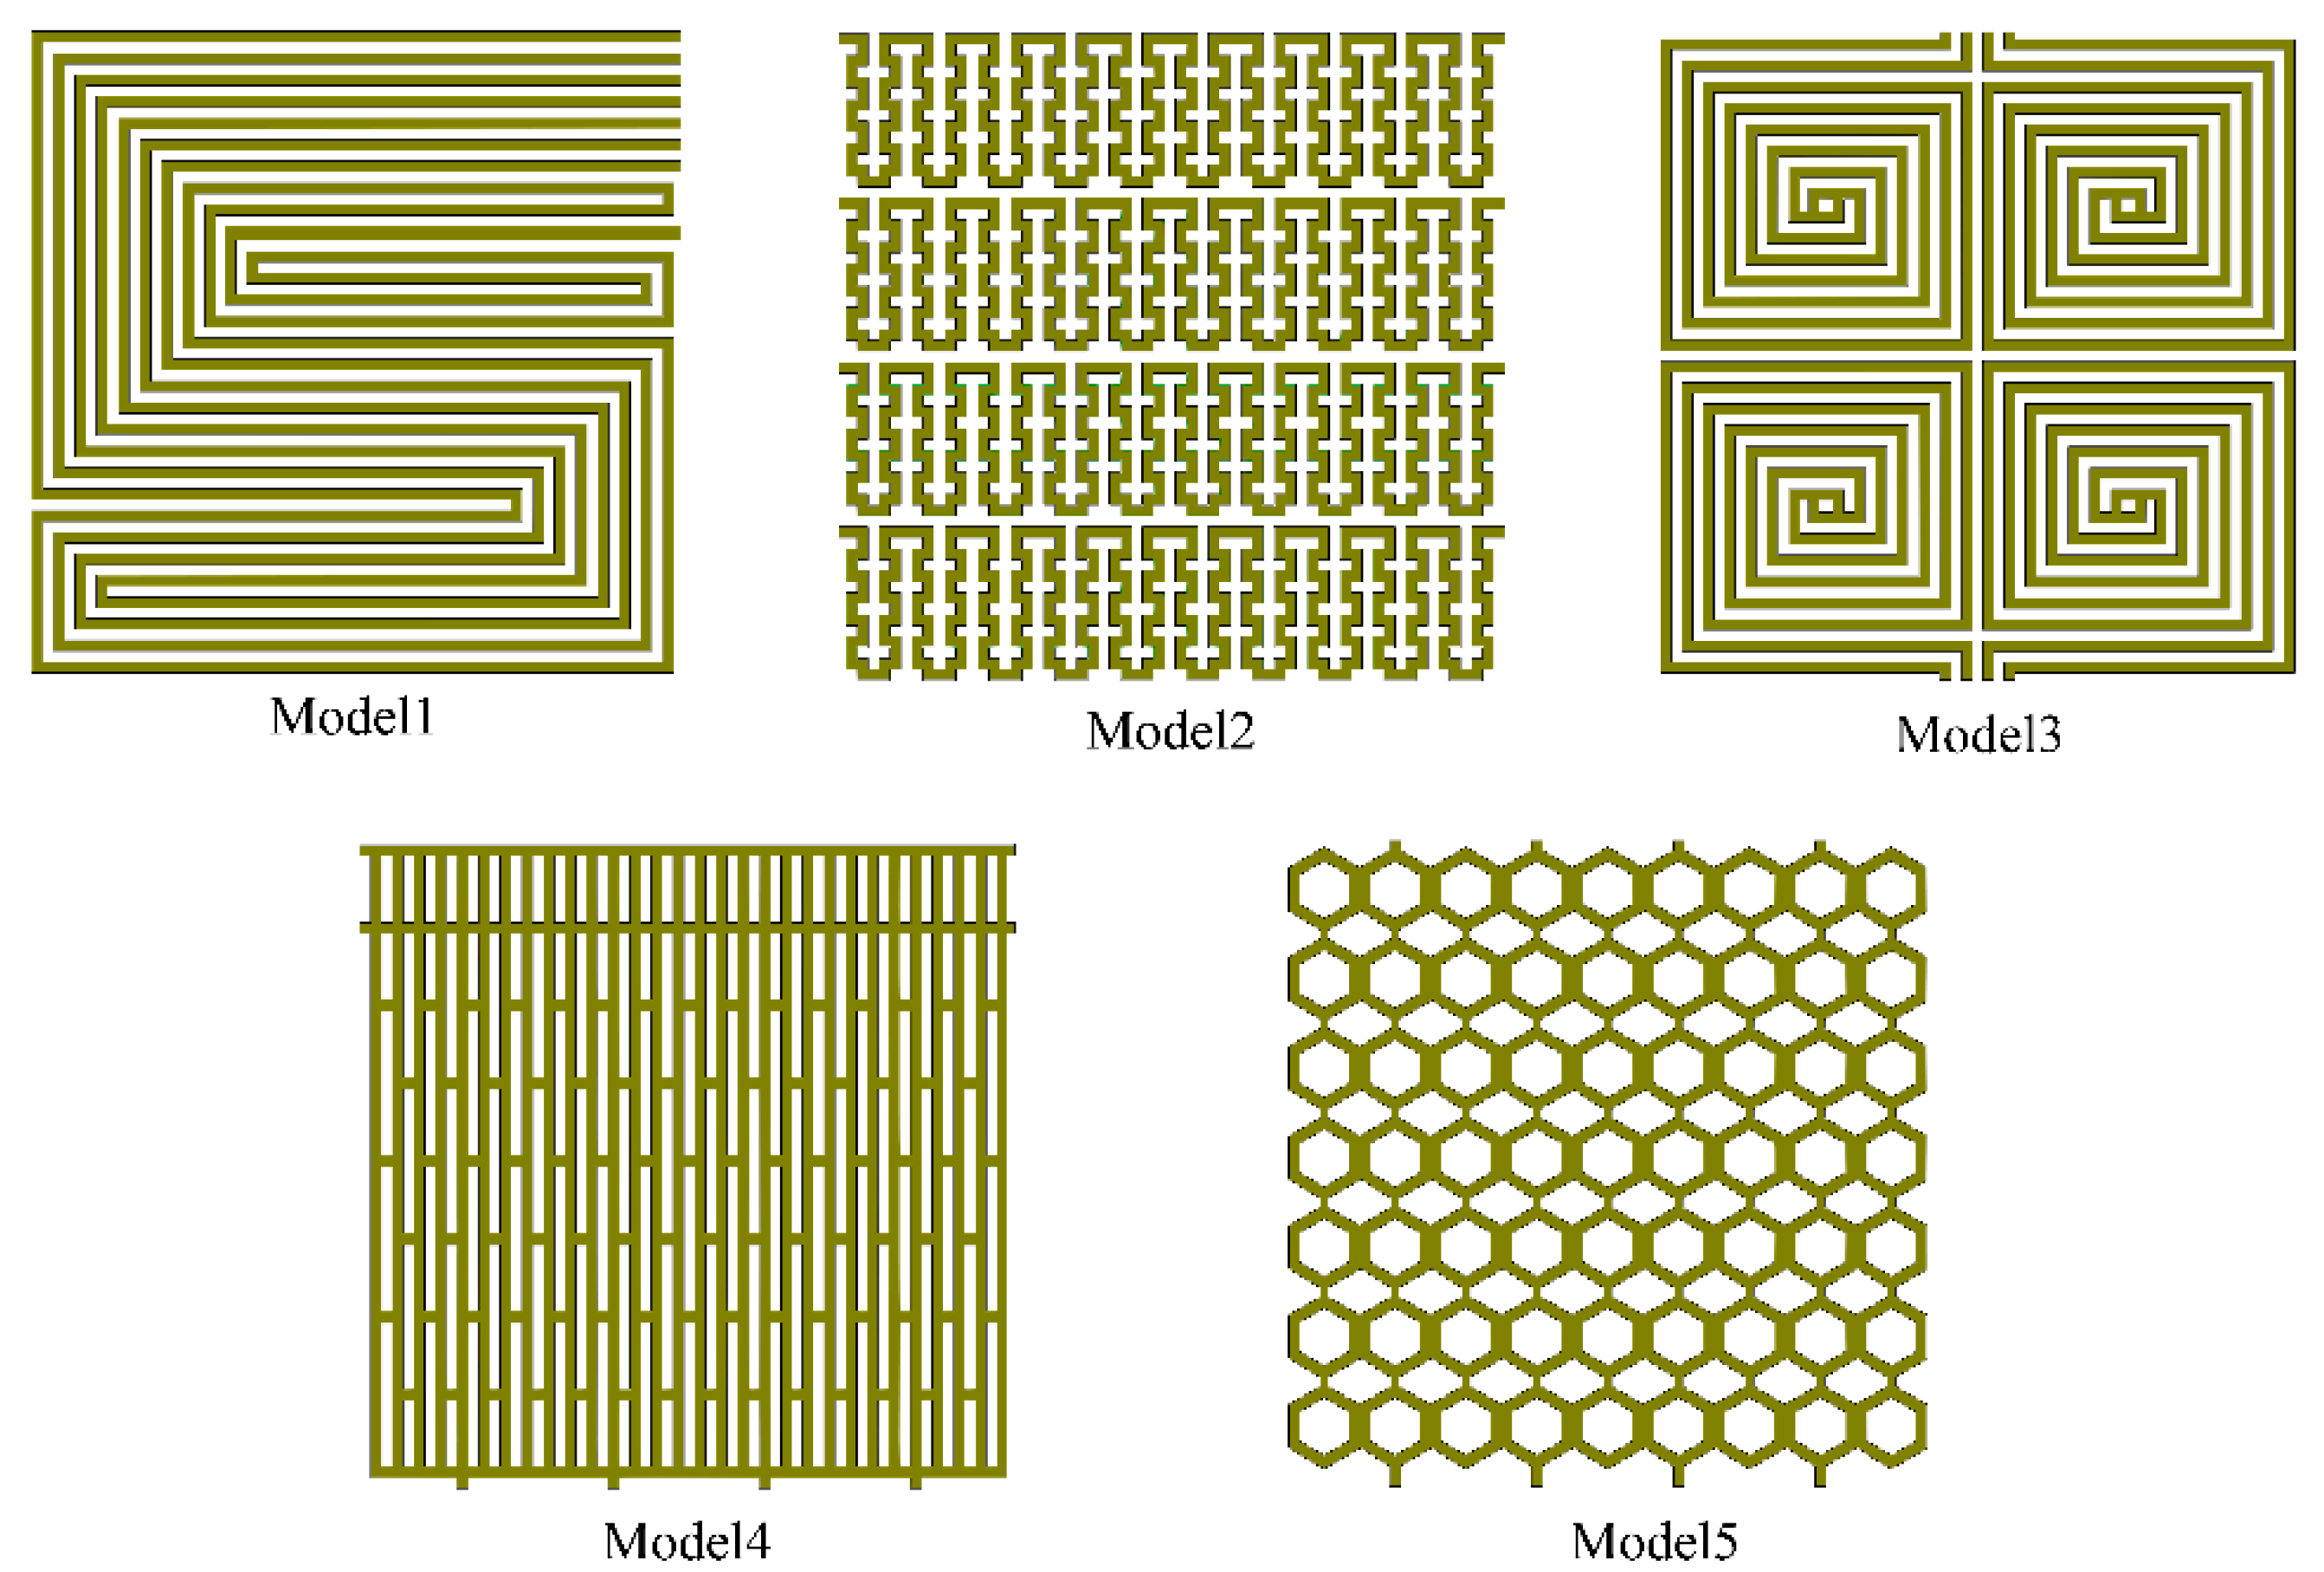
2.1. Computational Model

The fuel cell stack consists of multiple fuel cell units stacked together. The cooling plates are distributed at both ends of a single fuel cell and are in close contact with the bipolar plate. The heat generated during PEMFC operation enters the cooling plate through heat conduction in the bipolar plate, and then the heat is taken away by the coolant circulation in the cooling plate. Figure 1 shows the structure of the fuel cell stack.
Figure 2 shows the cooling plate model to be calculated. Heat is transported from both sides of the cooling plate during its actual working process. The cooling plate is divided from the central plane according to the cooling plate’s symmetry for ease of calculation, and the half model of the overall cooling plate is analyzed to simplify the calculation. The heat flux acts on the bottom, and the value is a fixed value of 5000 W/m2, which is a common value encountered during typical PEMFC operation. The heat produced by PEMFCs is comparable to the output cell power (with PEMFCs with a rated power of 1 kW, around 1–1.5 kW of heat is produced) [36].
Five different cooling channels are designed, as shown in Figure 3. Among them, model 1 is a multi-serpentine flow field, model 2 is a multi-turn flow field, model 3 is a multi-helical flow field, model 4 is a flow field with a uniform plate, and model 5 is a honeycomb structure flow field. The parameters of the geometric structure are shown in Table 1.
The steady-state calculation formula for calculating the heat flow of a double cooling plate is as follows:
q = Q 2 A
The cooling plate has two sides for heat transfer. For the n-cell stack with current I, when all the reaction enthalpies of the fuel cell are converted into electric energy and the aquatic product is water vapor,
Q = n I ( Δ h f 0 / 2 F V )
where n is the number of cells, I is the cell current, V is the output voltage of the cell and A is the total area of the cell, Δ h f 0 is the enthalpy of water formation, and F is the Faraday constant.
The regional uniformity index of the area-weighted variable γ a is calculated using the following formula:
γ a = 1 i = 1 n [ ( | ϕ i ϕ ¯ a | ) A i ] 2 | ϕ ¯ a | i = 1 n A i
ϕ ¯ a is the average of the variables across the surface:
ϕ a ¯ = i = 1 n ϕ i A i i = 1 n A i
where γ a is the uniformity index, ϕ is variable across the surface, A is a superficial area, i is the mesh face index with n mesh faces, and n is the number of grids.

2.2. Model Assumptions

Although there is a temperature difference in the flow process of a cooling medium, it is within the allowable range of error. Therefore, it is considered that the density of the cooling medium is fixed. The simulation is carried out in an ideal situation to some extent. A homogeneous heat distribution over the active area of the cell is assumed. For the convenience of calculation, the following assumptions are made:
(a)
The flow in the cooling channel is incompressible;
(b)
The viscous loss between the fluid and the channel wall is not considered;
(c)
The medium in the channel has the characteristics of a continuous medium;
(d)
The boundary between fluid and solid is a non-slip boundary;
(e)
The heat flux distribution at the bottom is uniform.

2.3. Governing Equations

Assuming that the flow of the cooling liquid in the channel is a three-dimensional steady laminar flow, the continuity equation, momentum equation and energy equation in the reaction process can be expressed as follows:
(a)
continuity equation
u x x + u y y + u z z = 0
(b)
momentum equation
1 ρ p x + v 2 u x = u x u x x + u y u x y + u z u x z
1 ρ p y + v 2 u y = u x u y x + u y u y y + u z u y z
1 ρ p z + v 2 u z = u x u z x + u y u z y + u z u z z
(c)
energy equation
u x t x + v t y + w t z = λ ρ c p 2 t x 2 + 2 t y 2 + 2 t z 2
where u x , u y , u z is the velocity component of fluid along the x, y and z axes; v is the kinematic viscosity; λ ρ c p is the thermal diffusion coefficient.

2.4. Boundary Conditions and Convergence Criteria

Unlike other high-temperature-resistant materials, graphite does not soften as the temperature rises; in fact, its strength increases [37]. At the working temperature of a fuel cell, graphite has great thermal conductivity, allowing waste heat from the bipolar plate to be effectively transferred to the coolant. Because the volume of graphite varies little when the temperature changes quickly, it has good thermal shock resistance [38]. It possesses strong chemical stability and corrosion resistance at the same time [37,39]. Therefore, graphite is used as the material of the coolant and cooling plate. The model uses computational fluid dynamics software Fluent to analyze the heat transfer performance. The material of the cooling plate is graphite. The energy equation has been introduced and the SIMPLE algorithm is used to solve the continuity equation. The pressure term adopts the standard discrete format. The K-epsilon turbulence model is adopted for the flow of the coolant. A first-order slip boundary is used, the Navier-Stokes equations is used to calculate the flow iteratively, and the numerical simulation results are obtained. We set the inlet and outlet pressure, temperature and flow monitors to cooperate with the residual monitoring to determine that the solution is completed, and initialize with standard initialization. The residual errors of all parameters are below 10−4 as the iterative convergence judgment standard, and the calculated boundary conditions are shown in Table 2.

2.5. Grid Independence Verification

In order to verify that the numerical simulation results are not related to the number of grids, five grid numbers (234,149, 1,192,719, 1,457,725, 1,959,970 and 2,481,860) are selected for numerical simulation when the inlet mass flow is 0.002 kg/s. In Figure 4, we present a partial view of the grid of model 3. Hypermesh finite element meshing software and the hexahedral meshing method are used to encrypt the meshes to test the independence of meshes. The numerical simulation results show that when the grid number is 234,149, the numerical simulation results have the maximum deviation. Comparing the numerical simulation results of the models with the grid number of 1,959,970 and 2,481,860, it is found that the deviation between them is relatively small, and the numerical simulation results are very close, indicating that the grid number between 1,959,970 and 2,481,860 can be selected as the grid number of numerical simulation, but the larger the grid number is, the longer the calculation time will be. Considering the calculation accuracy and calculation time comprehensively, we select 1,959,970 here as the number of grids for numerical simulation. Table 3 shows the grid independence verification.

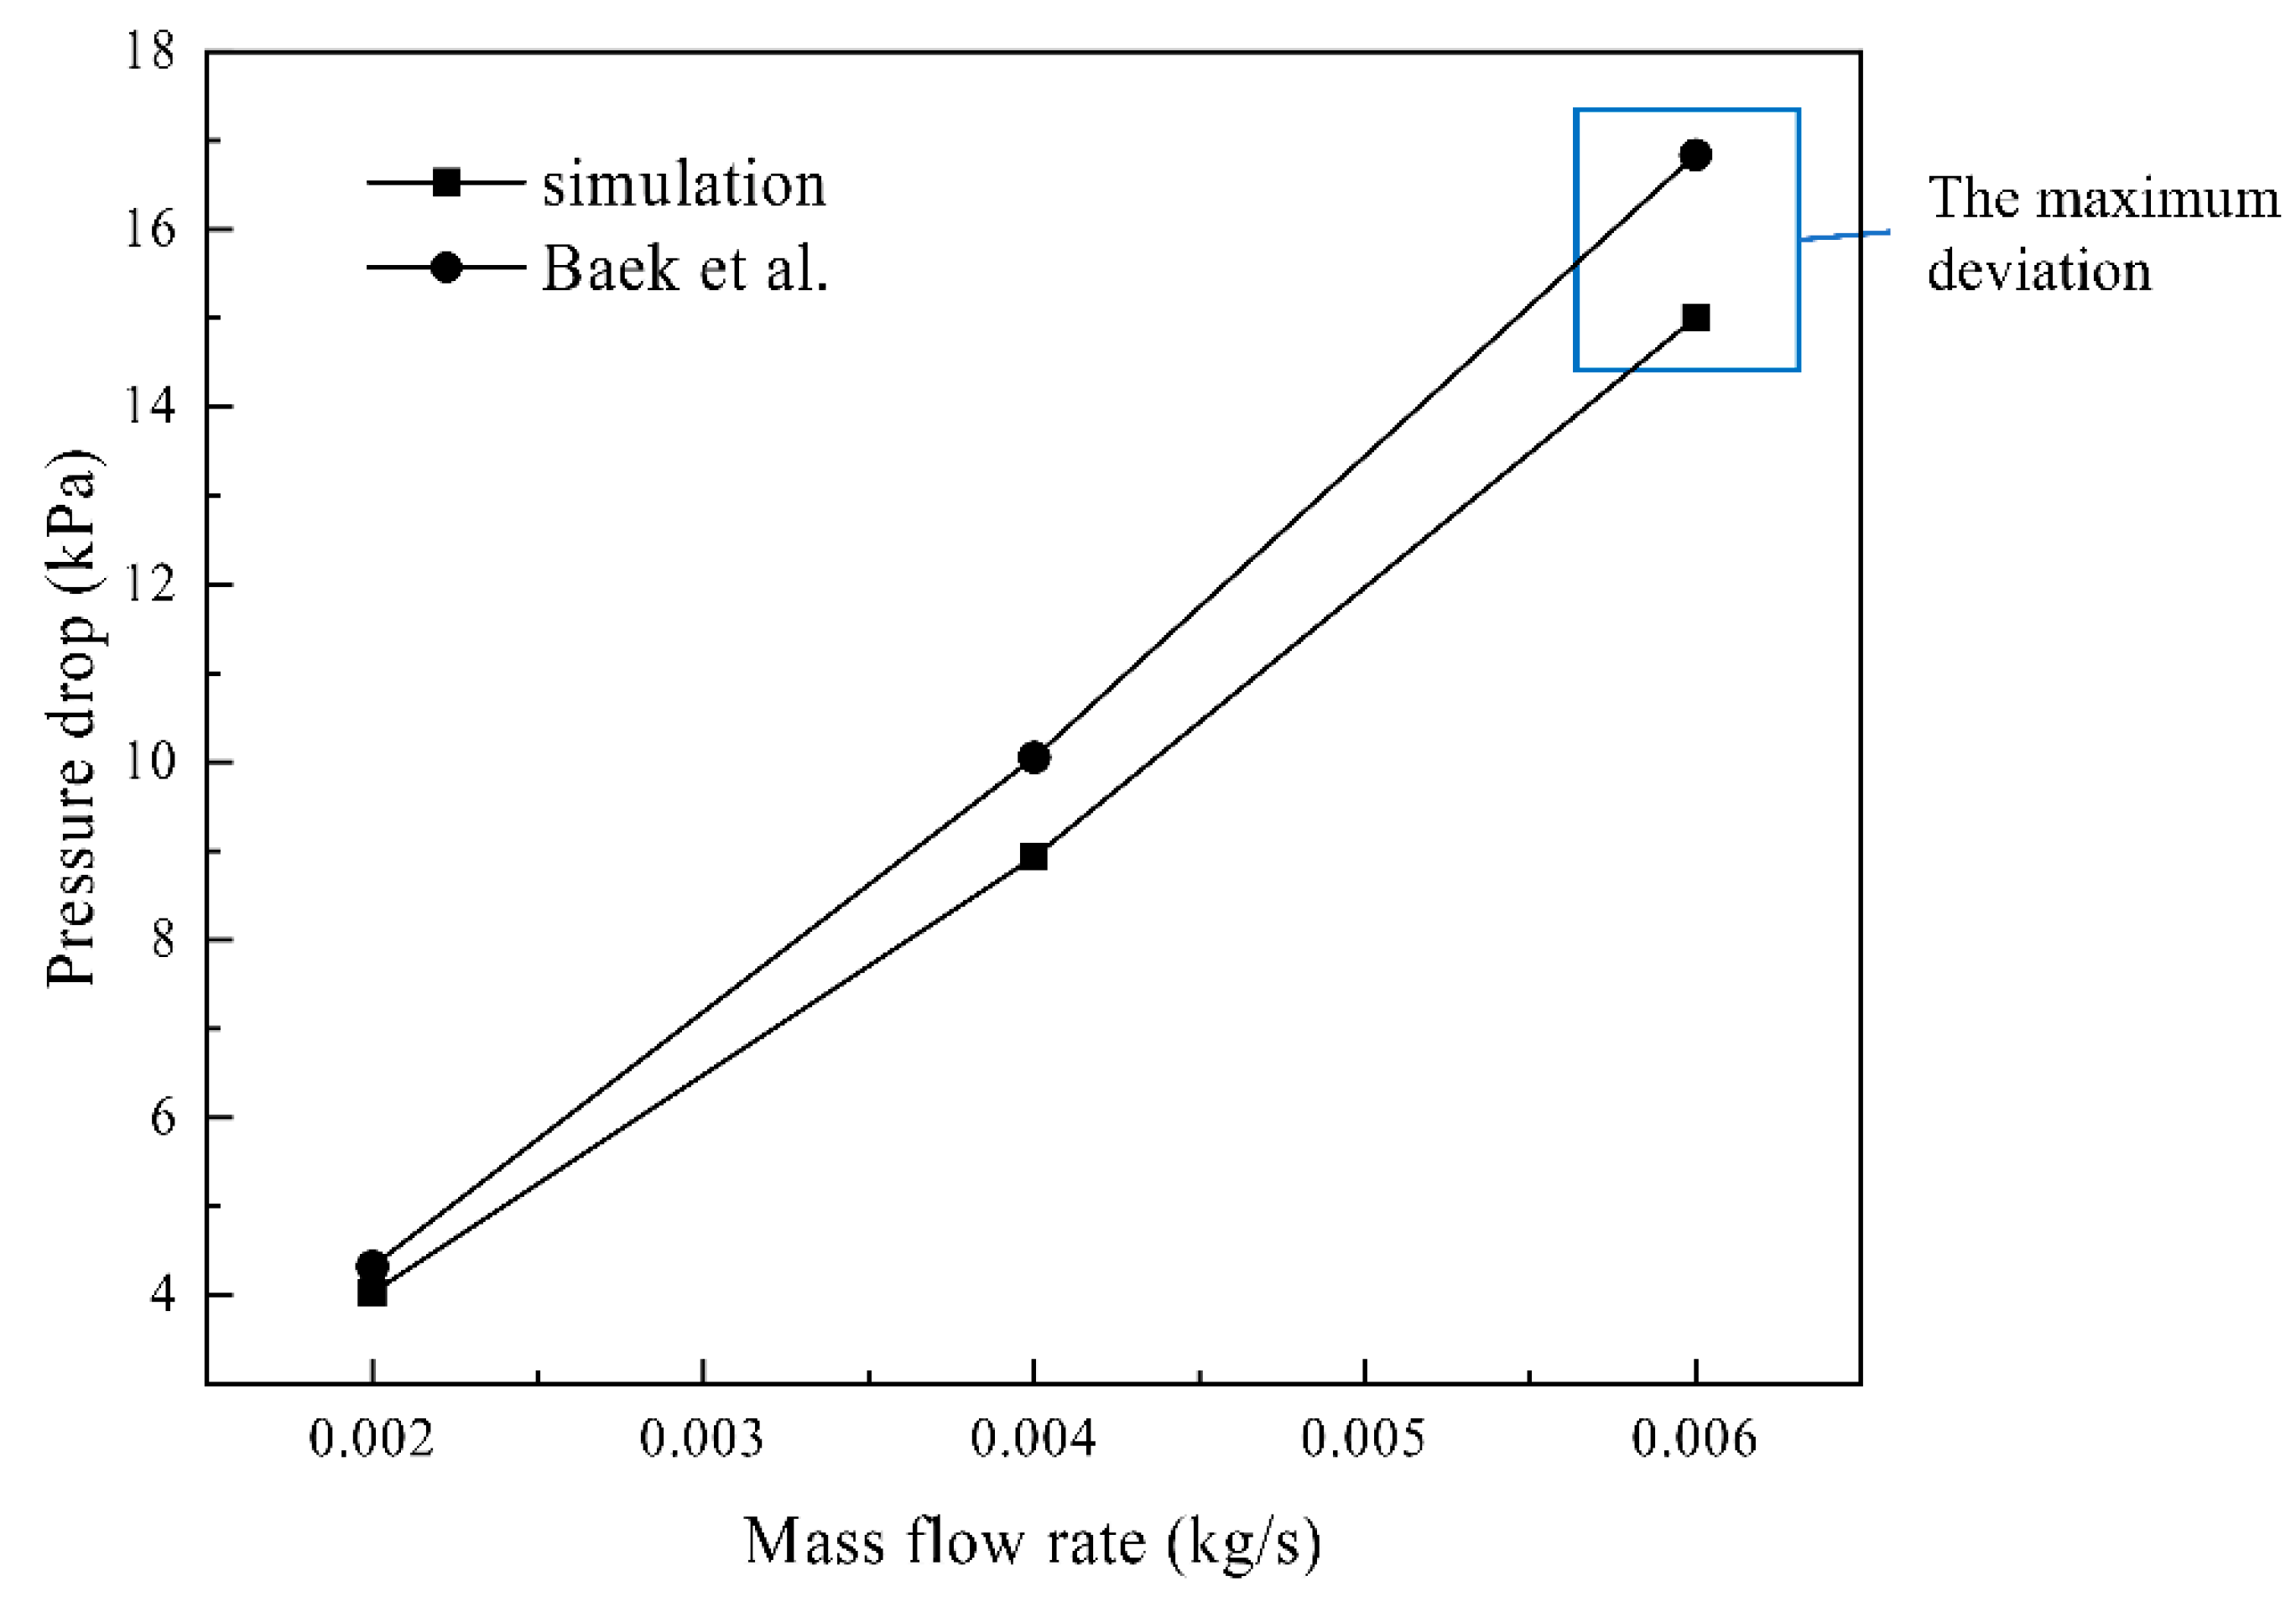
2.6. Model Verification

In order to verify the reliability of the model, the research results of relevant materials are consulted, and the numerical simulation results are compared with the results of Baek’s [40] research in Figure 5. In the numerical simulation, the Model F studied by Baek is used as the model, and the geometric structure and operating parameters (heat flux, inlet temperature, mass flow rate) were set to the same as the reference. It can be analyzed from the figure that when the inlet mass flow is 2 × 10⁻³ kg/s, the numerical simulation results in this paper are the lowest compared with those in the references. When the inlet mass flow rate is 6 × 10⁻³ kg/s, the numerical simulation results are the largest, approximately 10.1%. The results further verify the reliability of the numerical simulation method used in this study.

3. Simulation Results and Discussion

3.1. Temperature Distribution

Figure 6 shows the center plane temperature distribution of six different flow fields, and the cooling plate area of six different flow fields is 180 mm × 180 mm, where b, c, d, e, f are arranged with four inlets and four outlets, and the inlet mass flow is 0.002 kg/s. Figure 6a is a traditional single-channel serpentine flow field cooling plate. As can be seen from the figure, the heat dissipation performance of the single-channel flow field is the worst. The temperature distribution in the upstream of the flow channel in Figure 6e is below the overall average temperature, but the local temperature in the middle and downstream regions is high. Because the obstruction of the uniform plate leads to the low flow rate of the cooling liquid, the waste heat absorbed by the coolant from the bipolar plate cannot be discharged in time, resulting in the high local temperature of the cooling plate. Figure 7 shows the velocity distribution of the flow field. It can be seen that the velocity of this flow field is smaller than that of other flow fields due to the blockage of the uniform plate. In Figure 6b, due to the zigzag circling of a single channel, the local temperature distribution is uneven. Later, the optimization design will be carried out according to the design characteristics of the flow field. As can be seen from Figure 6c, the flow field temperature gradually increases from the left inlet to the right outlet. Figure 6f shows the temperature distribution of the honeycomb cooling flow field. It is observed that the overall temperature distribution upstream of the cooling plate is uniform and low, but the local temperature downstream is too high. Although the flow field of the honeycomb structure can make the coolant evenly distributed, it is still unable to avoid fluid blockage, resulting in a locally high temperature downstream. Figure 6d shows the temperature distribution of the multi-helical flow field. Due to the long length of the flow channel, there is an obvious temperature difference from inlet to outlet, but the overall situation is better than that of Figure 6a.
Figure 6d shows the temperature distribution of the multi-helical flow field. It can be seen from the figure that the temperature at the corner of the multi-helical flow field is slightly higher than that of the surrounding environment. This is due to the reflux phenomenon of the fluid at the corner of the cooling channel. As shown in Figure 8, due to the reflux phenomenon, a small part of the fluid stays at the corner and cannot be discharged in time, while the heat of the cooling plate is continuously transmitted to the remaining coolant, resulting in a local temperature difference.
Table 4 shows and compares the parameters of six different cooling plates, including pressure drop, temperature difference, maximum temperature and temperature uniformity index. The temperature difference is the difference between the maximum temperature and the minimum temperature of the cooling plate in the simulation steady state. It can be seen from the table that the maximum temperature and temperature difference of the traditional single-channel serpentine cooling flow field are the maximum values of the six cooling channels, and the temperature is also the most uneven, showing inefficient performance. As can be seen from Figure 9c, the overall pressure of model 2 is high and the coolant is blocked seriously, which is reflected in Table 4 with the maximum pressure drop.
The fluid of model 4 and model 5 has no obvious blockage, and the pressure drop of both is far less than model 0, model 1, model 2 and model 3. As can be seen from Figure 6, the flow rate of the coolant of model 4 and model 5 in the channel is small, in which the fluid uniform plate not only makes the coolant evenly distributed, but also hinders the transverse diffusion of the fluid body, making the flow rate of model 4 the minimum. It shows the highest temperature second only to the traditional single-channel serpentine flow field. The coolant flow rate of model 1, model 2 and model 3 in the channel is large and the pressure drop is high, but the higher flow rate promotes the discharge of waste heat, showing the minimum temperature difference and the minimum maximum temperature.

3.2. Pressure Distribution

Figure 9 shows the pressure distribution of six different cooling channels, and the inlet mass flow is 0.002 kg/s. As can be seen from the figure, compared with other situations, the pressure distribution of model 4 and model 5 is more uniform. Model 0 and model 2 show the largest pressure difference in the reaction area, and the maximum pressure can reach 49,265.57 Pa and 79,226.62 Pa, respectively. The reason for the large pressure drop of model 0–model 3 is the long coolant transportation distance, while the coolant flow area of model 4 and model 5 is wide, the flow channels cross and connect with each other, and the pressure drop is reduced. The pressure loss produced by the long channel length is avoided due to the large number and small length of model 4 and model 5 channels. Model 1 has four inlets and four outlets in comparison to the serpentine flow field. It can be seen that the multi-inlet and multi-channel design helps to lessen the flow field’s pressure loss. It can be summarized that the pressure drop can be effectively reduced by using a uniform plate flow field and honeycomb structure flow field.

3.3. Effect of Heat Flux

Figure 10 shows the effect of heat flux at the bottom of the cooling plate on the average temperature, maximum temperature difference, maximum temperature and temperature uniformity index of the cooling plate. It can be seen from Figure 10a–c that with the increase in bottom heat flux, the average temperature, maximum temperature difference and maximum temperature of the cooling plate increase significantly, among which the traditional single-channel serpentine flow field cooling plate increases the most. In Figure 10c, when the bottom heat flux is 4000 W/m3, the serpentine flow field cooling plate represented by model 0 maintains a good temperature since the heat flux remains within model 0’s heat exchange capacity. When the heat flux is increased to 5000 W/m3, the temperature of model 0 rises significantly due to heat accumulation produced by the serpentine flow field’s lengthy channel. For the maximum temperature difference, the effect of heat flux on the maximum temperature difference of model 2 and model 3 is slighter than that of other types of flow fields. In addition to the traditional serpentine cooling channel, the increase in heat flux has the same effect on the average temperature and maximum temperature of different types of cooling flow fields. For the new designed flow field structure, model 3 and model 4 show the highest temperature uniformity index, which shows that the deviation between the quantitatively measured surface temperature and the average temperature of the heat transfer surface of the flow channel structure is small, the temperature uniformity is high, and it has better heat dissipation performance. This is due to the uniform distribution of cooling channels and weaker blockage of the multi-helix flow field and honeycomb structure flow field.

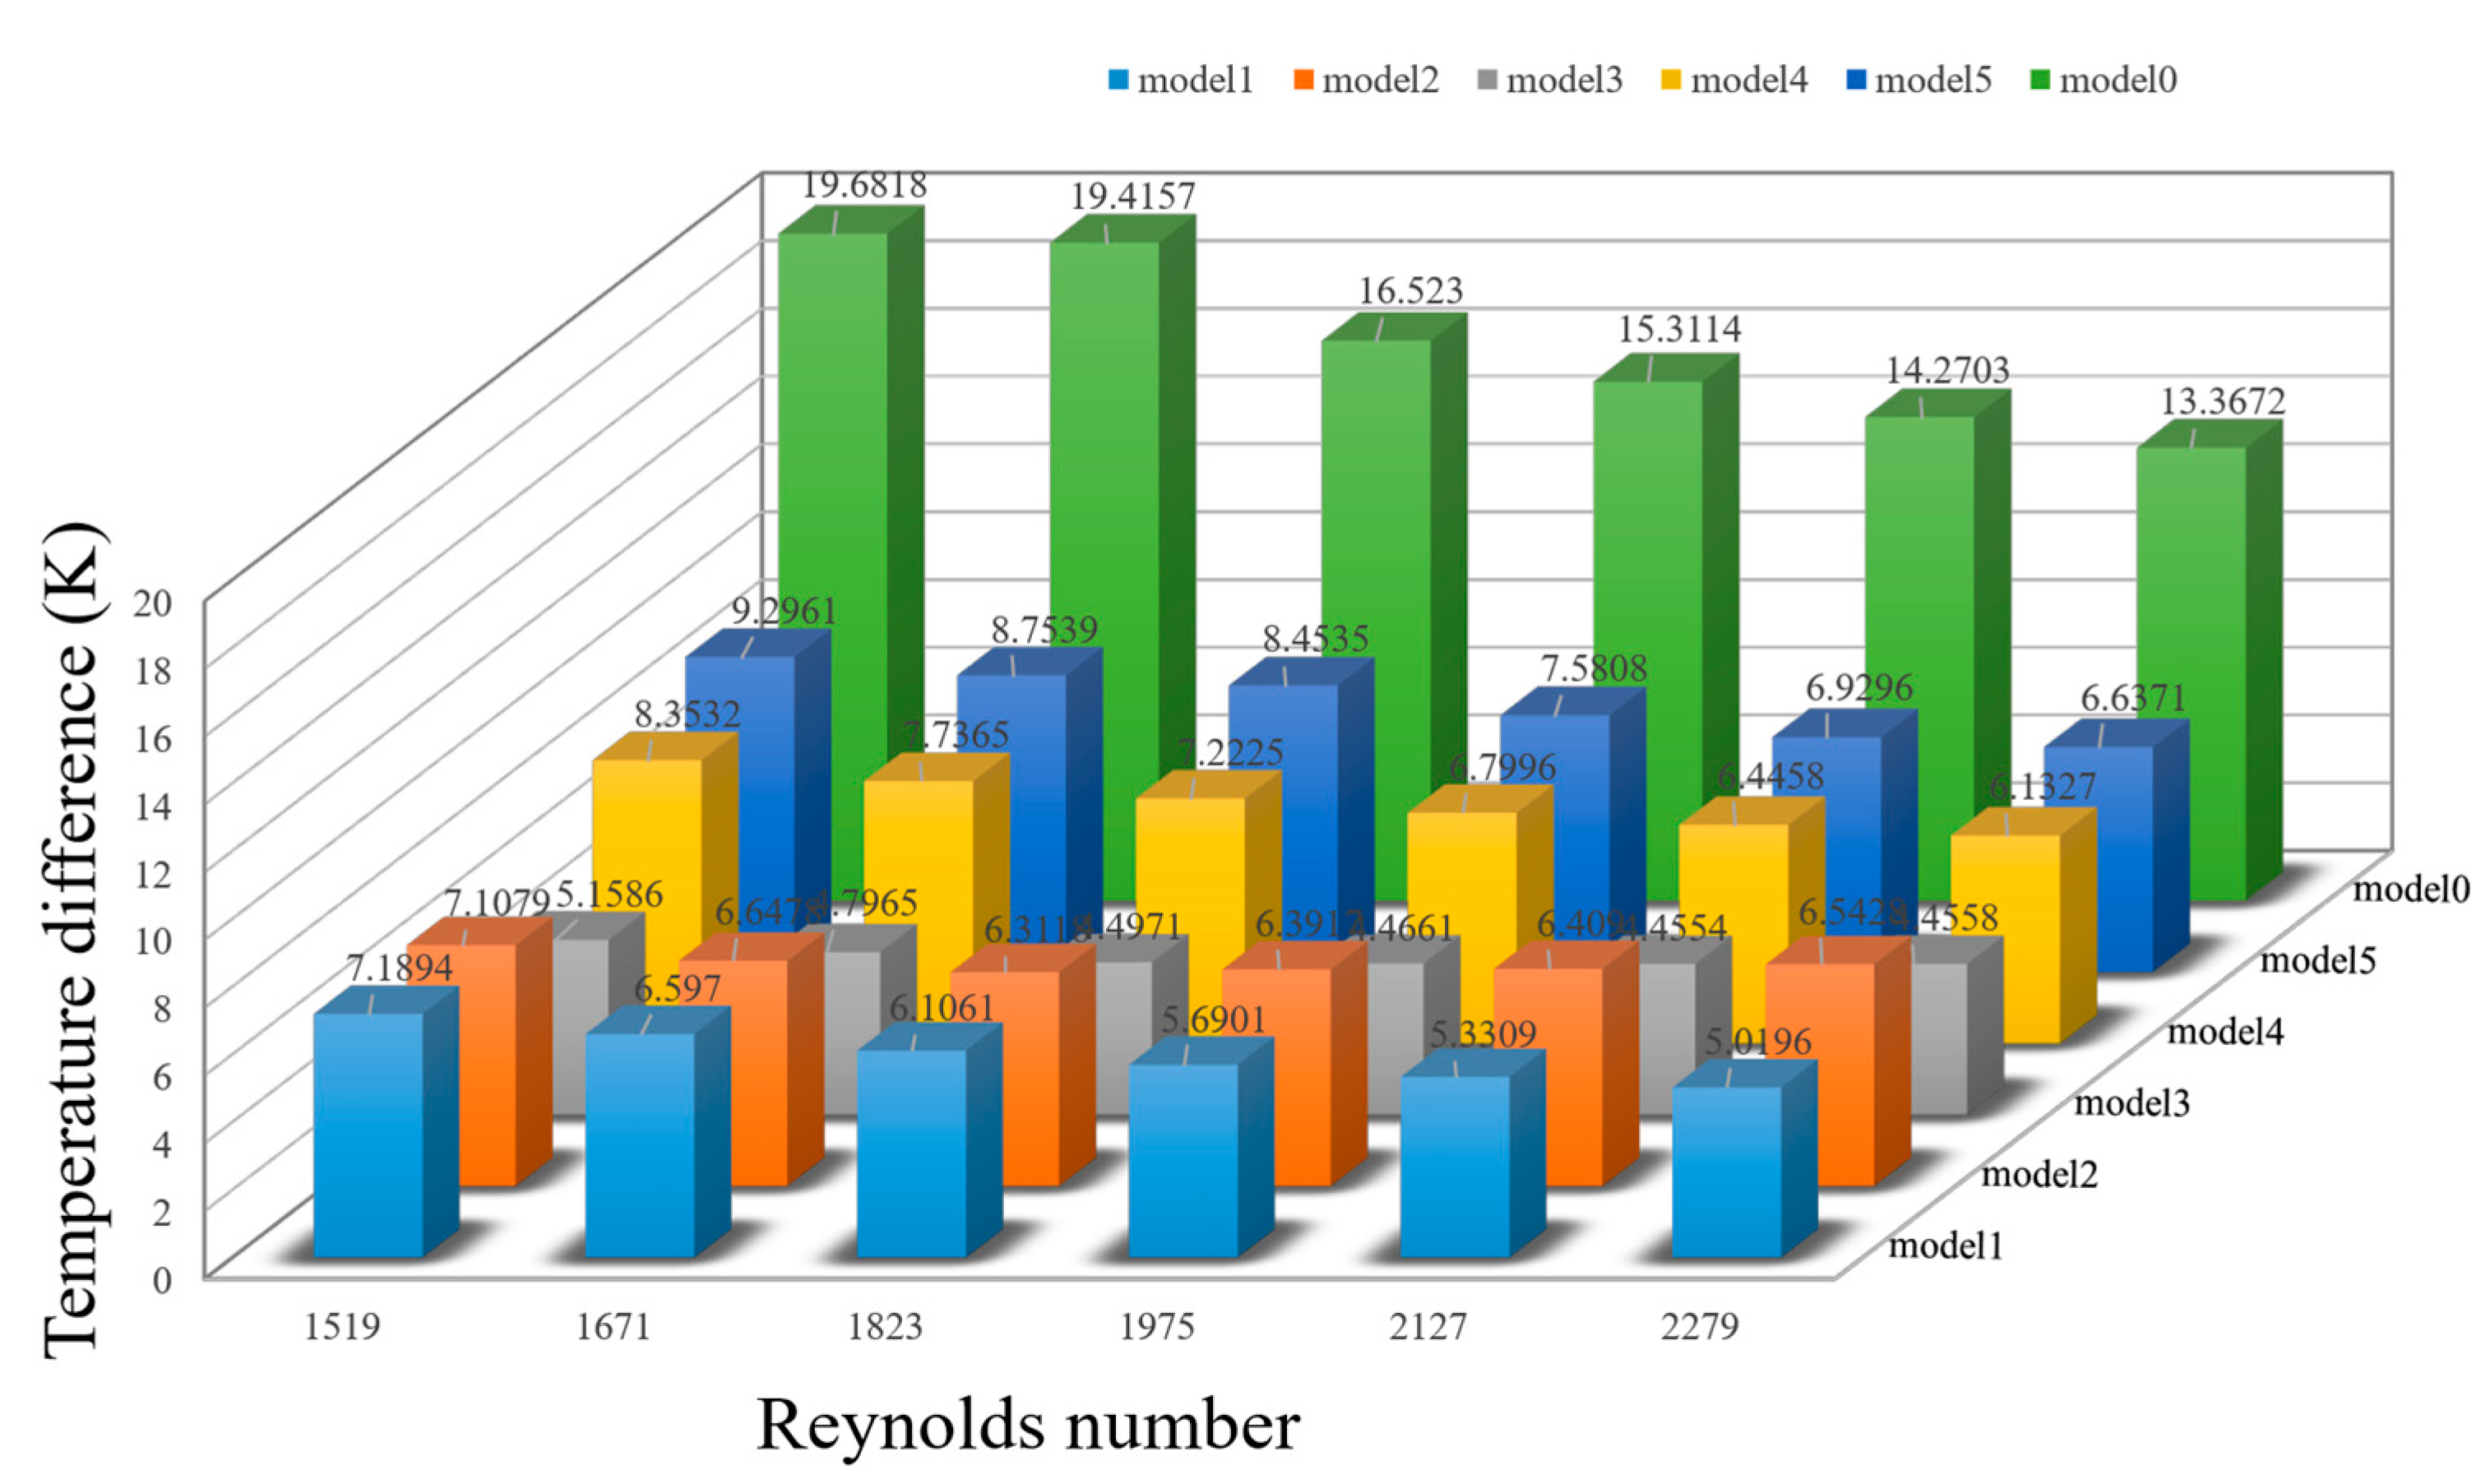
3.4. Effect of Fluid Reynolds Number

Figure 11a shows the maximum temperature of the cooling plate under different Reynolds numbers of the coolant. The boundary conditions of the numerical simulation are shown in Table 2, where the mass flow rate of the inlet is adjusted to achieve different Reynolds numbers. The results show that the maximum temperature of each type of cooling plate decreases with the increase in Reynolds number, because the larger mass flow at the inlet accelerates the heat dissipation. Figure 11b shows that the increase in Reynolds number will also increase the pressure drop in the channel due to the addition of more fluid flow. The rising trend of the Reynolds number of model 0 and model 2 is faster, because the fluid congestion in these two channels is more likely to occur.
Figure 12 shows the variation in the difference between the maximum temperature and the minimum temperature of each cooling flow field at different Reynolds numbers. The increase in the Reynolds number brings more flow of coolant, which alleviates the polarization of the working temperature of all types of cooling plates and improves the heat transfer capacity of the fuel cell cooling plates. Due to the multi-helical flow field structure with good heat dissipation performance, the temperature difference of model 3 always remains at a low value with the increase in Reynolds number.
The temperature uniformity index can present the temperature uniformity numerically. The closer the temperature uniformity index is to 1, the more uniform the temperature of the cooling flow field is. As can be seen from Figure 13, with the increase in Reynolds number, the temperature of all flow channels becomes more and more uniform. The traditional single-channel serpentine flow field maintains the lowest temperature uniformity, and the temperature uniformity of the multi-spiral flow field of model 3 is always the strongest. On the whole, increasing the Reynolds number can improve the heat transfer effect of the cooling plate.

3.5. Flow Distribution Improvement

It can be found from Figure 14a that the center temperature of the multi-serpentine cooling plate is high due to the transfer of heat from the inlet to the outlet and the winding of the cooling channel in the middle of the cooling plate. Therefore, the mass flow of the four inlets is redistributed with the total flow unchanged, as shown in Figure 14b, where half of the flow of the external cooling channel is distributed to the internal winding channel. The temperature uniformity at the bottom of the distributed cooling plate is improved, the uniformity index is increased from 0.9978508 to 0.9980883, the maximum temperature is reduced from 321.1978 K to 319.3245 K, the temperature difference is also reduced, and the average temperature is also reduced by 1.2096 K.

3.6. Effect of Bottom Non-Uniform Temperature Distribution

During the continuous operation of a PEMFC, the heat transmitted at the bottom of the cooling plate is not always uniform and constant. The temperature downstream of the coolant is always higher than the temperature upstream of the coolant due to heat exchange. After a lengthy period of operation, the temperature downstream of the cooling plate is higher than that upstream, and the temperature falls from high to low from downstream to upstream for cooling plates with a serpentine flow field, model 2, model 4 and model 5 cooling flow field distribution. To investigate the impact of non-uniform temperature on the heat transfer of the cooling plate, the uniform heat flow at the bottom is altered into a temperature gradient distribution from 324 K to 310 K. Figure 15 shows the temperature distribution results of the middle surface of the flow field.
As can be seen from Figure 15, the four models show similar temperature distributions in the case of non-uniform temperature distribution. The highest temperature of the four models is 323.99 K of model 5, and the lowest temperature is 323.9 K; the difference is not obvious. The lowest average temperature is 316.828 K of model 2 and the highest is 316.99 K of model 5. Due to the low temperature in the upstream, the heat exchange capacity of the coolant is small, and the heat exchange is mainly concentrated in the downstream region, which causes the serpentine flow field to avoid the heat accumulation generated by the longer flow channel, thus showing temperature performance similar to that of other flow channels.

4. Conclusions

In order to improve the overheating problem caused by the low heat dissipation efficiency of the cooling plate during the operation of a PEMFC, five innovative cooling flow field channel designs are proposed. The heat dissipation capacity of these five flow fields under different working conditions is studied, and the following conclusions are obtained:
  • The flow channel distribution of a multi-spiral flow field and honeycomb structure flow field is more conducive to improving the temperature uniformity. The flow channel model 4 with a uniform plate has poor temperature uniformity because the coolant is blocked by the uniform plate, but the heat dissipation capacity is still stronger than the traditional serpentine flow field. Reasonable distribution of flow between different channels can effectively improve the heat dissipation capacity of the cooling plate.
  • The temperature distribution of a multi-spiral channel is uniform, but the pressure drop is large, and the pressure drop of model 2 is the largest, which is not conducive to pumping power, but the flow velocity in the channel is high and the heat dissipation capacity is strong. The flow channels are connected with each other, such as the uniform plate flow field and honeycomb structure flow field, which can make the pressure evenly distributed. Although the long flow passage can speed up the transmission of coolant, it can easily cause water congestion.
  • The multi-spiral flow field has the strongest ability to maintain the temperature stability in the cooling plate when the heat flux increases. The increase in the Reynolds number can reduce the maximum temperature and temperature difference of the flow field, improve the temperature uniformity and improve the heat transfer capacity of the cooling plate, but it will increase the pressure drop.

Author Contributions

Conceptualization, J.S. and Y.H.; Data curation, Y.L.; Funding acquisition, J.S.; Investigation, T.L. and X.Z.; Methodology, J.S. and L.C.; Project administration, J.S.; Software, Z.M.; Validation, Y.L.; Writing—review and editing, J.S. and Y.H. All authors have read and agreed to the published version of the manuscript.

Funding

This research was funded by the National Natural Science Foundation of China (Grant No.51805102) and the Guizhou Provincial Natural Science Foundation (Grant No. [2020]1Y238).

Institutional Review Board Statement

Not applicable.

Informed Consent Statement

Not applicable.

Data Availability Statement

Not applicable.

Acknowledgments

The authors would like to thank the anonymous reviewers and the editor for their valuable comments and suggestions.

Conflicts of Interest

The authors declare no conflict of interest.

References

  1. Huang, Y.; Xiao, X.; Kang, H.; Lv, J.; Zeng, R.; Shen, J. Thermal management of polymer electrolyte membrane fuel cells: A critical review of heat transfer mechanisms, cooling approaches, and advanced cooling techniques analysis. Energy Convers. Manag. 2022, 254, 115221. [Google Scholar] [CrossRef]
  2. Xu, Z.; Qiu, D.; Yi, P.; Peng, L.; Lai, X. Towards mass applications: A review on the challenges and developments in metallic bipolar plates for PEMFC. Prog. Nat. Sci. 2020, 30, 815–824. [Google Scholar] [CrossRef]
  3. Kim, D.J.; Jo, M.J.; Nam, S.Y. A review of polymer–nanocomposite electrolyte membranes for fuel cell application. J. Ind. Eng. Chem. 2015, 21, 36–52. [Google Scholar] [CrossRef]
  4. Tawfik, H.; Hung, Y.; Mahajan, D. Metal bipolar plates for PEM fuel cell—A review. J. Power Sources 2007, 163, 755–767. [Google Scholar] [CrossRef]
  5. Dhimish, M.; Vieira, R.G.; Badran, G. Investigating the stability and degradation of hydrogen PEM fuel cell. Int. J. Hydrog. Energy 2021, 46, 37017–37028. [Google Scholar] [CrossRef]
  6. Choi, E.J.; Hwang, S.H.; Park, J.Y.; Kim, M.S. Parametric analysis of simultaneous humidification and cooling for PEMFCs using direct water injection method. Int. J. Hydrog. Energy 2017, 42, 12531–12542. [Google Scholar] [CrossRef]
  7. Rahimi-Esbo, M.; Rahgoshay, S.M.; Hassani, M.M.; Firouzjaei, K.D. Novel design and numerical evaluating of a cooling flow field in PEMFC with metallic bipolar plates. Int. J. Hydrog. Energy 2020, in press. [Google Scholar] [CrossRef]
  8. Mohamed, W.; Atan, R. Experimental thermal analysis on air cooling for closed-cathode Polymer Electrolyte Membrane fuel cells. Int. J. Hydrog. Energy 2015, 40, 10605–10626. [Google Scholar] [CrossRef]
  9. Amirfazli, A.; Asghari, S.; Sarraf, M. An investigation into the effect of manifold geometry on uniformity of temperature dis-tribution in a PEMFC stack. Energy 2018, 145, 141–151. [Google Scholar] [CrossRef]
  10. Barbir, F.; Yazıcı, S.; Yazici, S.; Yazici, M.S. Status and development of PEM fuel cell technology. Int. J. Energy Res. 2007, 32, 369–378. [Google Scholar] [CrossRef]
  11. Shabani, B.; Andrews, J. An experimental investigation of a PEM fuel cell to supply both heat and power in a solar-hydrogen RAPS system. Int. J. Hydrog. Energy 2011, 36, 5442–5452. [Google Scholar] [CrossRef]
  12. Li, H.; Tang, Y.; Wang, Z.; Shi, Z.; Wu, S.; Song, D.; Zhang, J.; Fatih, K.; Zhang, J.; Wang, H.; et al. A review of water flooding issues in the proton exchange membrane fuel cell. J. Power Sources 2008, 178, 103–117. [Google Scholar] [CrossRef]
  13. Zakaria, I.; Azmi, W.H.; Mamat, A.M.I.; Mamat, R.; Saidur, R.; Abu Talib, S.A.; Mohamed, W.A.N.W. Thermal analysis of Al2O3–water ethylene glycol mixture nanofluid for single PEM fuel cell cooling plate: An experimental study. Int. J. Hydrog. Energy 2016, 41, 5096–5112. [Google Scholar] [CrossRef] [Green Version]
  14. Kurnia, J.C.; Sasmito, A.P.; Mujumdar, A.S. Numerical investigation of laminar heat transfer performance of various cooling channel designs. Appl. Therm. Eng. 2011, 31, 1293–1304. [Google Scholar] [CrossRef]
  15. Jeon, D.H. Numerical study of serpentine flow-field cooling plates on PEM fuel cells performance. Int. J. Energy Res. 2013, 37, 510–521. [Google Scholar] [CrossRef]
  16. Soupremanien, U.; Le Person, S.; Favre-Marinet, M.; Bultel, Y. Tools for designing the cooling system of a proton exchange membrane fuel cell. Appl. Therm. Eng. 2012, 40, 161–173. [Google Scholar] [CrossRef]
  17. Matian, M.; Marquis, A.; Brandon, N. Model based design and test of cooling plates for an air-cooled polymer electrolyte fuel cell stack—ScienceDirect. Int. J. Hydrog. Energy 2011, 36, 6051–6066. [Google Scholar] [CrossRef]
  18. Wilberforce, T.; El-Hassan, Z.; Khatib, F.; Al Makky, A.; Mooney, J.; Barouaji, A.; Carton, J.G.; Olabi, A.G. Development of Bi-polar plate design of PEM fuel cell using CFD techniques. Int. J. Hydrog. Energy 2017, 42, 25663–25685. [Google Scholar] [CrossRef] [Green Version]
  19. Rahgoshay, S.M.; Ranjbar, A.A.; Ramiar, A.; Alizadeh, E. Thermal investigation of a PEM fuel cell with cooling flow field. Energy 2017, 134, 61–73. [Google Scholar] [CrossRef]
  20. Yang, X.G.; Qiang, Y.; Ping, C. Matching of water and temperature fields in proton exchange membrane fuel cells with non-uniform distributions. Int. J. Hydrog. Energy 2011, 36, 12524–12537. [Google Scholar] [CrossRef]
  21. Shian, L.; Bengt, S. Numerical study on thermal performance of non-uniform flow channel designs for cooling plates of PEM fuel cells. Numer. Heat. Tr. A-Appl. 2018, 74, 917–930. [Google Scholar]
  22. Sasmito, A.P.; Kurnia, J.C.; Mujumdar, A.S. Numerical evaluation of various gas and coolant channel designs for high per-formance liquid-cooled proton exchange membrane fuel cell stacks. Energy 2012, 44, 278–291. [Google Scholar] [CrossRef]
  23. Ravishankar, S.; Prakash, K.A. Numerical studies on thermal performance of novel cooling plate designs in polymer electrolyte membrane fuel cell stacks. Appl. Therm. Eng. 2014, 66, 239–251. [Google Scholar] [CrossRef]
  24. Castelain, C.; Lasbet, Y.; Auvity, B.; Peerhossaini, H. Experimental study of the thermal performance of chaotic geometries for their use in PEM fuel cells. Int. J. Therm. Sci. 2016, 101, 181–192. [Google Scholar] [CrossRef]
  25. Liu, Z.; Zeng, X.; Ge, Y.; Shen, J.; Liu, W. Multi-objective optimization of operating conditions and channel structure for a proton exchange membrane fuel cell. Int. J. Heat Mass Transf. 2017, 111, 289–298. [Google Scholar] [CrossRef]
  26. Wen, C.-Y.; Lin, Y.-S.; Lu, C.-H.; Luo, T.-W. Thermal management of a proton exchange membrane fuel cell stack with pyrolytic graphite sheets and fans combined. Int. J. Hydrog. Energy 2011, 36, 6082–6089. [Google Scholar] [CrossRef]
  27. Lin, C.; Yan, X.; Wei, G.; Ke, C.; Shen, S.; Zhang, J. Optimization of configurations and cathode operating parameters on liquid-cooled proton exchange membrane fuel cell stacks by orthogonal method. Appl. Energy 2019, 253, 113496. [Google Scholar] [CrossRef]
  28. Özden, E.; Tolj, I.; Barbir, F. Designing heat exchanger with spatially variable surface area for passive cooling of PEM fuel cell. Appl. Therm. Eng. 2013, 51, 1339–1344. [Google Scholar] [CrossRef]
  29. Zhao, J.; Huang, Z.; Jian, B.; Bai, X.; Jian, Q. Thermal performance enhancement of air-cooled proton exchange membrane fuel cells by vapor chambers. Energy Convers. Manag. 2020, 213, 112830. [Google Scholar] [CrossRef]
  30. Afshari, E.; Ziaei-Rad, M.; Shariati, Z. A study on using metal foam as coolant fluid distributor in the polymer electrolyte membrane fuel cell. Int. J. Hydrog. Energy 2016, 41, 1902–1912. [Google Scholar] [CrossRef]
  31. Zhang, G.; Yuan, H.; Wang, Y.; Jiao, K. Three-dimensional simulation of a new cooling strategy for proton exchange membrane fuel cell stack using a non-isothermal multiphase model. Appl. Energy 2019, 255, 113865. [Google Scholar] [CrossRef] [Green Version]
  32. Hwang, S.H.; Kim, M.S. An experimental study on the cathode humidification and evaporative cooling of polymer electrolyte membrane fuel cells using direct water injection method at high current densities. Appl. Therm. Eng. 2016, 99, 635–644. [Google Scholar] [CrossRef]
  33. Saeedan, M.; Ziaei-Rad, M.; Afshari, E. Numerical thermal analysis of nanofluid flow through the cooling channels of a polymer electrolyte membrane fuel cell filled with metal foam. Int. J. Energy Res. 2020, 44, 5730–5748. [Google Scholar] [CrossRef]
  34. Asghari, S.; Akhgar, H.; Imani, B.F. Design of thermal management subsystem for a 5kW polymer electrolyte membrane fuel cell system. J. Power Sources 2011, 196, 3141–3148. [Google Scholar] [CrossRef]
  35. Ghasemi, M.; Ramiar, A.; Ranjbar, A.A.; Rahgoshay, S.M. A numerical study on thermal analysis and cooling flow fields effect on PEMFC performance. Int. J. Hydrog. Energy 2017, 42, 24319–24337. [Google Scholar] [CrossRef]
  36. Yu, S.H.; Sohn, S.; Nam, J.H.; Kim, C.-J. Numerical study to examine the performance of multi-pass serpentine flow-fields for cooling plates in polymer electrolyte membrane fuel cells. J. Power Sources 2009, 194, 697–703. [Google Scholar] [CrossRef]
  37. Inagaki, M.; Kaburagi, Y.; Hishiyama, Y. Thermal Management Material: Graphite. Adv. Eng. Mater. 2014, 16, 494–506. [Google Scholar] [CrossRef]
  38. Fan, R.; Huang, Y.; Han, X.; Peng, X. High thermal conductivity and mechanical properties of Si@Graphite/Aluminum nitride/aluminum composites for high-efficiency thermal management. J. Alloys Compd. 2021, 858, 157630. [Google Scholar] [CrossRef]
  39. Cao, J.; Ling, Z.; Lin, S.; He, Y.; Fang, X.; Zhang, Z. Thermochemical heat storage system for preventing battery thermal runaway propagation using sodium acetate trihydrate/expanded graphite. Chem. Eng. J. 2021, 433, 133536. [Google Scholar] [CrossRef]
  40. Baek, S.M.; Yu, S.H.; Nam, J.H.; Kim, C.-J. A numerical study on uniform cooling of large-scale PEMFCs with different coolant flow field designs. Appl. Therm. Eng. 2011, 31, 1427–1434. [Google Scholar] [CrossRef]
Figure 1. Single cell structure of PEMFC.
Energies 15 02609 g001
Figure 2. Calculation model of cooling plate.
Energies 15 02609 g002
Figure 3. Design scheme of flow fields.
Energies 15 02609 g003
Figure 4. Local mesh of model 3.
Energies 15 02609 g004
Figure 5. Model verification [36].
Energies 15 02609 g005
Figure 6. Temperature distribution.
Energies 15 02609 g006
Figure 7. Velocity distribution.
Energies 15 02609 g007
Figure 8. Local velocity of multi-helical flow field.
Energies 15 02609 g008
Figure 9. Pressure distribution.
Energies 15 02609 g009
Figure 10. Effect of heat flux on heat transfer characteristics. (a) Average temperature, (b) temperature difference, (c) maximum temperature, (d) temperature uniformity index.
Energies 15 02609 g010
Figure 11. Effect of Reynolds number on heat transfer characteristics. (a) Maximum surface temperature, (b) pressure drop.
Energies 15 02609 g011
Figure 12. Effect of Reynolds number on temperature difference.
Energies 15 02609 g012
Figure 13. Effect of Reynolds number on temperature uniformity index.
Energies 15 02609 g013
Figure 14. Effect of changing inlet flow on temperature distribution.
Energies 15 02609 g014
Figure 15. Effect of bottom non-uniform temperature distribution.
Energies 15 02609 g015
Table 1. Model parameters of flow fields.
ParametersValues
Cooling area length180 mm
Cooling area width180 mm
Cooling area height3 mm
Channel and rib width3 mm
Channel depth1 mm
Table 2. Boundary conditions.
ParametersValues
Cooling plate properties
    Material    graphite
    Density    2250 kg/m3
    Specific heat    690 J/kg·K
    Thermal conductivity    24.0 W/m·K
Coolant properties
    Density    992.2 kg/m3
    Specific heat    4179 J/kg·K
    Thermal conductivity    0.62 W/m·K
    Viscosity    0.000653 Pa·s
Operating conditions
    Heat flux    5000 W/m2
    Inlet coolant temperature
    Inlet mass flow
    313 K
    0.002 kg/s
Table 3. Grid independence verification.
MeshElement NumberPressure Drop(Pa)Tmax(K)Tave(K)
Mesh1234,14915,254.47318.64316.49
Mesh21,192,71917,013.06319.71317.74
Mesh31,457,72517,113.01318.73317.74
Mesh41,959,97017,105.10318.76317.74
Mesh52,481,86017,105.63318.79317.74
Table 4. Simulation results.
CaseΔP (Pa)ΔT (K)Tmax (K)UT
Model049,263.6319.681334.2540.992421
Model119,242.267.1984321.1970.997850
Model279,753.157.1079320.8790.998066
Model317,105.105.1586319.7410.999358
Model41026.868.3532322.5420.997854
Model51593.009.2961324.6730.998077
Publisher’s Note: MDPI stays neutral with regard to jurisdictional claims in published maps and institutional affiliations.

