Article

From Wind to Hybrid: A Contribution to the Optimal Design of Utility-Scale Hybrid Power Plants

1
Faculty of Sciences, University of Lisbon, 1649-004 Lisbon, Portugal
2
National Laboratory of Energy and Geology, 1649-038 Lisbon, Portugal
*
Author to whom correspondence should be addressed.
Energies 2022, 15(7), 2560; https://doi.org/10.3390/en15072560
Submission received: 23 January 2022 / Revised: 25 March 2022 / Accepted: 28 March 2022 / Published: 1 April 2022
(This article belongs to the Topic Repowering of Wind Farms)

Abstract

:
When a substantial number of wind parks are approaching the end of their lifespan, and developers of renewables are facing decisions about what to do with their assets, concepts such as hybrid power plants are emerging as a promising solution to enable renewable integration in a cost-effective and robust manner. This work proposes a decision-aid algorithm to perform a comprehensive analysis of hybrid power plants, focusing on the energetic contribution and economic feasibility of converting existing wind power plants into hybrid power plants (i.e., installing photovoltaic panels and a storage system). The analysis was performed by comparing the option of converting existing wind plants into hybrid plants with a pure repowering exercise or overplanting using wind technology only. The obtained results unequivocally demonstrate the added value of hybrid power plants as they promote: (i) a higher installed capacity and yearly capacity factor (up to 50%); (ii) an increased efficiency of existing electric infrastructures; and (iii) a positive contribution to a sustainable energy system with the ability to generate economic value.

Graphical Abstract

1. Introduction

The near-100% renewable power systems envisioned for the future require a paradigm change in how energy systems are planned and operated. Variable renewable energy (VRE) technologies, such as solar photovoltaic (PV) and wind, will continue to play a crucial role in most scenarios aimed at achieving near-100% renewable power systems [1]. However, the high temporal and spatial variability of the power generated by these renewable resources represents a challenge for preserving the standards of security of supply, the quality of service, and the robustness of current power systems.
One of the approaches being addressed to minimize the impact of wind and solar variability is the aggregation of dispersed VRE plants to create a hybrid renewable power plant (HRPP). These are virtual or co-located power plants that combine two or more renewable resources with (or without) energy storage systems [2,3]. Many countries already foresee HRPPs in their legal regimes (e.g., Germany, Denmark [4]). Moreover, a recent legislation trend (e.g., Portugal [5]) also encourages converting existing power plants into hybrid power plants. In some cases, the conversion can be done without the need for a new permitting process, provided that the instantaneous power injection into the grid does not exceed the previously licensed threshold [6]. This legal regime is highly relevant to renewable energy operators and investors, especially as these plants continue the transition from fix-revenue schemes (e.g., feed-in tariffs (FITs)) into trading in the fully liberalized energy markets [7]. However, given its novelty, there is still a significant degree of uncertainty around the technical and economic viability of hybrid power plants in general [8], and questions about how decision-makers can best take advantage of these legislation trends to improve their financial performance.
In many world regions, wind and solar resources are anti- or inversely correlated, making the combined production more predictable and controllable [9,10,11]. Hence, one of the most intuitive strategies is the possibility of retrofitting the available area of existing wind power plants (WPPs) by adding solar PV [12] and storage systems [13].
The research behind this paper focuses on developing a decision-aid optimization tool to assess the feasibility of converting existing wind plants into hybrid power plants. The developed tool can analyze the addition of solar PV and storage systems to an existing wind plant, assessing its added value compared with a pure repowering option or overplanting with wind technology only, currently the two most common practices in the field [14,15]. In other words, this manuscript studies and evaluates the option of moving from a utility-scale single technology power plant (in the case of this study, a wind power plant) (from wind) to a utility-scale power plant encompassing different technologies (to hybrid), by adding solar and storage technologies to the existing wind power plant through a hybridization process [12]. The main contributions of this article are twofold:
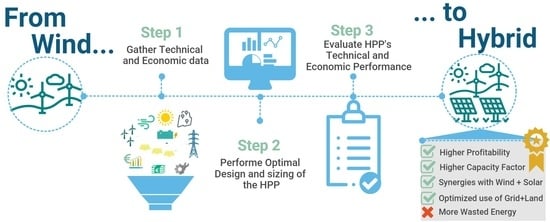
  • A methodology to characterize the energy contribution and economic viability of hybrid power plants in utility-scale applications, providing insights both to plant owners/developers and grid operators.
  • A decision-aid tool for renewable power plant developers to use in assessing the optimal hybrid plant configuration that maximizes the project’s financial performance, given the local resources and area availability, costs, and market prices.
The rest of the paper is organized as follows. Section 2 presents an overview of hybrid power plants, highlighting the novelty points of this paper. Section 3 details the methodology followed in this work. Section 4 presents the results. Section 5 presents a discussion of the results. Section 6 presents the main conclusions and recommendations for future research.

2. Overview of Hybrid Renewable Power Plants

The sizing of HRPPs, i.e., how much of which technology one should invest in, is a complex optimization exercise. Several parameters can be selected to be maximized or minimized, depending on the application [16].
Akter et al. [17] proposed an optimization method for use when determining the optimal sizing of a hybrid renewable microgrid composed of photovoltaic (PV) cells, a battery, fuel cells (FCs), and an electrolysis plant. A sizing process is performed to minimize the entire life cycle cost of the installed equipment and reduce the differences between the life cycle cost and the total profits from the chemical products sales. Hatata et al. [18] formulated an optimization method for use in a sizing exercise for an HPP comprising solar PV, wind turbines, and battery technologies. The sizing exercise was performed to satisfy a given demand requirement with the least percentage of load interruptions, using loss of power supply probability (LPSP) as a reliability indicator. Ma [19] proposed a mathematical formulation to comprehensively analyze the effect of different ratios of installed wind-solar technology on several decision variables. These include battery bank size, state of charge (SOC), loss of power supply, excess energy, net present cost, levelized cost of energy (LCOE), and payback time. Similar works have been developed by Ramli et al. [20] and Cai et al. [21] that included diesel generators.
The abovementioned works focused on small-scale and “stand-alone” applications of hybrid plants rather than commercial and utility-scale applications, which are the focus of this work. Many of the steps required in an HRPP sizing process are the same for stand-alone and utility-scale applications, such as modeling the system components and characterizing renewable resources. However, their optimization purposes are different, and so is the set of constraints included, the type of indicators considered, and the objective function formulated. In summary, an HPP optimization process typically follows a cost-minimization approach when operating in stand-alone applications [22,23], and is aimed at maximizing profit if in grid connect mode [24]. These differences ultimately lead to different design outcomes.
The studies using market-based revenues to address optimal sizing decisions have focused mainly on adding storage systems to existing renewable power plants, with the premise that a battery system would enable better management of the production profile, thus yielding increased profits [25]. Małkowski et al. [26] proposed a methodology to study the technical and economic viability of operating a hybrid photovoltaic–battery energy storage system. The authors concluded that, although the system’s operation was feasible, the levelized cost of electricity was two-to-three times higher than the day-ahead (DA) average market price. Nasrolahpour et al. [27] presented an investment decision-making tool for wind producers that desire to expand their portfolio by investing in a battery system. Similar efforts were made by Wang et al. [28], who developed a method to optimize a hybrid energy storage system (HESS) to support the dispatch of a 30 MW solar PV power plant in the Australian national electricity market. Results from both studies indicate that the benefits of a storage system might be limited to specific conditions. In the first study, profits are achieved only when the power grid is congested, and the battery system is not co-located with the WPP. In the second study, the positive profit improvements were attained only for residual storage capacities compared with the PV nominal capacity.
The studies in [26,27,28] provide an insight into how storage systems can support the participation of renewable power plants in electricity markets. However, they overlook the importance of joint wind, solar PV, and storage technology assessments in the same optimization run to obtain a holistic view of the problem.
To that end, Yang et al. [29] used a bi-level planning model to integrate a wind–photovoltaic–battery HRPP, proposing a capacity configuration method that considers the return on investment for the stakeholders. Carvalho et al. [30] performed a technical-economic analysis of a wind–solar hybrid system deployment in a utility-scale setting. However, the research was limited to a specific case study on Brazil’s particular (fixed) remuneration schemes. Shereiqi et al. [31] proposed an optimization strategy to achieve a reliable wind–solar–battery HRPP. In the first step, a wind power plant is configured to reduce power losses on the wind power plant. In the second stage, solar PV and batteries are added to the existing wind farm to reduce the power fluctuations on the output of the HRPP generation. Similarly, Al-Shereiqi et al. [32] created a strategy that determines the optimal size of hybrid wind–solar photovoltaic power systems that use heuristic optimization with a numerical iterative algorithm such that the output fluctuation is minimized. A sizing exercise was performed to reduce the impact of renewable intermittency and to generate the maximum output power to the grid at a constant level based on the availability of renewable energy resources. Nuvvula et al. [33] studied a battery-integrated HRPP that includes floating solar, bifacial rooftop, and wind energy systems. The system components were optimized to minimize the levelized cost of energy (LCoE), battery life cycle loss (LCL), and loss of power supply probability (LPSP). Recent studies have also used real-time data to perform dynamic multi-objective optimization exercises in the energy field [34]. While many of the indicators and KPIs are the same (e.g., annual production and other economic indicators), the data used to perform the optimization is different. To use real-time data would mean that a system is already in place, and therefore data can be collected in real time. Many of the presented studies focused on the technical and economic value of adding new technology (storage, solar PV) to existing systems. Hence, the common approach in the literature is to use historical data and apply statistical approaches to model the energy production and market prices throughout the lifetime of a project [7]. A methodology based on historical data can be more easily applied to different locations and case studies since it does not depend on real-time data acquisition systems. Furthermore, in many applications, studies are trying to access the added value of adding new technologies.
Most of the literature on the sizing of HRPPs for utility-scale applications is presented without a common reference point to effectively compare alternative options for decision-makers. The studies in [26,27,28] concluded that adding a battery storage system would increase costs, but did not provide a comparative basis for other solutions that might still be beneficial (e.g., overplanting with the same technology or adding other renewable source technologies). Furthermore, the optimized configuration of an HRPP is mainly performed on a single case study [29,30,31,32,33], which may undermine the potential for generalizing the results to other locations. The technical and economic performance of an HRPP in utility-scale applications that participates in the DA market depends on the complementarity profile of the renewable energy resources feeding the technologies that constitute the HRPP [35]. Furthermore, it will also depend on how well the production profile can correlate with energy prices [36,37], especially if no storage system is installed. Hence, the methodology proposed in this paper builds on the current literature by:
  • Comparing the obtained results with the industry’s standard practices. These typically include repowering or overplanting with single technologies. The premise is that by comparing with standard industry practices, the proposed methodology and the results obtained could highlight the added value of HRPPs and better inform stakeholders and decision-makers in the energy sector.
  • Applying it to different case studies, with different complementarity profiles of renewable production and DA market prices at different timescales. The premise is that, by considering different case studies, the results obtained could provide more insights into the debate on the technical and economic feasibility of hybrid power plants.
  • Considering the capacity addition of wind, solar PV, and battery technologies when performing an HRPP sizing optimization for day-ahead market (DAM) participation, rather than focusing mainly on the design of the storage system [26,27,28]. The hypothesis here is that considering all technologies in the optimization exercise allows the model to have a more comprehensive view of the problem, thus obtaining holistically optimized decisions. Failing to do so may lead to solutions that are not as efficient when considering technical and economic perspectives.

3. Methodology

3.1. Problem Formulation

Let us consider the perspective of a wind power plant (WPP) owner whose assets are approaching the end of their lifetime. The investor is facing the decision about what to do with them in the near future. Assuming that the decision-maker is willing to keep the asset in the portfolio, he/she is left with three alternatives (Figure 1). The first is to perform a simple repowering exercise, substituting the old wind turbines with new ones (Option 1). The second is to take advantage of the new legislation frameworks encouraging existing power plants to be overplanted or converted to hybrid plants. The overplanting can be done using only wind technology (Option 2), keeping the wind plant as such. It can also be done by adding solar PV and storage system technologies instead, converting it into a hybrid power plant (Option 3).
A pre-requisite of the legislative framework is that all generation groups and the storage system are co-located and share the same point of common coupling (PCC) to the grid (Figure 2). Another is that the instantaneous power delivered to the grid does not surpass the licensed capacity of the existing wind plant at the PCC. In this work, the internal network of the hybrid plant was modeled as ideal. Lastly, as renewable technologies mature, remuneration schemes evolve from fixed revenues (e.g., feed-in tariffs) to fully market-based. For this reason, the analysis presented in this study is based on DAM revenue streams. Hence, the energy produced is remunerated at the market price of that specific hour. The hybrid plant behaves as a price taker in the energy market in this work. Indeed, this aligns with the developer’s perspective when pre-assessing a future project’s economic viability.

3.2. Optimal Design and Sizing of Hybrid Power Plants (OPT.Hy)

The optimization method proposed in this work was designed to identify the optimal wind, solar PV, and storage capacity to be added to an existing wind plant that yields the maximum financial return for a power plant owner/developer participating in the DAM, expressed in terms of its net present value (NPV). Several restrictions condition the optimal configuration: hourly wind–solar power production, storage system operating conditions, grid-connection capacity, power plant’s area availability, and economic performance. Figure 3 summarizes the developed algorithm’s main inputs, outputs, and the optimization formulation followed.
In the next subsections, the mathematical formulation behind the proposed algorithm is presented.

3.2.1. Variable Renewable Generation

The power production of the VRE power plants for each hour t of year y is determined by the product of the optimal capacity for each technology   ( C W and C P V -), the normalized hourly annual production profile for each of the technologies   ( p ( t ) W and p ( t ) P V -), and a random parameter that translates the inter-annual variability of both resources ( ξ ( y ) W and ξ ( y ) P V ) : Equation (1). Furthermore, the wind power production was then modeled as a function of the number of turbines to be repowered/added to the existing wind plant: Equation (2). It was assumed that the wind turbines have a rated power of 2 MW:
P V R E ( y , t ) = C W · p ( t ) W · ξ ( y ) W + C P V · p ( t ) P V · ξ ( y ) P V , t , y
C W = 2 · N

3.2.2. Energy Storage System

The energy stored in the battery system in each period t is determined using the level of energy stored in the previous hour and the energy inputs P C H A ( y , t ) , scaled with the round-trip efficiency ( η ) , and the energy outputs P D I S ( y , t ) :   Equation (3) [39]. Furthermore, Equations (4) and (5) impose that the system is always operated within the optimally designed system parameters, namely the rated power ( P B A T ) and energy capacity ( E B A T ) . Y B A T ( y , t ) is a binary variable that assumes the value 1 when the battery is in discharge mode, and 0 otherwise:
E B A T ( y , t ) = E B A T ( y , t 1 ) + η · P C H A ( y , t ) P D I S ( y , t ) , t , y
P C H A ( y , t )     P B A T · ( 1 Y B A T ( y , t ) ) , t , y
P D I S ( y , t )     P B A T · Y B A T ( y , t ) , t , y

3.2.3. Technical Restrictions

The hybrid power plant must ensure that, at each time step, the power balance inside the system is such that the power injected into the electrical grid does not surpass the licensed capacity: Equations (6) and (7) [29]. In these equations, P D A M ( y , t ) refers to the energy delivered to the day-ahead energy market, P C U R T ( y , t ) refers to the energy curtailed, and P P C C is the maximum injection capacity to the power grid:
P V R E ( y , t ) + P D I S ( y , t ) = P D A M ( y , t ) + P C H A ( y , t ) + P C U R T ( y , t ) , t , y
P D A M ( y , t )   P P C C , t , y
Furthermore, the wind and solar PV capacity installed is also restricted by the available power plant area: Equations (8) and (9) [9]. The absence of such constraints can lead to unfeasible results in real locations, as discussed by Talent and Du [40], especially when addressing the conversion of existing power plants into HRPPs. Furthermore, it was considered that the PV panels could be installed in 2/3 of the area occupied by the wind park. The remaining 1/3 would continue unoccupied for access roads and to account for the shading effects of the wind turbines in the solar PV panels:
C W · A W   A P P
1 3 · C W · A W + C P V · A P V   A P P

3.2.4. Economic Performance

The yearly revenue   ( G ( y ) ) along the lifetime of the hybrid renewable power plant is given by the difference between the revenue streams coming from selling electricity in the DAM and the respective operational and management costs of its assets (OPEXTEC): Equation (10) [30]. The HRPP remuneration is assumed to be market based and, therefore, the revenues obtained are derived based on the energy produced by the HRPP, in year y and hour t ( P D A M ( y , t ) )   multiplied by the prices observed in the day-ahead electricity market. A technical approach to relying on historical data and statistics was used to simulate the electricity prices, a method commonly found in the literature on this topic. This model uses historical hourly data ( λ D A M ( t ) ) and a forecasted inflation rate ( i ( y ) ) for the next five years [7]. A constant inflation rate was assumed from the fifth year onwards.
The investment costs of the hybrid power plant are determined using Equation (11). The first term refers to the investment cost of repowering the pre-existing wind park (assuming that the initial investment was already recuperated in full and the repowering cost equals 50% of the initial capital costs (CAPEX)). The second term in Equation (11) refers to the investment costs of the added capacity [30]. The subscript TEC in Equations (10) and (11) serves to indicate the operation and maintenance costs (OPEX) and CAPEX costs of each technology composing the HRPP:
G ( y ) = t   P D A M ( y , t ) · λ D A M ( t ) · i ( y )   T E C   O P E X T E C ( y )   , y
I = P W · 50 % · C A P E X W   + T E C   C T E C · C A P E X T E C  
The investment return is then evaluated using the net present value (NPV) indicator, derived from the discounted cash flows using discount rate r : Equation (12) [30].
N P V = I + y   G ( y )   ( 1 + r ) y

3.3. Optimization Formulation and Solving Method

The optimization model proposed in this work has as its objective function the condition defined by Equation (12)—subject to all the physical, technical, and financial constraints on the hybrid power plant project given by Equations (1)–(11). On its basic configuration, this formulation originates a large-scale, complex, and non-linear combinatorial problem with a mixed-integer nature (MINLP) [41].
In this work, a solving method comprising metaheuristic and mixed-integer linear programming was used [42].
The original MINLP model was divided into two sub-models:
(1) The investment part, where the candidate solutions for the system sizing ( C W , C P V , C B A T , P B A T ) are determined and evaluated using a metaheuristic approach, namely a genetic algorithm (GA) [43,44];
(2) The operational part, with a mixed-integer linear model (MILP) simulating the hourly operation of the hybrid system for its entire lifetime [45,46].
By doing so, two linear sub-models are created, allowing for the solving method to take advantage of the linear solvers’ speed and reliability, and the versatility and flexibility of the metaheuristic ones [29]. In short, the proposed solving method works as follows:
STEP 1A 1st candidate solution is arbitrarily created by the GA algorithm;
STEP 2The candidate solution is transferred as input parameters to the MILP model;
STEP 3The MILP model is solved using the CPLEX;
STEP 4The feasibility of the solution and its respective objective function value is transferred as the fitness function value for the GA algorithm; A very large penalty is added to the fitness function if the candidate solution is infeasible;
STEP 5Repeat STEPs 2 to 4 until stopping criteria is met.
The GA algorithm will keep running until the stopping criteria is met. In this work, two stopping criteria are active. The first criterion is defined by the function tolerance, i.e., the algorithm will stop when the average relative change of the best fitness function is smaller than a given threshold over a given number of generations. The threshold was set to 1.0 × 10⁻⁶ and the number of generations to 50. The second criterion is related to the maximum generations, i.e., the algorithm will stop if the maximum number of generations is reached. The maximum number of generations was defined as 400, which corresponds to 100 times the number of variables.
Figure 4 illustrates the flowchart of the applied solving method.

3.4. Application of the OPT.Hy Methodology

3.4.1. Case Study Selection and Scenario Construction

When assessing the technical and economic feasibility of converting existing WPP into HRPP (and designing HRPPs in general), one of the determinant factors is the complementarity of the wind-and-solar primary resources in the power plant’s site [47]. Since this study also considers DAM revenue streams, the other key factor is the correlation of the production profile of the HRPP with the DAM prices. The developed algorithm was applied to assess the feasibility of converting a reference WPP with 20 MW installed capacity and 2.5 km2 area availability into an HRPP in three different locations. Indeed, in many world regions, wind and solar PV are, on average, anti-correlated. However, these case studies were selected because they display distinct wind–solar complementary profiles and different hybrid–DAM price correlations at different timescales. Table 1 displays the main characteristics of the selected case studies.
Figure 3 depicts both the daily and the yearly production profile of wind and solar PV technologies for the selected locations.
In Case Study 3, both solar PV and wind have a positive yearly correlation because they show higher capacity factors during most of the year (up to September). The capacity factor decreases accentually during the last months of the year (Figure 5c, bottom).
Furthermore, in these locations, the capacity factor of the wind is higher during the night hours, while the DAM prices are higher during the daytime hours, hence the negative correlation. Again, in Case Study 3, we can verify a slight increase in wind production in the late afternoon, when the electricity prices increase (Figure 5c, top), with the final wind–DAM correlation showing a slightly positive result. When adding the solar PV technology, produced only during the day, the final HRPP capacity factor is positively correlated with DAM prices at the daily time scale. At the yearly time scale, the correlation is negative because the capacity factor of the HRPP is higher in months when the electricity prices are lower, and vice-versa (Figure 5, bottom).
Three scenarios were created to establish a comparative analysis to derive the added value of converting an existing wind plant into a hybrid power plant. Each scenario represents the options available to the decision-maker depicted in Figure 1. Scenario 1 (reference scenario) refers to the scenario where only the repowering of the existing WPP is considered (Option 1). To construct this scenario, the decision variables C W ,   C P V ,   P B A T   e   E B A T were fixed to 0. The second scenario, Scenario 2, along with repowering, considers overplanting with wind technology, keeping the power plant as a wind plant (Option 2). To construct this scenario, the decision variables C P V ,   P B A T   e   E B A T were fixed to 0. Lastly, Scenario 3 refers to the final option of converting the existing WPP into an HRPP by considering the addition of both wind and solar PV technologies together with a storage system (Option 3).

3.4.2. Input Data

A time series of hourly data was used for the wind, solar PV power production, and market prices, with 2016 as the reference year. The data was gathered from:
  • An MCP (measure–correlation–prediction) method was used to create the time series of wind power production used in this work. The MCP method is based on a neuronal network technique using real and numerical weather prediction data [48].
  • The photovoltaic geographical information system (PVGIS) tool was used to gather the hourly PV power data of the selected case studies [49]. The optimized slope and azimuth option were used for each HRPP location, as well as crystalline silicon PV panels, considering 14% of the system’s losses (related to losses in cables and power inverters, among other factors).
  • The time series for day-ahead market (DAM) prices used in this study refers to the Iberian market (MIBEL) [50]. A correction factor was introduced so that the average market price reflects recent market trends (an average price of 53.40 €/MWh from 2017 to 2019).
Data regarding the other technical and economic parameters used in this study is shown in Table 2, as well as the characteristics of the technologies considered (Table 3).

4. Results

The main results for the three case studies and the three scenarios considered are presented in Table 4.
  • Case Study 1: the pure repowering option (Opt1) in this case study originates the supply of 49.4 GWh of energy per year, on average, to the energy market, which corresponds to a load factor for the interconnection line of 28%. The energy produced had an average market price of 46.16 €/MWh. When considering overcapacity, the results demonstrate that adding wind capacity (Opt2) over the PCC limit is not optimal. Instead, the optimal decision is to add 25 MW of PV technology (Opt3). The addition of PV technology would originate the supply of 80.6 GWh/year to the energy market, increasing the load factor of the interconnection line to 46%. The average market price per MWh produced also increased by 6.26 €/MWh, assuming the value of 52.42 €/MWh. This allowed an increase of NPV from 15.6 to 23.7 M€. However, the internal rate of return (IRR) decreases in the Opt3 scenario compared with the pure repowering option, going from 20% in Opt1 to 14% in the Opt3 scenario.
  • Case Study 2: the pure repowering option (Opt1) in this case study originates the supply of 57.9 GWh/year to the energy market, corresponding to a load factor for the connection line of 33%. When considering the overcapacity scenario with wind technology only (Opt2), the results show that 10% of overcapacity increases the economic performance of the WPP. This result translates into a supply of 61.81 GWh to the energy market, an interconnection line load factor equal to 35%, and an average market price of 49.38 €/MWh. However, the Opt3 scenario for Case Study 2 reveals that the optimal decision is to repower the initial 20 MW of wind technology and add 23 MW of PV technology. This decision results in a supply of 88.4 GWh annually to the energy market, increases the interconnection line’s load factor from 35% to 50%, and the average market price for the produced energy from 49.38 to 53.73 €/MWh. The NPV of the project also increases from 22.3 M€ in the Opt2 scenario to 27.4 M€. As in Case Study 1, the IRR of the hybrid project is lower (16%) in Opt3 compared with the 25% and 23% of Opt1 and Opt2, respectively.
  • Case Study 3: the pure repowering option (Opt1) in this case study originates the production of 58.1 GWh yearly, which corresponds to a connection line load factor of 33%. The Opt2 scenario shows the added value of installing an overcapacity of 20%, i.e., adding 4 MW to the original wind plant. The decision to add 4 MW of wind technology increases the energy produced to 66.7 GWh yearly, which also increases the load factor of the connection line to 38%. As in Case Study 2, the Opt3 scenario shows that the optimal decision is to repower the 20 MW of wind technology and add 24 MW of PV technology. In this scenario, the highest NPV is achieved (29 M€), with 90.9 GWh per year being supplied to the energy market, a load factor of 52%, with an average market price of 54.44 €/MWh.
In all three case studies, the NPV of the project increased as we moved from Opt1 to Opt3, indicating that the overall economic performance of converting the existing WPP into an HRPP is higher than the pure repowering option (Opt1) or overplanting with wind technology only (Opt2). However, the IRR of the project is lower, given the higher investment costs for the solar PV technology utilized. Hence, the results show that the value of the investments in the HRPP should not be analyzed in purely economic terms (i.e., using only the IRR indicator), but should also be looked at in the context of its contribution to a sustainable energy system and its ability to generate value.
Figure 6 shows the percentiles (10 to 90) of each case study’s daily injected power for a whole year of operation. The top graphics represent the Opt2 (overcapacity with wind) scenario, while the second row represents the Opt3 (hybrid) scenario.
The WPP has an average hourly injected power of 5.67 MW in Case Study 1, 7.08 MW in Case Study 2, and 7.63 MW in Case Study 3. When the PV technology is added (i.e., in the hybrid row), these values increase to 9.22, 10.12, and 10.41 MW in case studies 1, 2, and 3, respectively. The solar PV technology addition increases both the load factor of the connection line and the average energy market remuneration per MWh produced in all three case studies.
Figure 7 depicts the day’s hybrid plant production per technology, with the production profile most similar to the average power injection shown in Figure 4. Once more, the first row refers to the wind scenario, and the second row the hybrid scenario.
As shown in Figure 6 and Figure 7, for case studies 2 and 3, the produced and injected power during the night is lower in the hybrid scenario compared with the wind scenario. This is a consequence of the added wind capacity in the WPP scenario in both case studies, which does not occur in the hybrid scenario. Instead, all the additional capacity is in the solar PV technology in the hybrid scenario. The addition of solar PV technology largely contributes to reinforcing the power output during the daytime with higher DAM prices.
Storage systems did not appear in the optimal configuration of the hybrid plant in any case study. This result indicates that the batteries’ expected contribution to minimizing curtailment and enabling arbitrage in the DAM does not offset the current investment costs. Consequently, all the excess energy produced (above the 20 MW limit) is wasted. Mild curtailment can be observed in Figure 7 for case studies 1 and 3; although on yearly average, the curtailed energy is 4.707 GWh for Case Study 1, 5.019 GWh for Case Study 2, and 8.121 GWh for Case Study 3 (recall Table 4), which represents 6%, 5%, and 8% of the total produced energy in case studies 1, 2 and 3, respectively. Figure 8 depicts the curtailed energy duration curve for each case study.

5. Discussion

In this section, the main findings of this work concerning the energetic contribution and economic feasibility of converting existing wind plants into hybrid plants are presented and discussed. The main findings can be divided and interpreted according to their impact on the technical, economic, and environmental domains of sustainable energy systems.

5.1. Technical and Environmental Domains

  • Higher renewable installed capacity and yearly capacity factor: the concept of an HRPP allows for an increase in renewable energy systems (RES) installed capacity. In all three case studies, the initial WPP capacity doubled when the plant was converted to an HRPP, maintaining the maximum injected power as prescribed. Consequently, a higher energy value is delivered yearly to the network, increasing the capacity factor of the (hybrid) power plant compared with keeping the plant as a wind power plant.
  • Higher curtailment levels: converting an existing WPP into an HRPP originates higher curtailment energy, especially if no storage system is installed. This result was expected due to the increase in installed capacity (above the permitted power), which allows for the generation of higher amounts of energy and, for a short annual period (<5% hours of the year, approximately), the power produced will be above the allowed interconnection grid capacity, making curtailment inevitable. For that reason, all three case studies show an increase in curtailed energy when a hybrid solution is in place compared with the reference scenario.

5.2. Economic Domain

  • Higher energy marginal value: adding solar PV technology to a WPP yields a higher correlation between the power plant’s daily profile and market prices. Thus, a higher market value per MWh produced is achieved, as demonstrated by the increase in the energy produced marginal value from the wind to the hybrid scenario in all three case studies. This increase in value is expected to occur in most Southern European locations due to existing complementarity between wind and PV generation profiles. The site-depending relevance is proven by the results of the three case studies with distinct wind and PV profiles.
  • Higher investment costs: the results show that investing in an HRPP is more capital-intensive than pure repowering due to the solar PV technology capacity. The high investment costs can be considered to be a barrier to small stakeholders with limited access to capital. Furthermore, the higher investment costs of the HRPP option compared with the pure repowering option also decreases the IRR of the project.
  • Higher profitability of the investments: when comparing an HRPP with the other options (e.g., repowering, or repowering plus wind overcapacity), even though investment costs are higher, the profitability of the hybrid solution is also higher, as shown by the presented net present values obtained for all three case studies. Moreover, a hybrid mix of energy sources can represent higher flexibility in adapting to changes in environmental conditions, thus offering investors a potential mitigation effect on long-term risks linked to climate changes and new consequent regulations.

5.3. Technical and Economic Domains

  • Storage systems are economically unattractive when trading only at DAM: the main benefits of adding storage systems to the HRPP—more stable energy output and less curtailed energy—to enhance the HRPP’s participation in DAM do not offset the current investment costs it requires, discouraging developers from investing in distributed storage systems under simulated actual conditions.

5.4. Technical, Economic, and Environmental Domains

  • Increased network and land-use efficiency: installing capacity over the (permitted) maximum limit while maintaining the technical injection power limits (of whichever technology) allows us, on the one hand, to optimize the use of existing grid infrastructure and, on the other, to contribute to deploying a representative share of PV capacity. At the same time, land use is optimized as there is a higher installed capacity per area unit, avoiding the need to commit additional land to electricity production purposes.
  • Spark collaborations between the solar and wind sector: although this work was conducted mainly from wind power plant owners/operators/investors’ point of view, the results show an opportunity for solar developers as well. In the context of hybridizing current wind parks, PV solar developers have an opportunity to join forces with wind promotors and bypass some of the legal requirements of installing new plants, such as environmental impact assessments and connection node auctions, since all the licensing and investments in grid infrastructure and substations are already in place.

6. Conclusions

In this work, a decision-aid algorithm was proposed and used to perform a comprehensive analysis of the hybrid power plant concept, focusing on the energetic contribution and economic feasibility of converting an existing wind plant into a hybrid power plant.
The results show that, although more capital intensive, hybrid power plants can be more economically efficient for power plant owners and developers, with the return on investments (represented by NPV) increasing by an average of 21%, when compared with investments in pure repowering and overplanting with wind technology only. From the point of view of their energetic contribution to power systems, the results demonstrate the added value of HRPPs. Converting existing wind plants into hybrid power plants could play a key role in accelerating the transition to the near-100% RES power systems that are aspired to for the future by providing an opportunity for yielding:
  • A higher installed capacity and average yearly capacity factor, increasing the contribution from RES in power systems.
  • The optimal use of grid and land, contributing to the economic and environmental sustainability of power systems.
Future works should include diversified revenue streams to incentivize investments in storage systems. Distributed storage systems are expected to be crucial in providing stability and flexibility for future power systems. Therefore, making investments in these systems viable from an economic point of view should be encouraged by legislators and regulators. HRPPs equipped with storage systems could provide, for instance, services such as voltage and frequency control, providing flexibility, and serving resilience needs for the system, while diversifying revenue streams for investors. Hybrid plants participating in ancillary service markets are already being tested in some areas of the world (e.g., Texas, USA), and are expected to be replicated widely in the near future.

Author Contributions

Term, A.R.S. and A.E.; conceptualization, A.R.S. and A.E.; methodology, A.R.S.; software, A.R.S.; formal analysis, A.R.S.; investigation, A.R.S.; resources, A.E.; data curation, A.R.S. and A.E.; validation, A.E.; writing—original draft, A.R.S.; writing—review & editing, A.R.S.; supervision, A.E.; visualization, A.R.S.; project administration, A.E.; funding acquisition, A.R.S. and A.E. All authors have read and agreed to the published version of the manuscript.

Funding

This research was funded by Fundação para a Ciência e Técnologia, grant number SFRH/BD/133419/2017. This work has also received funding from the EU Horizon 2020 research and innovation program under project TradeRES (grant agreement No. 864276).

Institutional Review Board Statement

Not applicable.

Informed Consent Statement

Not applicable.

Data Availability Statement

Not applicable.

Conflicts of Interest

The authors declare no conflict of interest.

Nomenclature

Acronyms η Round-trip efficiency of the energy storage system (%)
HRPPHybrid renewable power plants λ D A M ( t ) Hourly day-ahead electricity market prices (€/MWh)
WPPWind power plantInteger Variables
DAMDay-ahead market N Number of wind turbines to be installed (#)
PCCPoint of common coupling C P V Solar PV capacity to be installed (MW)
POIPoint of interconnection P B A T Power capacity of the storage system to be installed (MW)
NPVNet present value E B A T Energy capacity of the storage system to be installed (MWh)
MILPMixed-integer linear problemPositive Variables
GAGenetic algorithm P V R E ( y , t ) Hourly power produced by the HRPP (MW)
Sets E B A T ( y , t ) Hourly energy stored in the battery system (MWh)
y Set for years in the project’s lifetime P C H A ( y , t ) Hourly charging power in the battery system (MW)
t Set for hours in a year P D I S ( y , t ) Hourly discharging power in the battery system (MW)
Parameters P D A M ( y , t ) Hourly power delivered to the electricity grid (MW)
A P P Area available for wind and PV installation (km2) P C U R T ( y , t ) Hourly power curtailed (MW)
A W Land use for MW of wind technology installed (km2/MW) G ( y ) Yearly revenues (M€)
A P V Land use for MW of solar PV technology installed (km2/MW) O P E X T E C ( y ) Yearly operational costs per technology type (M€)
P P C C Licensed power at the point of common coupling (MW) C A P E X T E C Investment costs per technology type (M€)
r Discount rate (%) P W Original WPP wind power capacity (MW)
i ( y ) Inflation rate (%) I Total investment costs (M€)
p ( t ) W Normalized hourly annual production profile for the wind technology ( p ( t ) w [ 0 , 1 ] ) Binary Variables
p ( t ) P V Normalized hourly annual production profile for the solar PV technology ( p ( t ) P V [ 0 , 1 ] ) Y B A T ( y , t ) Binary variable linked to the storage system operation. It assumes the value 1 when the battery is in discharge mode and 0 otherwise.
ξ ( y ) W Random parameter modeling the interannual variability of wind power production Real Variables
ξ ( y ) P V Random parameter modeling the interannual variability of solar PV power production NPVNet present value of the project (M€)

References

  1. European Union. A European Green Deal: Striving to Be the First Climate-Neutral Continent. 2019. Available online: https://ec.europa.eu/info/strategy/priorities-2019-2024/european-green-deal_en (accessed on 3 September 2020).
  2. de Doile, G.N.D.; Junior, P.R.; Rocha, L.C.S.; Bolis, I.; Janda, K.; Junior, L.M.C. Hybrid wind and solar photovoltaic generation with energy storage systems: A systematic literature review and contributions to technical and economic regulations. Energies 2021, 14, 6521. [Google Scholar] [CrossRef]
  3. Lian, J.; Zhang, Y.; Ma, C.; Yang, Y.; Chaima, E. A review on recent sizing methodologies of hybrid renewable energy systems. Energy Convers. Manag. 2019, 199, 112027. [Google Scholar] [CrossRef]
  4. Hansen, A.D.; Das, K.; Sørensen, P.; Singh, P.; Gavrilovic, A. European and Indian Grid Codes for Utility Scale Hybrid Power Plants. Energies 2021, 14, 4335. [Google Scholar] [CrossRef]
  5. DL-76/2019; Diário da República, 1.a Série—N.o 106—3 de Junho de 2019. D. Repub. 2019, pp. 2792–2865. Available online: https://dre.pt/dre/detalhe/decreto-lei/76-2019-122476954 (accessed on 3 June 2019).
  6. Han, S.; Zhang, L.; Liu, Y.; Zhang, H.; Yan, J.; Li, L.; Lei, X.; Wang, X. Quantitative evaluation method for the complementarity of wind-solar-hydro power and optimization of wind-solar ratio. Appl. Energy 2019, 236, 973–984. [Google Scholar] [CrossRef]
  7. Pérez Odeh, R.; Watts, D.; Negrete-Pincetic, M. Portfolio applications in electricity markets review: Private investor and manager perspective trends. Renew. Sustain. Energy Rev. 2018, 81, 192–204. [Google Scholar] [CrossRef]
  8. Dykes, K.; King, J.; Diorio, N.; King, R.; Gevorgian, V.; Corbus, D.; Blair, N.; Anderson, K.; Stark, G.; Turchi, C.; et al. Opportunities for Research and Development of Hybrid Power Plants. 2020. Available online: https://www.nrel.gov/docs/fy20osti/75026.pdf (accessed on 29 September 2021).
  9. Couto, A.; Estanqueiro, A. Exploring Wind and Solar PV Generation Complementarity to Meet Electricity Demand. Energies 2020, 13, 4132. [Google Scholar] [CrossRef]
  10. Schindler, D.; Dieter, H.; Jung, C. On the spatiotemporal variability and potential of complementarity of wind and solar resources. Energy Convers. Manag. 2020, 218, 113016. [Google Scholar] [CrossRef]
  11. Ren, G.; Wan, J.; Liu, J.; Yu, D. Spatial and temporal assessments of complementarity for renewable energy resources in China. Energy 2019, 177, 262–275. [Google Scholar] [CrossRef]
  12. Couto, A.; Estanqueiro, A. Assessment of wind and solar PV local complementarity for the hybridization of the wind power plants installed in Portugal. J. Clean. Prod. 2021, 319, 128728. [Google Scholar] [CrossRef]
  13. Blechinger, P.; Cader, C.; Bertheau, P.; Huyskens, H.; Seguin, R.; Breyer, C. Global analysis of the techno-economic potential of renewable energy hybrid systems on small islands. Energy Policy 2016, 98, 674–687. [Google Scholar] [CrossRef]
  14. Grau, L.; Jung, C.; Schindler, D. Sounding out the repowering potential of wind energy—A scenario-based assessment from Germany. J. Clean. Prod. 2021, 293, 126094. [Google Scholar] [CrossRef]
  15. de Bona, J.C.; Ferreira, J.C.E.; Ordoñez Duran, J.F. Analysis of scenarios for repowering wind farms in Brazil. Renew. Sustain. Energy Rev. 2021, 135, 110197. [Google Scholar] [CrossRef]
  16. Wang, S.; Jia, R.; Shi, X.; Luo, C.; An, Y.; Huang, Q.; Guo, P.; Wang, X.; Lei, X. Research on Capacity Allocation Optimization of Commercial Virtual Power Plant (CVPP). Energies 2022, 15, 1303. [Google Scholar] [CrossRef]
  17. Akter, H.; Howlader, H.O.R.; Nakadomari, A.; Islam, M.R.; Saber, A.Y.; Senjyu, T. A Short Assessment of Renewable Energy for Optimal Sizing of 100% Renewable Energy Based Microgrids in Remote Islands of Developing Countries: A Case Study in Bangladesh. Energies 2022, 15, 1084. [Google Scholar] [CrossRef]
  18. Hatata, A.Y.; Osman, G.; Aladl, M.M. An optimization method for sizing a solar / wind / battery hybrid power system based on the arti fi cial immune system. Sustain. Energy Technol. Assess. 2018, 27, 83–93. [Google Scholar] [CrossRef]
  19. Ma, T.; Javed, M.S. Integrated sizing of hybrid PV-wind-battery system for remote island considering the saturation of each renewable energy resource. Energy Convers. Manag. 2019, 182, 178–190. [Google Scholar] [CrossRef]
  20. Ramli, M.A.M.; Bouchekara, H.R.E.H.; Alghamdi, A.S. Optimal sizing of PV/wind/diesel hybrid microgrid system using multi-objective self-adaptive differential evolution algorithm. Renew. Energy 2018, 121, 400–411. [Google Scholar] [CrossRef]
  21. Cai, W.; Li, X.; Maleki, A.; Pourfayaz, F.; Rosen, M.A.; Alhuyi, M.; Tien, D. Optimal sizing and location based on economic parameters for an off-grid application of a hybrid system with photovoltaic, battery and diesel technology. Energy 2020, 201, 117480. [Google Scholar] [CrossRef]
  22. Duchaud, J.L.; Notton, G.; Fouilloy, A.; Voyant, C. Wind, solar and battery micro-grid optimal sizing in Tilos Island. Energy Procedia 2019, 159, 22–27. [Google Scholar] [CrossRef]
  23. Zhang, W.; Maleki, A.; Rosen, M.A.; Liu, J. Sizing a stand-alone solar-wind-hydrogen energy system using weather forecasting and a hybrid search optimization algorithm. Energy Convers. Manag. 2019, 180, 609–621. [Google Scholar] [CrossRef]
  24. Chiacchio, F.; Famoso, F.; Cedola, L. Performance and Economic Assessment of a Grid-Connected Photovoltaic Power Plant with a Storage System: A Comparison between the North and the South of Italy. Energies 2019, 12, 2356. [Google Scholar] [CrossRef] [Green Version]
  25. Bakhtvar, M.; Al-Hinai, A. Robust operation of hybrid solar–wind power plant with battery energy storage system. Energies 2021, 14, 3781. [Google Scholar] [CrossRef]
  26. Małkowski, R.; Jaskólski, M.; Pawlicki, W. Operation of the hybrid photovoltaic-battery system on the electricity market-simulation, real-time tests and cost analysis. Energies 2020, 16, 1402. [Google Scholar] [CrossRef] [Green Version]
  27. Nasrolahpour, E.; Zareipour, H.; Rosehart, W.D.; Electric, A.; Operator, S. Battery investment by a strategic wind producer: A scenario-based decomposition approach. Electr. Power Syst. Res. 2020, 182, 106255. [Google Scholar] [CrossRef]
  28. Wang, G.; Ciobotaru, M.; Agelidis, V.G. Optimal capacity design for hybrid energy storage system supporting dispatch of large-scale photovoltaic power plant. J. Energy Storage 2015, 3, 25–35. [Google Scholar] [CrossRef]
  29. Yang, B.; Guo, Y.; Xiao, X.; Tian, P. Bi-level Capacity Planning of Wind-PV-Battery Hybrid Generation System Considering Return on Investment. Energies 2020, 13, 3046. [Google Scholar] [CrossRef]
  30. Carvalho, D.B.; Guardia, E.C.; Lima, J.W.M. Technical-economic analysis of the insertion of PV power into a wind-solar hybrid system. Sol. Energy 2019, 191, 530–539. [Google Scholar] [CrossRef]
  31. Al-Shereiqi, A.; Al-Hinai, A.; Albadi, M.; Al-Abri, R. Optimal sizing of a hybrid wind-photovoltaic-battery plant to mitigate output fluctuations in a grid-connected system. Energies 2020, 13, 3015. [Google Scholar] [CrossRef]
  32. Al-Shereiqi, A.; Al-Hinai, A.; Albadi, M.; Al-Abri, R. Optimal sizing of hybrid wind-solar power systems to suppress output fluctuation. Energies 2021, 14, 5377. [Google Scholar] [CrossRef]
  33. Nuvvula, R.S.S.; Elangovan, D.; Teegala, K.S.; Madurai Elavarasan, R.; Islam, M.R.; Inapakurthi, R. Optimal Sizing of Battery-Integrated Hybrid Renewable Energy Plant Load Factors of Various Sectors. Energies 2021, 14, 5368. [Google Scholar] [CrossRef]
  34. Sohani, A.; Dehnavi, A.; Sayyaadi, H.; Hoseinzadeh, S.; Goodarzi, E.; Garcia, D.A.; Groppi, D. The real-time dynamic multi-objective optimization of a building integrated photovoltaic thermal (BIPV/T) system enhanced by phase change materials. J. Energy Storage 2022, 46, 103777. [Google Scholar] [CrossRef]
  35. Durante, F.; Gianfreda, A.; Ravazzolo, F.; Rossini, L. A multivariate dependence analysis for electricity prices, demand and renewable energy sources. Inf. Sci. 2022, 590, 74–89. [Google Scholar] [CrossRef]
  36. Correa-Quezada, R.; del Tituaña-Castillo, M.d.C.; Río-Rama, M.d.l.C.; Álvarez-García, J. Effects of Increased Renewable Energy Consumption on Electricity Prices: Evidence for Six South American Countries. Energies 2022, 15, 620. [Google Scholar] [CrossRef]
  37. Oosthuizen, A.M.; Inglesi-Lotz, R.; Thopil, G.A. The relationship between renewable energy and retail electricity prices: Panel evidence from OECD countries. Energy 2022, 238, 1790. [Google Scholar] [CrossRef]
  38. Gomes, I.L.R.; Pousinho, H.M.I.; Melício, R.; Mendes, V.M.F. Stochastic coordination of joint wind and photovoltaic systems with energy storage in day-ahead market. Energy 2017, 124, 310–320. [Google Scholar] [CrossRef]
  39. Ciez, R.E.; Whitacre, J.F. Comparative techno-economic analysis of hybrid micro-grid systems utilizing different battery types. Energy Convers. Manag. 2016, 112, 435–444. [Google Scholar] [CrossRef] [Green Version]
  40. Talent, O.; Du, H. Optimal sizing and energy scheduling of photovoltaic-battery systems under different tariff structures. Renew. Energy 2018, 129, 513–526. [Google Scholar] [CrossRef]
  41. Grossmann, I.E. Minlp Optimization Strategies and Algorithms for Process Synthesis. Found. Comput. Process Des. 1990, 105–132. Available online: https://citeseerx.ist.psu.edu/viewdoc/download?doi=10.1.1.927.7660&rep=rep1&type=pdf (accessed on 20 May 2020).
  42. Li, B.; Roche, R.; Miraoui, A. Microgrid sizing with combined evolutionary algorithm and MILP unit commitment. Appl. Energy 2017, 188, 547–562. [Google Scholar] [CrossRef] [Green Version]
  43. Fossati, J.P.; Galarza, A.; Martín-Villate, A.; Fontán, L. A method for optimal sizing energy storage systems for microgrids. Renew. Energy 2015, 77, 539–549. [Google Scholar] [CrossRef]
  44. Gan, L.K.; Shek, J.K.H.; Mueller, M.A. Optimised operation of an off-grid hybrid wind-diesel-battery system using genetic algorithm. Energy Convers. Manag. 2016, 126, 446–462. [Google Scholar] [CrossRef] [Green Version]
  45. Lip, W.; Shiun, J.; Ra, S.; Alwi, W.; Erniza, N.; Rozali, M.; Shin, W.; Abdul-manan, Z. An MILP model for cost-optimal planning of an on-grid hybrid power system for an eco-industrial park. Energy 2016, 116, 1423–1441. [Google Scholar] [CrossRef]
  46. Lamedica, R.; Santini, E.; Ruvio, A.; Palagi, L.; Rossetta, I. A MILP methodology to optimize sizing of PV-Wind renewable energy systems. Energy 2018, 165, 385–398. [Google Scholar] [CrossRef] [Green Version]
  47. Mazzeo, D.; Matera, N.; De Luca, P.; Baglivo, C.; Congedo, M.; Oliveti, G. A literature review and statistical analysis of photovoltaic-wind hybrid renewable system research by considering the most relevant 550 articles: An upgradable matrix literature database. J. Clean. Prod. 2021, 295, 126070. [Google Scholar] [CrossRef]
  48. Couto, A.; Wind Power Production Timeseries. LNEG Internal Communication. 2019. Available online: https://www.researchgate.net/figure/Wind-power-time-series-all-hourly-wind-energy-production-time-series-have-been_fig3_226527334 (accessed on 22 January 2022).
  49. European Commission Joint Research Centre. Photovoltaic Geographical Information Systems. 2019. Available online: https://re.jrc.ec.europa.eu/pvg_tools/en/tools.html (accessed on 3 August 2019).
  50. OMIE. Market Results. 2020. Available online: http://www.omie.es/en/inicio (accessed on 20 October 2020).
  51. NREL. Land Use by System Technology. 2016. Available online: https://www.nrel.gov/analysis/tech-size.html (accessed on 5 July 2019).
  52. DGEG. Direção Geral de Energia e Geologia. Available online: http://www.dgeg.gov.pt/ (accessed on 19 February 2020).
  53. European Association for Storage of Energy. Electrochemical Energy Storage: Flow Battery. pp. 1–2. Available online: www.ease-storage.eu (accessed on 20 July 2019).
Figure 1. Decision process considered for a wind power plant (WPP) at the end of its lifetime.
Energies 15 02560 g001
Figure 2. Single line representation of an HRPP (adapted from [38]).
Energies 15 02560 g002
Figure 3. Schematic representation of the OPT.Hy tool.
Energies 15 02560 g003
Figure 4. Flowchart of the proposed solver method. The dashes indicate the MILP part and the lines represent the GA part.
Energies 15 02560 g004
Figure 5. Daily (top) and annual (bottom) average capacity factor for the wind and PV technology in the selected case studies.
Energies 15 02560 g005
Figure 6. Percentiles 10 to 90 of the daily power injection profile for the wind and hybrid scenarios in the case studies analyzed.
Energies 15 02560 g006
Figure 7. Daily production per technology for the typical average generation day profile of each technology. The representative days are different for each scenario.
Energies 15 02560 g007
Figure 8. Curtailed energy duration curve for all case studies in the Opt3 (hybrid) scenario.
Energies 15 02560 g008
Table 1. Main characteristics of the selected case studies.
Case StudyCapacity FactorCorrelations
Wind–SolarWind–DAMHybrid–DAM
DayYearDayYearDayYear
CS1Low−0.04−0.91−0.57−0.250.24−0.42
CS2Average−0.86−0.61−0.08−0.260.38−0.48
CS3High−0.820.700.08−0.570.43−0.52
Table 2. Technical and economic data used in the study.
ParameterValueUnit
SymbolDescription
A P P Area available for wind and PV installation2.5km2
ξ ( y ) W Interannual variability of wind power production 1 ± 0.05 -
ξ ( y ) P V Interannual variability of solar PV power production 1 ± 0.06 -
P P C C Licensed power at the point of common coupling20MW
r Discount rate7%
i ( y ) Inflation rate:
Year 1 (REF)1%
Year 21.2%
Year 30.8%
Year 41.2%
Year ≥ Year 5—Lifetime1.3%
Table 3. Summary of the inputs regarding the technology costs and performance used in the study.
TechnologyCAPEXOPEXLand UseRound-Trip
Efficiency
LifetimeREF
[M€/MW][%CAPEX/Year][km2/MW][%][Years]
Wind:1.003.000.050-25[51,52]
PV:0.701.700.025-25
Battery: 0.7515[53]
Energy0.251.25-
Power0.900.03-
Table 4. Results of the optimal design for the hybrid renewable power plant (HRPP) for the three case studies.
Energetic IndicatorsEconomic Indicators
Additional CapacityEnergy MarketLoad
Factor
Curtailed
Energy
Investment
Cost
Market
Revenue
Marginal ValueIRRNPV
MWMWhGWh/Year%GWh/YearM€M€/Year€/MWh%M€
WPVPBATEBAT
CS1Opt1----49.428.1010.02.28146.162015.6
Opt20---
Opt30250080.645.94.70727.54.22352.421423.7
CS2Opt1----57.932.9010.02.85849.352522.2
Opt22---61.835.22.08912.03.05249.382322.3
Opt30230088.450.35.01926.14.75153.731627.4
CS3Opt1----58.133.1010.02.90449.972622.8
Opt24---66.738.03.29814.03.31749.762123.3
Opt30240090.951.88.12126.84.95354.441729.0
Publisher’s Note: MDPI stays neutral with regard to jurisdictional claims in published maps and institutional affiliations.

